Embed Size (px)
Citation preview

Heriot-Watt University Research Gateway
Heriot-Watt University
The value of integrating Scan-to-BIM and Scan-vs-BIM techniques for construction monitoringusing laser scanning and BIM: The case of cylindrical MEP componentsBosché, Frédéric Nicolas; Ahmed, Mahmoud; Turkan, Yelda; Haas, Carl; Haas, Ralph
Published in:Automation in Construction
DOI:10.1016/j.autcon.2014.05.014
Publication date:2015
Document VersionPeer reviewed version
Link to publication in Heriot-Watt University Research Portal
Citation for published version (APA):Bosché, F., Ahmed, M., Turkan, Y., Haas, C., & Haas, R. (2015). The value of integrating Scan-to-BIM andScan-vs-BIM techniques for construction monitoring using laser scanning and BIM: The case of cylindrical MEPcomponents. Automation in Construction, 49(Part B), 201-213. DOI: 10.1016/j.autcon.2014.05.014
General rightsCopyright and moral rights for the publications made accessible in the public portal are retained by the authors and/or other copyright ownersand it is a condition of accessing publications that users recognise and abide by the legal requirements associated with these rights.
If you believe that this document breaches copyright please contact us providing details, and we will remove access to the work immediatelyand investigate your claim.

Download date: 01. Jun. 2018

1
The value of integrating Scan-to-BIM and Scan-1
vs-BIM techniques for construction monitoring 2
using laser scanning and BIM: 3
The case of cylindrical MEP components 4
5
Frédéric Boschéa,*, Mahmoud Ahmedb, Yelda Turkanc, Carl T. Haasb, Ralph Haasb 6
aSchool of the Built Environment, Heriot-Watt University, Edinburgh, Scotland 7
bDepartment of Civil Engineering, University of Waterloo, Ontario, N2L 3G1, Canada 8
cCivil, Construction and Environmental Engineering, Iowa State University, Ames, IA 50010, USA 9
Abstract 10
There is a growing need for tools automating the processing of as-built 3D laser scanned data, and more 11
particularly the comparison of this as-built data with planned works. This paper particularly considers 12
the case of tracking MEP components with circular cross-sections, which essentially include pipes, and 13
some conduits and ducts. Discrepancies between the as-built and as-planned status of pipes, conduit 14
and ductwork result from changes that occur in the field and that are either unnoticed (human error) or 15
not reflected in the 3D model. Previous research has shown that the Hough transform, with judiciously 16
applied domain constraints, is a practical and cost-effective approach to find, recognize and reconstruct 17
cylindrical MEP works within point clouds automatically. Previous research has also shown that “Scan-18
vs-BIM” systems that are based on the geometric alignment and comparison of as-built laser scans with 19
as-designed BIM models can effectively recognize and identify MEP components as long as they are 20

2
constructed near their as-planned locations. The research presented in this paper combines the two 21
techniques in a unified approach for more robust automated comparison of as-built and as-planned 22
cylindrical MEP works, thereby providing the basis for automated earned value tracking, automated 23
percent-built-as-planned measures, and assistance for the delivery of as-built BIM models from as-24
designed ones. The proposed approach and its improved performance are validated using data acquired 25
from an actual construction site. The results are very encouraging and demonstrate the added value of 26
the proposed integrated approach over the rather simpler Scan-vs-BIM system. The two main areas of 27
improved performance are: (1) the enabled recognition and identification of objects that are not built at 28
their as-planned locations; and (2) the consideration for pipe completeness in the pipe recognition and 29
identification metric. 30
Keywords: MEP; 3D laser scanning; BIM; Scan-vs-BIM; Scan-to-BIM; Hough transform; progress tracking, 31
percent built as planned. 32
* Corresponding author. Tel.: +44 131 451 4659; E-mail addresses: [email protected] (F. Bosche) 33
[email protected] (M. Ahmed), [email protected] (Y. Turkan), [email protected] (C.T. Haas), 34
[email protected] (R. Haas). 35

3
1 Introduction 36
Traditional progress tracking practice depends on visual inspections, and daily or weekly reports created 37
based on those inspections. The inspectors’ duty is to ensure that work meets contract specifications 38
and schedule. They use checklists during inspections and logs to report deficiencies that are discussed at 39
follow-up weekly meetings [1]. This traditional practice relies heavily on the inspectors’ personal 40
judgment, observational skills, and experience which come with a high probability of incomplete and 41
inaccurate reports. In the early 2000’s, the Architectural-Engineering-Construction/Facility Management 42
(AEC/FM) industry realized the urgent need for fast and accurate project progress tracking. 43
In response to this need, researchers have studied several emerging technologies for automating project 44
inspection. These include Radio Frequency Identification (RFID) [2][3][4][5][6][7], Ultra-Wide Band 45
(UWB) [8][9][10][11], Global Navigation Satellite System (GNSS) [6][12], 2D imaging 46
[13][14][15][16][17][18][19], Photogrammetry [20][21][22][23][24][25][29], and three-dimensional (3D) 47
Terrestrial Laser Scanning (TLS) [22][26-54]. All these approaches hold much promise for automated 48
progress tracking, however they have so far only focused on a few areas of application: progress in the 49
supply chain (prefabrication and laydown yards), workers’ productivity (through location and action 50
tracking), and tracking structural work progress and quality. One of the important areas where tracking 51
could provide significant value is the tracking of Mechanical, Electrical and Plumbing (MEP) components, 52
which includes piping installation. The benefits of efficient tracking of MEP components’ installation 53
include: 54
1) Early identification of deviations between the as-built and as-design situations, so that required 55
remedial actions can be taken before high rework costs are experienced; 56

4
2) Faster acceptance of work by the main contractor, so that sub-contractors can be paid on time 57
and even earlier than is common practice; and 58
3) Assistance through automation of some of the steps involved in updating Building Information 59
Modeling (BIM) models to reflect as-built works that deviate or add to original BIM models, but 60
will not require rework. Indeed, in many cases liquidated damages and an updated as-built BIM 61
model may be preferable to rework. 62
However, tracking of MEP works is made difficult by significant discrepancies between the as-built and 63
as-planned status of MEP components that result from changes that occur in the field that are either 64
unnoticed (human error) or not reflected in the design documents. These unreported discrepancies also 65
challenge the delivery of reliable as-built design documents (e.g. as-built BIM model) to clients. 66
Among the technologies discussed earlier, 3D TLS has been considered by many as the best available 67
technology to capture 3D information on a project with high accuracy and speed. It holds much promise 68
in a variety of applications in the AEC/FM industry [26][27][28][29][30]. For example, it has already been 69
proven to be valuable for construction managers to help them track progress, control quality, monitor 70
health, as well as create as-built 3D models of facilities [31-54]. The best demonstration of this value has 71
been the exponential growth of the laser scanning hardware and software market in the last decade. 72
Much of this growth is now focusing on the interface between laser scanned data and BIM models. 73
Nonetheless, the recognition (and identification) of objects in 3D TLS data remains an open challenge 74
with marketed software offering only semi-automated, and often limited solutions. This is the case of 75
MEP components, including pipes. Robust automated recognition and tracking of cylindrical MEP 76
components would enable: 77

5
1. Improved identifications of discrepancies between as-planned and as-built conditions of MEP 78
components, so that corrective actions can be taken in a timely manner. This is particularly 79
important for mechanical contractors, since an increasing number of them are using BIM 80
models for fabricating pipes and ductwork. 81
2. Having accurate as-built conditions of MEP components, so that mechanical remodelings can be 82
planned confidently from the BIM model, and thus help prevent material wastes and rework, 83
hereby saving cost and time. Furthermore, there is a growing interest and demand from 84
industry for implementing BIM models for Facilities Management. Having accurate as-built 85
conditions of MEP components included in BIM models would allow facility managers to 86
integrate their building operation and maintenance schedules with BIM models, which would 87
allow them to locate and maintain these components efficiently. 88
Recent research in the recognition of MEP works in 3D TLS data has shown that the Hough transform, 89
with judiciously applied domain constraints, is a practical approach to automatically find, recognize and 90
reconstruct cylindrical objects (e.g. pipes) from point clouds [48][49]. However, this approach is not 91
sufficient on its own to identify objects to support reliable progress tracking and quality control. In 92
parallel, previous research has also shown that “Scan-vs-BIM” systems, that are based on the geometric 93
alignment and comparison of as-built laser scans with as-designed BIM models, can effectively recognize 94
and identify in point clouds 3D objects contained in the BIM models [31][32][33] – as long as they are 95
constructed near their as-planned locations. The research reported here combines these two 96
approaches in a single framework to better meet the need for automated comparison of built and 97
planned cylindrical MEP components, hereby providing the basis for automated earned value tracking, 98
automated discrepancy identification and calculation of “percent built as-planned”, and assistance for 99
the generation as-built BIM models. 100
6
This paper is organized as follows. Section 2 first reviews significant research and developments in the 101
area of object recognition in 3D point clouds. Our novel approach for the recognition and identification 102
of cylindrical objects in 3D point clouds is described in Section 3. Experimental results are reported in 103
Section 4 and the performance of the new approach discussed in Section 5. 104
2 Background 105
2.1 3D point cloud data processing 106
Using 3D point clouds produced by laser scanners for generating as-built information is becoming a 107
standard practice in construction, rehabilitation and facilities maintenance in areas ranging from process 108
plants to historical preservation. Building on basic research in robotics and machine vision, research on 109
automated as-built generation goes back over twenty years (e.g. [13]). 110
Acquisition of 3D information with laser-scanning (but also structured lighting and photogrammetry) has 111
led to significant research on developing processes and algorithms for processing the 3D point cloud 112
data, with focus on different applications. These include: as-built modelling [29][34][36] 113
[40][41][42][43][44] [48][49][50][51], quality assessment of existing infrastructure and construction sites 114
[25][35][37][45][54], progress tracking [20][21][22][23][24] [31][32][33][46][47][52][53], and structural 115
health monitoring [38] [39]. Some of the knowledge thereby created has influenced or been adopted by 116
practitioners. Yet, in the commercial sphere, the level of automation of current software solutions for 117
processing TLS data, and in particular for recognizing objects in TLS data, remains limited. 118
With the advent of 3D BIM, many of the newer approaches actively use the (3D) information contained 119
in BIM models to develop supervised object detection and recognition algorithms that more effectively 120

7
process the point cloud data [20][21][31][32][27][33][35][46][47] [52][53][54]. Reliance of these 121
approaches on prior BIM information certainly imposes limitations; but BIM is very rapidly being 122
adopted across the industry for building design, construction and asset management, so that these 123
limitations will diminish over time. 124
Focusing specifically on cylindrical MEP components, despite some significant effort in the processing of 125
point clouds generated by TLS [48][49][50] or low-cost photogrammetry [23][24], progress remains 126
limited. In particular, the automatic detection of occlusions of pipes (so that a pipe is not recognized as 127
two different ones) remains an issue that needs to be investigated. Additionally, the automatic 128
recognition of elbows and T-connections between pipe segments (so that pipes are recognized as a 129
continuous pipe spools or networks as opposed to a set of disconnected pipe segments) needs further 130
investigation. Effective detection of occlusions and connecting components would significantly improve 131
the speed of generating accurate pipe network models. 132
Before getting into more details with specific techniques, it is worth pointing that the terms “detection”, 133
“recognition” and “identification” are commonly used, but their use is not always consistent across the 134
literature. In this manuscript, we use them as follows: 135
Detection: an object is present. More specifically here, this means that some specific features 136
are found in the data (e.g. circular cross-sections). 137
Recognition: the type of object can be discerned. More specifically here, this means that the 138
analysis of the features enables discerning objects of a specific type (e.g. pipes with circular 139
cross-sections). 140

8
Identification: a specific object can be discerned. More specifically here, this means that each 141
recognized object can be matched to a specific object in a known list (e.g. a recognized pipe is 142
discerned as being a certain pipe present in the project BIM model). 143
144
Surface feature detection, and in particular smooth curved surface detection, are topics of fundamental 145
importance to 3D point cloud processing and have been widely studied. For detecting specified simple 146
parametric surfaces, such as planes, cylinders, spheres and tori in point clouds, transform approaches 147
have been considered, in particular the Hough Transform [55][56][57] that is used here (See Section 2.2 148
for details). Other types of transforms have been investigated for object shape detection, such as the 149
Radon transform. For example, van Ginkel et al. [58] investigated the generalised Radon transform to 150
detect curves. However, the Radon transform has several drawbacks that make it unsuitable for the 151
investigated point clouds. Its brute-force approach demands extensive computational resources; and its 152
restriction to line drawings or sketch-like formats mandate an additional edge detection step. Van 153
Ginkel et al. [59] studied the Hough transform, the Radon transform, and the mathematical relationship 154
between them. 155
Alternatively, curved surfaces can also be searched for directly in noisy point clouds, without employing 156
any transform. Such approaches have been widely studied and typically consist in first capturing local 157
surface curvature at each point using neighboring points, and then segmenting the point cloud using 158
some region growing and clustering methods [60][61][62][63][64][65][66][67][68]. For example, Besl 159
and Jain [60] proposed an approach that estimates local curvature using the mean and Gaussian 160
curvature and then applies a region growing algorithm employing the fitting of quadratic surfaces. 161
Methods proposed by Hoppe et al. [61] and Shaffer et al. [62] estimate local surface properties by 162

9
analyzing the eigenvalues and eigenvectors of the covariance matrix of point neighbourhood clusters. 163
Pauly et al. [65] presented a multi-scale technique that works across multiple resolutions of the point 164
cloud to extract the line features of 3D object surfaces. Rabbani et al. [66] presented a curved surface 165
region growing method based on surface normal and local smoothness constraints. Klasing et al. [68] 166
presented a review and experimental comparison of surface normal estimation methods. The challenges 167
in surface growing (curved or planar) are over-segmentation (which is typically addressed through a 168
post-processing step) and noise handling. The latter is a key issue which has been addressed by many 169
researchers including Carr et al. [69] in a fundamental sense and Xiong et al. [70] as applied to building 170
construction. Future research is desirable to compare the use of the Hough transform as described in 171
this paper with curvature based surface growing approaches. However, this is outside the scope of the 172
research reported here. 173
In the following two sections, we focus on the Hough transform for the detection of simple parametric 174
surfaces, in particular cylindrical surfaces. Then, the employed Scan-vs-BIM technique for object 175
recognition is reviewed. 176
2.2 Hough Transform 177
The Hough transform is a technique that can be utilized to detect parametric features within noisy data. 178
It is usually carried out in three steps. The first step is concerned with creating and quantizing a 179
parameter space, which is followed by the application of a voting rule in that parameter space [55][56]. 180
The shape parameters within the accumulated array of votes are extracted during the final step. The 181
technique was first introduced to detect straight lines using a parametric representation of the line in an 182
image. In this case, the Hough transform requires two parameters: the slope and intercept [55], or the 183
length and orientation of the normal vector to the line from the image origin [56]. Modified versions of 184

10
the technique were developed by Duda and Hart [56] for extracting 2D curved shapes and by Cheng and 185
Liu [57] for extracting ellipses. A comprehensive review of basic and probabilistic Hough based methods 186
can be found in [71]. 187
In construction engineering, Haas [13] implemented a 2D Hough transform for underground pipe 188
detection. Vosselman et al. [51] investigated using a 3D Hough transform to extract planar surfaces from 189
point-clouds. Newman et al. [72] proposed a method that combines the Hough transform and a 190
regression procedure to recognize 3D shapes such as cylinders, spheres and cones. Rabbani et al. [44] 191
have investigated a 5D Hough transform approach to extract cylindrical objects from point clouds. While 192
that work was seminal research, its application was severely limited by the computational complexity 193
resulting from the dimensionality of the Hough space. In general, high-dimensional Hough spaces are 194
not practical. Working in Hough-space with more than two dimensions requires simplifications through 195
judicious use of domain constraints, as described by Rabbani et al. themselves. 196
To address the memory and computational complexity constraints of the Hough transform, Borrmann et 197
al. [73] proposed the Hough space accumulator structure, while Pietrowcew [74] presented a Fuzzy 198
Hough methodology that adjusts the votes in the parameter space to extract special shapes. 199
Ahmed et al. [48][49] demonstrate the application of judicious use of domain constraints to efficiently 200
detect circular-cross-sections in orthogonal directions (XYZ) of 3D TLS data, and consequently recognize 201
objects with cylindrical shapes. In their approach, it is assumed that most cylindrical MEP components 202
are built in orthogonal directions along the main axes of a facility. Circular cross-sections should then be 203
identifiable in 3D point cloud data slices taken along those three directions. The recognition of 204
cylindrical pipes could then be inferred from the set of circular cross-sections detected in slices along 205
each of the directions. In summary, the technique implements the following steps: 206

11
1) Resample the original point-cloud to a number of thin slices. Slices are defined at a pre-207
determined interval along the X, Y and Z directions (e.g. 10cm); 208
2) For each slice, apply the Hough transform to find circles of expected diameters; 209
3) Connect centers of collinear detected circles (using rules described in Ahmed et al. [48][49]), 210
then fit straight lines through the circles’ centers, 211
4) Filter out the systematic errors due to slicing tilt, 212
5) Reconstruct the 3D pipes using the computed centerlines and their respective radii, 213
Applications of the Hough transform to laser scanned data have focused on detection of simple 214
geometric features (e.g. straight lines, circular sections) and subsequent recognition of objects having 215
those features; but these steps alone do not enable the identification of those objects – which is 216
necessary for robust progress tracking. For example, the Hough transform can be used to detect all 217
pipes with a pre-defined radius within a scanned point cloud, but it is just a first step in their 218
identification, i.e. the mapping between the detected pipes and those defined in the designed 3D BIM 219
model of the facility. Further steps are required for recognition and identification, including: (1) 220
registration of sets of detected cylindrical objects and sets of cylindrical objects from the BIM model, (2) 221
application of reasoning based on cylindrical object characteristics such as diameter, direction and 222
proximity, (3) application of reasoning based on object connectivity, and (4) recognition and 223
identification decision making based on these preceding steps. 224
2.3 Scan-vs-BIM Method 225
In the case that an as-designed BIM model of the works to be tracked is available, the prior information 226
contained in the model can be leveraged to not only detect and recognize the objects contained in the 227
model, but also identify them [31][32][33]. Bosché and Haas [31][32] proposed such an approach and 228

12
refer to it as “Scan-vs-BIM” [53]. In the Scan-vs-BIM approach, 3D laser scanned point clouds are first 229
aligned in the coordinate system of the 3D model. This can be done using site benchmarks or using 230
automated or semi-automated registration techniques [75][76]. Once the registration is completed for 231
all available scans, objects contained in the as-designed BIM model are recognized and identified in the 232
combined point cloud using the following four-step process: 233
1 – Matching/Recognized Point Clouds: For each scan, each point is matched with a 3D model 234
object. Matching is done by projecting the point orthogonally on the surfaces of all NObj objects of the 3D 235
BIM model. Then, the object with (1) the closest surface to the point, but with distance not larger than a 236
threshold δmax (we use δmax=50mm), and (2) a surface normal vector not further than αmax (we use 237
αmax=45°) from that at the as-built TLS point is considered matching object. This process effectively 238
segments each initial scan into NObj+1 point clouds; one per object that includes all the points matched 239
to that object and another one containing all the points not matched to any model object. We call the 240
latter the “NonModel” point cloud. 241
2 - Occluding Point Clouds (i.e. point clouds acquired from objects that do not seem to 242
correspond to any object in the BIM model but that are occluding objects that are contained in the BIM 243
model): For each as-built scan, the NonModel point cloud is further processed to identify the NonModel 244
points that lay between the scanner and 3D model objects. The result of this process is not just an 245
overall Occlusion point cloud, but also its segmentation into NObj point clouds; one per object that 246
includes all the points occluding that object. 247
3 - As-planned Point Clouds: For each scan, a corresponding virtual as-planned scan is calculated. 248
This is done using the 3D model and the same scanner’s location and scan resolution as those of the 249
actual (as-built) scan obtained from the registration process. Each as-planned point is calculated by 250

13
projecting a ray from the scanner onto the 3D model. The result of this process is not just an as-planned 251
scan, but also its segmentation into NObj point clouds; one per object that includes all the points 252
matched to that object. Note that we do not retain any NonModel as-planned point cloud. 253
4 - Object Recognition: The results of the first three steps are finally aggregated. Each model 254
object then has: 255
A matched/recognized surface area, Srecognized (derived from the points contained in the 256
matching Point Cloud). 257
An occlusion surface area, Soccluded. 258
An as-planned surface area, Splanned. 259
These surface areas allow the calculation of two metrics used for inferring the recognition of the 260
object: 261
- 262
- 263
where ∑ (( |
|) )
264
estimates the level of recognition by calculating the percentage of surface expected to be 265
recognized that is actually recognized. is a weighted recognized surface where the 266
contribution of each point to the recognized surface (i.e. the surface it covers, ) is weighted based on 267
the quality of its matching (i.e. the distance from the as-built point to the matching surface). 268

14
thus extends by taking account for the deviation between the as-built and 269
designed positioned of objects. can be used as a measure of the level of confidence in the 270
recognition of each object, or the level to which the object can be considered built as planned. We refer 271
the reader to [52][53] for details. 272
It has been shown through experiments with real-life data that the Scan-vs-BIM approach performs 273
extremely well for structural works tracking. Furthermore, this approach directly enables the 274
identification of objects. However, the features used by the approach (surface orientation and point 275
proximity) work only for objects with minor geometrical discrepancy between the as-built and as-276
planned states. For example, any object built at a location further away than δmax (50mm) cannot be 277
recognized and identified; in fact, it was shown in [53] that the performance of this approach can drop 278
significantly in the case of MEP works. 279
2.4 Contribution 280
The review of the Hough transform and Scan-vs-BIM techniques highlights a radical complementarity in 281
terms of performance. While the Hough transform can robustly detect circular cross-sections in the 282
presence of significant amounts of occlusions, and Mahmoud et al. [48][49] have shown that those 283
detections can support the recognition of cylindrical objects, their method cannot be used on its own to 284
infer their identification. Furthermore, the method of Mahmoud et al. can only recognize objects with 285
cylindrical shape, i.e. circular cross-sections along a straight centerline; it cannot recognize objects with 286
non-collinear circular cross-sections (e.g. curved pipes, elbows). On the other hand, the Scan-vs-BIM 287
technique of [31][32][53] enables the recognition and identification of simple and complex objects, but 288
its recognition metrics are not robust to recognize objects that are significantly displaced from their 289
designed location. It also cannot recognize objects that are not contained in the BIM model. 290

15
Bosché et al. [53] have suggested that, given an as-designed BIM model, as-built 3D data could be more 291
effectively processed by integrating Scan-vs-BIM with Scan-to-BIM techniques (such as Hough Transform 292
– based techniques) (Figure 1). How to do so remains a significant gap in the knowledge base. 293
294
Figure 1: Data processing system for life-cycle BIM model dimensional information management 295 proposed in Bosché et al. [53]. 296
This paper presents an approach that uniquely attempts to achieve this. It integrates the Hough 297
transform–based circular cross-section detection approach of Ahmed et al. [48][49] with the Scan-vs-298
BIM approach of Bosché et al. [31][32][53] to robustly and automatically recognize and identify all 299
objects with circular cross-sections in as-built TLS point clouds. It is also able to detect cylindrical objects 300
that are not contained in the BIM models – such as those that are “field run”, which is an extremely 301
common practice world-wide. It attempts to benefit from the strengths of both approaches while 302
simultaneously elevating their respective limitations. The approach is detailed in Section 3 and validated 303
with an experiment conducted with data acquired on a real-life project (Section 4). The performance is 304
discussed in Section 5, which is followed with the conclusions and suggestions for future work (Section 305
6). 306

16
3 Proposed Approach 307
Our proposed approach integrates the Hough transform-based circular cross-section detection approach 308
of Ahmed et al [48][49] within the Scan-vs-BIM system of Bosché et al. [31][32][53]. The process 309
contains five steps (see also Figure 2): 310
1. Register as-built point cloud with the (as-planned) BIM model. The as-built point cloud data is 311
registered in the coordinate system of the (as-planned) BIM model. This is the same procedure 312
as the step 1 of the Scan-vs-BIM approach described in Section 2.3. We refer the reader to 313
[32][53][54] for details. 314
2. Generate “virtual” as-planned point cloud. From Step (1), the locations of the scanners (when 315
acquiring the as-built data) are now known in the coordinate system of the BIM model. It is thus 316
possible to generate a “virtual” as-planned point cloud where the BIM model acts as the 317
scanned scene. This is the same procedure as the step 3 of the Scan-vs-BIM approach described 318
in Section 2.3. We refer the reader to [32][53] for details. 319
3. Extract circular cross-sections from the as-built and as-planned point clouds; see Section 3.1. 320
4. Match the cross-sections extracted from the as-built point cloud to the cross-sections 321
extracted from the as-planned point cloud; see Section 3.2. 322
5. For each (as-planned) object contained in the BIM model and with circular cross-section (e.g. 323
pipe), infer its recognition/identification, and to which extent it can be considered “built as 324
planned”; see Section 3.3. 325
Steps 3 to 5 are detailed in sub-sections 3.1 to 3.3 respectively. 326

17
327
Figure 2: Summary of the proposed novel approach to automatically recognize and identify in TLS data 328 objects with circular cross-sections (e.g. pipes) contained in a project’s as-designed BIM model. 329
3.1 Circular Cross-Section Detection 330
The application of the Step 1 and 2 of the proposed method produces an as-planned 3D point cloud, 331
with the same characteristics as the as-built point cloud (field of view and point density), and in the 332
same coordinate system as the as-built point cloud. 333
The Hough transform -based circular cross-section detection method of Ahmed et al. [48][49] is then 334
applied to both point clouds. Very importantly, this is done using this exact same slicing of the data (in 335
three orthogonal directions and at constant intervals along those directions) for both point clouds. 336

18
The result of this process is a set of circular cross-sections detected within the as-built point cloud, and 337
another set of circular cross-sections detected within the as-planned point cloud. Furthermore, each 338
data slice is associated with a set of as-built and as-planned cross-sections. 339
3.2 Circular Cross-Section Matching 340
Once circular cross-sections have been extracted from both the as-built and as-planned point clouds, the 341
goal is to find, for each as-built cross-section, its best matching as-planned cross-section, if any. For this, 342
we use a cross-section similarity criterion that integrates three sub-criteria with respect to: 343
Location: the similarity sub-criterion, , is calculated based on the distance between the 344
centers of the as-built and as-planned cross-sections relative to a maximum distance : 345
‖ ‖
, 346
where is the coordinate vector of the center of the as-built cross-section, is the 347
coordinate vector of the center of the as-planned cross-section. We set , but 348
one could also consider setting as a multiple of the as-planned radius of the object’s 349
cross-section. when the centers are exactly the same; when the distance 350
between the centers is . Furthermore, we discard any match between cross-sections 351
that are further away than , i.e. for which . 352
Radius: the similarity sub-criterion, , is calculated based on the difference between the radii 353
of the as-built and as-planned circular cross-sections relative to a maximum value : 354
| |
, 355

19
where is the radius of the extracted as-built cross-section, is the designed radius of 356
the as-planned cross-section, and . We set . when the radii are 357
exactly the same; when they differ by . Furthermore, we discard any match 358
between cross-sections with differences in radii larger than , i.e. for which . 359
Orientation: the similarity sub-criterion, , is calculated as the absolute value of the cosinus of 360
the angle between the normal vectors to the as-built and as-planned cross-sections. 361
| ( )| , 362
where and are the normal vectors of the extracted as-built and as-planned cross-363
sections, respectively. when the normal vectors are collinear; when they are 364
orthogonal. 365
The resulting cross-section similarity criterion, integrating the three sub-criteria above, is then 366
calculated as: 367
, 368
where , , and are three weights adding up to 1. when the cross-sections 369
have the same center, radius and orientation. 370
With a view on speeding up the matching process, as well as ensuring meaningful and consistent 371
matches, we search for matches only within each data slice. In other words, for each as-built cross-372
section, we search for matching as-planned cross-sections only within the same TLS data slice. This 373
implies that all considered matches are between cross-sections having the same orientation; or, for all 374
considered matches . The orientation criterion can thus be discarded from the overall matching 375
criterion, which becomes: 376

20
, 377
where and are two weights adding up to 1. 378
Because and are both designed to take values in the range [ ] and our discarding strategy leads 379
to a situation where there is no obvious reason to advantage one of the criteria over the other, we 380
propose to set the weights as: . 381
3.3 Object Recognition/Identification 382
For each (as-planned) object with circular cross-section contained in the BIM model, we analyze the 383
cross-section matching results to: (1) infer whether it can be considered recognized/identified; and (2) 384
to which extent it can be considered “built as planned”. We propose to calculate the corresponding two 385
metrics: , that can be used to infer recognition and identification, and , that estimates the 386
extent to which each object is geometrically “built as planned”, as: 387
∑ ( )
where is the number of as-planned cross-sections for the given object; 388
is the number of those cross-sections that have been matched to as-built cross-sections; 389
and is the similarity measure for the ith match. 390

21
when all as-planned cross-sections have been matched, which implies that the object is 391
most likely recognized and identified. In contrast, when none of the cross-sections are 392
matched, implying that the object is most likely not recognized. 393
when all the matches between as-planned and as-built cross-sections are exact; i.e. the 394
recognized/identified part of the object (whether complete or incomplete) is “built as planned”. In 395
contrast, implies that the recognized/identified part of the object is not built exactly as planned. 396
Figure 3 qualitatively summarizes how these two metrics can be collectively analyzed to interpret the 397
results. 398
399
Figure 3: Possible interpretation of the combined values of and . 400
It is also possible to integrate the two metrics above into a single one, : 401
∑ ( )

22
can be interpreted as a measure of the level to which each entire object is “built as planned” (not just 402
the detected parts, i.e. cross-sections). when all the planned cross-sections are matched to as-403
built cross-sections and these matches are exact; i.e. the object is “built as planned”. In contrast, 404
implies that the object is not complete, not built as planned, or a combination of those two cases. For 405
example, could result from half the as-planned cross-sections being perfectly matched but the 406
other half being not matched at all (which could mean that only a section of the object is fully installed); 407
alternatively, it could result from all the as-planned cross-sections being matched, but the matching 408
similarities are on average only 0.5, which means that the object is built, but not as planned. 409
It is interesting to note that the individual object values can be aggregated to derive measures of the 410
level to which overall systems or areas are “built as planned”. The following formula, implementing a 411
weighted average of the objects’ values, can be used: 412
∑ ( )
∑ (∑ ( )
)
where is the number of objects in the considered system (or area), and is the 413
estimation of the extent to which the jth object can be considered “built as planned”. 414
It is important to note that, in contrast with the original Scan-vs-BIM technique that takes occlusions 415
from other objects into account in the object recognition and identification metric (see definitions of 416
and in Section 2.3), the effect of occlusions is not considered in the metric 417
. This could be considered in future work. We point out however that and directly work 418
with the matched cross-sections and therefore are not impacted by occlusions. 419

23
3.4 As-built Modelling 420
Once the as-planned pipes have been recognized, it is possible to conduct their as-built modelling by 421
generating pipes along the cross-sections matched to each as-planned pipe. In this paper, we simply 422
propose to split the cross-sections into groups of collinear cross-sections (across several layers), and 423
then apply the method proposed by Ahmed et al. [48][49]. This method generates the best fitting 424
centerline (filtering out any false cross-sections) from the group of cross-sections, and then uses this 425
centerline along with the cross-sections radius to generate cylinders representing the straight pipe. 426
4 Experiments 427
4.1 Data 428
We conducted an experiment with data collected during the construction of the Engineering VI Building 429
at the University of Waterloo that is designed to shelter the Chemical Engineering Department of the 430
university (a five-storey, 100,000-square-foot building). The data collected include 2D drawings and a set 431
of field laser scans. The authors created a 3D CAD/BIM model of the 5th floor based on the information 432
provided on 2D drawings. 433
This project was chosen for the study as the building includes numerous pipes and ducts, to provide 434
water and gas to different laboratories and to collect and evacuate chemical fumes from them. This 435
study focused specifically on the service corridor of the fifth floor (31m x 3.4m) as it contains all the 436
pipes coming from the lower levels and going all the way up to the penthouse. Figure 4 shows the 437
service corridor section of the 3D CAD/BIM model. 438

24
Laser scans were acquired from the corridor using the FARO LS 880 HE laser scanner, which employs 439
phase-based technology (see Table 1 for the technical characteristics of the scanner). Six scans were 440
acquired along the corridor because of the density of the pipes and ducts and the narrowness of the 441
corridor (Figure 5). 442
443
Figure 4: 3D model of the 5th floor corridor of Engineering VI. 444
Table 1: Characteristics of the FARO LS 880 HE scanner 445
Laser Type 785nm; near infrared Distance Range
Accuracy 0.6 m to 76 m. ±3 mm @ 25 m.
Angle Range Accuracy
Hor: 360°; Vert: 320° Hor: 16 μrad; Vert: 16 μrad
Maximum Resolution Hor: 13 μrad; Vert: 157 μrad Acquisition Speed up to 120,000 pts/s
446
447
Figure 5: Combined six laser scans of the 5th floor corridor Engineering VI; the dots show the scanning 448 locations. 449
450

25
Figure 6: Top view of the corridor highlighting the pipes visually identified as present (at least 451 partially) in the corridor at the time of scanning. The pipes present are shown in yellow, those absent 452
are in blue. In brown are ducts that were also present. 453
4.2 Results 454
4.2.1 Cross-section Detection 455
After aligning the point cloud of the six scans in the coordinate system of the project 3D CAD/BIM 456
model, the as-planned point cloud is automatically calculated and the circular cross-sections 457
automatically extracted from the as-planned and as-built point clouds. Because the pipes contained in 458
the corridor are essentially all vertical, we focus on those only, and apply the Hough transform -based 459
method of Ahmed et al. [49] solely with slices along the vertical (Z) axis. Twenty six slices are 460
automatically generated with 10 cm intervals. From this, the system automatically detects 1176 as-461
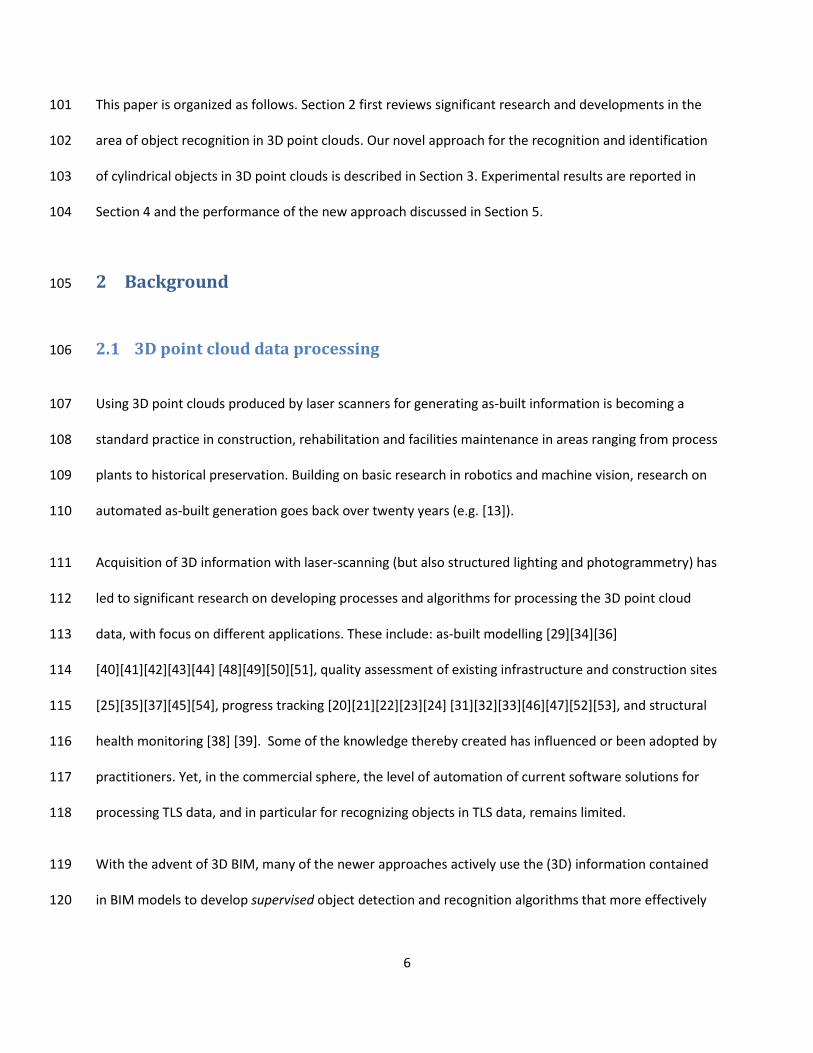
planned circular cross-sections and 164 as-built circular cross-sections (see Figure 7). 462
(a) 463
(b) 464
(c) 465
26
(d) 466
Figure 7: Extracted cross-sections detected in the as-built (a) and as-planned (b) point clouds. (c) and 467 (d) show the as-built (orange) and as-planned (blue) cross-sections altogether. 468
After applying the circular cross-section matching approach described in Section 3.1, 112 of the 164 as-469
built cross-sections are matched to as-planned cross-sections, and all with similarity levels > 0.95. 470
Looking at the 52 as-built cross-sections that are not matched, these come from two sets of 26 cross-471
sections: 472
The first 26 cross-sections were detected at the same location as another set of 26 as-built 473
cross-sections but for a different radius (see Figure 8(a)). The system matched the latter set to 474
the locally corresponding as-planned cross-sections because they had the exact same radius; 475
the other set was thus correctly rejected. 476
The second set of 26 cross-sections comes from a very small pipe present in the corridor at the 477
time of scanning but that did not correspond to any pipe in the 3D model (see Figure 8(b)). 478
These cross-sections were thus correctly rejected by the system. Note that, using the same 479
dataset, the original Scan-vs-BIM approach of Bosché et al. had wrongly suggested that this 480
pipe was present in the scene (albeit with some low level of confidence) [53]. 481
In conclusion, the 52 cross-sections that are not matched to any as-planned cross-section, are actually 482
correctly not matched by the system. Note, however, that the non-matched detected cross-sections 483

27
could still be used to inform and partially automate a manual update of the BIM model. For example, 484
the pipe with small diameter found by the system could be added directly to the BIM model. 485
(a) (b) 486
Figure 8: The two cases where as-built cross-sections are (correctly) not matched to any as-planned 487 one. (a) two sets of cross-sections are extracted at the same location; the system rejects the set with 488 the largest radius because it is too dissimilar to the locally corresponding as-planned cross-sections; 489
(b) small temporary pipe clearly not corresponding to the local as-planned pipe. 490
4.2.2 Pipe Recognition and Identification 491
After aggregating the results for each pipe actually present in the corridor (i.e. the yellow pipes in Figure 492
6), the pipe recognition/identification metrics described in Section 3.3, namely , and , are 493
calculated and summarized in Table 2 and Figure 9. The results highlight a few points: 494
For two of the pipes that can be visually recognized in the data, the system fails to detect any 495
circular cross-section. This is due to the fact that too few points were actually scanned from 496
those pipes to enable the confident detection of cross-sections. 497
In this particular experimental dataset, all the matched as-built cross-sections are very close to 498
their matching as-planned ones ( ), which indicates that pipes, or at least partial 499
sections of pipes, are recognized at their expected locations. 500
For six pipes, fewer than half the as-planned cross-sections are recognized. As summarized 501
earlier in Figure 3, this and the corresponding high values for those objects indicate that they 502

28
are likely identified at their as-built locations, but are incomplete (which is confirmed by a visual 503
analysis of the data; see also Figure 11). 504
For three pipes (09, 20 and 26), all as-planned cross-sections are recognized, and are found very 505
close to their designed locations and with the same radius. These pipes would thus be correctly 506
considered fully identified. 507
Table 2: Recognition results ( , , ) for each of the pipes actually present (at least partially) 508 in the as-built point cloud. 509
Pipe Name
Pipe_01 26 11 0.42 0.99 0.42
Pipe_02 26 4 0.15 0.95 0.15
Pipe_03 26 9 0.35 0.97 0.34
Pipe_09 26 26 1.00 0.97 0.99
Pipe_12 26 0 0.00 0.00 0.00
Pipe_18 0 0 0.00 0.00 0.00
Pipe_20 26 26 1.00 0.97 0.98
Pipe_26 16 16 1.00 0.96 0.98
Pipe_32 16 4 0.25 0.96 0.25
Pipe_35 26 7 0.27 0.97 0.27
Pipe_44 26 1 0.04 0.99 0.04
Pipe_51 26 8 0.31 0.98 0.30
510

29
511
Figure 9: The recognition values and for all the pipes present in the corridor. Figure 3 512 indicates how the results can be interpreted. 513
The results above indicate some level of robustness of our proposed approach, but it remains to be 514
assessed how it compares against the original Scan-vs-BIM approach of Bosché et al.[53]. To conduct 515
this comparison, we apply the original Scan-vs-BIM approach of Bosché et al. [53] to this dataset, and 516
compare and (the metric used in [53]) that both provide an estimation of the level of 517
confidence in the matching of the as-planned objects to the as-built data. Table 3 and Figure 10 518
summarize the values obtained and their comparison. The results tend to demonstrate that the new 519
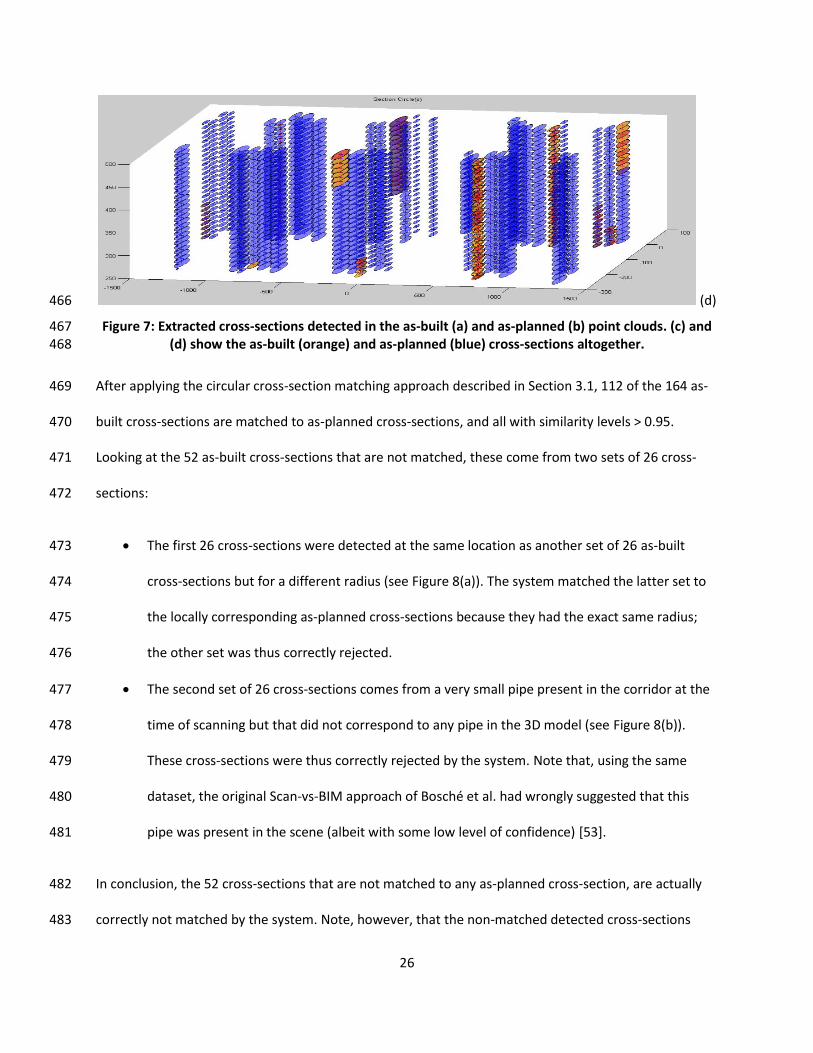
approach is more robust, as illustrated with the following four examples (see Figure 11): 520
Pipe_20: As can be seen in Figure 11(a), as-built points are found in large areas along the entire 521
length of the pipe and these are at the same locations as the as-planned ones. For this reason, 522
the two approaches both estimate high levels of confidence in the recognition/identification of 523
the pipe ( and ). 524
Pipe_09: As can be seen in Figure 11(b), as-built points are found in large parts along the entire 525
length of the pipe. However, it appears that the pipe is not located exactly where it is planned to 526
0.0
0.2
0.4
0.6
0.8
1.0
0.0 0.2 0.4 0.6 0.8 1.0
S
%matched

30
be. Despite the fact that the out-of-place deviation is minor (~5cm), the original Scan-vs-BIM 527
approach achieves a fairly low level of confidence in the recognition of the pipe ( 528
). In contrast, the new approach correctly maintains a high level of confidence in the 529
recognition ( ); it also provides information that can be readily used to automatically 530
correct the as-built location of the pipe in the BIM model. 531
Pipe_32: As can be seen in Figure 11(c), as-built points are found at the right location 532
horizontally, but only the bottom section of the pipe is actually installed. But, because more 533
points are recognized at the bottom of the pipe than planned, the original Scan-vs-BIM ends up 534
reaching a level of confidence in the recognition of the entire pipe that is clearly over-estimated 535
( ). In contrast, the new approach estimates a more appropriate level of 536
confidence ( ). 537
Pipe_02: As can be seen in Figure 11(e), as-built points are found at a horizontal location that is 538
slightly different from the planned one, and only the bottom part of the pipe has actually been 539
installed. The combined effect of the out-of-plane deviation (which is just ~6cm) leads the 540
original Scan-vs-BIM approach to give a quasi-null level of confidence ( ) – 541
and actually reaches the conclusion that the pipe is not recognized. In contrast, the new 542
approach once again estimates a higher, and generally more representative, level of confidence 543
( ). 544
545
Table 3: Comparison of the performance of the proposed approach ( ) against the original Scan-vs-546 BIM approach of Bosché et al. [53] ( ) for recognizing each of the pipes actually present (at 547
least partially) in the as-built point cloud. 548
Pipe Name
Pipe_01 0.42 0.44

31
Pipe_02 0.15 0.02
Pipe_03 0.34 0.01
Pipe_09 0.99 0.49
Pipe_12 0.00 0.00
Pipe_18 0.00 0.55
Pipe_20 0.98 0.81
Pipe_26 0.98 0.46
Pipe_32 0.25 0.73
Pipe_35 0.27 0.32
Pipe_44 0.04 0.01
Pipe_51 0.30 0.33
549
550
Figure 10: Graphical representation of the results summarized in Table 3. 551
0.0
0.2
0.4
0.6
0.8
1.0
0.0 0.2 0.4 0.6 0.8 1.0
%co
nfi
de
nce
S'
32
(a) 552
(b) 553
(c) 554
(d) 555
Figure 11: The as-built and as-planned point-clouds for objects Pipe_20 (a), Pipe_09 (b), Pipe_32 556 (c), and Pipe_02 (d). From the left, the first column shows top views of the as-built point clouds, 557
the second columns top views of the as-planned point clouds, the third column top views of both 558 point clouds, and the last column side views of both point clouds. 559
Given all the values for all the pipes in the corridor, we can also calculate the overall level with which 560
the corridor’s piping is currently built as-planned (including whether objects are built or not), using the 561
formula described in Section 3.3. We obtain: =9%. This value is low essentially because 562

33
many of the pipes are currently not installed. But, arguably, it provides a meaningful estimation of the 563
level to which piping works in the corridor have progressed to date. 564
4.2.3 As-built Modelling 565
Once the cross-sections have been matched, the system not only calculates the value to infer the 566
recognition/identification of each BIM model object (and infer whether it is built as planned), but it also 567
generates the as-built model of each pipe. The result of this process with our experimental data is 568
shown in Figure 12. In this figure, the pipes are labelled so that they can be related to the results 569
reported in Table 2 and Table 3. 570
571
Figure 12: The as-built 3D models of the recognized/identified pipes, in comparison with the 572 centerlines of the as-planned pipes. 573
5 Discussion 574
The experiment reported above, albeit arguably of a limited nature, does demonstrate the added value 575
of the proposed new approach to detect, recognize and identify cylindrical MEP components, in 576
comparison with the original Scan-vs-BIM approach of Bosché et al. [53]. The two main areas of 577
improved performance are: 578
09 01
02 03
20
26
32
35
44
51

34
1. Out-of-plane deviations (or, out-of-centerline deviations): The original approach can only 579
recognize objects within 5cm or so from their as-planned locations. In contrast, the new 580
approach is far less sensitive to such deviations, and maintains high levels of confidence up to 581
and actually far beyond such distances. 582
2. Pipe completeness recognition: The original approach is not able to distinguish whether the 583
recognized points are acquired at different locations along the pipes, and may consequently 584
over-estimate its level of confidence. In contrast, the new approach, by matching cross-sections 585
at regular intervals along the pipes, is able to take this factor into account when estimating its 586
level of confidence. 587
Additionally, the proposed approach is capable of identifying objects (i.e. identify to which object each 588
cross-section corresponds to). Therefore, it addresses the issue of “pipe occlusions” – i.e. ensuring that 589
an occluded pipe is not recognized as two different ones. 590
Naturally, this performance needs to be confirmed with additional, more complex scenarios, in 591
particular with pipes going in different directions (not just vertically). Yet, some limitations can already 592
be pointed at that would require further investigation, in particular: 593
The Hough transform -based approach for detecting circular cross-sections analyzes the data in 594
pre-determined directions, in particular the main three orthogonal directions. While pipes and 595
other cylindrical MEP objects tend to be run in these main, these three main directions could be 596
complemented with at least 6 other ones to search for cross-sections oriented 45° from the 597
main directions (this would also help in recognizing elbows). However, increasing the number of 598
slicing directions proportionally increases the processing time. An alternative more general 599

35
approach to extract cylindrical pipes, such as the one proposed by Son et al. [50], could be 600
investigated. 601
While the proposed new method to recognize and identify objects with circular cross-sections is 602
more robust than the original approach employed by Bosché et al. [53], false positive and false 603
negative recognitions could still occur. For example, the current approach cannot recognize a 604
pipe that is further away than from its planned location (false negative). Or, if a pipe is 605
mis-located but happens to have an as-built location and radius that are the same as those of 606
another pipe, then the system will wrongly recognize the pipe (false positive). Preventing such 607
errors would require further prior information to be considered in the recognition and 608
identification process, such as component connectivity. 609
6 Conclusions 610
This paper presented a novel approach to automatically recognize and identify objects with circular 611
cross-sections (e.g. pipes) in 3D TLS data acquired from construction sites, and given the project’s 3D 612
design BIM model. This approach uniquely integrates an object detection and recognition technique 613
(typically employed in Scan-to-BIM applications) with a Scan-vs-BIM approach inferring object 614
recognition and identification from proximity analysis. Specifically, the approach integrates the efficient 615
Hough transform -based circular cross-section detection approach of Ahmed et al. [48][49] within the 616
Scan-vs-BIM object recognition and identification framework of Bosché et al. [31][32][53]. Objects are 617
recognized based on the matching of as-built and as-planned cross-sections in terms of proximity, 618
orientation and radius. The proposed object recognition metrics can be used not only to infer 619
recognition, but also to estimate the extent to which each object is “built as planned”. These individual 620

36
estimations can also be aggregated to assess the extent to which a system, area or other grouping is 621
built as planned, i.e. its “percentage built as planned”. 622
An experiment has been conducted using scans acquired from a utility corridor under construction. The 623
results are very encouraging and already demonstrate the added value of the proposed integrated 624
approach over the rather simpler Scan-vs-BIM approach of Bosché et al. [53]. While these results need 625
to be confirmed with more complex scenarios, two main limitations are already identified that will 626
require further investigations, namely: the search for pipes by the proposed Hough transform approach 627
in pre-defined directions only; and the fact that false positive and false negatives may still occur 628
(although the proposed approach already significantly reduces their chance of occurrence). Alternative 629
approaches to the circular cross-section detection method employed here could be investigated that are 630
more general and able to detect circular cross-sections, or more generally cylindrical pipes, in any 631
direction. The metric used to recognize and identify the as-planned objects also presents some 632
limitations that can only be addressed by applying higher-level reasoning, for example by analyzing 633
object connectivity. 634
7 Acknowledgements 635
The authors would like to thank Gary Caldwell from Aecon Group Inc. for providing the 2D drawings of 636
Engineering V Building, and for allowing us to take the scans of the construction. The authors would also 637
like to thank to Arash Shahi and Yazan Chaban from the University of Waterloo for their help during this 638
work. 639
This research is partially funded by NSERC CRD Grant, NSERC Discovery Grant, CII and SNC Lavalin. 640
37
8 References 641
[1] Schaufelberger, J.E., Holm, L. (2002). Management of Construction Projects: A Constructor’s 642
Perspective, Prentice Hall. 643
[2] Grau, D., Caldas, C. H., Haas, C. T., Goodrum, P. M., Gong, J. (2009). Assessing the impact of 644
materials tracking technologies on construction craft productivity, Automation in Construction, 18, 645
pp. 903-911. 646
[3] Ergen, E., Akinci, B., Sacks, R. (2007). Life-cycle data management of engineered-to-order 647
components using radio frequency identification, Automation in Construction, 21, pp. 356-366. 648
[4] Li, N., Becerik-Gerber, B. (2011). Performance-based evaluation of RFID-based Indoor Location 649
Sensing Solutions for the Built Environment, Advanced Engineering Informatics, 25 (3), pp. 535–546. 650
[5] Pradhan, A., Ergen, E., Akinci, B. (2009). Technological Assessment of Radio Frequency Identification 651
Technology for Indoor Localization, ASCE Journal of Computing in Civil Engineering, 23 (4), pp. 230-652
238. 653
[6] Razavi, S. N., Haas, C. T., (2010). Multisensor data fusion for on-site materials tracking in 654
construction, Automation in Construction, 19, pp. 1037-1046. 655
[7] Razavi, S.N., Moselhi, O. (2012). GPS-less indoor construction location sensing, Automation in 656
Construction, 28, pp. 128-136. 657
[8] Teizer, J., Venugopal, M., Walia, A. (2008). Ultra-wide band for Automated Real-time Three-658
Dimensional Location Sensing for Workforce, Equipment, and Material Positioning and Tracking, 659
Transportation Research Record, Transportation Research Board of the National Academies, 660
Washington D.C, pp. 56–64. 661

38
[9] Cheng, T., Venugopal, M., Teizer, J., Vela, P.A. (2011). Performance evaluation of ultra-wideband 662
technology for construction resource location tracking in harsh environments, Automation in 663
Construction, 20, pp.1173-1184. 664
[10] Shahi, A., Aryan, A., West, J. S., Haas, C. T., Haas, R. G. (2012). Deterioration of UWB positioning 665
during construction, Automation in Construction, 24, pp. 72-80. 666
[11] Saidi, K. S., Teizer, J., Franaszek, M., Lytle, A. M. (2011). Static and dynamic performance 667
evaluation of a commercially-available ultra-wide band tracking system, Automation in 668
Construction, 20, pp. 519-530. 669
[12] Grau, D., Caldas, C. H., Haas, C. T., Goodrum, P. M., Gong, J. (2009). Assessing the impact of 670
materials tracking technologies on construction craft productivity, Automation in Construction, 18, 671
pp. 903-911. 672
[13] Haas, C., (1986). Algorithms to Map Subsurface Ferrous Conductors. MSc Thesis, Carnegie 673
Mellon University Department of Civil Engineering, Aug. 1986. 674
[14] Haas, C., Shen, H., Phang, W. A., & Haas, R. (1984). Application of image analysis technology to 675
automation of pavement condition surveys. Publication of: Balkema (AA). 676
[15] Abeid, J., Allouche, E., Arditi, D., & Hayman, M. (2003). PHOTO-NET II: a computer-based 677
monitoring system applied to project management. Automation in construction, 12(5), pp. 603-616. 678
[16] Ibrahim, Y. M., Lukins, T. C., Zhang, X., Trucco, E., & Kaka, A. P. (2009). Towards automated 679
progress assessment of workpackage components in construction projects using computer 680
vision. Advanced Engineering Informatics, 23(1), pp. 93-103. 681
[17] Chi, S., Caldas, C. H., & Kim, D. Y. (2009). A methodology for object identification and tracking in 682
construction based on spatial modeling and image matching techniques. Computer-Aided Civil and 683
Infrastructure Engineering, 24(3), pp. 199-211. 684

39
[18] Wu, Y., Kim, H., Kim, C., & Han, S. H. (2009). Object recognition in construction-site images using 685
3D CAD-based filtering. Journal of Computing in Civil Engineering, 24(1), pp. 56-64. 686
[19] Teizer, J., Caldas, C. H., & Haas, C. T. (2007). Real-time three-dimensional occupancy grid 687
modeling for the detection and tracking of construction resources. Journal of Construction 688
Engineering and Management, 133(11), pp. 880-888. 689
[20] Golparvar-Fard, M., Pena-Mora, F., Savarese, S. (2009). Application of D4AR – A 4-Dimensional 690
augmented reality model for automating construction progress monitoring data collection, 691
processing and communication, Journal of Information Technology in Construction, 14, pp. 129-153. 692
[21] Golparvar-Fard, M., Peña-Mora, F., Savarese, S. (2013). Automated progress monitoring using 693
unordered daily construction photographs and IFC-based Building Information Models, ASCE 694
Journal of Computing in Civil Engineering, (in press). 695
[22] El-Omari, S., & Moselhi, O. (2008). Integrating 3D laser scanning and photogrammetry for 696
progress measurement of construction work. Automation in construction, 18(1), pp. 1-9. 697
[23] Ahmed, M., Haas, C., West, J., & Haas, R. (2011). Rapid Tracking of Pipe-Works Progress using 698
Digital Photogrammetry. Proceedings of the 9th Construction Specialty Conference, Ottawa, 699
Ontario, Canada, pp. 14-17. 700
[24] Ahmed, M., Haas, C., and Haas, R. (2012). “Using Digital Photogrammetry for Pipe-Works 701
Progress Tracking” Canadian Journal for Civil Engineering, CJCE Special Issue on Construction 702
Engineering and Management, 39(9) pp. 1062-1071. 703
[25] Ahmed, M., Haas, C. T., & Haas, R. (2011). Toward low-cost 3D automatic pavement distress 704
surveying: the close range photogrammetry approach. Canadian Journal of Civil 705
Engineering, 38(12), pp. 1301-1313. 706
[26] Cheok, G. S., Stone, W. C., Lipman, R. R., & Witzgall, C. (2000). Ladars for construction 707
assessment and update. Automation in Construction, 9(5), pp. 463-477. 708

40
[27] Stone, W., Cheok, G. (2001). LADAR sensing applications for construction, Building and Fire 709
Research, National Institute of Standards and Technology (NIST), Gaithersburg, MD. 710
[28] Jaselskis, E. J., Gao, Z., & Walters, R. C. (2005). Improving transportation projects using laser 711
scanning. Journal of Construction Engineering and Management, 131(3), pp. 377-384. 712
[29] Brilakis, I., Lourakis, M., Sacks, R., Savarese, S., Christodoulou, S., Teizer, J., and Makhmalbaf, A. 713
(2010). “Toward Automated Generation of Parametric BIMs based on Hybrid Video and Laser 714
Scanning Data”. Advanced Engineering Informatics, 24(4), pp. 456-465. 715
[30] Jacobs G. (2008). 3D scanning: Using multiple laser scanners on projects, Professional Surveyor 716
Magazine, 28. 717
[31] Bosché, F., Haas, C.T. (2008). Automated retrieval of 3D CAD model objects in construction 718
range images, Automation in Construction, 17, pp. 499-512. 719
[32] Bosché, F. (2010). Automated recognition of 3D CAD model objects in laser scans and calculation 720
of as-built dimensions for dimensional compliance control in construction, Advanced Engineering 721
Informatics, 24(1), pp. 107-118. 722
[33] Kim, C., Son, H., Kim, C. (2013). Automated construction progress measurement using a 4D 723
building information model and 3D data, Automation in Construction, 31, pp. 75-82. 724
[34] Tang, P., Huber, D., Akinci, B., Lipman, R., Lytle, A. (2010). Automatic reconstruction of as-built 725
building information models from laser-scanned point clouds: A review of related techniques, 726
Automation in Construction, 19(7), pp. 829-843. 727
[35] Tang, P., Anil, E., Akinci, B., Huber, D. (2011). Efficient and Effective Quality Assessment of As-Is 728
Building Information Models and 3D Laser-Scanned Data, ASCE International Workshop on 729
Computing in Civil Engineering, Miami, FL, USA. 730
[36] Lee, J., Son, H., Kim, C., Kim, C. (2013). Skeleton-based 3D reconstruction of as-built pipelines 731
from laser-scan data, Automation in Construction 35, pp. 199-207.. 732

41
[37] Lijing, B., Zhengpeng, Z. (2008). Application of point clouds from terrestrial 3D laser scanner for 733
deformation measurements, The International Archives of the Photogrammetry, Remote Sensing 734
and Spatial Information Sciences, 37. 735
[38] Park, H.S., Lee, H.M., Adeli, H., Lee, I. (2007). A new approach for health monitoring of 736
structures: terrestrial laser scanning, Computer Aided Civil and Infrastructure Engineering, 22, 737
pp.19-30. 738
[39] Qui, D. W., Wu, J. G. (2008). Terrestrial laser scanning for deformation monitoring of the thermal 739
pipeline traversed subway tunnel engineering, XXIst ISPRS Congress: Commission V, WG 3, Beijing, 740
pp. 491-494. 741
[40] Valero, E.,Adán, A. and Cerrada, C. (2012). Automatic method for building indoor boundary 742
models from dense point clouds collected by laser scanners, Sensors, 12, pp. 16099-16115. 743
[41] Xiong, X., Adán, A., Akinci, B., Huber, D. (2013). Automatic creation of semantically rich 3D 744
building models from laser scanner data, Automation in Construction, 31, pp. 325-337. 745
[42] Kwon, S.-W., Bosche, F., Kim,C., Haas, C. T. andLiapi, K. A.(2003). Fitting Range Data to Primitives 746
for Rapid Local 3D Modeling Using Sparse Range Point-clouds. Automation in Construction, 13(1), 747
pp. 67-81. 748
[43] McLaughlin, J., Sreenivasan, S.V., Haas, C.T. and Liapi, K.A. (2004). Rapid Human-Assisted 749
Creation of Bounding Models for Obstacle Avoidance in Construction. Computer-Aided Civil and 750
Infrastructure Engineering, Vol. 19, pp. 3-15. 751
[44] Rabbani T., Heuvel F. van den, (2005). Efficient Hough transform for automatic detection of 752
cylinders in point clouds. ISPRS WG III/3, III/4, V/3 Workshop on Laser scanning, Enschede, NL. 753
[45] Shih, N. J., & Huang, S. T. (2006). 3D scan information management system for construction 754
management. Journal of construction engineering and management, 132(2), 134-142. 755
42
[46] Turkan, Y., Bosche, F., Haas, C. T., & Haas, R. (2012). Automated progress tracking using 4D 756
schedule and 3D sensing technologies. Automation in Construction, 22, 414-421. 757
[47] Turkan, Y., Bosché, F., Haas, C. T., & Haas, R. (2012). Toward Automated Earned Value Tracking 758
Using 3D Imaging Tools. Journal of Construction Engineering and Management, 139(4), 423-433. 759
[48] Ahmed M., Haas C.T., Haas R. (2013). Autonomous modeling of pipes within point clouds. 760
Proceedings of the 30th ISARC, Montréal, Canada, pp. 1093-1100. 761
[49] Ahmed M., Haas C.T., Haas R. (2014) Automatic Detection of Cylindrical Objects in Built 762
Facilities. ASCE Journal of Computing in Civil Engineering (in press). 763
[50] Son H., Kim C., Kim C. (2013). Knowledge-based approach for 3d reconstruction of as-built 764
industrial plant models from laser-scan data, Proceedings of the 30th ISARC, Montréal, Canada, pp. 765
885-893. 766
[51] Vosselman, G. and Dijkman, S. (2001). 3D Building Model Reconstruction from Point Clouds and 767
Ground Plans. International Archives of Photogrammetry and Remote Sensing, Volume XXXIV-3/W4 768
Annapolis, MD, 22-24 Oct. 2001. 769
[52] Turkan, Y., Bosché, F., Haas, C.T., Haas, R.G., (2013) Tracking of Secondary and Temporary 770
Objects in Structural Concrete Work, Emerald, Construction Innovation: Information, Process and 771
Management, (accepted). 772
[53] Bosché, F., Guillemet, A., Turkan, Y., Haas, C.T., Haas, R.G., (2013) Assessing the value of a Scan-773
vs-BIM framework for tracking the built status of MEP works, ASCE Journal of Computing in Civil 774
Engineering, (in press). 775
[54] Bosche, F., Haas, C., and Akinci, B. (2009). ”Automated Recognition of 3D CAD Objects in Site 776
Laser Scans for Project 3D Status Visualization and Performance Control.” J. Comput. Civ. Eng. 23, 777
SPECIAL ISSUE: Graphical 3D Visualization in Architecture, Engineering, and Construction, 311–318. 778

43
[55] Hough, P. V. C., 1962. Method, and means for recognizing complex patterns, U. S. Patent 779
3069654. 780
[56] Duda R. O. and Hart P. E. (1972). Use of the Hough Transformation to Detect Lines and Curves in 781
Pictures, Communications ACM, Vol. 15, pp. 11-15. 782
[57] Cheng Z. and Liu Y. (2004). Efficient Technique for Ellipse Detection using Restricted Randomized 783
Hough Transform. Proceedings of the International Conference on Information Technology 784
(ITCC'04), Vol.2, pp.714-718. 785
[58] van Ginkel, M., Kraaijveld, M.A., van Vliet, L.J., Reding, E.P., Verbeek, P.W., and Lammers, H.J. 786
(2003). Robust Curve Detection using a Radon Transform in Orientation Space. Proceedings of the 787
13th Scandinavian Conference on Image Analysis, pp. 125-132. 788
[59] van Ginkel, M., Luengo Hendriks, C.L., and van Vliet, L.J. (2004). A short introduction to the 789
Radon and Hough transforms and how they relate to each other. Technical Report No. QI-2004-01. 790
Quantitative Imaging Group, Imaging Science & Technology Department, Faculty of Applied 791
Science, Delft University of Technology.` 792
[60] Besl, P. J. and Jain, R. C., (1988), Segmentation through variable-order surface fitting. IEEE 793
Transactions on Pattern Analysis and Machine Intelligence, 10(2), pp. 167-192. 794
[61] Hoppe, H., DeRose, T., Duchamp, T., McDonald, J. and Stuetzle, W. (1992). Surface 795
Reconstruction from Unorganized Points. Proceedings of SIGGRAPH '92, Chicago, Illinois. 796
[62] Koenderink, J. and Doorn, A. v. (1992). Surface Shape and Curvature Scales. Image and Vision 797
Computing, pp. 557-565. 798
[63] Dorai, C. and Jain, A. (1997). "COSMOS-A Representation Scheme for 3D Free-Form Objects." 799
IEEE Transactions on Pattern Analysis and Machine Intelligence, 19(10), pp.1115-1130. 800
[64] Shaffer, E. and Garland, M. (2001). Efficient Adaptive Simplification of Massive Meshes. IEEE 801
Visualization. 802

44
[65] Pauly, M., Keiser, R. and Gross, M. (2003). Multi-scale Feature Extraction on Point-Sampled 803
Surfaces. Computer Graphics Forum, 22(3), pp. 281-289. 804
[66] Rabbani T., van den Heuvel, F. A., Vosselman, G., (2006). Segmentation of Point Clouds Using 805
Smoothness Constraint. APRS Volume XXXVI, Part 5, Dresden 25-27 September. 806
[67] Jagannathan, A. and Miller, E. (2007). Three-dimensional Surface Mesh Segmentation using 807
Curvedness-based Region Growing Approach. IEEE Trans. Pattern Analysis and Machine 808
Intelligence, 29(12): 2195-2204. 809
[68] Klasing, K., Althoff, D., Wollherr, D., Buss, M. (2009), Comparison of surface normal estimation 810
methods for range sensing applications. IEEE International Conference on Robotics and 811
Automation, pp. 3206-3211. 812
[69] Carr, J.C., Beatson, R.K., McCallum, B.C., Fright, W.R., McLennan, T.J., Mitchell, T.J. (2003). 813
Smooth surface reconstruction from noisy range data. International Conference on Computer 814
Graphics and Interactive Techniques, pp. 119-126 815
[70] Xiong, X., Adan, A., Akinci, B., Huber, D. (2012), Automatic creation of semantically rich 3D 816
building models from laser scanner data. Automation in Construction, pp. 325-337. 817
[71] Leavers, V.F. (1993). Which Hough Transform? CVGIP: Image Understanding, 58(2), pp. 250-264. 818
[72] Newman, T.S., Flynn, P.J., Jain, A.K. (1993). Model-Based Classification of Quadric Surfaces. 819
CVGIP: Image Understanding, 58(2), pp. 235-249. 820
[73] Borrmann, D., Elseberg, J., Lingemann, K., Nüchter, A. (2011). The 3D Hough Transform for plane 821
detection in point clouds: A review and a new accumulator design, 3D Research, 2(2). 822
[74] Pietrowcew, A. (2003). Face detection in colour images using fuzzy Hough transform. Opto-823
electronics review, 11(3), pp. 247-251. 824
[75] Bosché, F. (2011). Plane-based Coarse Registration of 3D Laser Scans with 4D Models, Advanced 825
Engineering Informatics, 26, pp. 90-102. 826

45
[76] Kim, C., Son, H., and Kim, C. (2013). Fully automated registration of 3D data to a 3D CAD model 827
for project progress monitoring, Automation in Construction, 35, pp. 587-594. 828