Embed Size (px)
Citation preview
MEDICAL INNOVATIONTHE VALUE OF
2019 EDITION
Frank Morelli was diagnosed with multiple myeloma

2

3
Just as energy is the basis of life itself,
and ideas the source of innovation, so is
innovation the vital spark of all human
change, improvement and progress.“Theodore Levitt
American Economist ”

4
Introduction
Chapter 1: Virtuous Cycle of Medical Innovation
Chapter 2: Living Longer, Better & Healthier
Chapter 3: Progress & Prosperity
Chapter 4: Better Healthcare, Better Outcomes
Chapter 5: Working Toward A World Free From Cancers
Chapter 6: Celgene
TABLE OF CONTENTS
Don Wright was diagnosed with multiple myeloma
5
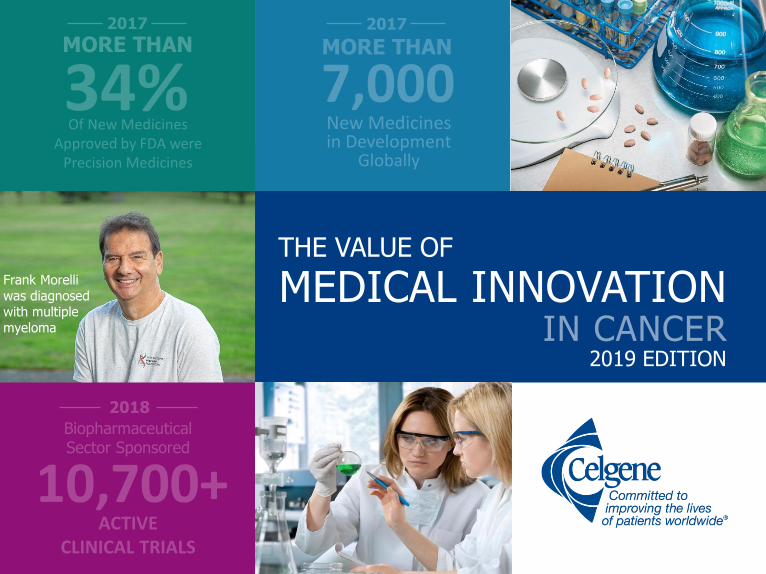
INTRODUCTION
Among the technological innovations of the 20th and 21st centuries, medical innovation has been one of the most significant contributions to our ability to live longer, healthier lives.
It is turning knowledge about disease mechanisms at the genetic and cellular level into breakthrough therapies that cure or prevent illness. It brings about a virtuous cycle of better health and greater prosperity which, in turn, stimulates additional investment in even more advanced innovations for preventing and treating disease.
Betty Merker was diagnosed with multiple myeloma

6
1
1 | VIRTUOUS CYCLE OF MEDICAL INNOVATION
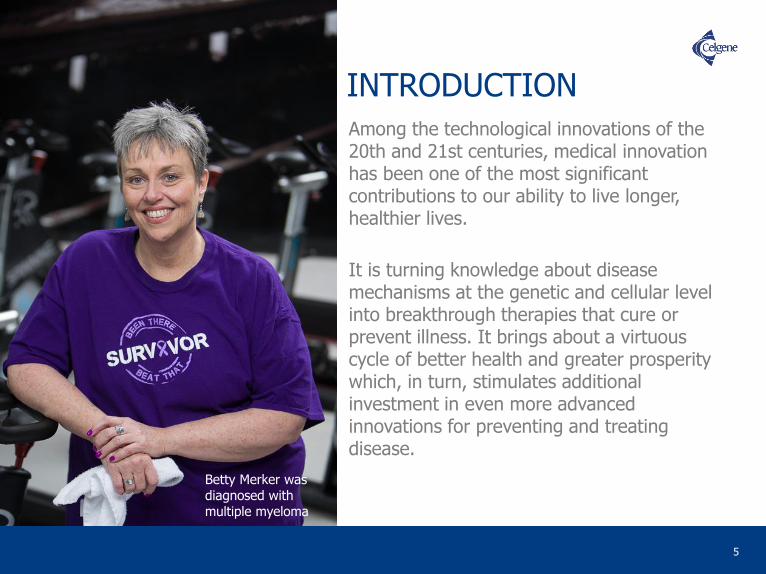
VIRTUOUS CYCLE OF MEDICAL INNOVATION
MEDICAL INNOVATION IS THE SOURCE OF LONGER LIFE AND BETTER HEALTH.
Medical innovation is an important contributor to longer life
and economic prosperity. In the 21st century, medical
innovation is dramatically improving health outcomes,
reducing the overall cost of healthcare and stimulating the
growth of the global economy – producing a world that can
be free from cancers.
This virtuous cycle of innovation, in turn, stimulates
investment in biomedical research to further improve health
and create economic value throughout the world.
7
Doug Farrell was diagnosed with multiple myeloma

6 | WHO IS CELGENE? 8
1 | VIRTUOUS CYCLE OF MEDICAL INNOVATION 8

This is the most exciting time in the historyof medicine. If we can make some radicalchanges to accommodate the enormousopportunities, there will be better health atlower costs for many generations to come.“Eric Topol, MD
Author, The Creative Destruction of Medicine ”9
6 | WHO IS CELGENE? 10
1 | VIRTUOUS CYCLE OF MEDICAL INNOVATION
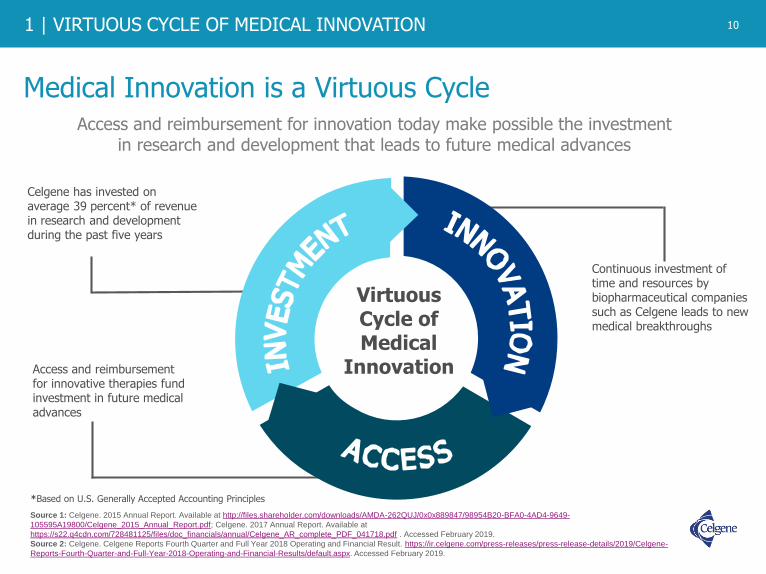
Medical Innovation is a Virtuous Cycle
10
Access and reimbursement for innovation today make possible the investment in research and development that leads to future medical advances
Celgene has invested on average 39 percent* of revenue in research and development during the past five years
Continuous investment of time and resources by biopharmaceutical companies such as Celgene leads to new medical breakthroughs
Access and reimbursement for innovative therapies fund investment in future medical advances
Virtuous Cycle of Medical
Innovation
*Based on U.S. Generally Accepted Accounting Principles
Source 1: Celgene. 2015 Annual Report. Available at http://files.shareholder.com/downloads/AMDA-262QUJ/0x0x889847/98954B20-BFA0-4AD4-9649-
105595A19800/Celgene_2015_Annual_Report.pdf; Celgene. 2017 Annual Report. Available at
https://s22.q4cdn.com/728481125/files/doc_financials/annual/Celgene_AR_complete_PDF_041718.pdf . Accessed February 2019.
Source 2: Celgene. Celgene Reports Fourth Quarter and Full Year 2018 Operating and Financial Result. https://ir.celgene.com/press-releases/press-release-details/2019/Celgene-
Reports-Fourth-Quarter-and-Full-Year-2018-Operating-and-Financial-Results/default.aspx. Accessed February 2019.

1 | VIRTUOUS CYCLE OF MEDICAL INNOVATION
The Impact of Medical Innovation
11
In July 1999, the U.S. Centers for Disease Control and Prevention’s Morbidity and Mortality Weekly Report noted the death of a 90-year-old woman. She had been deathly ill in 1942, but as a last resort, doctors treated her with what was then called “an obscure, experimental drug.”
This 33-year-old woman went from death’s door to getting married, raising a family and living nearly 60 more years.
In fact, she was the first U.S. civilian
whose life was saved by … penicillin.
Source 3: Centers for Disease Control and Prevention (CDC). Achievements in Public Health, 1900-1999: Control of Infectious Diseases. MMWR Morb Mortal Wkly Rep
1999;48(29):621-9. Available at http://www.cdc.gov/mmwr/preview/mmwrhtml/mm4829a1.htm. Accessed July 2017.

6 | WHO IS CELGENE? 12
1 | VIRTUOUS CYCLE OF MEDICAL INNOVATION
Targeted therapy
approved for leukemia
Progress Against Diseases (1955-2018)*
12
Measles vaccine
First cancer vaccine prevents cancer-
causing hepatitis B infection
First Alzheimer's treatment
Taxanes become a chemotherapy option
for breast cancer
First antiplatelet drug for reduction
in heart attack and stroke
First enzyme replacement therapy for Gaucher disease
First monoclonal antibody approved
for human use
Polio vaccine
Surfactants for infant respiratory distress
Meningococcal disease vaccine
Epigenetic approved for myelodysplastic
syndrome
Anti-angiogenic
approved for colorectal
cancer
First ACE inhibitor to treat high blood
pressureTargeted
therapies for skin cancer
B-cell receptor pathway inhibitors
First therapy
approved for HIV
Statins approved for cholesterol
SSRIs(anti-depressants)
approved for depression
Source 4: American Society of Clinical Oncology’s CancerProgress.net. Major Milestones in Cancer. Available at http://www.cancerprogress.net/resources?category=major-milestones-against-cancer#downloads. Accessed July 2017. Source 4 a: Müller D, Ellen M, Duffy M, et al. Timeline: 200 Years of the New England Journal of Medicine. NEJM 2012; 366:e 3. January 5, 2012. DOI: 10.1056/NEJMp1114819. Available at http://www.nejm.org/doi/full/10.1056/NEJMp1114819. Accessed July 2017.Source 4 b: Vaccine Timeline. Immunize.org. Accessed July 2017.Source 4 c: Bicket D P. Using ACE Inhibitors Appropriately. American Family Physician. Available at http://www.aafp.org/afp/2002/0801/p461.pdf. Accessed July 2017.Source 4 d: Alzheimer’s Association. Major Milestones in Alzheimer’s and Brain Research. Available at http://www.alz.org/research/science/major_milestones_in_alzheimers.asp. Accessed July 2017. Source 4 e: American Society of Clinical Oncology. Cancer Progress Timeline. Available at https://www.asco.org/research-progress/cancer-progress/cancer-progress-timeline. Accessed July 2017.Source 4 f: National Gaucher Foundation, Inc. Gaucher disease treatments and drugs. Available at http://www.gaucherdisease.org/gaucher-disease-treatments.php. Accessed July 2017.Source 4 g: FDA.gov. HIV/AIDS Historical Time Line 1981-1990. Available at https://www.fda.gov/forpatients/illness/hivaids/history/ucm151074.htm. Accessed July 2017. Source 4 h: FDA.gov. Hematology/Oncology (cancer) Approvals & Safety Notifications: Previous News Items. Available at https://www.fda.gov/drugs/informationondrugs/approveddrugs/ucm279177.htm. Accessed July 2017.Source 4 i: Cheng-Hwa MA C, et al. The Role of Surfactant in Respiratory Distress Syndrome. Open Respiratory Medicine Journal. Available at https://www.ncbi.nlm.nih.gov/pmc/articles/PMC3409350/. Accessed July 2017.Source 4 j: Diagnosis & Treatment. Memorial Sloan Kettering Cancer Center. Available at https://www.mskcc.org/cancer-care/types/multiple-myeloma/approach/chemotherapy-immune-modifying-drugs-proteasome-inhibitors. Accessed July 2017.Source 4 k: Drugs@FDA: FDA Approved Drug Products. Available at https://www.accessdata.fda.gov/scripts/cder/daf/index.cfm?event=overview.process&ApplNo=125085. Accessed July 2017. Source 4 l: Frishman W H. Cardiology Today, December 2008. Fifty years of beta-blockers: a revolution in CV pharmacotherapy. Available at https://www.healio.com/cardiology/vascular-medicine/news/print/cardiology-today/%7B58d8999e-a18c-4f8a-a747-38e2a1620e52%7D/fifty-years-of-beta-blockers-a-revolution-in-cv-pharmacotherapy. Accessed July 2017. Source 4 m: Drugs@FDA: FDA Approved Drug Products. Colorectal Cancer. Available at https://www.accessdata.fda.gov/scripts/cder/daf/index.cfm?event=overview.process&ApplNo=125147. Accessed July 2017.Source 4 n: National Cancer Institute. FDA Approval for Decitabine. Available at https://www.cancer.gov/about-cancer/treatment/drugs/fda-decitabine. Accessed July 2017.Source 4 o: American Society for Clinical Oncology. Cancer Progress Timeline. Melanoma Stat. Available at http://www.asco.org/research-progress/cancer-progress/cancer-progress-timeline. Accessed July 2017.Source 4 p: Raedler L A. NCBI. Keytruda (Pembrolizumab): First PD-1 Inhibitor Approved for Previously Treated Unresectable or Metastatic MelanomaAvailable at https://www.ncbi.nlm.nih.gov/pmc/articles/PMC4665064/. Accessed July 2017.Source 4 q: National Cancer Institute. FDA Approval for Ibrutinib. Available at https://www.cancer.gov/about-cancer/treatment/drugs/fda-ibrutinib. Accessed July 2017.Source 4 r: U.S. Food and Drug Administration. Drug Approval Package Plavix. Available at https://www.accessdata.fda.gov/drugsatfda_docs/nda/2002/20-839s019_ClopidogrelPlavix.cfm. Accessed July 2017.
First PD-1 inhibitor approved
Targeted therapy for colorectal
cancer
Targeted therapy for lung cancer
Proteasome inhibitor approved for
multiple myeloma
First beta blockers
Immunomodulator approved for multiple
myeloma
*Not an exhaustive list
Looking into the Future – Gene therapies, RNAi,
CAR-T

1 | VIRTUOUS CYCLE OF MEDICAL INNOVATION
Medical Innovation: Contributing to the Reduction in the Burden of Diseases Around the World
13
0
200
400
600
800
1000
1200
Pneumonia or Influenza202.2
Tuberculosis194.4
Gastrointestinal Infections142.7
Heart Disease137.4
Cerebrovascular Disease106.9
Nephropathies 88.6
Cancer 64.0
Senility 50.2
Heart Disease192.9
Cancer185.9
Noninfectious Airway Diseases 44.6
Cerebrovascular Disease 41.8Alzheimer’s Disease 27.0Diabetes 22.3Nephropathies 16.3
Pneumonia or Influenza 16.2
1900 2010
Diphtheria 40.3
Source 5: Jones DS, Podolsky SH, Greene JA. The burden of disease and the changing task of medicine. N Engl J Med 2012;366(25):2333-8. Available at http://www.nejm.org/doi/full/10.1056/NEJMp1113569#t=article. Accessed July 2017.
Annual Number of Deaths per
100,000
13
6 | WHO IS CELGENE? 14
1 | VIRTUOUS CYCLE OF MEDICAL INNOVATION
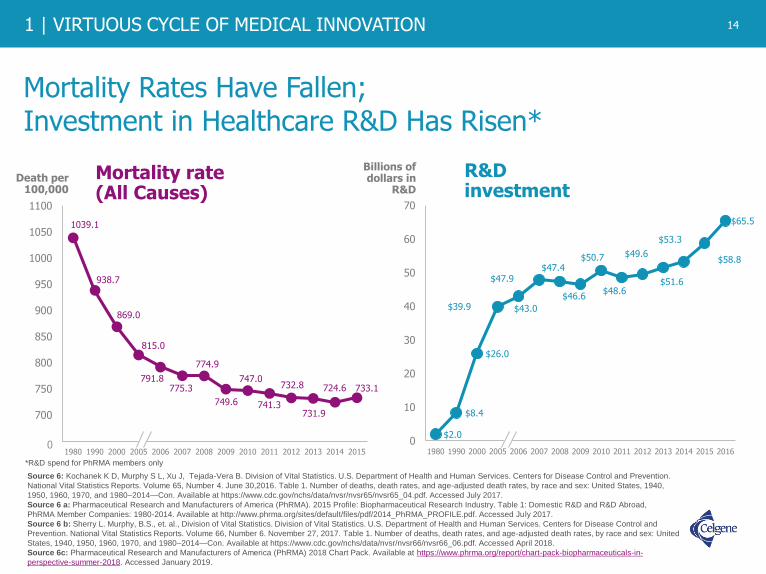
Mortality Rates Have Fallen; Investment in Healthcare R&D Has Risen*
14
Source 6: Kochanek K D, Murphy S L, Xu J, Tejada-Vera B. Division of Vital Statistics. U.S. Department of Health and Human Services. Centers for Disease Control and Prevention.
National Vital Statistics Reports. Volume 65, Number 4. June 30,2016. Table 1. Number of deaths, death rates, and age-adjusted death rates, by race and sex: United States, 1940,
1950, 1960, 1970, and 1980–2014—Con. Available at https://www.cdc.gov/nchs/data/nvsr/nvsr65/nvsr65_04.pdf. Accessed July 2017.
Source 6 a: Pharmaceutical Research and Manufacturers of America (PhRMA). 2015 Profile: Biopharmaceutical Research Industry. Table 1: Domestic R&D and R&D Abroad,
PhRMA Member Companies: 1980-2014. Available at http://www.phrma.org/sites/default/files/pdf/2014_PhRMA_PROFILE.pdf. Accessed July 2017.
Source 6 b: Sherry L. Murphy, B.S., et. al., Division of Vital Statistics. Division of Vital Statistics. U.S. Department of Health and Human Services. Centers for Disease Control and
Prevention. National Vital Statistics Reports. Volume 66, Number 6. November 27, 2017. Table 1. Number of deaths, death rates, and age-adjusted death rates, by race and sex: United
States, 1940, 1950, 1960, 1970, and 1980–2014—Con. Available at https://www.cdc.gov/nchs/data/nvsr/nvsr66/nvsr66_06.pdf. Accessed April 2018.
Source 6c: Pharmaceutical Research and Manufacturers of America (PhRMA) 2018 Chart Pack. Available at https://www.phrma.org/report/chart-pack-biopharmaceuticals-in-
perspective-summer-2018. Accessed January 2019.
$2.0
$8.4
$26.0
$39.9 $43.0
$47.9$47.4
$46.6
$50.7
$48.6
$49.6
$51.6
$53.3
$58.8
$65.5
0
10
20
30
40
50
60
70
1980 1990 2000 2005 2006 2007 2008 2009 2010 2011 2012 2013 2014 2015 2016
Billions of dollars in
R&D
R&D investment
1039.1
938.7
869.0
815.0
791.8775.3
774.9
749.6
747.0
741.3
732.8
731.9
724.6 733.1
650
700
750
800
850
900
950
1000
1050
1100
1980 1990 2000 2005 2006 2007 2008 2009 2010 2011 2012 2013 2014 2015
Death per 100,000
Mortality rate (All Causes)
0
*R&D spend for PhRMA members only

1 | VIRTUOUS CYCLE OF MEDICAL INNOVATION
Advances in Treatment of Infectious Diseases Have Yielded Large Gains in Life Expectancy
15
40
45
50
55
60
65
70
75
80
050
100150200250300350400450500
>95% Decrease
>62% Increase
Deaths per 100,000 people
Life expectancy
1900 1920 1940 1960 1980 2000
48
475
20
78
First large-scale adoption of water chlorination
Sulfa drugs(first antibiotic)
Penicillin first used as a treatment
Poliovaccine
Meningococcal disease vaccine
Influenza vaccine
Hepatitis A vaccine
Azidothymidine
(first HIV treatment)
Pertussis vaccine
Yellow fever
vaccine
Measles vaccine
First next generation hepatitis C treatment
Source 7: The Hamilton Project at the Brookings Institution. Deaths from Major Infectious Diseases. Available at http://www.hamiltonproject.org/multimedia/charts/deaths_from_major_
infectious_disease/. Accessed July 2017.
Source 7 a: U.S. Food & Drug Administration. Approval of Sovaldi (sofosbuvir) tablets for the treatment of chronic hepatitis C. Available at https://www.fda.gov/forpatients/illness/hepatitisbc/
ucm377920.htm. Accessed July 2017.
Diphtheria and TB vaccines

6 | WHO IS CELGENE? 16
1 | VIRTUOUS CYCLE OF MEDICAL INNOVATION 16
The Miracle and Gift of Longer Life
“47U.S.
31WW
68
48
84yrs
77yrs
New drugs are no small part of this medical miracle.
”Advances in Life Expectancy
- Mark McClellan, Former FDA Commissioner“ 79
72
Source 8: Health, United States, 2011: With Special Feature on Socioeconomic Status and Health. Available at http://www.cdc.gov/nchs/index.htm. Accessed July 2017.
Source 8 a: United Nations Development Program. World Population Prospects The 2017 Revision. Volume 1: Comprehensive Tables. Available at https://esa.un.org/unpd/wpp/Publications/Files/WPP2015_Volume-
I_Comprehensive-Tables.pdf. Accessed July 2017.
Source 8 b: Nonprofit and Voluntary Sector Quarterly. 2008: Supplement to vol 37; no 1: 63S-75S. Available at http://www.who.int/global_health_histories/seminars/presentation07.pdf. Accessed July 2017.
Source 8 c: World Health Organization. Global Health Observatory Data. Available at https://www.who.int/gho/mortality_burden_disease/life_tables/situation_trends/en/. Accessed January 2019.
Source 8 d: Trouth, C O, Wagner M, Barrow J, Universal Health Care Problems In The UnitedHealth States Of America Paperback. Available at https://books.google.com/books?id=82kMQmJ-B-
4C&pg=PA14&lpg=PA14&dq=New+drugs+are+no+small+part+of+this+medical+miracle&source=bl&ots=lN-yHe0iKn&sig=aceHmC0yatNqyB4bH7D5ovO9R0Q&hl=en&sa=X&ved=0ahUKEwjs3-
bI6sHXAhWs6YMKHVu7D2EQ6AEIKDAA#v=onepage&q=New%20drugs%20are%20no%20small%20part%20of%20this%20medical%20miracle&f=false. Accessed November 2017.
Source 8e: NCHS Data Brief; No. 293. December 2017. Mortality in the United States, 2016. Available at https://www.cdc.gov/nchs/data/databriefs/db293.pdf. Accessed January 2019.

1 | VIRTUOUS CYCLE OF MEDICAL INNOVATION
Medical Innovation in Vaccinations: Saving Lives and Cost While Fueling Productivity
17
Since 1924, vaccinations have prevented 103 million cases of childhood infection, representing ~95% of infections that would have occurred, including 26 million in the last decade alone.
Source 9: Van Panhuis, WG, et al. (18, November 2013). Contagious Disease in the United States from 1888 to the Present. N Engl J Med, 369(22). Available at http://jimlund.org/blog/pics/Panhuis.2013.NEJM.v369.Contagious_Diseases_in_the_United_States_from_1888_to_the_Present.pdf. Accessed January 2017. Source 9 a: Zhou, F, et al. (2014). Economic Evaluation of the Routine Childhood Immunization Program in the United States, 2009. Pediatrics, 133(4). Available at http://pediatrics.aappublications.org/content/133/4/577. Accessed July 2017.Source 9 b: WHO, UNICEF, World Bank. (2009) State of the world’s vaccines and immunization, 3rd ed. Available on http://www.who.int/immunization/sowvi/en/. Accessed July 2017.Source 9 c: Gavi; The Vaccine Alliance. Quotes and Soundbites: President Ibrahim Boubacar Keita, Republic of Mali. Available at http://www.gavi.org/pledging2015/quotes/. Accessed July 2017.Source 9 d: The Value of Investing in Vaccines. Johns Hopkins Bloomberg School of Public Health. Available at http://www.jhsph.edu/research/centers-and-institutes/ivac/resources/vaccine-cost-effectiveness.html. Accessed July 2017.
“”
I strongly believe in the virtues of vaccination … to allow my country to have a better economic future. Healthy children are more likely to attend schools and become economically productive adults.
According to the World Health Organization (WHO)
CHILD LIVESEVERY YEAR
saveAN ESTIMATED2.5 MILLION
immunizations
- President Ibrahim Boubacar Keïta, Republic of Mali
2015
Globally, vaccinations help avoid long-term costs of lost productivity due to disability and death, which may add savings of around $61 billion.
In the U.S., vaccine use saves $13.5 billion in direct costs.
”“

6 | WHO IS CELGENE? 18
1 | VIRTUOUS CYCLE OF MEDICAL INNOVATION
Value of Medical Innovation in HIV
18
Source 10: Truven Health Analytics. Available at http://truvenhealth.com/Portals/0/Assets/Life-Sciences/White-Papers/pharma-innovation-hiv-aids-treatment.pdf. M Kean, T Lessor (Eds.), “Sustaining Progress Against Cancer in an Era of Cost Containment Discussion Paper,” June 2012. Available at www.TurningTheTideAgainstCancer.org. Accessed July 2017/Source 10 a: Duggan MG, Evans WN. Estimating the impact of medical innovation: A case study of HIV antiretroviral treatments. National Bureau of Economic Research Working Paper 11109. Issued in February, 2005. Available at http://www.nber.org/digest/apr05/w11109.html. Accessed July 2017. Source 10 b: National Center for Health Statistics. Health, United States, 2015: With Special Feature on Racial and Ethnic Disparities, table 17. Hyattsville, MD: NCHS, 2011. Available at https://www.cdc.gov/nchs/data/hus/hus15.pdf#019. Accessed July 2017. Source 10 c: Kean M A. Sustaining Progress Against Cancer in an Era of Cost Containment. June 2012. Available at http://www.turningthetideagainstcancer.org/sustaining-progress-discussion-paper.pdf. Accessed November 2017.
4 HIV TherapiesApproved by the FDA between late 1995 and early 1996
~81%
*Between 1995-2015
ACTUAL VS PROJECTED DEATH RATESFOR HIV/AIDS IN THE UNITED STATES
2010
“Remember HIV?… thanks to a wave of new discoveries that came both from academic centers and the pharmaceutical industry, the HIV crisis was transformed into a stable condition which is managed very differently by society where good drugs are available. They are controlling the disease, and society has been saving an enormous amount of money as a result of these innovative drugs by providing better care out of hospitals.”
– Hervé Hoppenot, President Incyte Pharmaceuticals
9%
8%
7%
6%
5%
4%
3%
ANNUAL
MORTALITYRATE
YEAR 1988 1990 1992 1994 1996 1998 2000 2002 2004 2006 2008
PROJECTEDMORTALITY
ACTUALMORTALITY
2%
1%
0%
decline in people dying from HIV*

1 | VIRTUOUS CYCLE OF MEDICAL INNOVATION
Innovative HIV Treatment Lowers Prevalence and Increases Life Expectancy
19
Source 11: Trickey, Adam et al. Survival of HIV-positive patients starting antiretroviral therapy between 1996 and 2013: a collaborative analysis of cohort studies. The Lancet HIV, Volume 0, Issue 0. Available at http://thelancet.com/journals/lanhiv/article/PIIS2352-3018(17)30066-8/fulltext. Accessed July 2017.Source 11 a: UNAIDS Release. GROUNDBREAKING TRIAL RESULTS CONFIRM HIV TREATMENT PREVENTS TRANSMISSION OF HIV. Available at http://www.unaids.org/en/resources/presscentre/pressreleaseandstatementarchive/2011/may/20110512pstrialresults. Accessed July 2017.Source 11 b: Masters J. CNN. Modern HIV Drugs can Add 10 Years to Life Expectancy, Study Says. Available at http://www.cnn.com/2017/05/11/health/hiv-life-expectancy-increase-europe-north-america-us/index.html. Accessed October 2017.
Our research illustrates a success story of how improved HIV
treatments coupled with screening, prevention and treatment of health
problems associated with HIV infection can extend the life span of
people diagnosed with HIV.
”- Adam Trickey, Medical Statistician at the University of Bristol2017“
The treatment also prevents
spread of the disease, by
as much as 96%,
in couples where one partner
has HIV.
A 2017 study found that 20-year-olds who started with antiretroviral therapy in 2013 are predicted to live up to 10 years longer than those who first underwent similar treatment in 1996 – when it first became widely available.
BETWEEN
1996 1997 1998 1999 2000 2001 2002 2003 2004 2005 2006 2007 2008 2009 2010

6 | WHO IS CELGENE? 20
1 | VIRTUOUS CYCLE OF MEDICAL INNOVATION
Notes and Sources
20
1. Celgene. 2015 Annual Report. Available at http://files.shareholder.com/downloads/AMDA-262QUJ/0x0x889847/98954B20-BFA0-4AD4-9649-105595A19800/Celgene_2015_Annual_Report.pdf; Celgene. 2017 Annual
Report. Available at https://s22.q4cdn.com/728481125/files/doc_financials/annual/Celgene_AR_complete_PDF_041718.pdf . Accessed February 2019.
2. Celgene. Celgene Reports Fourth Quarter and Full Year 2018 Operating and Financial Result. https://ir.celgene.com/press-releases/press-release-details/2019/Celgene-Reports-Fourth-Quarter-and-Full-Year-2018-
Operating-and-Financial-Results/default.aspx. Accessed February 2019.
3. Centers for Disease Control and Prevention (CDC). Achievements in Public Health, 1900-1999: Control of Infectious Diseases. MMWR Morb Mortal Wkly Rep 1999;48(29):621-9. Available at http://www.cdc.gov/mmwr/preview/mmwrhtml/mm4829a1.htm. Accessed July 2017.
4. American Society of Clinical Oncology’s CancerProgress.net. Major Milestones in Cancer. Available at http://www.cancerprogress.net/resources?category=major-milestones-against cancer#downloads. Accessed July 2017.
4 a: Müller D, Ellen M, Duffy M, et al. Timeline: 200 Years of the New England Journal of Medicine. N Engl J M 2012; 366:e 3. January 5, 2012. DOI: 10.1056/NEJMp1114819. Available at http://www.nejm.org/doi/full/10.1056/NEJMp1114819. Accessed July 2017.4 b: Vaccine Timeline. Immunize.org. Accessed July 2017.4 c: Bicket D P. Using ACE Inhibitors Appropriately. American Family Physician. Available at http://www.aafp.org/afp/2002/0801/p461.pdf. Accessed July 2017.4 d: Alzheimer’s Association. Major Milestones in Alzheimer’s and Brain Research. Available at http://www.alz.org/research/science/major_milestones_in_alzheimers.asp. Accessed July 2017. 4 e: American Society of Clinical Oncology. Cancer Progress Timeline. Available at https://www.asco.org/research-progress/cancer-progress/cancer-progress-timeline. Accessed July 2017.4 f: National Gaucher Foundation, Inc. Gaucher disease treatments and drugs. Available at http://www.gaucherdisease.org/gaucher-disease-treatments.php. Accessed July 2017.4 g: FDA.gov. HIV/AIDS Historical Time Line 1981-1990. Available at https://www.fda.gov/forpatients/illness/hivaids/history/ucm151074.htm. Accessed July 2017. 4 h: FDA.gov. Hematology/Oncology (cancer) Approvals & Safety Notifications: Previous News Items. Available at https://www.fda.gov/drugs/informationondrugs/approveddrugs/ucm279177.htm. Accessed July 2017.4 i: Cheng-Hwa MA C, et al. The Role of Surfactant in Respiratory Distress Syndrome. Open Respiratory Medicine Journal. Available at https://www.ncbi.nlm.nih.gov/pmc/articles/PMC3409350/. Accessed July 2017.4 j: Diagnosis & Treatment. Memorial Sloan Kettering Cancer Center. Available at https://www.mskcc.org/cancer-care/types/multiple-myeloma/approach/chemotherapy-immune-modifying-drugs-proteasome-inhibitors. Accessed July 2017.4 k: Drugs@FDA: FDA Approved Drug Products. Available at https://www.accessdata.fda.gov/scripts/cder/daf/index.cfm?event=overview.process&ApplNo=125085. Accessed July 2017. 4 l: Frishman W H. Cardiology Today, December 2008. Fifty years of beta-blockers: a revolution in CV pharmacotherapy. Available at https://www.healio.com/cardiology/vascular-medicine/news/print/cardiology-today/%7B58d8999e-a18c-4f8a-a747-38e2a1620e52%7D/fifty-years-of-beta-blockers-a-revolution-in-cv-pharmacotherapy. Accessed July 2017. 4 m: Drugs@FDA: FDA Approved Drug Products. Colorectal Cancer. Available at https://www.accessdata.fda.gov/scripts/cder/daf/index.cfm?event=overview.process&ApplNo=125147. Accessed July 2017.4 n: National Cancer Institute. FDA Approval for Decitabine. Available at https://www.cancer.gov/about-cancer/treatment/drugs/fda-decitabine. Accessed July 2017.4 o: American Society for Clinical Oncology. Cancer Progress Timeline. Melanoma Stat. Available at http://www.asco.org/research-progress/cancer-progress/cancer-progress-timeline. Accessed July 2017.4 p: Raedler LA. NCBI. Keytruda (Pembrolizumab): First PD-1 Inhibitor Approved for Previously Treated Unresectable or Metastatic Melanoma. Available at https://www.ncbi.nlm.nih.gov/pmc/articles/PMC4665064/. Accessed July 2017.4 q: National Cancer Institute. FDA Approval for Ibrutinib. Available at https://www.cancer.gov/about-cancer/treatment/drugs/fda-ibrutinib. Accessed July 2017.4 r: U.S. Food and Drug Administration. Drug Approval Package Plavix. Available at https://www.accessdata.fda.gov/drugsatfda_docs/nda/2002/20-839s019_ClopidogrelPlavix.cfm. Accessed July 2017.
5. Jones D S, Podolsky SH, Greene JA. The burden of disease and the changing task of medicine. N Engl J Med 2012;366(25):2333-8. Accessed August 2017.
6. Kochanek K D, Murphy S L, Xu J, Tejada-Vera B. Division of Vital Statistics. U.S. Department of Health and Human Services. Centers for Disease Control and Prevention. National Vital Statistics Reports. Volume 65, Number 4. June 30,2016. Table 1. Number of deaths, death rates, and age-adjusted death rates, by race and sex: United States, 1940, 1950, 1960, 1970, and 1980–2014—Con. Available at https://www.cdc.gov/nchs/data/nvsr/nvsr65/nvsr65_04.pdf. Accessed July 2017.
6 a: Pharmaceutical Research and Manufacturers of America (PhRMA). 2015 Profile: Biopharmaceutical Research Industry. Table 1: Domestic R&D and R&D Abroad, PhRMA Member Companies: 1980-2014. Available at http://www.phrma.org/sites/default/files/pdf/2014_PhRMA_PROFILE.pdf. Accessed July 2017.6b: Sherry L. Murphy, B.S., et. Al., Division of Vital Statistics. Division of Vital Statistics. U.S. Department of Health and Human Services. Centers for Disease Control and Prevention. National Vital Statistics Reports. Volume 66, Number 6. November 27, 2017. Table 1. Number of deaths, death rates, and age-adjusted death rates, by race and sex: United States, 1940, 1950, 1960, 1970, and 1980–2014—Con. Available at https://www.cdc.gov/nchs/data/nvsr/nvsr66/nvsr66_06.pdf. Accessed April 2018. 6 c: Pharmaceutical Research and Manufacturers of America (PhRMA) 2018 Chart Pack. Available at https://www.phrma.org/report/chart-pack-biopharmaceuticals-in-perspective-summer-2018. Accessed January 2019.

1 | VIRTUOUS CYCLE OF MEDICAL INNOVATION
Notes and Sources (cont.)
21
7. The Hamilton Project at the Brookings Institution. Deaths from Major Infectious Diseases. Available at http://www.hamiltonproject.org/multimedia/charts/deaths_from_major_infectious_disease/. Accessed July 2017.
7 a: U.S. Food & Drug Administration. Approval of Sovaldi (sofosbuvir) tablets for the treatment of chronic hepatitis C. Available at https://www.fda.gov/forpatients/illness/hepatitisbc/ucm377920.htm\ Accessed July 2017.
8. Health, United States, 2011: With Special Feature on Socioeconomic Status and Health. Available at http://www.cdc.gov/nchs/index.htm. Accessed July 2017.
8 a: United Nations Development Program. World Population Prospects The 2017 Revision. Volume 1: Comprehensive Tables. Available at https://esa.un.org/unpd/wpp/Publications/Files/WPP2015_Volume-I_Comprehensive-Tables.pdf. Accessed July 2017. 8 b: Nonprofit and Voluntary Sector Quarterly. 2008: Supplement to vol 37; no 1: 63S-75S. Available at http://www.who.int/global_health_histories/seminars/presentation07.pdf. Accessed July 2017.8 c: World Health Organization. Global Health Observatory Data. Available at https://www.who.int/gho/mortality_burden_disease/life_tables/situation_trends/en/. Accessed January 2019.8 d: Trouth, CO, Wagner M, Barrow J. Universal Health Care Problems In The UnitedHealth States Of America Paperback. Available at https://books.google.com/books?id=82kMQmJ-B-4C&pg=PA14&lpg=PA14&dq=New+drugs+are+no+small+part+of+this+medical+miracle&source=bl&ots=lN-yHe0iKn&sig=aceHmC0yatNqyB4bH7D5ovO9R0Q&hl=en&sa=X&ved=0ahUKEwjs3-bI6sHXAhWs6YMKHVu7D2EQ6AEIKDAA#v=onepage&q=New%20drugs%20are%20no%20small%20part%20of%20this%20medical%20miracle&f=false. Accessed November 2017.8 e: NCHS Data Brief; No. 293. December 2017. Mortality in the United States, 2016. Available at https://www.cdc.gov/nchs/data/databriefs/db293.pdf. Accessed January 2019.
9. Van Panhuis, WG, et al. (18, November 2013). Contagious Disease in the United States from 1888 to the Present. N Engl J Med, 369(22). Available at http://jimlund.org/blog/pics/Panhuis.2013.NEJM.v369.Contagious_Diseases_in_the_United_States_from_1888_to_the_Present.pdf. Accessed January 2017.
9 a: Zhou, F, et al. (2014). Economic Evaluation of the Routine Childhood Immunization Program in the United States, 2009. Pediatrics, 133(4). Available at http://pediatrics.aappublications.org/content/133/4/577. Accessed July 2017.9 b: WHO, UNICEF, World Bank. (2009) State of the world’s vaccines and immunization, 3rd ed. Available on http://www.who.int/immun ization/sowvi/en/. Accessed July 2017.9 c: Gavi; The Vaccine Alliance. Quotes and Soundbites: President Ibrahim Boubacar Keita, Republic of Mali. Available at http://www.gavi.org/pledging2015/quotes/. Accessed July 2017.9 d: The Value of Investing in Vaccines. Johns Hopkins Bloomberg School of Public Health. Available at http://www.jhsph.edu/research/centers-and-institutes/ivac/resources/vaccine-cost-effectiveness.html. Accessed July 2017.
10. Truven Health Analytics. Available at http://truvenhealth.com/Portals/0/Assets/Life-Sciences/White-Papers/pharma-innovation-hiv-aids-treatment.pdf. M Kean, T Lessor (Eds.), “Sustaining Progress Against Cancer in an Era of Cost Containment Discussion Paper,” June 2012. Available at www.TurningTheTideAgainstCancer.org.
10 a: Duggan MG, Evans WN. Estimating the impact of medical innovation: A case study of HIV antiretroviral treatments. National Bureau of Economic Research Working Paper 11109. Issued in February, 2005. Available at http://www.nber.org/digest/apr05/w11109.html. Accessed July 2017.
10 b: National Center for Health Statistics. Health, United States, 2015: With Special Feature on Racial and Ethnic Disparities, table 17. Hyattsville, MD: NCHS, 2011. Available at https://www.cdc.gov/nchs/data/hus/hus15.pdf#019. Accessed July 2017.
10 c: Kean MA. Sustaining Progress Against Cancer in an Era of Cost Containment. June 2012. Available at http://www.turningthetideagainstcancer.org/sustaining-progress-discussion-paper.pdf. Accessed November 2017.
11. Trickey, Adam et al. Survival of HIV-positive patients starting antiretroviral therapy between 1996 and 2013: a collaborative analysis of cohort studies. The Lancet HIV, Volume 0, Issue 0. Available at http://thelancet.com/journals/lanhiv/article/PIIS2352-3018(17)30066-8/fulltext. Accessed July 2017.
11 a: UNAIDS Release. GROUNDBREAKING TRIAL RESULTS CONFIRM HIV TREATMENT PREVENTS TRANSMISSION OF HIV. Available at http://www.unaids.org/en/resources/presscentre/pressreleaseandstatementarchive/2011/may/20110512pstrialresults. Accessed July 2017.11 b: Masters J. CNN. Modern HIV Drugs can Add 10 Years to Life Expectancy, Study Says. Available at http://www.cnn.com/2017/05/11/health/hiv-life-expectancy-increase-europe-north-america-us/index.html. Accessed October 2017.

6 | WHO IS CELGENE? 22
1 | VIRTUOUS CYCLE OF MEDICAL INNOVATION 22

2
2 | LIVING LONGER, BETTER & HEALTHIER
LIVING LONGER, BETTER AND HEALTHIERRECENT MEDICAL INNOVATIONS IN CANCER ARE LEADING TO LONGER LIFE, BETTER HEALTH AND IMPROVED QUALITY OF LIFE.
This section will show what has been accomplished over the last few decades. There has been substantial progress in helping some people become free from cancers – allowing them to live longer, healthier lives.
Innovative cancer treatments have been shown to contribute significantly to survival gains in cancer. In addition, as with other diseases, some people treated for cancer can live and prosper as well as someone without the illness.
23
Sheree Pask was diagnosed with multiple myeloma

6 | WHO IS CELGENE? 24
2 | LIVING LONGER, BETTER & HEALTHIER 24

In 2005, a man diagnosed with multiple myeloma askedme if he would be alive to watch his daughter graduatefrom high school in a few months. In 2009, bound to awheelchair, he watched his daughter graduate fromcollege. The wheelchair had nothing to do with hiscancer. The man had fallen down while coaching hisyoungest son's baseball team.
“”
Dr. Siddhartha Mukherjee
Author, The Emperor of All Maladies
2011
25

6 | WHO IS CELGENE? 26
2 | LIVING LONGER, BETTER & HEALTHIER
Milestones in War Against Cancer in the U.S.
26
Cure of acute lymphoblastic leukemia &
Hodgkin’s disease(1963-1970)
Model development
Nitrogen mustard in lymphomas
Antifolates
5-Fluorouracil
Methotrexate in choriocarcinoma
Antitumorantibiotics
Vinca alkaloids
Adjuvant chemotherapy(1968-1975)
Cure of testicular
cancer
First monoclonal antibody approved
Molecularprofiling
Genome sequenced,epigenetics
Tyrosine kinase inhibitors
Target-specificscreens
Personalized medicine
Major advances in the history ofcancer treatment
Advances in drug screening
Events with national impact
Advances in cancer therapeutics
KEY
Cancer linked to
oncogenes
Checkpoint inhibitors
National Cancer Act
Approval of hepatitis B vaccine
Approval of PSA test
Approval of first vaccine to prevent HPV
NCI investment inmolecular biology
Discovery of CAR T-Cell therapy
Immunomodulators, nanotechnology
Source 1: DeVita V, Chu E. A History of Cancer Chemotherapy. Cancer Res 2008;68:8643-8653. Accessed June, 2015. ©2008 by American Association for Cancer Research. Available at cancerres.aacrjournals.org. Accessed August 2017.Source 1 a: Development of Modern Knowledge about Cancer Causes. (n.d.). Available at https://www.cancer.org/cancer/cancer-basics/history-of-cancer/modern-knowledge-and-cancer-causes.html. Accessed August 2017.Source 1 b: Hepatitis B Foundation. History of Hepatitis B Vaccine History. Available at http://www.hepb.org/prevention-and-diagnosis/vaccination/history-of-hepatitis-b-vaccine/. Accessed July, 2017.Source 1 c: National Cancer Institute. Prostate Specific Antigen (PSA) test. Available at https://www.cancer.gov/types/prostate/psafactsheet. Accessed July, 2017.
Source 1 d: U.S. Food and Drug Administration. June 12, 2008 Approval Letter Human Papillomavirus Quadrivalent (Types 6, 11, 16, 18) Vaccine, Recombinant. Available at https://www.fda.gov/BiologicsBloodVaccines/Vaccines/ApprovedProducts/ucm111282.htm. Accessed November 2017.Source 1 e: U.S. Food and Drug Administration. Lenalidomide (Revlimid). Available at https://www.fda.gov/Drugs/InformationOnDrugs/ApprovedDrugs/ucm542791.htm. Accessed November 2017.
Source 1 f: National Cancer Institute. The Abraxane® Story: A Nanoparticle Platform Delivers Improved Anticancer Activity. Available at http://nano.cancer.gov/action/news/nanotech_news_2006-01-30e.asp. Accessed August 2017.Source 1 g: Alexander W. The Checkpoint Immunotherapy Revolution. P&T Journal. Available at https://www.ncbi.nlm.nih.gov/pmc/articles/PMC4771089/. Accessed November 2017.Source 1 h: Chaudhary P M. Dr. Chaudhary on History of CAR T-Cell Therapy. OncLive. Available at http://www.onclive.com/printer?url=/onclive-tv/dr-chaudhary-on-history-of-car-tcell-therapy. Accessed October 2017.
Source 1 i: Jain, KK. Personalized medicine. Curr Op Mol Ther. 2002;4(6):548-558. Available at https://www.ncbi.nlm.nih.gov/pubmed/12596356. Accessed August 2017.

2 | LIVING LONGER, BETTER & HEALTHIER
Medical Progress: A Driver in Increased Life Expectancy
27
Source 2: National Vital Statistics Report. Centers for Disease Control and Prevention and National Center for Health Statistics. Table 22: Life expectancy at birth, at age 65, and at age 75, by sex, race, and Hispanic origin: United States, selected years 1900-2010. Available at https://www.cdc.gov/nchs/data/nvsr/nvsr65/nvsr65_04.pdf. Accessed August 2017. Source 2 a: Centers for Disease Control. Table 17. Age Adjusted Death Rates 1950 – 2014. Available at https://www.cdc.gov/nchs/data/hus/2017/017.pdf. Accessed January 2019.
Source 2 b: Mortality in the United States, 2016. Available at https://www.cdc.gov/nchs/data/databriefs/db293.pdf. Accessed April 2018.
Source 2 c: Health United States, 2016. Available at https://www.cdc.gov/nchs/data/hus/hus16.pdf#019. Accessed August 2017.
* y-axis skips from 0 to 64, and then continues in intervals of 2 from there on
0
Life Expectancy at Birth
1950 APPROXIMATELY
194,000
APPROXIMATELY
156,000
Deaths due to cancer(age adjusted)
2016
62
64
66
68
70
72
74
76
78
80
1950 1960 1970 1980 1990 2000 2010 2013 2014 2015 2016
Age

6 | WHO IS CELGENE? 28
2 | LIVING LONGER, BETTER & HEALTHIER
The Number of Cancer Survivors is Steadily Rising
28
The continued increase in survival is in part attributable to earlier detection and better treatments.
3 million
9.8 million
15.5 million
19 million
0
5
10
15
20
1971 2001 2016 2024
U.S. Cancer Survivors Over Time
Source 3: American Cancer Society. Facts & Figures 2018: Rate of Deaths From Cancer Continues Decline. Available at https://www.cancer.org/latest-news/facts-and-figures-2018-rate-of-deaths-
from-cancer-continues-decline.html. Accessed April 2018.
Source 3 a: Centers for Disease Control and Prevention, “Cancer Survivors-United States, 2007,” 10 March 2011,
http://www.cdc.gov/cancer/survivorship/what_cdc_is_doing/research/survivors_article.htm. R Siegel, et al. Cancer Treatment and Survivorship Statistics, 2012.
CA: A cancer Journal for Clinicians. Doi: 10.3322/caac.21149. Accessed November 2017.
Source 3 b: DeSantis CE. Cancer Journal for Clinicians. Cancer treatment and survivorship statistics, 2014. Available at http://onlinelibrary.wiley.com/doi/10.3322/caac.21235/full. Accessed August
2017.
*
*2024 data is estimated

2 | LIVING LONGER, BETTER & HEALTHIER
Cancer-Related Death Rates are Declining
29
5-Year Relative Survival Rates of Cancer Patients are Increasing
5-year relative survival
rates (%)
Deaths per
100,000
48.9 49 61.0 52.455.3
59.9 64.0 63.365.9 67.1 68.6 69.2
30
40
50
60
70
80
1975-1977 1978-1980 1981-1983 1984-1986 1987-1989 1990-1992 1993-1995 1996-1998 1999-2001 2002-2004 2005-2007 2008-2014
120
140
160
180
200
220
1992 1993 1994 1995 1996 1997 1998 1999 2000 2001 2002 2003 2004 2005 2006 2007 2008 2009 2010 2012 2013 2014 2015 2016
0
0
Source 4: Centers for Disease Control and Prevention (CDC). Health, United States, 2012. Table 28: Death Rates for Malignant Neoplasms by Sex, Race, Hispanic Origin, and Age: United States, Selected Years 1950–2016. Available at https://www.cdc.gov/nchs/hus/contents2017.htm#Table_017. Accessed January 2019.Source 4 a: National Cancer Institute, Surveillance, Epidemiology, and End Results (SEER) Program. SEER Cancer Statistics Review, 1975-2015. 5-Year Relative and Period Survival (Percent) by Race, Diagnosis Year, Stage and Age. Available at https://seer.cancer.gov/csr/1975_2015/results_merged/sect_02_all_sites.pdf. Accessed May 2018.

6 | WHO IS CELGENE? 30
2 | LIVING LONGER, BETTER & HEALTHIER
Steady Decline in Cancer Death Rates
30
Percent change by decade in
U.S. death rates from
cancer
Source 5: Centers for Disease Control and Prevention (CDC). Health, United States, 2012. Table 28: Death Rates for Malignant Neoplasms by Sex, Race, Hispanic Origin, and Age: United States, Selected Years 1950–2016. Available at https://www.cdc.gov/nchs/hus/contents2017.htm#Table_017. Accessed January 2019.
According to the American Cancer Society, improvements in treatment are contributing to increases in cancer survival.
1991-2000 2001-2010 2011-2016Total Decline(1991 – 2016)
0%
-5%
-10%
-15%
-20%
-25%
-7.3%
-12.1%
-7.8%
-27%

2 | LIVING LONGER, BETTER & HEALTHIER
Globally, Death Rates Across Common Cancer Sites Have Declined
31
Source 6: Centers for Disease Control and Prevention (CDC). Health, United States, 2012. Table 28: Death Rates for Malignant Neoplasms by Sex, Race, Hispanic Origin, and Age: United States, Selected Years 1950–2016. Available at https://www.cdc.gov/nchs/hus/contents2017.htm#Table_017. Accessed January 2019. Source 6 a: Hashim D et al. The global decrease in cancer mortality: trends and disparities. Annals of Oncology. Available at https://academic.oup.com/annonc/article/27/5/926/2769784/The-global-decrease-in-cancer-mortality-trends-and. Accessed August 2017.
As a result of continued research improving patient outcomes in cancer, mortality rate decreased 27% from 1991 to 2016 in the U.S.
1991
2016
27%
Mortality is Decreasing Across Common Cancer Sites: 2000 – 2010
6 | WHO IS CELGENE? 32
2 | LIVING LONGER, BETTER & HEALTHIER
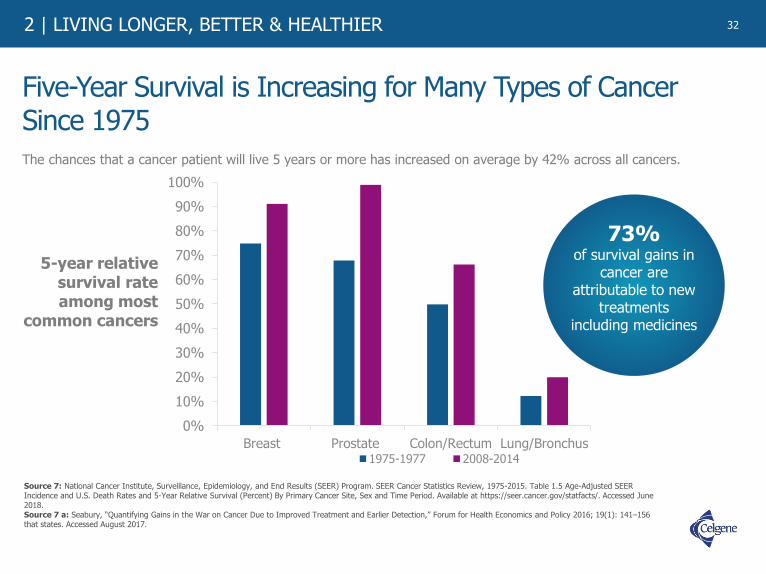
Five-Year Survival is Increasing for Many Types of Cancer Since 1975
The chances that a cancer patient will live 5 years or more has increased on average by 42% across all cancers.
32
0%
10%
20%
30%
40%
50%
60%
70%
80%
90%
100%
Breast Prostate Colon/Rectum Lung/Bronchus1975-1977 2008-2014
73%of survival gains in
cancer are attributable to new
treatments including medicines
5-year relative survival rate among most
common cancers
Source 7: National Cancer Institute, Surveillance, Epidemiology, and End Results (SEER) Program. SEER Cancer Statistics Review, 1975-2015. Table 1.5 Age-Adjusted SEER Incidence and U.S. Death Rates and 5-Year Relative Survival (Percent) By Primary Cancer Site, Sex and Time Period. Available at https://seer.cancer.gov/statfacts/. Accessed June 2018. Source 7 a: Seabury, “Quantifying Gains in the War on Cancer Due to Improved Treatment and Earlier Detection,” Forum for Health Economics and Policy 2016; 19(1): 141–156 that states. Accessed August 2017.

2 | LIVING LONGER, BETTER & HEALTHIER
0%
20%
40%
60%
80%
100%
Mid-1970s 2015
Survival Rates for Childhood Cancers Have Increased 43% Over the Last Several Decades
33
Source 8: American Cancer Society. Cancer Facts & Figures 2016. Available at https://www.cancer.org/content/dam/cancer-org/research/cancer-facts-and-statistics/annual-cancer-facts-and-figures/2016/cancer-facts-and-figures-2016.pdf. Accessed August 2017.
5-year relative survival
rates based on year of diagnosis
(%)
58%
83%
6 | WHO IS CELGENE? 34
2 | LIVING LONGER, BETTER & HEALTHIER
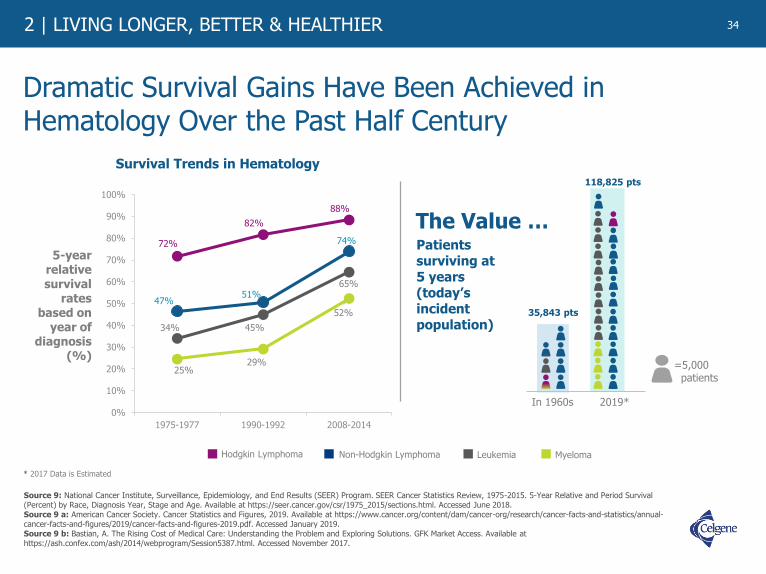
Dramatic Survival Gains Have Been Achieved in Hematology Over the Past Half Century
34
Source 9: National Cancer Institute, Surveillance, Epidemiology, and End Results (SEER) Program. SEER Cancer Statistics Review, 1975-2015. 5-Year Relative and Period Survival (Percent) by Race, Diagnosis Year, Stage and Age. Available at https://seer.cancer.gov/csr/1975_2015/sections.html. Accessed June 2018. Source 9 a: American Cancer Society. Cancer Statistics and Figures, 2019. Available at https://www.cancer.org/content/dam/cancer-org/research/cancer-facts-and-statistics/annual-cancer-facts-and-figures/2019/cancer-facts-and-figures-2019.pdf. Accessed January 2019.Source 9 b: Bastian, A. The Rising Cost of Medical Care: Understanding the Problem and Exploring Solutions. GFK Market Access. Available at https://ash.confex.com/ash/2014/webprogram/Session5387.html. Accessed November 2017.
72%
82%
88%
47%51%
74%
34% 45%
65%
25%29%
52%
0%
10%
20%
30%
40%
50%
60%
70%
80%
90%
100%
1975-1977 1990-1992 2008-2014
Survival Trends in Hematology
5-year relative survival
rates based on
year of diagnosis
(%)
In 1960s 2019*
Patients surviving at 5 years (today’s incident population)
The Value …
=5,000 patients
35,843 pts
118,825 pts
* 2017 Data is Estimated
Hodgkin Lymphoma Non-Hodgkin Lymphoma Leukemia Myeloma

2 | LIVING LONGER, BETTER & HEALTHIER
Medical Advances and More Precise Treatment Have Transformed Cancer Diagnosis
35
Source 10: M Aspinal, former President Genzyme Genetics (http://www.comtecmed.com/biomarker/2014/Uploads/Editor/PDF/ppt/Edward%20Abrahams_Key%20Note%20Lecture.pdf)l; National Cancer Institute,; SEER Cancer Statistics Review, 1975-2011. Available at http://seer.cancer.gov/csr/1975_2011/, based on November 2013 SEER data submission, posted to the SEER web site, April 2014; PhRMA, “Medicines in Development for Leukemia & Lymphoma,” April 2015 (all sites accessed May 2015). Accessed August 2017.
A greater understanding of the molecular basis of disease has transformed what was once known collectively as “disease of the blood,” into multiple subtypes of leukemias and lymphomas, opening up new treatment approaches.
60 YEARS AGO
“Disease of the Blood”
50 YEARS AGO
Leukemia
Lymphoma
40 YEARS AGO
Chronic Leukemia
Acute Leukemia
Pre-leukemia
Indolent Lymphoma
Aggressive Lymphoma
TODAY
~ 40 UniqueLeukemia
Types Identified
~ 50 UniqueLymphoma
Types Identified
Over the past 60 years, 5-year
survival rateshave grown as
high as
70%in some cases
6 | WHO IS CELGENE? 36
2 | LIVING LONGER, BETTER & HEALTHIER 36
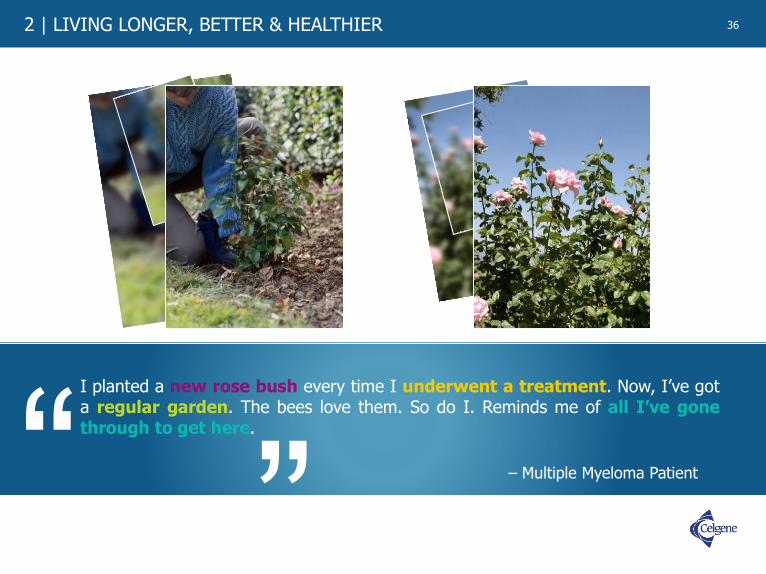
I planted a new rose bush every time I underwent a treatment. Now, I’ve gota regular garden. The bees love them. So do I. Reminds me of all I’ve gonethrough to get here.
– Multiple Myeloma Patient“ ”

2 | LIVING LONGER, BETTER & HEALTHIER
The Future is Bright for Patients with Myeloma
37
…We are very close to making
myeloma a chronic and manageable
disease. Myeloma is a small disease with a
big impact on the way we treat cancer.
“
Susie NovisPresident and Co-FounderInternational Myeloma Foundation
“
Source 11: International Myeloma Foundation. The International Myeloma Foundation Says New Studies Show Longer Survival for Myeloma Patients and Improved Response to Treatments. Available at http://www.businesswire.com/news/home/20080531005029/en/International-Myeloma-Foundation-New-Studies-Show-Longer. Accessed September 2017.

6 | WHO IS CELGENE? 38
2 | LIVING LONGER, BETTER & HEALTHIER
Relative Survival Rate for Multiple Myeloma Patients Soars Between 2001 and 2014
38
* Based on recent trends in the 5-year relative survival rate, for myeloma patients diagnosed in 2014, the relative overall survival rate may have reached as high as 66%** y-axis skips from 0 to 22 and then continues in intervals of 4 from there on
5-year
relative
survival
rates (%)
based on
year of
diagnosis
24.6 25.927.5 27.3 27.2
29.331.7 32.5 34.6
42.5
18
22
26
30
34
38
42
46
50
54
58
62
66
1975-1977 1978-1980 1981-1983 1984-1986 1987-1989 1990-1992 1993-1995 1996-1998 1999-2001 2002-2004 2005-2007 2008-20140**
Year of diagnosis
46.4
10 Therapies Approved During this Time
Source 12: National Cancer Institute, Surveillance, Epidemiology, and End Results (SEER) Program. SEER Cancer Statistics Review, 1975-2015. 5-Year Relative and Period Survival (Percent) by Race, Diagnosis Year, Stage and Age. Available at https://seer.cancer.gov/csr/1975_2015/results_merged/sect_18_myeloma.pdf. Accessed June 2018. Source 12 a: National Cancer Institute. Drugs Approved for Multiple Myeloma and Other Plasma Cell Neoplasms. Available at https://www.cancer.gov/about-cancer/treatment/drugs/multiple-myeloma. Accessed September 2017.
52.4

2 | LIVING LONGER, BETTER & HEALTHIER
Advancements in Multiple Myeloma Therapies Have the Potential to Increase Quality of Life
39
“Michel Delforge, MD, PhDUniversity Hospital Leuven in Belgium
We believe that this improvement in health-related
quality of life with [novel therapies] and specifically the reduction in treatment-related
side effects, may facilitate patient adherence. Longer treatment
duration and better adherence may improve outcomes for
the patient.
”Source 13: Harrison C. Quality of Life: An Increasingly Important Feature of Myeloma Treatment. Cancer Therapy Advisor. Available at http://www.cancertherapyadvisor.com/side-effect-management/multiple-myeloma-quality-life-more-important-feature-treatment/article/547105/2/. Accessed August 2017.

6 | WHO IS CELGENE? 40
2 | LIVING LONGER, BETTER & HEALTHIER
Three-year Survival Rates of Patients with Myelodysplastic Syndromes (MDS) Have Seen an Increase
40
42%35%
Source 14: Ma, X. Myelodysplastic syndromes: incidence and survival in the United States. Cancer. 2007 Apr 15;109(8):1536-42. Source 14 a: Ma X. Epidemiology of Myelodysplastic Syndromes. Am J Med. 2012 Jul; 125(7 Suppl): S2–S5.
+20%Relative Increase

2 | LIVING LONGER, BETTER & HEALTHIER
Patient Survival in Acute Myeloid Leukemia (AML) Continues to Increase
41
5-year relative survival
rates (%) based on
year of diagnosis
6.27.6
8.4
10.611.5
13.8
16.217.0
19.2
23.425.1
28.1
0
5
10
15
20
25
30
1975-1977 1978-1980 1981-1983 1984-1986 1987-1989 1990-1992 1993-1995 1996-1998 1999-2001 2002-2004 2005-2007 2008-2014
Source 15: National Cancer Institute, Surveillance, Epidemiology, and End Results (SEER) Program. SEER Cancer Statistics Review, 1975-2010. Table 13.16: Myeloid Leukemia, 5-Year Relative and Period Survival (Percent) by Race, Sex, Diagnosis Year and Age. Available at http://seer.cancer.gov/archive/csr/1975_2010/results_merged/sect_13_leukemia.pdf. Accessed August 2015. Source 15 a: National Cancer Institute, Surveillance, Epidemiology, and End Results (SEER) Program. SEER Cancer Statistics Review, 1975-2015. 5-Year Relative and Period Survival (Percent) by Race, Diagnosis Year, Stage and Age. Available at https://seer.cancer.gov/csr/1975_2015/results_merged/sect_13_leukemia.pdf. Accessed June 2018.Source 15 b: Freireich EJ. Et al. The Leukemias: A Half-Century of Discovery. Journal of Clinical Oncology. Available at http://ascopubs.org/doi/pdf/10.1200/JCO.2014.57.1034. Accessed October 2017.
ACST*
*ACST = allogeneic stem-cell transplantation for patients with AML
Idarubicin

6 | WHO IS CELGENE? 42
2 | LIVING LONGER, BETTER & HEALTHIER
Chronic Myeloid Leukemia (CML) Patients Benefiting from Medical Innovation
42
Source 16: National Cancer Institute, Surveillance, Epidemiology, and End Results (SEER) Program. SEER Cancer Statistics Review, 1975-2010. Table 13.16: Myeloid Leukemia, 5-Year Relative and Period Survival (Percent) by Race, Sex, Diagnosis Year and Age. Available at http://seer.cancer.gov/archive/csr/1975_2010/results_merged/sect_13_leukemia.pdf. Accessed July 2017. Source 16 a: National Cancer Institute, Surveillance, Epidemiology, and End Results (SEER) Program. SEER Cancer Statistics Review, 1975-2015. 5-Year Relative and Period Survival (Percent) by Race, Diagnosis Year, Stage and Age. Available at https://seer.cancer.gov/csr/1975_2015/results_merged/sect_13_leukemia.pdf. Accessed June 2018.Source 16 b: Weissman I L, et al. The origins of the identification and isolation of hematopoietic stem cells, and their capability to induce donor-specific transplantation tolerance and treat autoimmune diseases. Blood. Blood. 2008 Nov 1; 112(9): 3543–3553. doi: 10.1182/blood-2008-08-078220. Available at https://www.ncbi.nlm.nih.gov/pmc/articles/PMC2574516/. Accessed September 2017.Source 16 c: Food and Drug Administration. Drugs@FDA: FDA Approved Drug Products. Gleevec (Imatinib). Available at https://www.accessdata.fda.gov/scripts/cder/daf/index.cfm?event=overview.process&ApplNo=021335. Accessed September 2017.Source 16 d: Pophali, P. National Cancer Institute. The Role of New Tyrosine Kinase Inhibitors in Chronic Myeloid Leukemia. Cancer Journal. Available at https://www.ncbi.nlm.nih.gov/pmc/articles/PMC4742366/. Accessed September 2017.
* SCT = allogenic stem cell transplant** TKIs = Tyrosine Kinase Inhibitors
5-year relative survival
rates (%) based on
year of diagnosis
21.7 23.428.2
22.4
30.3 30.735.5 37.1
47.3
54.2
62.2
68.7
0
10
20
30
40
50
60
70
80
1975-1977 1978-1980 1981-1983 1984-1986 1987-1989 1990-1992 1993-1995 1996-1998 1999-2001 2002-2004 2005-2007 2008-2014
1st GenerationTKIs**
2nd GenerationTKIs**
SCT*

2 | LIVING LONGER, BETTER & HEALTHIER
Improving Non-Hodgkin Lymphoma (NHL) Diagnosis and Survival
43
5-year relative survival
rates (%) based on
year of diagnosis
46.547.9
50.6 51.6 50.9 50.752.6
58.8
63.9
69.871.1
74.1
35
40
45
50
55
60
65
70
75
80
1975-1977 1978-1980 1981-1983 1984-1986 1987-1989 1990-1992 1993-1995 1996-1998 1999-2001 2002-2004 2005-2007 2008-2014
* y-axis skips from 0 to 40, and then continues in intervals of 5 from there on** CHOP = cyclophosphamide, doxorubicin, vincristine, prednisone*** mAB = monoclonal antibodies
CD20-mABs***+ CHOP
CHOP**
Source 17: National Cancer Institute, Surveillance, Epidemiology, and End Results (SEER) Program. SEER Cancer Statistics Review, 1975-2015. 5-Year Relative and Period Survival (Percent) by Race, Diagnosis Year, Stage and Age. Available at https://seer.cancer.gov/csr/1975_2015/results_merged/sect_19_nhl.pdf. Accessed June 2018.Source 17 a: Alduaji, W and Illidge T M. The future of anti-CD20 monoclonal antibodies: are we making progress? Blood. 2011 117:2993-3001; doi: https://doi.org/10.1182/blood-2010-07-298356 . Available at http://www.bloodjournal.org/content/117/11/2993?variant=fulltext&ssochecked=True. Accessed September 2017. Source 17 b: Fisher R I, Gaynor E G, et al. Comparison of a Standard Regimen (CHOP) with Three Intensive Chemotherapy Regimens for Advanced Non-Hodgkin's Lymphoma. New England Journal of Medicine. Available at http://www.nejm.org/doi/full/10.1056/NEJM199304083281404#t=articleBackground. Accessed September 2017.
*0

6 | WHO IS CELGENE? 44
2 | LIVING LONGER, BETTER & HEALTHIER
Advances Continue in Breast Cancer
44
5-year relative survival
rates (%) based on
year of diagnosis*
74.8 74.476.1
78.9
84.085.2
86.488.2
89.7 90.090.8 91.1
65
70
75
80
85
90
95
100
1975-1977 1978-1980 1981-1983 1984-1986 1987-1989 1990-1992 1993-1995 1996-1998 1999-2001 2002-2004 2005-2007 2008-2014
*Only data for female cancer patients are included
** y-axis skips from 0 to 70, and then continues in intervals of 5 from there on
0**
Source 18: National Cancer Institute, Surveillance, Epidemiology, and End Results (SEER) Program. SEER Cancer Statistics Review, 1975-2015. 5-Year Relative and Period Survival (Percent) by Race, Diagnosis Year, Stage and Age. Available at https://seer.cancer.gov/csr/1975_2015/results_merged/sect_04_breast.pdf. Accessed June 2018.

2 | LIVING LONGER, BETTER & HEALTHIER
Long-term Breast Cancer Survivors Showed Quality of Life Improvement Similar to that of Their Non-Cancer Counterparts
45
Source 19: DOI: 10.1200/JCO.2012.48.1903 Journal of Clinical Oncology 31, no. 28 (October 2013) 3540-3548. Available at http://ascopubs.org/doi/abs/10.1200/jco.2012.48.1903. Accessed on July 2017.
Studies have found survivors who have been treated showed marked improvements in social and role functioning by 1 year post-diagnosis compared to their non-cancer counterparts, with similar quality of life reported on average 12.5 years post-diagnosis.
According to the European Organization for Research and Treatment of Cancer Quality of Life Questionnaire pain symptom scale,survivors, on average, had less pain at long-term follow up than controls. Lower pain symptoms in breast cancer survivors compared with the general population were reported in one prior study.
79% to 82% of Breast Cancer survivors
return to work within the first year
post-diagnosis

6 | WHO IS CELGENE? 46
2 | LIVING LONGER, BETTER & HEALTHIER
Lung Cancer Five-Year Survival Rate on the Rise
46
Source 20: National Cancer Institute, Surveillance, Epidemiology, and End Results (SEER) Program. SEER Cancer Statistics Review, 1975-2015. 5-Year Relative and Period Survival (Percent) by Race, Diagnosis Year, Stage and Age. Available at https://seer.cancer.gov/csr/1975_2015/results_merged/sect_15_lung_bronchus.pdf. Accessed June 2018.
5-year relative survival
rates (%) based on
year of diagnosis
* y-axis skips from 0 to 10, and then continues in intervals of 1 from there on
12.212.8
13.112.8 13.0
13.6
14.314.6
15.3
16.1
17.8
19.9
9
11
13
15
17
19
21
1975-1977 1978-1980 1981-1983 1984-1986 1987-1989 1990-1992 1993-1995 1996-1998 1999-2001 2002-2004 2005-2007 2007-20130*

2 | LIVING LONGER, BETTER & HEALTHIER
Hopeful Signs of Extending Five-Year Survival RateAmong Patients with Pancreatic Cancer
47
5-year relative survival
rates (%) based on
year of diagnosis
2.52.9 2.7 2.9
3.5
4.34.0
4.4
5.15.6
7.2
9.1
0
1
2
3
4
5
6
7
8
9
10
1975-1977 1978-1980 1981-1983 1984-1986 1987-1989 1990-1992 1993-1995 1996-1998 1999-2001 2002-2004 2005-2007 2008-2014
Source 21: National Cancer Institute, Surveillance, Epidemiology, and End Results (SEER) Program. SEER Cancer Statistics Review, 1975-2015. 5-Year Relative and Period Survival (Percent) by Race, Diagnosis Year, Stage and Age. Available at https://seer.cancer.gov/csr/1975_2015/results_merged/sect_22_pancreas.pdf. Accessed June 2018.

6 | WHO IS CELGENE? 48
2 | LIVING LONGER, BETTER & HEALTHIER 48
“Patricia Ganz, MD, FASCO,
ASCO Expert and Director of Cancer Prevention and Control Research at the Jonsson Comprehensive Cancer Center, University of California, Los Angeles ”
We've made incredible strides in cancer treatment, andmore cancer survivors are alive today than ever before.But oncology isn't just about helping people live longer –we need to ensure that patients have the best quality oflife possible at every stage of their cancer journey, fromactive treatment through survivorship.

2 | LIVING LONGER, BETTER & HEALTHIER
Notes and Sources
49
1. DeVita V, Chu E. A History of Cancer Chemotherapy. Cancer Res 2008;68:8643-8653. Accessed June, 2015. ©2008 by American Association for Cancer Research. Available at cancerres.aacrjournals.org. Accessed August 2017.
1 a: Development of Modern Knowledge about Cancer Causes. (n.d.). Available at https://www.cancer.org/cancer/cancer-basics/history-of-cancer/modern-knowledge-and-cancer-causes.html. Accessed August 2017.1 b: Hepatitis B Foundation. History of Hepatitis B Vaccine History. Available at http://www.hepb.org/prevention-and-diagnosis/vaccination/history-of-hepatitis-b-vaccine/ Accessed July, 2017.1 c: National Cancer Institute. Prostate Specific Antigen (PSA) test. Available at https://www.cancer.gov/types/prostate/psafactsheet. Accessed July 2017. 1 d: U.S. Food and Drug Administration. June 12, 2008 Approval Letter Human Papillomavirus Quadrivalent (Types 6, 11, 16, 18) Vaccine, Recombinant. Available at https://www.fda.gov/BiologicsBloodVaccines/Vaccines/ApprovedProducts/ucm111282.htm. Accessed November 2017. 1 e: U.S. Food and Drug Administration. Lenalidomide (Revlimid). Available at https://www.fda.gov/Drugs/InformationOnDrugs/ApprovedDrugs/ucm542791.htm. Accessed November 2017.1 f National Cancer Institute. The Abraxane® Story: A Nanoparticle Platform Delivers Improved Anticancer Activity. Available at http://nano.cancer.gov/action/news/nanotech_news_2006-01-30e.asp. Accessed August 2017. 1 g: Alexander W. The Checkpoint Immunotherapy Revolution. P&T Journal. Available at https://www.ncbi.nlm.nih.gov/pmc/articles/PMC4771089/. Accessed November 2017.1 h: Chaudhary P M. Dr. Chaudhary on History of CAR T-Cell Therapy. OncLive. Available at http://www.onclive.com/printer?url=/onclive-tv/dr-chaudhary-on-history-of-car-tcell-therapy. Accessed October 2017.1 i: Jain, KK. Personalized medicine. Curr Op Mol Ther. 2002;4(6):548-558. Available at https://www.ncbi.nlm.nih.gov/pubmed/12596356. Accessed August 2017.
2. National Vital Statistics Report. Centers for Disease Control and Prevention and National Center for Health Statistics. Table 22: Life expectancy at birth, at age 65, and at age 75, by sex, race, and Hispanic origin: United States, selected years 1900-2010. Available at https://www.cdc.gov/nchs/data/nvsr/nvsr65/nvsr65_04.pdf. Accessed August 2017.
2 a: Centers for Disease Control. Table 17. Age Adjusted Death Rates 1950 – 2014. Available at https://www.cdc.gov/nchs/data/hus/2015/017.pdf. Accessed August 2017.2 b: Mortality in the United States, 2016. Available at https://www.cdc.gov/nchs/data/databriefs/db293.pdf. Accessed April 2018. 2 c: Health United States, 2016. Available at https://www.cdc.gov/nchs/data/hus/hus16.pdf#019. Accessed August 2017.
3. American Cancer Society. Facts & Figures 2018: Rate of Deaths From Cancer Continues Decline. Available at https://www.cancer.org/latest-news/facts-and-figures-2018-rate-of-deaths-from-cancer-continues-decline.html. Accessed April 2018.
3 a: Centers for Disease Control and Prevention, “Cancer Survivors-United States, 2007,” 10 March 2011, http://www.cdc.gov/cancer/survivorship/what_cdc_is_doing/research/survivors_article.htm. R Siegel, et al., “Cancer Treatment and Survivorship Statistics, 2012.” CA: A cancer Journal for Clinicians. Doi: 10.3322/caac.21149. Accessed November 2017.3 b: DeSantis CE. Cancer Journal for Clinicians. Cancer treatment and survivorship statistics, 2014. Available at http://onlinelibrary.wiley.com/doi/10.3322/caac.21235/full. Accessed August 2017.
4. Centers for Disease Control and Prevention (CDC). Health, United States, 2012. Table 28: Death Rates for Malignant Neoplasms by Sex, Race, Hispanic Origin, and Age: United States, Selected Years 1950–2016. Available at https://www.cdc.gov/nchs/hus/contents2017.htm#Table_017. Accessed January 2019.
4 a: National Cancer Institute, Surveillance, Epidemiology, and End Results (SEER) Program. SEER Cancer Statistics Review, 1975-2015. 5-Year Relative and Period Survival (Percent) by Race, Diagnosis Year, Stage and Age. Available at https://seer.cancer.gov/csr/1975_2015/results_single/sect_03_table.01.pdf. Accessed May 2018.
5. Centers for Disease Control and Prevention (CDC). Health, United States, 2012. Table 28: Death Rates for Malignant Neoplasms by Sex, Race, Hispanic Origin, and Age: United States, Selected Years 1950–2016. Available at https://www.cdc.gov/nchs/hus/contents2017.htm#Table_017. Accessed January 2019.

6 | WHO IS CELGENE? 50
2 | LIVING LONGER, BETTER & HEALTHIER
Notes and Sources (cont.) 6. Centers for Disease Control and Prevention (CDC). Health, United States, 2012. Table 28: Death Rates for Malignant Neoplasms by Sex, Race, Hispanic Origin, and Age: United States, Selected
Years 1950–2016. Available at https://www.cdc.gov/nchs/hus/contents2017.htm#Table_017. Accessed January 2019.
6 a: Hashim D et al. The global decrease in cancer mortality: trends and disparities. Annals of Oncology. Available at https://academic.oup.com/annonc/article/27/5/926/2769784/The-global-decrease-in-cancer-mortality-trends-and. Accessed August 2017.
7. National Cancer Institute, Surveillance, Epidemiology, and End Results (SEER) Program. SEER Cancer Statistics Review, 1975-2015. Table 1.5 Age-Adjusted SEER Incidence and U.S. Death Rates and 5-Year Relative Survival (Percent) By Primary Cancer Site, Sex and Time Period. Available at https://seer.cancer.gov/statfacts/. Accessed June 2018.
7 a: Seabury, “Quantifying Gains in the War on Cancer Due to Improved Treatment and Earlier Detection,” Forum for Health Economics and Policy 2016; 19(1): 141–156 that states. Accessed August 2017..
8. American Cancer Society. “Cancer facts & Figures 2016,” Available at https://www.cancer.org/content/dam/cancer-org/research/cancer-facts-and-statistics/annual-cancer-facts-and-figures/2016/cancer-facts-and-figures-2016.pdf. Accessed August 2017.
9. National Cancer Institute, Surveillance, Epidemiology, and End Results (SEER) Program. SEER Cancer Statistics Review, 1975-2015. 5-Year Relative and Period Survival (Percent) by Race, Diagnosis Year, Stage and Age. Available at https://seer.cancer.gov/csr/1975_2015/sections.html. Accessed June 2018.
9 a: American Cancer Society. Cancer Statistics and Figures, 2017. Available at https://www.cancer.org/content/dam/cancer-org/research/cancer-facts-and-statistics/annual-cancer-facts- and figures/2017/cancer-facts-and-figures-2017.pdf Accessed August 2017.9 b: Bastian, A. The Rising Cost of Medical Care: Understanding the Problem and Exploring Solutions. GFK Market Access. Available at https://ash.confex.com/ash/2014/webprogram/Session5387.html. Accessed, November 2017.
10. Aspinal, M former President Genzyme Genetics. Available at http://www.comtecmed.com/biomarker/2014/Uploads/Editor/PDF/ppt/Edward%20Abrahams_Key%20Note%20Lecture.pdf)l. National Cancer Institute,; SEER Cancer Statistics Review, 1975-2011, http://seer.cancer.gov/csr/1975_2011/, based on November 2013 SEER data submission, posted to the SEER web site, April 2014; PhRMA, “Medicines in Development for Leukemia & Lymphoma.” Accessed August 2017.
11. International Myeloma Foundation. The International Myeloma Foundation Says New Studies Show Longer Survival for Myeloma Patients and Improved Response to Treatments. Available at http://www.businesswire.com/news/home/20080531005029/en/International-Myeloma-Foundation-New-Studies-Show-Longer. Accessed September 2017.
50

2 | LIVING LONGER, BETTER & HEALTHIER
Notes and Sources (cont.)
51
12. National Cancer Institute, Surveillance, Epidemiology, and End Results (SEER) Program. SEER Cancer Statistics Review, 1975-2015. 5-Year Relative and Period Survival (Percent) by Race, Diagnosis Year, Stage and Age. Available at https://seer.cancer.gov/csr/1975_2015/results_merged/sect_18_myeloma.pdf. Accessed June 2018.
12 a: National Cancer Institute. Drugs Approved for Multiple Myeloma and Other Plasma Cell Neoplasms. Available at https://www.cancer.gov/about-cancer/treatment/drugs/multiple-myeloma. Accessed September 2017.
13. Harrison C. Quality of Life: An Increasingly Important Feature of Myeloma Treatment. Cancer Therapy Advisor. Available at http://www.cancertherapyadvisor.com/side-effect-management/multiple-myeloma-quality-life-more-important-feature-treatment/article/547105/2/. Accessed August 2017.
14. Ma, X. Myelodysplastic syndromes: incidence and survival in the United States. Cancer. 2007 Apr 15;109(8):1536-42.
14 a: Ma X. Epidemiology of Myelodysplastic Syndromes. Am J Med. 2012 Jul; 125(7 Suppl): S2–S5.
15. National Cancer Institute, Surveillance, Epidemiology, and End Results (SEER) Program. SEER Cancer Statistics Review, 1975-2010. Table 13.16: Myeloid Leukemia, 5-Year Relative and Period Survival (Percent) by Race, Sex, Diagnosis Year and Age. Available at http://seer.cancer.gov/archive/csr/1975_2010/results_merged/sect_13_leukemia.pdf. Accessed August 2015.
15 a: National Cancer Institute, Surveillance, Epidemiology, and End Results (SEER) Program. SEER Cancer Statistics Review, 1975-2015. 5-Year Relative and Period Survival (Percent) by Race, Diagnosis Year, Stage and Age. Available at https://seer.cancer.gov/csr/1975_2015/results_merged/sect_13_leukemia.pdf. Accessed June 2018. 15 b: Freireich EJ. Et al. The Leukemias: A Half-Century of Discovery. Journal of Clinical Oncology. Available at http://ascopubs.org/doi/pdf/10.1200/JCO.2014.57.1034. Accessed October 2017.
16. National Cancer Institute, Surveillance, Epidemiology, and End Results (SEER) Program. SEER Cancer Statistics Review, 1975-2010. Table 13.16: Myeloid Leukemia, 5-Year Relative and Period Survival (Percent) by Race, Sex, Diagnosis Year and Age. Available at http://seer.cancer.gov/archive/csr/1975_2010/results_merged/sect_13_leukemia.pdf. Accessed July 2017.
16 a: National Cancer Institute, Surveillance, Epidemiology, and End Results (SEER) Program. SEER Cancer Statistics Review, 1975-2015. 5-Year Relative and Period Survival (Percent) by Race, Diagnosis Year, Stage and Age. Available at https://seer.cancer.gov/csr/1975_2015/results_merged/sect_13_leukemia.pdf. Accessed June 2018. 16 b: Weissman I L, et al. The origins of the identification and isolation of hematopoietic stem cells, and their capability to induce donor-specific transplantation tolerance and treat autoimmune diseases. Blood. Blood. 2008 Nov 1; 112(9): 3543–3553. doi: 10.1182/blood-2008-08-078220. Available at https://www.ncbi.nlm.nih.gov/pmc/articles/PMC2574516/. Accessed September 2017.16 c: Food and Drug Administration. Drugs@FDA: FDA Approved Drug Products. Gleevec (Imatinib). Available at https://www.accessdata.fda.gov/scripts/cder/daf/index.cfm?event=overview.process&ApplNo=021335. Accessed September 2017.16 d: Pophali, P. National Cancer Institute. The Role of New Tyrosine Kinase Inhibitors in Chronic Myeloid Leukemia. Cancer Journal. Available at https://www.ncbi.nlm.nih.gov/pmc/articles/PMC4742366/. Accessed September 2017.
17. National Cancer Institute, Surveillance, Epidemiology, and End Results (SEER) Program. SEER Cancer Statistics Review, 1975-2015. 5-Year Relative and Period Survival (Percent) by Race, Diagnosis Year, Stage and Age. Available at https://seer.cancer.gov/csr/1975_2015/results_merged/sect_19_nhl.pdf. Accessed June 2018.
17 a: Alduaji, W and Illidge T M. The future of anti-CD20 monoclonal antibodies: are we making progress? Blood. 2011 117:2993-3001; doi: https://doi.org/10.1182/blood-2010-07-298356 . Available at http://www.bloodjournal.org/content/117/11/2993?variant=fulltext&ssochecked=True. Accessed September 2017. 17 b: Fisher R I, Gaynor E G, et al. Comparison of a Standard Regimen (CHOP) with Three Intensive Chemotherapy Regimens for Advanced Non-Hodgkin's Lymphoma. New England Journal of Medicine. Available at http://www.nejm.org/doi/full/10.1056/NEJM199304083281404#t=articleBackground. Accessed September 2017.

6 | WHO IS CELGENE? 52
2 | LIVING LONGER, BETTER & HEALTHIER 52
18. National Cancer Institute, Surveillance, Epidemiology, and End Results (SEER) Program. SEER Cancer Statistics Review, 1975-2015. 5-Year Relative and Period Survival (Percent) by Race, Diagnosis Year, Stage and Age. Available at https://seer.cancer.gov/csr/1975_2015/results_merged/sect_04_breast.pdf. Accessed June 2018.
19. DOI: 10.1200/JCO.2012.48.1903 Journal of Clinical Oncology 31, no. 28 (October 2013) 3540-3548. Available at http://ascopubs.org/doi/abs/10.1200/jco.2012.48.1903. Accessed on July 2017.
20. National Cancer Institute, Surveillance, Epidemiology, and End Results (SEER) Program. SEER Cancer Statistics Review, 1975-2015. 5-Year Relative and Period Survival (Percent) by Race, Diagnosis Year, Stage and Age. Available at https://seer.cancer.gov/csr/1975_2015/results_merged/sect_15_lung_bronchus.pdf. Accessed June 2018.
21. National Cancer Institute, Surveillance, Epidemiology, and End Results (SEER) Program. SEER Cancer Statistics Review, 1975-2015. 5-Year Relative and Period Survival (Percent) by Race, Diagnosis Year, Stage and Age. Available at https://seer.cancer.gov/csr/1975_2015/results_merged/sect_22_pancreas.pdf. Accessed June 2018.
Notes and Sources (cont.)

2 | LIVING LONGER, BETTER & HEALTHIER 53

6 | WHO IS CELGENE? 54
2 | LIVING LONGER, BETTER & HEALTHIER 54
3
3 | PROGRESS & PROSPERITY
PROGRESS &PROSPERITY
MEDICAL INNOVATION LEADS TO GREATER ECONOMIC GROWTH AND PROSPERITY.
Medical innovation leads to improved health outcomes, lower costs, higher productivity, greater economic value to society and expanded gross domestic product (GDP).
Innovations for polio, infectious disease, diabetes, heart disease and HIV, among others have reduced the cost of care and increased economic well-being.
The value of increasing the quality and length of life is substantial; longer life and greater well-being lead to greater productivity and economic growth.
55
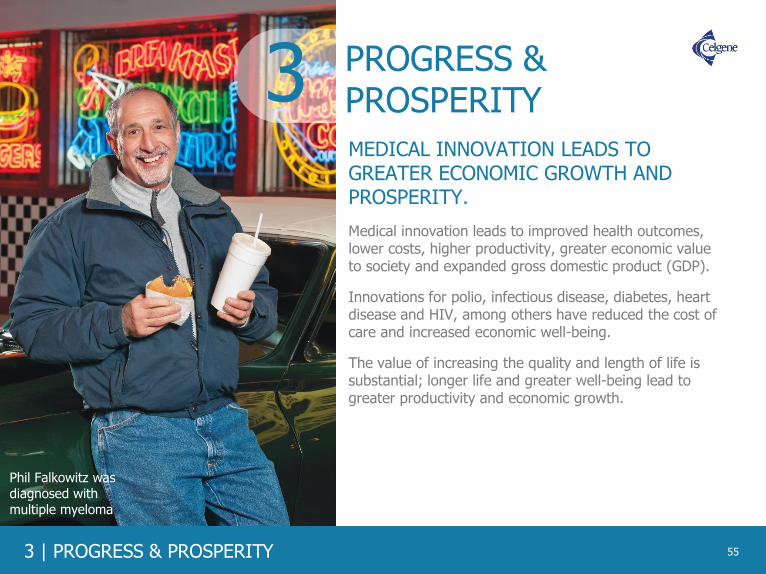
Phil Falkowitz was diagnosed with multiple myeloma

6 | WHO IS CELGENE? 56
3 | PROGRESS & PROSPERITY 56

3 | PROGRESS & PROSPERITY
Kevin Murphy, PhD, and Robert Topel, PhD
University of Chicago Economists
“”
Over the last half century, improvements
in health have been as valuable as all
other sources of economic growth and
productivity combined.
57

6 | WHO IS CELGENE? 58
3 | PROGRESS & PROSPERITY
Bringing Healthcare Costs into Focus
58
Source 1: Centers for Medicare and Medicaid Services. National Health Expenditures; Aggregate and Per Capita Amounts, Annual Percent Change and Percent Distribution: Selected Calendar Years 1960-2012. Available at http://www.cms.gov/Research-Statistics-Data-and-Systems/Statistics-Trends-and-Reports/NationalHealthExpendData/Downloads/tables.pdf. Accessed July 2017.Source 1 a: National Cancer Institute. Cancer Trends Progress Report – 2007 Update. Table L1: National Cancer Treatment Expenditures in Billions of Dollars (1963-2004). Available at http://www.progressreport.cancer.gov/sites/default/files/archive/report2007.pdf. Accessed July 2017. Source 1 b: Center for Medicare and Medicaid Services. Projections of the Cost of Cancer Care in the United States: 2010–2020. Available at http://www.ncbi.nlm.nih.gov/pmc/articles/PMC3107566/. Accessed July 2017.Source 1 c: Centers for Disease Control. Health, United States, 2016. Available at https://www.cdc.gov/nchs/data/hus/hus16.pdf#093. Accessed August 2017.Source 1 d: Mariotto AB, Yabroff KR, Shao Y, Feuer EJ, Brown ML. Projections of the Cost of Cancer Care in the U.S.: 2010-2020. J Natl Cancer Inst. 2011 Jan. Available at https://costprojections.cancer.gov/expenditures.html. Calculated from Full Data Set saved on File. Accessed November 2017.
$0
$500
$1,000
$1,500
$2,000
$2,500
$3,000Total personal healthcare spending
1893 1955-66 1971 20151917 19881947
Cancer treatment spending
Billions
Spending on cancer, relative to total healthcare spending, has remained constant over the past half century

3 | PROGRESS & PROSPERITY
Additional Life-years Gained and Increased SocialValue from Innovative Cancer Treatments, 1988-2000
59
23Million
Life-years
$1.9 Trillion
Social Value
Source 2: Sun E, Jena A, Lakdawalla D, et al. An Economic Evaluation of the War on Cancer. National Bureau of Economic Research Working Paper No. 15574. Issued in December 2009. Available at http://www.nber.org/papers/w15574. Accessed August, 2015.

6 | WHO IS CELGENE? 60
3 | PROGRESS & PROSPERITY
Living Longer, Better and Healthier Benefits Society
60
Source 3: Murphy KM and Topel RH. The Value of Health and Longevity. J Political Econ 2006: 114; 5; 871-904.
* To current and future Americans; study looked at the time period between 1970-2000** Extended survival contributes to economic stimulus by affording people more time to purchase and enjoy leisure activities
1%
REDUCTIONin CANCER-related
DEATHS in the U.S.
Maximized life expectancy
Stimulated the economy**
$500 Billion*WorthBased on a framework,
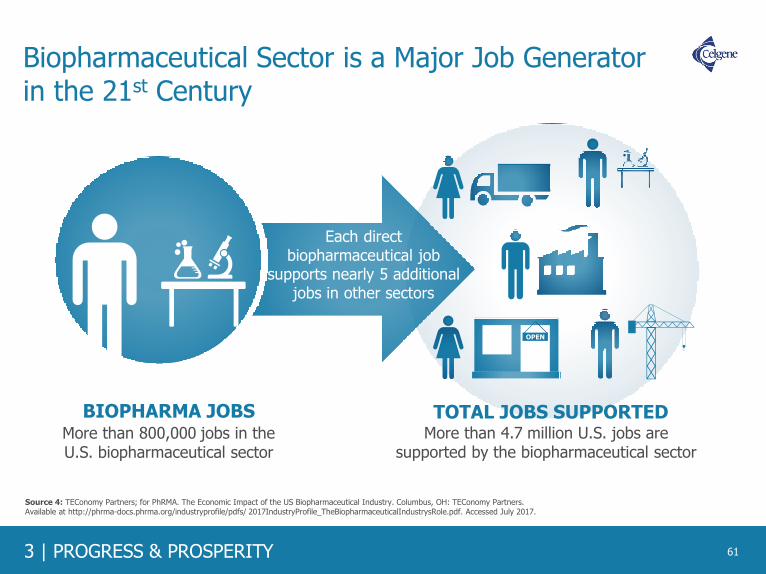
3 | PROGRESS & PROSPERITY
Biopharmaceutical Sector is a Major Job Generator in the 21st Century
61
OPEN
TOTAL JOBS SUPPORTEDMore than 4.7 million U.S. jobs are
supported by the biopharmaceutical sectorMore than 800,000 jobs in theU.S. biopharmaceutical sector
Each direct biopharmaceutical job
supports nearly 5 additional jobs in other sectors
BIOPHARMA JOBS
Source 4: TEConomy Partners; for PhRMA. The Economic Impact of the US Biopharmaceutical Industry. Columbus, OH: TEConomy Partners. Available at http://phrma-docs.phrma.org/industryprofile/pdfs/ 2017IndustryProfile_TheBiopharmaceuticalIndustrysRole.pdf. Accessed July 2017.

6 | WHO IS CELGENE? 62
3 | PROGRESS & PROSPERITY
The Biopharmaceutical Sector is the Most R&D-Intensive Industry in the U.S.
62
Source 5: Celgene data on file. Source 5 a: NDP Analytics. IP-Intensive Manufacturing Industries: Driving U.S. Economic Growth from September 2017. Available at https://static1.squarespace.com/static/52850a5ce4b068394a270176/t/59b8862e9f7456ccb09ede58/1505265200469/IP+Report+2017.pdf. Accessed November 2017.
10,994
16,986
20,098
23,231
47,084
55,717
57,755
147,281
Petroleum & coal
Transportation equipment
Medical equipment
Aerospace*
Computers and electronics
Chemicals
Semiconductors*
Biopharmaceuticals*
R&D Expenditures per Employee by Manufacturing Industry, 2000‐2013
Biopharmaceutical companies invest approximately more than 12 times the amount of R&D dollars per employee than manufacturing industries overall.
Celgene 2018 R&D expenditure per employee is ~ $640,872**
*Manufacturing subsectors** Based on U.S. Generally Accepted Accounting Principles

3 | PROGRESS & PROSPERITY
•••••••••••••••••••••••••••••••••••••••••
••••••••••••••••••••••••••••••••
•••••••••••••••••
••••••••••••••••••••
•••••••••••••
•••••••••••••••••••••••••••••••••••••••••
••••••••••••••••••••••••••••••••
•••••••••••••••••
••••••••••••••••••••
•••••••••••••
•••••••••••••••••••••••••••••••••••••••
••••••••••••••••••••••••••••••
•••••••••••••••••••••••••••••••••••••••••••••••••••••••••••••••
••••••••••••••••••••••••••••••••
The Human Genome Project: An Example of High Return on Investment in Basic Science
63
Why Incentivize the Innovators?
$3.8 billionU.S. Investment in the Human Genome Project
The Human Genome Project supported more than 310,000 jobs and added $67 billion to the U.S. economy
Source 6: Tripp S, Grueber M; Battelle Memorial Institute, Technology Partnership Practice. Economic Impact of the Human Genome Project. May, 2011. Available at http://www.battelle.org/docs/default-document-library/economic_impact_of_the_human_genome_project.pdf?sfvrsn=2. Accessed July 2017.

6 | WHO IS CELGENE? 64
3 | PROGRESS & PROSPERITY
Understanding the Human Genome Leads to More Precise Targeting
The Human Genome Project maximizes the potential of innovative medicines via more precise targeting that can improve lives and meaningfully contribute to society.
64
Are now packaged with genomic information that tells doctors to test their patients for genetic variants
linked to efficacy, dosages or side-effects
in development for
DISORDERS
DIFFERENT FDA-APPROVED MEDICINES
MORE THAN
100Before the
Human Genome Project,
researchers knew
the genetic basis of about
Today, they know
the basis of nearly
60
OF CONDITIONS
5,000
Source 7: Young Rojahn S. MIT Technology Review. A Decade of Advances Since the Human Genome Project. 2013. Available at https://www.technologyreview.com/s/513666/a-decade-of-advances-since-the-human-genome-project/. Accessed July 2017.

3 | PROGRESS & PROSPERITY
Scientific Research Contributes to Economic Activity in the U.S. and Around the World
65
9,059clinical trials
the biopharmaceutical
industry sponsored
In 2015
of medicines around the world, supporting tangible economic activity
such as jobs in the countries in which the trials are located.
10,700+active clinical trials
the U.S. biopharmaceutical sector sponsored
In 2018
supporting tangible economic activity including jobs in research, healthcare,
academia, and industry
Source 8: U.S. National Library of Medicine. ClinicalTrials.gov. Available at https://clinicaltrials.gov/. Accessed June 2018.

6 | WHO IS CELGENE? 66
3 | PROGRESS & PROSPERITY
Across the U.S., Scientific Research Contributes to Significant Economic Activity
66
In 2013, the biopharmaceutical sector sponsored approximately 6,200 clinical trials of medicines around the United States, involving 1.1 million participants and supporting an estimated $25 billion in economic activity across all 50 states and the District of Columbia.*
*Estimates reflect only those activities occurring at clinical trial sites and exclude more centralized, cross-site functions such as coordination and data analysis. Also excluded are nonclinical R&D such as basic and preclinical research and the significant economic contribution from non-R&D activities of the industry such as manufacturing and distribution.
Source 9: Battelle Technology Partnership Practice; for PhRMA. Biopharmaceutical industry-sponsored clinical trials: impact on state economies. Available at http://phrma-docs.phrma.org/sites/default/files/ pdf/biopharmaceutical-industry-sponsored-clinical-trials-impact-on-state-economies.pdf. Published March 2015. Accessed May 2017.
Output Total Impact
$1,000+ million
$500 to $999 million
$100 to $499 million
Up to $100 million

3 | PROGRESS & PROSPERITY
Notes and Sources
67
1. Centers for Medicare and Medicaid Services. National Health Expenditures; Aggregate and Per Capita Amounts, Annual Percent Change and Percent Distribution: Selected Calendar Years 1960-2012. Available at http://www.cms.gov/Research-Statistics-Data-and-Systems/Statistics-Trends-and-Reports/NationalHealthExpendData/Downloads/tables.pdf. Accessed July 2017.
1 a: Center for Medicare and Medicaid Services. Available at https://www.cms.gov/research-statistics-data-and-systems/statistics-trends-and-reports/nationalhealthexpenddata/nhe-fact-sheet.html. Accessed July 2017.1 b: National Cancer Institute. Cancer Trends Progress Report – 2007 Update. Table L1: National Cancer Treatment Expenditures in Billions of Dollars (1963-2004). Available at http://www.progressreport.cancer.gov/sites/default/files/archive/report2007.pdf. Accessed July 2017.1 c: Centers for Disease Control. Health, United States, 2016. Available at https://www.cdc.gov/nchs/data/hus/hus16.pdf#093. Accessed August 2017.1 d: Mariotto AB, Yabroff KR, Shao Y, Feuer EJ, Brown ML. Projections of the Cost of Cancer Care in the U.S.: 2010-2020. J Natl Cancer Inst. 2011 Jan. Available at https://costprojections.cancer.gov/expenditures.html. Accessed November 2017. Calculated from Full Data Set saved on File.
2. Sun E, Jena A, Lakdawalla D, et al. An Economic Evaluation of the War on Cancer. National Bureau of Economic Research Working Paper No. 15574. Issued in December 2009. Available at http://www.nber.org/papers/w15574. Accessed August, 2015.
3. Murphy KM and Topel RH. The Value of Health and Longevity. J Political Econ 2006: 114; 5; 871-904.
4. TEConomy Partners; for PhRMA. The Economic Impact of the US Biopharmaceutical Industry. Columbus, OH: TEConomy Partners. Available at http://phrma-docs.phrma.org/industryprofile/pdfs/2017IndustryProfile_TheBiopharmaceuticalIndustrysRole.pdf. Accessed July 2017.
5. Celgene data on file.
5 a: NDP Analytics. IP-Intensive Manufacturing Industries: Driving U.S. Economic Growth. Available at https://static1.squarespace.com/static/52850a5ce4b068394a270176/t/5509888de4b05ef9ded57e01/1426688141783/IP+Report+-+March+2015.pdf. Accessed July 2017.
6. Tripp S, Grueber M; Battelle Memorial Institute, Technology Partnership Practice. Economic Impact of the Human Genome Project. May, 2011. Available at http://www.battelle.org/docs/default-document-library/economic_impact_of_the_human_genome_project.pdf?sfvrsn=2. Accessed July 2017.
7. Pharmaceutical Research and Manufacturers of America. Biopharmaceuticals in Perspective, Spring 2016. Chapter 7, Slide 112. Available at http://phrma-docs.phrma.org/files/dmfile/chart-pack-biopharmaceuticals-in-perspective4.pdf. Accessed December, 2016. Celgene Annual Reports 2015 reflect average research and development investment of 32.29% of total revenue based on GAAP reporting. Accessed December, 2016.
8. U.S. National Library of Medicine. ClinicalTrials.gov. Available at https://clinicaltrials.gov/. Accessed June 2018
9. Battelle Technology Partnership Practice; for PhRMA. Biopharmaceutical industry-sponsored clinical trials: impact on state economies. Available at http://phrma-docs.phrma.org/sites/default/files/pdf/biopharmaceutical-industry-sponsored-clinical-trials-impact-on-state-economies.pdf. Published March 2015. Accessed May 2017.

6 | WHO IS CELGENE? 68
3 | PROGRESS & PROSPERITY 68

4
4 | BETTER HEALTHCARE, BETTER OUTCOMES
BETTER HEALTHCARE, BETTER OUTCOMESCONTINUED MEDICAL INNOVATION CAN LEAD TO A REDUCTION IN HEALTHCARE SPENDING.
Medical innovation is transforming certain types of cancer from
leading causes of death to long-term, manageable diseases while
also reducing the overall strain on healthcare systems.
Through investment in medicines, overall healthcare spending can
be reduced. By improving health, medicines can reduce hospital
admissions and reduce the use of costly medical services. These
advancements coupled with improved access to medicines can
result in a decrease of overall healthcare costs.
Medical innovation has allowed for significant changes in the
treatment for cancer care. Increasingly, cancer will be managed by
preventing and controlling cancer through genetic biomarkers and
precision medicine with the hope of stopping the cancer as quickly
as possible.
And while new cancer therapies may have a positive impact for
patients, it cannot be sustained without a balance in the virtuous
cycle of medical innovation.
69
Judith Harding was diagnosed with multiple myeloma

6 | WHO IS CELGENE? 70
4 | BETTER HEALTHCARE, BETTER OUTCOMES 70

4 | BETTER HEALTHCARE, BETTER OUTCOMES 71
Pharmaceuticals have the effect of improving ormaintaining an individual’s health … adheringto a drug regimen for a chronic condition such asdiabetes or high blood pressure may preventcomplications … taking the medication may alsoavert hospital admissions and thus reduce theuse of medical services.
“”– Congressional Budget Office

6 | WHO IS CELGENE? 72
4 | BETTER HEALTHCARE, BETTER OUTCOMES 72
Medicines have played an important role in helping patients live longer and healthier lives. New medicines continue to be a major contributor to improvements in life expectancy.
New Therapies Are a Major Contributor to Improvements in Life Expectancy
Overall life expectancy was almost 1.74 years with new therapies contributing to approximately 1.27 years
1986 - 2000 2000 - 2009
Source 1: Lichtenberg FR. NBER Working Paper No. 18235. Pharmaceutical innovation and longevity growth in 30 developing and high-income countries, 2000-2009.
Available at http://www.nber.org/papers/w18235. Accessed July 2017.
Source 1 a: Lichtenberg FR. NBER Working Paper No. 9754. The impact of new drug launches on longevity: evidence from longitudinal disease-level data from 52 countries,
1982-2001. Available at http://www.nber.org/papers/w9754. Accessed July 2017.
40% 73%
Overall life expectancy was almost 2 years with new therapies contributing to approximately .8 years

4 | BETTER HEALTHCARE, BETTER OUTCOMES
Total Healthcare Expenditure has Seen Constant Growth Globally, While Spending on Medicines has Decreased
73
Pharmaceutical expenditure has substantially decreased since 2010 while total healthcare expenditure has continued to grow across developed markets from 1990 - 2013
-4.0%
-2.0%
0.0%
2.0%
4.0%
6.0%
8.0%
1990 1995 2000 2005 2010 2013
An
nu
al G
row
th in
Ph
arm
ace
uti
cal a
nd
To
tal H
eal
th E
xpe
nd
itu
re p
er
Cap
ita
Total Health Expenditure Growth Pharmaceutical Expenditure Growth
Pharmaceutical expenditure growth is less than total health expenditure growth
Note: Average annual growth in pharmaceutical and total health expenditure per capita, in real terms, average across OECD countries, 1990 to 2013 (or nearest year). Countries include Australia, Austria, Belgium, Canada, Czech Republic, Denmark, Estonia, Finland, France, Germany, Greece, Hungary, Iceland, Ireland, Israel, Italy, Japan, Korea, Luxembourg, Mexico, Netherlands, New Zealand, Norway, Poland, Portugal, Slovak Republic, Slovenia, Spain, Sweden, Switzerland, Turkey, United Kingdom, United States.
Source 2: EFPIA 2015, H&G evidence compendium. Available at http://efpia.morris-chapman.net/documents/160/138/2015-Health-amp-Growth-evidence-compendium-Slide-decks. Accessed July 2017. Calculated at OECD (2015), Average annual growth in pharmaceutical and total health expenditure per capita, in real terms, average across OECD countries, 1990 to 2013 (or nearest year), in Health at a Glance 2015, OECD Publishing, Paris. Available at http://dx.doi.org/10.1787/health_glance-2015-graph8-en. Accessed August 2017.

6 | WHO IS CELGENE? 74
4 | BETTER HEALTHCARE, BETTER OUTCOMES
Drug Spending is a Small Portion of Total Healthcare Spend in Select OECD Countries
74
$4,582 $4,794 $4,798 $4,809 $5,224 $5,523 $5,598
$7,467
$9,309 $9,523
1.60%0.80% 1.40% 1.30%
0.40% 0.70%1.10% 0.70%
1.10%2.10%
11% 11%
9% 9%
7%
11% 11%10%
12%
17%
$-
$2,000
$4,000
$6,000
$8,000
$10,000
0.00%
2.00%
4.00%
6.00%
8.00%
10.00%
12.00%
14.00%
16.00%
18.00%
Germ
any
Neth
erlands
Aust
ralia
Irela
nd
Luxem
bourg
Denm
ark
Sw
eden
Norw
ay
Sw
itze
rland
U.S
.
Healthcare Spending Per Capita Drug Spending % of GDP Healthcare Spending % of GDP
Source 3: OECD, Disposable Income Per Capita: 2013 Data; 2014: United States, Australia, Netherlands, Finland; 2012: New Zealand; 2009: Japan, Total Hospital Spending, Hospital Spending Per Capita: 2014 estimated data; 2013: Australia, Japan, and Norway; 2007 New Zealand, Total drug spend, Drug spend per capita: 2014 Data, 2013: Australia, Japan; 2007: New Zealand. Available at https://data.oecd.org/healthres/pharmaceutical-spending.htm. Accessed August 2017.
Total Healthcare Spend vs. Adjusted Drug Spend in Select OECD Countries Between the Years of 2007 - 2014
Perc
ent
of
GD
P
Healthca
re S
pendin
g p
er
Capita

4 | BETTER HEALTHCARE, BETTER OUTCOMES
Potential Savings From Better Use of Medicines
75
Based on estimates from 2012, better use of medicines could eliminate up to $213 billion in U.S. healthcare costs annually, which represents 8% of the nation’s healthcare spending.
$20
$87
$105
$213
$0 $50 $100 $150 $200 $250
Medication Errors**
Suboptimal Prescribing*
Nonadherence
Total Avoidable Costs
Avoidable Annual U.S. Healthcare Cost Estimates (in Billions, 2012)
Source 4: IMS Institute for Healthcare Informatics. Avoidable costs in US healthcare: the $200 billion opportunity from using medicines more responsibly. Available at http://www.imshealth.com/files/web/IMSH%20Institute/Reports/Avoidable_Costs_in%20_US_Healthcare/IHII_AvoidableCosts_2013.pdf. Published June 2013. Accessed August 2017.
* Category includes untimely medicine use ($40 billion), inappropriate antibiotic use ($35 billion), and suboptimal generic use ($12 billion)** Category includes medication errors ($20 billion) and mismanaged polypharmacy in the elderly ($1 billion)
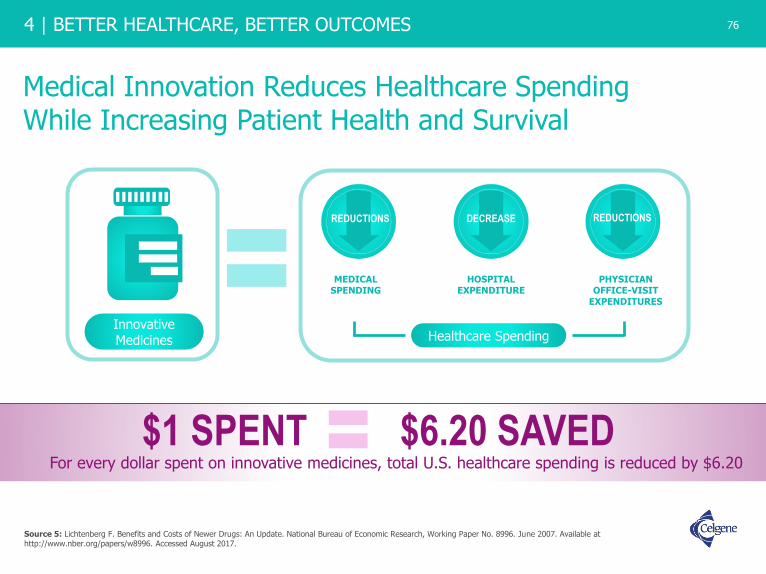
6 | WHO IS CELGENE? 76
4 | BETTER HEALTHCARE, BETTER OUTCOMES
Medical Innovation Reduces Healthcare SpendingWhile Increasing Patient Health and Survival
76
$1 SPENT $6.20 SAVEDFor every dollar spent on innovative medicines, total U.S. healthcare spending is reduced by $6.20
Source 5: Lichtenberg F. Benefits and Costs of Newer Drugs: An Update. National Bureau of Economic Research, Working Paper No. 8996. June 2007. Available at http://www.nber.org/papers/w8996. Accessed August 2017.
REDUCTIONS
MEDICAL SPENDING
DECREASE
HOSPITAL EXPENDITURE
REDUCTIONS
PHYSICIAN OFFICE-VISIT
EXPENDITURES
Healthcare SpendingInnovativeMedicines

4 | BETTER HEALTHCARE, BETTER OUTCOMES
Improved Access and Adherence to Medicines Through Medicare Part D Results in Non-Drug Cost Savings
77
Source 6: McWilliams JM, Zaslavsky AM, Huskamp HA. Implementation of Medicare Part D and nondrug medical spending for elderly adults with limited prior drug coverage. JAMA. 2011;306(4):402‐409. Available at http://jamanetwork.com/ on 08/20/2017. Accessed August 2017.Source 6 a: Afendulis CC, Chernew ME. State‐level impacts of Medicare Part D. Am J Managed Care. 2011;17 Suppl 12:S. Available at
http://www.ajmc.com/journals/supplement/2011/StateLevelImpactsofMedicarePartD/StateLevelImpactsofMedicarePartD/. Accessed August 2017.
MEDICARE SAVINGS THROUGH PART D IN THE FIRST FULL YEAR OF THE PROGRAM
$13 BILLIONin non-drug savings
during first full year of Part D
this reduction achieved …Improved access and
adherence to medicines
SAVED $1,200/yearin hospital, nursing home and other costs for each individual who previously lacked comprehensive prescription drug coverage

6 | WHO IS CELGENE? 78
4 | BETTER HEALTHCARE, BETTER OUTCOMES
Spending per Medicare Beneficiaries Decreased in 2014
78
Since 2012
In 2014, the Congressional Budget Office lowered its projections of total spending on
Medicare benefits from 2012 through 2021 by $370 billion, excluding sequestration savings.
Between 2011-2014
OF THE SLOWDOWN IN
OVERALL MEDICARE BENEFITS
APPROX.
10%MORE THAN
60%
OF MEDICARE
PART D SPENDING
ACCOUNTEDFOR
Source 7: Adler L., Rosenberg. A. The $500 Billion Medicare Slowdown: A Story About Part D. Health Affairs Blog. Available at http://healthaffairs.org/blog/2014/10/21/the-500-billion-medicare-slowdown-a-story-about-part-d/. Accessed August 2017.
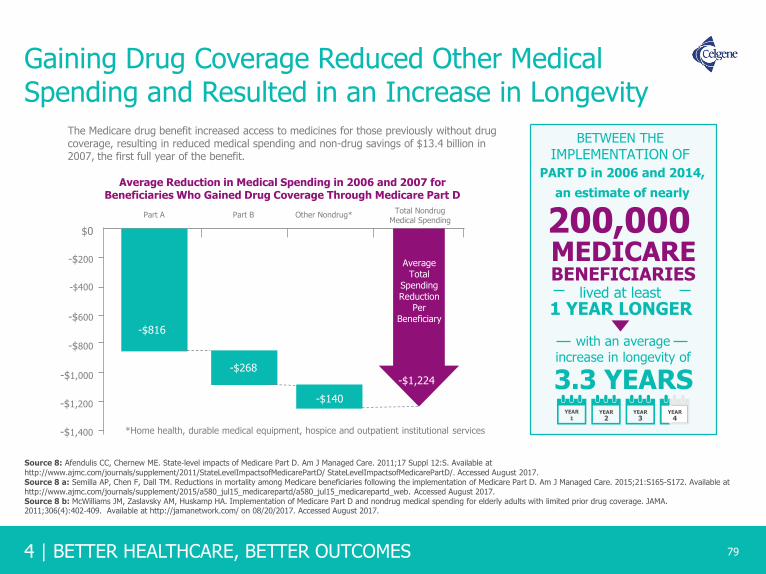
4 | BETTER HEALTHCARE, BETTER OUTCOMES
Gaining Drug Coverage Reduced Other Medical Spending and Resulted in an Increase in Longevity
79
Average Reduction in Medical Spending in 2006 and 2007 for Beneficiaries Who Gained Drug Coverage Through Medicare Part D
Source 8: Afendulis CC, Chernew ME. State‐level impacts of Medicare Part D. Am J Managed Care. 2011;17 Suppl 12:S. Available at
http://www.ajmc.com/journals/supplement/2011/StateLevelImpactsofMedicarePartD/ StateLevelImpactsofMedicarePartD/. Accessed August 2017.Source 8 a: Semilla AP, Chen F, Dall TM. Reductions in mortality among Medicare beneficiaries following the implementation of Medicare Part D. Am J Managed Care. 2015;21:S165-S172. Available at http://www.ajmc.com/journals/supplement/2015/a580_jul15_medicarepartd/a580_jul15_medicarepartd_web. Accessed August 2017.Source 8 b: McWilliams JM, Zaslavsky AM, Huskamp HA. Implementation of Medicare Part D and nondrug medical spending for elderly adults with limited prior drug coverage. JAMA. 2011;306(4):402‐409. Available at http://jamanetwork.com/ on 08/20/2017. Accessed August 2017.
The Medicare drug benefit increased access to medicines for those previously without drug coverage, resulting in reduced medical spending and non-drug savings of $13.4 billion in 2007, the first full year of the benefit.
-$1,400
Part A Part B Other Nondrug*Total Nondrug
Medical Spending
$0
-$200
-$400
-$600
-$800
-$1,000
-$1,200
-$816
-$268
-$140
AverageTotal
SpendingReduction
PerBeneficiary
-$1,224
*Home health, durable medical equipment, hospice and outpatient institutional services
200,000
BETWEEN THE
IMPLEMENTATION OF
MEDICAREBENEFICIARIES
lived at least1 YEAR LONGER
with an average increase in longevity of
3.3 YEARSYEAR
1YEAR
2YEAR
3YEAR
4
PART D in 2006 and 2014,
an estimate of nearly

6 | WHO IS CELGENE? 80
4 | BETTER HEALTHCARE, BETTER OUTCOMES
Many Patients are Satisfied with Medicare Part D Coverage
80
Source 9: Medicare Today. Senior Satisfaction Survey. Available at http://medicaretoday.org/wp-content/uploads/2017/08/2017-Senior-Satisfaction-Survey-Fact-Sheet.pdf. Accessed September 2017.Source 9 a: My Medicare Matters National Council on Aging. How Much Does Medicare Part D Cost?. https://www.mymedicarematters.org/costs/part-d/. Accessed December 2018.Source 9 b: The Kaiser Family Foundation. The Medicare Part D Prescription Drug Benefit. Available at http://files.kff.org/attachment/Fact-Sheet-An-Overview-of-the-Medicare-Part-D-Prescription-Drug-Benefit. Accessed December 2018.
More than 43 million people are enrolled in Medicare Part D in 2018
According to2017 Medicare Today
Senior Satisfaction Survey*
of seniors are satisfied with
Part D coverage
of seniors said their plan is affordable and provides good value
Nearly
90%
AVERAGE COST PER PATIENT FOR MONTHLY MEDICARE PART D PREMIUMS
$34.00
$33.192019
which helps keep insurance coverage
2018
AFFORDABLE FOR PATIENTS
NEARLY
90% 84%
*This poll was conducted by Morning Consult from June 18 – July 6, 2017, among a national sample of 1,944 seniors who are Medicare Part D recipients. The interviews were conducted online and the data were weighted to approximate a target sample of seniors based on age, race/ethnicity and gender. Results from the full survey have a margin of error of plus or minus 2 percentage points.

4 | BETTER HEALTHCARE, BETTER OUTCOMES
The Health Dollar in the U.S. ($3.5 Trillion),Calendar Year 2017: Where It Went
81
Source 10: Centers for Medicare & Medicaid Services. National Health Expenditures 2017 Highlights. Available at https://www.cms.gov/Research-Statistics-Data-and-Systems/Statistics-Trends-and-Reports/NationalHealthExpendData/Downloads/highlights.pdf. Accessed December 2018.Source 10 a: Centers for Medicare & Medicaid Services (CMS). National Health Care Spending In 2017 Historical Tables. Available at https://www.cms.gov/Research-Statistics-Data-and-Systems/Statistics-Trends-and-Reports/NationalHealthExpendData/NationalHealthAccountsHistorical.html. Accessed December 2018.
5%
3%3%
4%
Otherhealth,
residential and personal
care
Durable medical equipment and
other non-durable medical
products
Homehealthcare
Government public health
activities
8%
5%
5%
15%
33%
20%
10%
7%Government administration and thenet cost of health insurance
Investment
Nursing care facilities and continuingcare retirement communities
Other
Hospital care
Physicians and clinics
Dental services and otherprofessionals

6 | WHO IS CELGENE? 82
4 | BETTER HEALTHCARE, BETTER OUTCOMES 82
Total Net Spending Growth on Medicines is Falling Due to Decreased Spending on New Brands and Increased Generic Competition
Source 11: QuintilesIMS, IQVIA National Sales Perspectives, IQVIA Institute, April 2018. Available at https://www.iqvia.com/institute/reports/medicine-use-and-spending-in-the-us-review-of-2017-outlook-to-2022. Accessed June 2018.
Updated slide to align with the I&I source book

4 | BETTER HEALTHCARE, BETTER OUTCOMES
Source 12: QuintilesIMS, IQVIA National Sales Perspectives, IQVIA Institute, April 2018. Available at https://www.iqvia.com/institute/reports/medicine-use-and-spending-in-the-us-review-of-2017-outlook-to-2022. Accessed June 2018.
Net Spending Growth on Medicines was 0.6% in 2017; Expected to Average 2-5% Through 2022
Growth will be driven by innovation and offset by slower price growth and patent expirations

6 | WHO IS CELGENE? 84
4 | BETTER HEALTHCARE, BETTER OUTCOMES
Retail Prescription Growth Has Been Lower or On Par With Other Components of Healthcare Spending
-4%
-2%
0%
2%
4%
6%
8%
10%
12%
14%
2006 2007 2008 2009 2010 2011 2012 2013 2014 2015 2016
84
National Health Expenditures Hospital Care
Retail Prescription Medicine Net Cost of Health Insurance
Professional Services
Year-Over-Year Growth in Spending
Source 13: CMS National Health Expenditure Accounts, January 2017. Available at https://www.cms.gov/research-statistics-data-and-systems/statistics-trends-and-reports/nationalhealthexpenddata/nationalhealthaccountsprojected.html. Accessed October 2017. QuintileslMS, National Sales Perspectives, Dec 2016; QuintileslMS Institute Aug 2017. Available at http://www.imshealth.com/files/web/IMSH%20Institute/Reports/QIIHI_Understanding_the_Drivers_of_Drug_Expenditure_US.pdf. Accessed October 2017.Source 13 a: Centers for Medicare and Medicaid Services (CMS). National Health Care Spending In 2016. Available at https://www.cms.gov/Research-Statistics-Data-and-Systems/Statistics-Trends-and-Reports/NationalHealthExpendData/Downloads/NHE-Presentation-Slides.pdf. Accessed April 2018.
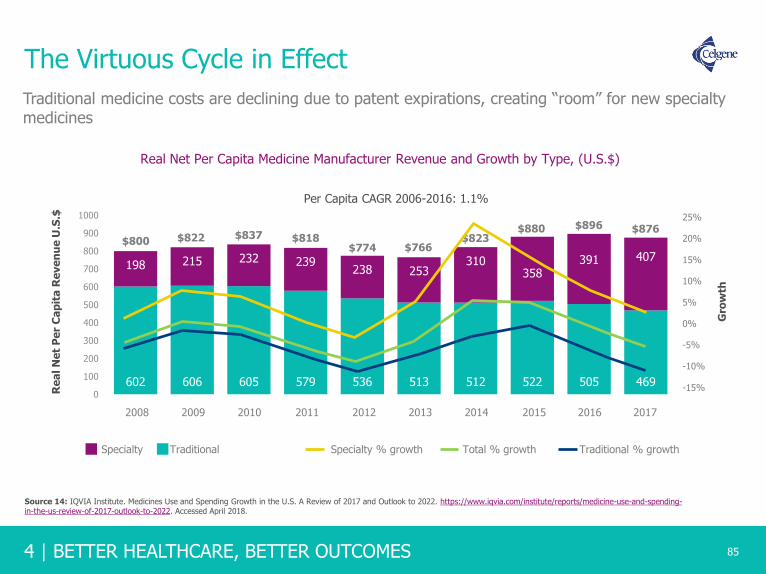
4 | BETTER HEALTHCARE, BETTER OUTCOMES
602 606 605 579 536 513 512 522 505 469
198 215 232 239238 253
310358
391 407
0
100
200
300
400
500
600
700
800
900
1000
The Virtuous Cycle in Effect
85
Real Net Per Capita Medicine Manufacturer Revenue and Growth by Type, (U.S.$)
Specialty % growth Total % growth Traditional % growth
2008 2009 2010 2011 2012 2013 2014 2015 2016 2017
$800 $822 $837 $818$774 $766
$823
$896 $87625%
20%
15%
10%
5%
0%
-5%
-10%
-15%
Per Capita CAGR 2006-2016: 1.1%
Re
al N
et
Pe
r C
ap
ita
Re
ve
nu
e U
.S.$
$880
Specialty Traditional
Gro
wth
Traditional medicine costs are declining due to patent expirations, creating “room” for new specialty medicines
Source 14: IQVIA Institute. Medicines Use and Spending Growth in the U.S. A Review of 2017 and Outlook to 2022. https://www.iqvia.com/institute/reports/medicine-use-and-spending-in-the-us-review-of-2017-outlook-to-2022. Accessed April 2018.

6 | WHO IS CELGENE? 86
4 | BETTER HEALTHCARE, BETTER OUTCOMES
Prescription Net Revenue Growth is Expected to Average 2-5% Through 2021
86
Net Medicines Revenue Growth and Contribution by Type
14%
12%
10%
8%
6%
4%
2%
0
-2%
-4%
-6%
-8%
2012 2013 2014 2015 2016 2017 2018 2019 2020 2021
Existing products volume growth New brands Total growthExisting products price growth
Growth will be driven by new and existing products and offset by patent expirations
Source 15: QuintileslMS, National Sales Perspectives, Market Prognosis, OuintileslMS Institute, Mar 2017. Available at http://www.imshealth.com/files/web/IMSH%20Institute/Reports/QIIHI_Understanding_the_Drivers_of_Drug_Expenditure_US.pdf. Accessed October 2017.

4 | BETTER HEALTHCARE, BETTER OUTCOMES
Forecasts of Specialty Drug Spending Have Been Routinely Overstated
87
An analysis of annual drug trend reports found that inconsistent definitions of ”specialty medicines” can bias spending projections
24% 27%
19%
27% 17%
18%
2011 2012 2013
Forecast vs. Actual Growth in Specialty Medication SpendingFrom a Major Pharmacy Benefits Management Company*
Forecasted 2 years prior Forecasted 1 year prior As reported for year
17% 18%
14%
* As reported in annual Drug Trend Reports from Express Scripts.
Source 16: Dieguez G, et. al. Milliman, Inc. Understanding Specialty Drug Forecasts. Available at http://phrma-docs.phrma.org/sites/default/files/pdf/milliman-specialty-drug-forecasts.pdf. Accessed July 2017.

6 | WHO IS CELGENE? 88
4 | BETTER HEALTHCARE, BETTER OUTCOMES 88
Cost of Cancer Treatment is and is Expected to Remain, a Small Portion of Total Personal Healthcare Expenditures
4.4
5.0
6.0
4.84.5 4.7 4.7
4.4
5.65.1
4.2
0
1
2
3
4
5
6
7
1963 1972 1980 1985 1990 1995 2004 2005 2010 2015 2020
%
PROJECTED
*
*Calculated based on available data, sources a through d
Source 17: (1963-2004) National Cancer Institute. Cancer Trends Progress Report – 2007 Update. Table L1: National Cancer Treatment Expenditures in Billions of Dollars (1963-2004). Available at http://www.progressreport.cancer.gov/sites/default/files/archive/report2007.pdf. Accessed August 2017. Source 17 a: Centers for Disease Control. Table 111 Gross domestic product, national health expenditures, per capita amounts, percent distribution, and average annual percent change: United States, selected years 1960–2011. Available at http://www.cdc.gov/nchs/hus/contents2012.htm#111. Accessed August 2017. Source 17 b: Center for Medicare and Medicaid Services. National Health Expenditure Projections 2012-2022. Available at https://www.cms.gov/Research-Statistics-Data-and-Systems/Statistics-Trends-and-Reports/NationalHealthExpendData/Downloads/Proj2012.pdf. Accessed August 2017. Source 17 c: Mariotto A. et al. Journal of the National Cancer Institute. Available at https://www.ncbi.nlm.nih.gov/pmc/articles/PMC3107566/table/tbl5/. Accessed August 2017. Source 17 d: National Cancer Institute. National Expenditures for Cancer Care. Available at https://costprojections.cancer.gov/expenditures.html. Accessed August 2017.Source 17 e: Cutler, D. Are we Finally Winning the War on Cancer? J Econ Persp 2008:22(4);3-26. Mariotto A, Yabroff K, Shao Y, et al. Projections of the Cost of Cancer Care in the United States: 2010–2020. J Natl Cancer Inst. 2011;103(2):117-128. Centers for Medicare and Medicaid Services. Available at Accessed August 2017.
** *

4 | BETTER HEALTHCARE, BETTER OUTCOMES
New Cancer Therapies: Small Cost, Large Impact for Patients and Society
89
Spending on cancer medicines represents about 1% of overall healthcare spending
Cancer Treatment Spending
All Remaining Healthcare Spending
*Cancer medication invoice spending and does not include discounts**2016 CMS total National Health Expenditures is a projection
Cancer medicines* as a portion of National Health Expenditures Projected Total U.S. Healthcare Spending, 2016**
Source 18: QuintileIMS Institute. Medicines Use and Spending in the U.S. A Review of 2016 and Outlook to 2021. Available at https://structurecms-staging-psyclone.netdna-ssl.com/client_assets/dwonk/media/attachments/590c/6aa0/6970/2d2d/4182/0000/590c6aa069702d2d41820000.pdf?1493985952. Page 32. Accessed July 2017.Source 18 a: CMS Projected National Healthcare Expenditure Data. Available at /https://www.cms.gov/research-statistics-data-and-systems/statistics-trends-and-reports/nationalhealthexpenddata/nationalhealthaccountsprojected.html. Accessed November 2017.
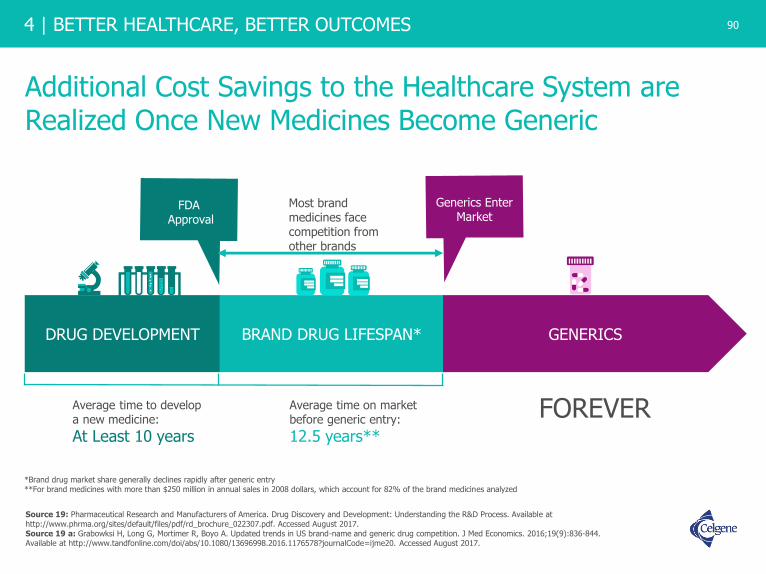
6 | WHO IS CELGENE? 90
4 | BETTER HEALTHCARE, BETTER OUTCOMES
Additional Cost Savings to the Healthcare System are Realized Once New Medicines Become Generic
90
DRUG DEVELOPMENT BRAND DRUG LIFESPAN* GENERICS
FDAApproval
Generics Enter Market
Most brand medicines face competition from other brands
Average time to develop a new medicine:
At Least 10 years
Average time on market before generic entry:
12.5 years**
*Brand drug market share generally declines rapidly after generic entry**For brand medicines with more than $250 million in annual sales in 2008 dollars, which account for 82% of the brand medicines analyzed
FOREVER
Source 19: Pharmaceutical Research and Manufacturers of America. Drug Discovery and Development: Understanding the R&D Process. Available at http://www.phrma.org/sites/default/files/pdf/rd_brochure_022307.pdf. Accessed August 2017. Source 19 a: Grabowksi H, Long G, Mortimer R, Boyo A. Updated trends in US brand-name and generic drug competition. J Med Economics. 2016;19(9):836-844. Available at http://www.tandfonline.com/doi/abs/10.1080/13696998.2016.1176578?journalCode=ijme20. Accessed August 2017.
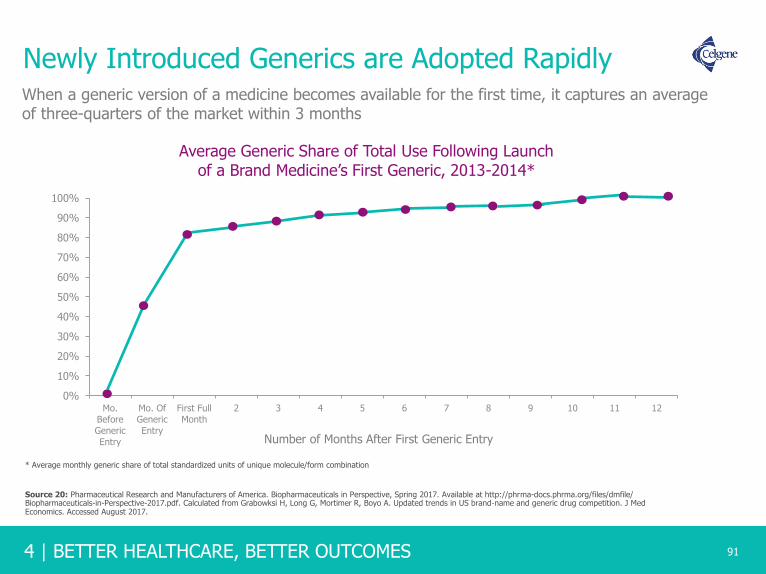
4 | BETTER HEALTHCARE, BETTER OUTCOMES
Newly Introduced Generics are Adopted Rapidly
91
0%
10%
20%
30%
40%
50%
60%
70%
80%
90%
100%
Mo.Before
GenericEntry
Mo. OfGeneric
Entry
First FullMonth
2 3 4 5 6 7 8 9 10 11 12
Average Generic Share of Total Use Following Launchof a Brand Medicine’s First Generic, 2013-2014*
Number of Months After First Generic Entry
* Average monthly generic share of total standardized units of unique molecule/form combination
When a generic version of a medicine becomes available for the first time, it captures an average of three-quarters of the market within 3 months
Source 20: Pharmaceutical Research and Manufacturers of America. Biopharmaceuticals in Perspective, Spring 2017. Available at http://phrma-docs.phrma.org/files/dmfile/ Biopharmaceuticals-in-Perspective-2017.pdf. Calculated from Grabowksi H, Long G, Mortimer R, Boyo A. Updated trends in US brand‐name and generic drug competition. J Med Economics. Accessed August 2017.

6 | WHO IS CELGENE? 92
4 | BETTER HEALTHCARE, BETTER OUTCOMES
As Innovator Brands Lose Exclusivity, Generics Account for an Increasing Percentage of Total Prescriptions
92
46% 43% 40% 37% 33%28% 25% 22% 20% 16% 14% 13% 12% 11% 10%
54% 57% 60% 63% 67%72% 75% 78% 80% 84% 86% 87% 88% 89% 90%
2003 2004 2005 2006 2007 2008 2009 2010 2011 2012 2013 2014 2015 2016 2017
Percent share of prescriptions
Innovator Brands Generics
Chart Notes: Includes all prescriptions dispensed through retail pharmacies, including independent and chain drug stores, food store pharmacies and mail order as well as long-term care facilities. Generics include branded and unbranded generic medicines. Prescription counts are not adjusted for length of therapy. 90-day and 30-day prescriptions are both counted as one prescription.
Source 21: IQVIA Institute for Human Data Science. Medicine Use and Spending in the US A Review of 2017 and Outlook to 2022. Available at https://www.iqvia.com/institute/reports/medicine-use-and-spending-in-the-us-review-of-2017-outlook-to-2022. Accessed January 2019.Source 21 a: Long D. The US Pharmaceutical Market: Trends and Outlook. April 2017. Accessed August 2017.

4 | BETTER HEALTHCARE, BETTER OUTCOMES
Generic Medicines Generated $253 Billion in Savings for Patients in 2016
93
– Pharmaceutical Research and Manufacturers of
America (PhRMA)
“The savings created by generic copies free up resources to invest in new treatments –creating headroom for innovation – and resulting in significant progress against some of the most costly and challenging diseases.”
Generic entries have exhibited steeper and faster priced reductions over time
Monthly Price Reductions for Oral Medicines after Loss of Exclusivity
2002-2004
2005-2007
2008-2010
2011-2013
2002-2014
0%
-20%
-40%
-60%
-80%
-100%
0 6 12 18 24 30 36
Pri
ce R
ed
ucti
on
s
Months Since Loss of Exclusivity
Source 22: IMS Health, National Sales Perspectives, March 2015. Available at http://stateofreform.com/featured/2017/06/generic-drugs-generated-253-billion-savings-2016/. Accessed July 2017. Source 22 a: IMS Health. Price Declines after Branded Medicines Lose Exclusivity in the U.S. Available at https://www.imshealth.com/files/web/IMSH%20Institute/Healthcare%20Briefs/PhRMA%20Generic%20Price%20Brief%20January%202016.pdf. Accessed August 2017.

6 | WHO IS CELGENE? 94
4 | BETTER HEALTHCARE, BETTER OUTCOMES 94
U.S. Prescription Drug Prices Fall Significantly Over Time Once Generic, Promoting Innovation and Affordability
Medicine YearBrandPrice
Generic Price
% Change
DOXIL®
Doxorubicin2013 $5,594 $162 -97%
XELODA®
Capecitabine2013 $3,401 $1,249 -63%
FEMARA®
Letrozole2011 $686 $15 -98%
GEMZAR®
Gemcitabine2011 $1,600 $102 -94%
ELOXATIN®
Oxaliplatin2008 $11,354 $341 -97%
Figures represent the monthly cost of the brand name product versus the generic
*The 10 therapeutic classes most commonly used by Part D enrollees in 2006 were: lipid regulators, angiotensin converting-enzyme inhibitors, calcium channel blockers, beta blockers, proton pump inhibitors, thyroid hormone, angiotensin II, codeine and combination products, antidepressants, and seizure disorder medications.
Daily Cost of Top-10* Therapeutic Classes Most Commonly Used by Part D Enrollees Has Declined
and is Estimated to Continue to Decline
0.00
0.20
0.40
0.60
0.80
1.00
1.20
1.40
1.60
Jan
-06
Jul-
06Ja
n-0
7Ju
l-07
Jan
-08
Jul-
08Ja
n-0
9Ju
l-09
Jan
-10
Jul-
10Ja
n-1
1Ju
l-11
Jan
-12
Jul-
12Ja
n-1
3Ju
l-13
Jan
-14
Jul-
14Ja
n-1
5Ju
l-15
Jan
-16
Jul-
16Ja
n-1
7Ju
l-17
Co
st P
er D
ay (
$)
From 2006 - 2017
ActualEstimated
Source 23: IMS Analysis of PhRMA, May 2015; Kleinrock M. Daily cost of Medicare Part D. December 2013 Update. December 2013. IMS Institute for Healthcare Informatics.Source 23 a: Celgene data on file.

4 | BETTER HEALTHCARE, BETTER OUTCOMES
Loss of Exclusivity Continues to Drive Substantial Price Decreases and Projected Savings in the Next Five Years
95
U.S. Impact of Brand Losses of Exclusivity 2013-2022, US$Bn
Chart notes: Lower brand spending based on invoice prices. Historic impacts from QuintilesIMS National Sales Perspectives, forecast impacts are modeled by projecting individual products sales growth to the point of patent expiry and then modeling expected impact based on historical analogues and actual data for in-progress events.
Source 24: IQVIA Institute for Human Data Science.. The Global Use of Medicine in 2019 and Outlook to 2023 Forecasts and Areas to Watch, January 2019. Available at https://www.iqvia.com/institute/reports/the-global-use-of-medicine-in-2019-and-outlook-to-2023. Accessed February 2019.
-0.2 -0.8 -1.0 -1.2 -2.9 -4.8 -4.9 -2.9 -1.5 -1.7
-12.9-13.8 -13.7 -14.4
-8.3
-21.2
-16.7
-10.1
-16.6-14.6
-13.1-14.6 -14.7
-15.6
-11.2
-26.0
-21.6
-13.0
-18.1
-16.3
2014 2015 2016 2017 2018 2019 2020 2021 2022 2023
Biologics Small Molecules Total Brand Loss
$69 Bn $95 Bn

6 | WHO IS CELGENE? 96
4 | BETTER HEALTHCARE, BETTER OUTCOMES 96
Barriers to Access

4 | BETTER HEALTHCARE, BETTER OUTCOMES
Patients in the U.S. Have Greater Access to Medicines When Compared to Other Highly Developed Countries
84%
78%76%
63%
57% 57%
49%47%
45%
41% 41%39%
27% 27%
18%
14%12% 12% 12%
10%
2%
0%
10%
20%
30%
40%
50%
60%
70%
80%
90%
97
2015 Availability of Oncology Medicines Launched 2010-2014
% access to the 49
oncology medicines (launched
2010-2014) in 2015
Access
Source 25: IMS Institute for HealthCare Informatics. “Global Oncology Trend Report. A Review of 2015 and Outlook to 2020.” Available at https://morningconsult.com/wp-content/uploads/2016/06/IMS-Institute-Global-Oncology-Report-05.31.16.pdf. Accessed August 2017.

6 | WHO IS CELGENE? 98
4 | BETTER HEALTHCARE, BETTER OUTCOMES 98
Patients Pay More For Prescription Medicines Than Other Medical Services
* Note: Prescription drug spending includes brand and generic ingredients, pharmacy and distribution costs for retail prescriptions. Hospital care includes inpatient and outpatient care.
3%
13%
0%
5%
10%
15%
20%
25%
Hospital Care Prescription Therapies*
Average patient cost sharing by type of service
in the commercial market, all ages
2014
Source 26: Pharmaceutical Research and Manufacturers of America. Biopharmaceutical Research in Perspective, Spring 2017. Calculated through Avalere Health analysis of the U.S. Department of Health and Human Services, Agency for Healthcare Research and Quality, Medical Expenditure Panel Survey, 2014. Available at https://meps.ahrq.gov/mepsweb. Accessed May 2017. Analysis includes individuals with any source of health care coverage, public or private; this includes individuals who had health coverage without coverage for prescription drugs, which can be expected to account for less than 2% of those with health coverage. Accessed August 2017.

4 | BETTER HEALTHCARE, BETTER OUTCOMES 99
Patients in the U.S. are Facing Rising Out-of-pocket Costs and Other Barriers to Care
23%
46%
2012 2016
Percent of plans with deductibles on prescription medicines
The use of four or more cost sharing tiers is becoming more common on employer plans
3%5%
7%
13% 14%
20%
23%
2004 2006 2008 2010 2012 2014 2015 2016
32%
Source 27: PWC, Health and Well-Being Touchstone Survey, June 2016. Available at https://www.pwc.com/us/en/hr-management/publications/assets/pwc-touchstone-2017.pdf. Accessed August 2017.Source 27 a: Kaiser Family Foundation/Health Research & Educational Trust, Employer Health Benefits: 2015 Annual Survey. Available at http://files.kff.org/attachment/Report-Employer-Health-Benefits-2016-Annual-Survey. Accessed October 2017.

6 | WHO IS CELGENE? 100
4 | BETTER HEALTHCARE, BETTER OUTCOMES 100
Plans Often Charge Patients a Percentage of a Medicine’s Total Cost Rather Than Fixed-Dollar Copays
Coinsurance
74%
Fixed-DollarCopays26%
Cost Sharing in Specialty Tiers of 2016 Silver Plans*
In the most frequently purchased type of Health Insurance Exchange plan, coinsurance for certain medicines is common: 74% of these plans require enrollees to pay a percentage of a specialty tier medicine’s total cost, with 36% of these plans requiring patients to pay coinsurance of more than 30% of the cost.
COINSURANCEIs a percentage of costs a patient is responsible for
paying with his or her own money (out of pocket).
Coinsurance can make a patient’s out-of-pocket costs
difficult to predict – and potentially much higher –
than fixed-dollar copays.
* Silver Plans are shown here because they account for a majority of Health Insurance Exchange enrollment. Plans subject different medicines to different levels of cost sharing, or “tiers”. Medicines assigned to a “specialty tier” typically require the highest level of cost sharing.
Source 28: Pearson C F. Avalere Health Release Majority of Drugs Now Subject to Coinsurance in Medicare Part D Plans. Available at http://avalere.com/expertise/managed-care/insights/majority-of-drugs-now-subject-to-coinsurance-in-medicare-part-d-plans data conducted using Avalere Health’s Data Frame database accessed here http://avalere.com/business-intelligence. Accessed August 2017.Source 28 a: Pharmaceutical Research and Manufacturers of America. Biopharmaceuticals in Perspective. Spring 2016. Available at http://phrma-docs.phrma.org/sites/default/files/pdf/chart-pack-biopharmaceuticals-in-perspective.pdf. Calculated with Avalere Health PlanScape©, http://go.avalere.com/acton/fs/blocks/showLandingPage/a/12909/p/p-00ed/t/page/fm/0 a proprietary analysis of exchange plan features, December 2015. This analysis is based on data collected by Managed Markets Insight & Technology, LLC. Accessed August 2017.
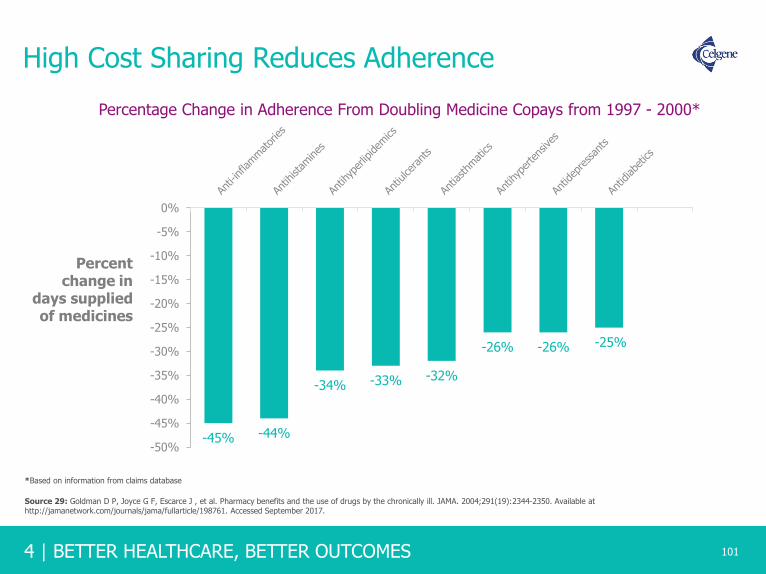
4 | BETTER HEALTHCARE, BETTER OUTCOMES
High Cost Sharing Reduces Adherence
101
-45% -44%
-34% -33% -32%
-26% -26% -25%
-50%
-45%
-40%
-35%
-30%
-25%
-20%
-15%
-10%
-5%
0%
Percent change in
days supplied of medicines
Percentage Change in Adherence From Doubling Medicine Copays from 1997 - 2000*
*Based on information from claims database
Source 29: Goldman D P, Joyce G F, Escarce J , et al. Pharmacy benefits and the use of drugs by the chronically ill. JAMA. 2004;291(19):2344-2350. Available at http://jamanetwork.com/journals/jama/fullarticle/198761. Accessed September 2017.

6 | WHO IS CELGENE? 102
4 | BETTER HEALTHCARE, BETTER OUTCOMES
Not All Cancer Medicines are Reimbursed Under Public Insurance Programs
102
100%
57%
38% 35% 33% 29% 29% 29% 24%
5%
43%
62% 65% 67% 71% 71% 71% 76%
95%
0
10
20
30
40
50
60
70
80
90
100
U.S. France UnitedKingdom
Australia Scotland Sweden Gerrmany Italy Canada Spain
Reimbursement Status in Public Programs of Cancer Medicines Approved in 2014 and 2015
Reimbursed Not Reimbursed
Note: The categorization of “not reimbursed” does not mean that there is no patient access to these medicines, and there may be non-standard means for obtaining access to new medicines through special funds and submission of applications for approval outside of standard guidelines.
Pe
rce
nt
of
Ap
pro
ve
d
Ca
nce
r M
ed
icin
es
Source 30: IMS Institute for HealthCare Informatics. “Global Oncology Trend Report. A Review of 2015 and Outlook to 2020”. Available at http://studyres.com/doc/2762501/cancer-medicines. Accessed August 2017.

4 | BETTER HEALTHCARE, BETTER OUTCOMES 103
21%
36%
45%
53%
65%67%
1 month 3 months 6 months
Percentage of Chronic Myeloid Leukemia Patients Initiating Treatment
Patients facing high cost sharing Patients facing minimal cost sharing
Source 31: Pharmaceutical Research and Manufacturers of America. Spring 2016. Available at http://phrma-docs.phrma.org/sites/default/files/pdf/biopharmaceutical-industry-profile.pdf. Cost Sharing and TKI Adherence. Journal of Clinical Oncology. 2016;22(3):188-197file:///C:/Users/nicole.ferrito/Downloads/jco.2013.52.9123.pdf. Accessed August 2017.Source 31 a: Doshi JA, Li P, Ladage VP, Pettit AR, Taylor EA. Impact of cost sharing on specialty drug utilization and outcomes: a review of the evidence and future directions. Am J Managed Care. 2016;22(3):188-197. http://www.ajmc.com/journals/issue/2016/2016-vol22-n3/Impact-of-Cost-Sharing-on-Specialty-Drug-Utilization-and-Outcomes-A-Review-of-the-Evidence-and-FutureDirections. Accessed March 2016.
Patients Facing High Cost Sharing Commonly Do Not Initiate Treatment

6 | WHO IS CELGENE? 104
4 | BETTER HEALTHCARE, BETTER OUTCOMES
Cancer Patients Abandon Treatment Due to High CostSharing Hurdles
104
9%
13%
29%
38%
45%
<$10 $50.01-$100 $100.01-$500 $500.01-$2000 >$2000
Oral Oncolytic Abandonment Rate by Patient Out-of-Pocket Amount
Highest co-pay group was 6 times more likely to delay treatment than the lowest
copay group.
Source 32: Doshi JA Li P. Huo H, Pettit AR, Armstrong K. Higher patient cost sharing is associated with prescription abandonment and delay in fills of novel oral oncolytic prescriptions. Proceedings of the 22nd Annual International Meeting International Society of Pharmacoeconomics and Outcomes Research; 2017 May; Boston, MA. Abstract available at https://www.ispor.org/ScientificPresentationsDatabase/Presentation/73657?pdfid=49504. Accessed September 2017.
4 | BETTER HEALTHCARE, BETTER OUTCOMES
Notes and Sources
105
1. Lichtenberg FR. NBER Working Paper No. 18235. Pharmaceutical innovation and longevity growth in 30 developing and high-income countries, 2000-2009. Available at http://www.nber.org/papers/w18235. Accessed July 2017.
1 a: Lichtenberg FR. NBER Working Paper No. 9754. The impact of new drug launches on longevity: evidence from longitudinal disease-level data from 52 countries, 1982-2001. Available at http://www.nber.org/papers/w9754. Accessed July 2017.
2. EFPIA 2015, H&G evidence compendium. Available at http://efpia.morris-chapman.net/documents/160/138/2015-Health-amp-Growth-evidence-compendium-Slide-decks. Accessed July 2017. Calculated at OECD (2015), Average annual growth in pharmaceutical and total health expenditure per capita, in real terms, average across OECD countries, 1990 to 2013 (or nearest year), in Health at a Glance 2015, OECD Publishing, Paris. Available at http://dx.doi.org/10.1787/health_glance-2015-graph8-en. Accessed August 2017.
3. OECD, Disposable Income Per Capita: 2013 Data; 2014: United States, Australia, Netherlands, Finland; 2012: New Zealand; 2009: Japan, Total Hospital Spending, Hospital Spending Per Capita: 2014 estimated data; 2013: Australia, Japan, and Norway; 2007 New Zealand, Total drug spend, Drug spend per capita: 2014 Data, 2013: Australia, Japan; 2007: New Zealand. Available at https://data.oecd.org/healthres/pharmaceutical-spending.htm. Accessed August 2017.
4. IMS Institute for Healthcare Informatics. Avoidable costs in US healthcare: the $200 billion opportunity from using medicines more responsibly. Available at http://www.imshealth.com/files/web/IMSH%20Institute/Reports/Avoidable_Costs_in%20_US_Healthcare/IHII_AvoidableCosts_2013.pdf. Published June 2013. Accessed August 2017.
5. Lichtenberg F. Benefits and Costs of Newer Drugs: An Update. National Bureau of Economic Research, Working Paper No. 8996. June 2007. Available at http://www.nber.org/papers/w8996. Accessed August 2017.
6. Part D Helps Reduce Medicare Spending, Says CBO. The Campaign for Modern Medicines. Feb. 25, 2013. Available at https://modernmedicines.com/entry.php?id=271. Accessed August 2017. Calculated from McWilliams J. Implementation of Medicare Part D and Nondrug Medical Spending for Elderly Adults With Limited Prior Drug Coverage. JAMA. 2011;306(4):402-409. Available at http://jamanetwork.com/journals/jama/fullarticle/1104150. Accessed August 2017.
7. Adler L., Rosenberg. A. The $500 Billion Medicare Slowdown: A Story About Part D. Health Affairs Blog. Available at http://healthaffairs.org/blog/2014/10/21/the-500-billion-medicare-slowdown-a-story-about-part-d/. Accessed August 2017.
8. Afendulis CC, Chernew ME. State‐level impacts of Medicare Part D. Am J Managed Care. 2011;17 Suppl 12:S. Available at
http://www.ajmc.com/journals/supplement/2011/StateLevelImpactsofMedicarePartD/StateLevelImpactsofMedicarePartD/. Accessed August 2017.
8 a: Semilla AP, Chen F, Dall TM. Reductions in mortality among Medicare beneficiaries following the implementation of Medicare Part D. Am JManaged Care. 2015;21:S165-S172. Available at http://www.ajmc.com/journals/supplement/2015/a580_jul15_medicarepartd/a580_jul15_medicarepartd_web. Accessed August 2017.8 b: McWilliams JM, Zaslavsky AM, Huskamp HA. Implementation of Medicare Part D and nondrug medical spending for elderly adults with limited prior drug coverage. JAMA. 2011;306(4):402‐409. Available at http://jamanetwork.com/ on 08/20/2017. Accessed August 2017.
9. Medicare Today. Senior Satisfaction Survey. Available at http://medicaretoday.org/wp-content/uploads/2017/08/2017-Senior-Satisfaction-Survey-Fact-Sheet.pdf. Accessed September 2017.
9 a: : My Medicare Matters National Council on Aging. How Much Does Medicare Part D Cost?. https://www.mymedicarematters.org/costs/part-d/. Accessed December 2018.9 b: The Kaiser Family Foundation. The Medicare Part D Prescription Drug Benefit. Available at http://files.kff.org/attachment/Fact-Sheet-An-Overview-of-the-Medicare-Part-D-Prescription-Drug-Benefit. Accessed December 2018.
10. Centers for Medicare & Medicaid Services. National Health Expenditures 2017 Highlights. Available at https://www.cms.gov/Research-Statistics-Data-and-Systems/Statistics-Trends-and-Reports/NationalHealthExpendData/Downloads/highlights.pdf. Accessed December 2018.
10 a: : Centers for Medicare & Medicaid Services (CMS). National Health Care Spending In 2017 Historical Tables. Available at https://www.cms.gov/Research-Statistics-Data-and-Systems/Statistics-Trends-and-Reports/NationalHealthExpendData/NationalHealthAccountsHistorical.html. Accessed December 2018.

6 | WHO IS CELGENE? 106
4 | BETTER HEALTHCARE, BETTER OUTCOMES 106
Notes and Sources (cont.)11. Source 14: QuintilesIMS, IQVIA National Sales Perspectives, IQVIA Institute, April 2018. Available at https://www.iqvia.com/institute/reports/medicine-use-and-spending-in-the-us-review-of-
2017-outlook-to-2022. Accessed June 2018.
12. QuintilesIMS, IQVIA National Sales Perspectives, IQVIA Institute, April 2018. Available at https://www.iqvia.com/institute/reports/medicine-use-and-spending-in-the-us-review-of-2017-outlook-to-2022. Accessed June 2018.
13. CMS National Health Expenditure Accounts, January 2017. Available at https://www.cms.gov/research-statistics-data-and-systems/statistics-trends-and-reports/nationalhealthexpenddata/nationalhealthaccountsprojected.html. Accessed October 2017. QuintileslMS, National Sales Perspectives, Dec 2016; QuintileslMS Institute Aug 2017. Available at http://www.imshealth.com/files/web/IMSH%20Institute/Reports/QIIHI_Understanding_the_Drivers_of_Drug_Expenditure_US.pdf. Accessed October 2017.
13 a: Centers for Medicare and Medicaid Services (CMS). National Health Care Spending In 2016. Available at https://www.cms.gov/Research-Statistics-Data-and-Systems/Statistics-Trends-and-Reports/NationalHealthExpendData/Downloads/NHE-Presentation-Slides.pdf. Accessed April 2018.
14. QuintileslMS, National Sales Perspectives, Dec 2016; QulntlleslMS Institute Aug 2017. Available at http://www.imshealth.com/files/web/IMSH%20Institute/Reports/QIIHI_Understanding_the_Drivers_of_Drug_Expenditure_US.pdf. Accessed October 2017.
15. QuintileslMS, National Sales Perspectives, Dec 2016; QulntlleslMS Institute Aug 2017. Available at http://www.imshealth.com/files/web/IMSH%20Institute/Reports/QIIHI_Understanding_the_Drivers_of_Drug_Expenditure_US.pdf. Accessed October 2017.
16. Dieguez G, et. al. Milliman, Inc. Understanding Specialty Drug Forecasts. Available at http://phrma-docs.phrma.org/sites/default/files/pdf/milliman-specialty-drug-forecasts.pdf. Accessed July 2017.
17. (1963-2004) National Cancer Institute. Cancer Trends Progress Report – 2007 Update. Table L1: National Cancer Treatment Expenditures in Billions of Dollars (1963-2004). Available at http://www.progressreport.cancer.gov/sites/default/files/archive/report2007.pdf. Accessed August 2017.
17 a: Centers for Disease Control. Table 111 Gross domestic product, national health expenditures, per capita amounts, percent distribution, and average annual percent change: United States, selected years 1960–2011. Available at http://www.cdc.gov/nchs/hus/contents2012.htm#111. Accessed August 2017. 17 b: Center for Medicare and Medicaid Services. National Health Expenditure Projections 2012-2022. Available at https://www.cms.gov/Research-Statistics-Data-and-Systems/Statistics-Trends-and-Reports/NationalHealthExpendData/Downloads/Proj2012.pdf. Accessed August 2017. 17 c: Mariotto A. et al. Journal of the National Cancer Institute. Available at https://www.ncbi.nlm.nih.gov/pmc/articles/PMC3107566/table/tbl5/. Accessed August 2017. 17 d: National Cancer Institute. National Expenditures for Cancer Care. Available at https://costprojections.cancer.gov/expenditures.html. Accessed August 2017.17 e: Cutler, D. Are we Finally Winning the War on Cancer? J Econ Persp 2008:22(4);3-26. Mariotto A, Yabroff K, Shao Y, et al. Projections of the Cost of Cancer Care in the United States: 2010–2020. J Natl Cancer Inst. 2011;103(2):117-128. Centers for Medicare and Medicaid Services. Available at Accessed August 2017.
18. QuintilesIMS Institute. Medicines Use and Spending in the U.S. A Review of 2016 and Outlook to 2021. Available at https://structurecms-staging-psyclone.netdna-ssl.com/client_assets/dwonk/media/attachments/590c/6aa0/6970/2d2d/4182/0000/590c6aa069702d2d41820000.pdf?1493985952. Page 32. Accessed July 2017. 18 a: CMS Projected National Healthcare Expenditure Data. Available at /https://www.cms.gov/research-statistics-data-and-systems/statistics-trends-and-reports/nationalhealthexpenddata/nationalhealthaccountsprojected.html. Accessed November 2017.
19. Pharmaceutical Research and Manufacturers of America. Drug Discovery and Development: Understanding the R&D Process. Available at http://www.phrma.org/sites/default/files/pdf/rd_brochure_022307.pdf. Accessed August 2017. 19 a: Grabowksi H, Long G, Mortimer R, Boyo A. Updated trends in US brand-name and generic drug competition. J Med Economics. 2016;19(9):836-844. Available at http://www.tandfonline.com/doi/abs/10.1080/13696998.2016.1176578?journalCode=ijme20. Accessed August 2017.
4 | BETTER HEALTHCARE, BETTER OUTCOMES 107
Notes and Sources (cont.)20. Pharmaceutical Research and Manufacturers of America. Biopharmaceuticals in Perspective, Spring 2017. Available at http://phrma-docs.phrma.org/files/dmfile/ Biopharmaceuticals-in
Perspective-2017.pdf. Calculated from Grabowksi H, Long G, Mortimer R, Boyo A. Updated trends in US brand‐name and generic drug competition. J Med Economics. Accessed August 2017.
21. IQVIA Institute for Human Data Science. Medicine Use and Spending in the US A Review of 2017 and Outlook to 2022. Available at https://www.iqvia.com/institute/reports/medicine-use-and-spending-in-the-us-review-of-2017-outlook-to-2022. Accessed January 2019.21 a: Long D. The US Pharmaceutical Market: Trends and Outlook. April 2017. Accessed August 2017.
22. IMS Health, National Sales Perspectives, March 2015. Available at http://stateofreform.com/featured/2017/06/generic-drugs-generated-253-billion-savings-2016/. Accessed July 2017. 22 a: IMS Health. Price Declines after Branded Medicines Lose Exclusivity in the U.S. Available athttps://www.imshealth.com/files/web/IMSH%20Institute/Healthcare%20Briefs/PhRMA%20Generic%20Price%20Brief%20January%202016.pdf. Accessed August 2017.
23. IMS Analysis of PhRMA, May 2015; Kleinrock M. Daily cost of Medicare Part D. December 2013 Update. December 2013. IMS Institute for Healthcare Informatics. Accessed August 2017.23 a: Celgene data on file.
24. IQVIA Institute for Human Data Science.. The Global Use of Medicine in 2019 and Outlook to 2023 Forecasts and Areas to Watch, January 2019. Available at https://www.iqvia.com/institute/reports/the-global-use-of-medicine-in-2019-and-outlook-to-2023. Accessed February 2019.
25. IMS Institute for HealthCare Informatics. “Global Oncology Trend Report. A Review of 2015 and Outlook to 2020.” Available at https://morningconsult.com/wp-content/uploads/2016/06/IMS-Institute-Global-Oncology-Report-05.31.16.pdf. Accessed August 2017.
26. Pharmaceutical Research and Manufacturers of America. Biopharmaceutical Research in Perspective, Spring 2017. Calculated through Avalere Health analysis of the US Department of Healthand Human Services, Agency for Healthcare Research and Quality, Medical Expenditure Panel Survey, 2014. https://meps.ahrq.gov/mepsweb. Accessed May 2017. Analysis includes individualswith any source of health care coverage, public or private; this includes individuals who had health coverage without coverage for prescription drugs, which can be expected to account for lessthan 2% of those with health coverage. Accessed August 2017.
27. PWC, Health and Well-Being Touchstone Survey, June 2016. Available at https://www.pwc.com/us/en/hr-management/publications/assets/pwc-touchstone-2017.pdf. Accessed August 2017.27 a: Kaiser Family Foundation/Health Research & Educational Trust, Employer Health Benefits: 2015 Annual Survey. Available at http://files.kff.org/attachment/Report-Employer-Health-Benefits-2016-Annual-Survey. Accessed October 2017.
28. Pearson C F. Avalere Health Release Majority of Drugs Now Subject to Coinsurance in Medicare Part D Plans. Available at http://avalere.com/expertise/managed-care/insights/majority-of-drugs-now-subject-to-coinsurance-in-medicare-part-d-plans data conducted using Avalere Health’s Data Frame database accessed here http://avalere.com/business-intelligence. Accessed August 2017.28 a: Pharmaceutical Research and Manufacturers of America. Biopharmaceuticals in Perspective. Spring 2016. http://phrma-docs.phrma.org/sites/default/files/pdf/chart-pack-biopharmaceuticals-in-perspective.pdf. Calculated with Avalere Health PlanScape©, http://go.avalere.com/acton/fs/blocks/showLandingPage/a/12909/p/p-00ed/t/page/fm/0 a proprietary analysis of exchange planfeatures, December 2015. This analysis is based on data collected by Managed Markets Insight & Technology, LLC. Accessed August 2017.
29. Goldman D P, Joyce G F, Escarce J , et al. Pharmacy benefits and the use of drugs by the chronically ill. JAMA. 2004;291(19):2344-2350. Available at http://jamanetwork.com/journals/jama/fullarticle/198761. Accessed September 2017.
30. IMS Institute for HealthCare Informatics. “Global Oncology Trend Report. A Review of 2015 and Outlook to 2020”. Available at https://morningconsult.com/wp-content/uploads/2016/06/IMS-Institute-Global-Oncology-Report-05.31.16.pdf. Accessed August 2017.

6 | WHO IS CELGENE? 108
4 | BETTER HEALTHCARE, BETTER OUTCOMES 108
Notes and Sources (cont.)31. Pharmaceutical Research and Manufacturers of America. Spring 2016. Available at http://phrma-docs.phrma.org/sites/default/files/pdf/biopharmaceutical-industry-profile.pdf. Cost Sharing and
TKI Adherence. Journal of Clinical Oncology. 2016;22(3):188-197file:///C:/Users/nicole.ferrito/Downloads/jco.2013.52.9123.pdf. Accessed August 2017.31 a: Doshi JA, Li P, Ladage VP, Pettit AR, Taylor EA. Impact of cost sharing on specialty drug utilization and outcomes: a review of the evidence and future directions. Am J Managed Care.2016;22(3):188-197. http://www.ajmc.com/journals/issue/2016/2016-vol22-n3/Impact-of-Cost-Sharing-on-Specialty-Drug-Utilization-and-Outcomes-A-Review-of-the-Evidence-andFutureDirections. Accessed March 2016.
32. Doshi J A Li P. Huo H, Pettit A R, Armstrong K. Higher patient cost sharing is associated with prescription abandonment and delay in fills of novel oral oncolytic prescriptions. Proceedings of the22nd Annual International Meeting International Society of Pharmacoeconomics and Outcomes Research; 2017 May; Boston, MA. Abstract available athttps://www.ispor.org/ScientificPresentationsDatabase/Presentation/73657?pdfid=49504. Accessed September 2017.

4 | BETTER HEALTHCARE, BETTER OUTCOMES 109

6 | WHO IS CELGENE? 110
4 | BETTER HEALTHCARE, BETTER OUTCOMES 110

5
5 | WORKING TOWARD A WORLD FREE FROM CANCERS
WORKING TOWARD A WORLD FREE FROM CANCERS
111
WHAT IS REQUIRED TO ACCELERATE INNOVATION IN CANCER?
This section will highlight the importance of sustaining and spreading innovation throughout the world. The alternative would create the negative impact of halting medical progress and advancements in cancer, including its effect on survival, death, prosperity and progress.
The cost and commitment necessary to keep our promise of a world free from cancers is increasing – and the investment required is not keeping up.
Impeding innovation and interrupting the virtuous cycle of medical progress will cost both lives and economic growth. Fortunately, we know what is needed to sustain the incentives for investment in innovation to continue medical progress in the 21st century.
Kathleen Scannapieco was diagnosed with multiple myeloma

6 | WHO IS CELGENE? 112
5 | WORKING TOWARD A WORLD FREE FROM CANCERS 112

Cancer research today, especially on thefrontiers America’s cancer researchers arerenowned for spearheading, requires investmentat a scale unimaginable 40 years ago.“
”National Cancer Institute
113

6 | WHO IS CELGENE? 114
5 | WORKING TOWARD A WORLD FREE FROM CANCERS
A Collaborative Ecosystem is Necessary to Accelerate Innovation
114
Media
AcademicInstitutio
ns
Government
Research
Medical Societies
LIFE SCIENCES COMPANIES
ACADEMICINSTITUTIONS
GOVERNMENTRESEARCH
MEDIA
MEDICAL SOCIETIES
PATIENT ADVOCACY ORGANIZATIONS
MEDICALINNOVATION

5 | A WORKING TOWARD A WORLD FREE FROM CANCERS
What’s at Stake …
115
“
Today’s investments in healthcare and R&D are working toward a world free from cancers as we know them today for our children and our children’s children.
Genetherapy
Precisionmedicine
OFFER HOPE
Proteomics
Epigenetics
Nanotechnology
Cancermetabolism
Immuno-therapy

6 | WHO IS CELGENE? 116
5 | WORKING TOWARD A WORLD FREE FROM CANCERS
Maximizing the Promise of Science:7,000+ Medicines in Development Globally in 2016
116
*Defined as single products that are counted exactly once regardless of the number of indications pursued
Source 1: Biopharmaceuticals in Perspective, Spring 2017. Available a thttp://phrma-docs.phrma.org/files/dmfile/Biopharmaceuticals-in-Perspective-2017.pdf. Calculated from Adis R&D Insight Database. Accessed August 2017.
836
566
420311
563 171 13577
0
400
800
1,200
Cancer Rare Diseases NeurologicalDisorders
AutoimmuneDiseases
Heart Disease &Stroke
Diabetes Mental HealthDisorders
Alzheimer'sDiseases
Number of medicines
Biopharmaceutical researchers are working on new medicines* for many diseases, including:

5 | A WORKING TOWARD A WORLD FREE FROM CANCERS
More New Therapies May Lead to More Survivors
117
Number of cancer
therapies approved by year*
Source 2: FDA. Approved Drugs for Oncology. Available at https://www.centerwatch.com/drug-information/fda-approved-drugs/therapeutic-area/12/oncology. Accessed April 2018.Source 2 a: American Cancer Society. Facts & Figures 2018: Rate of Deaths From Cancer Continues Decline. Available at https://www.cancer.org/latest-news/facts-and-figures-2018-rate-of-deaths-from-cancer-continues-decline.html. Accessed April 2018.Source 2 b: Center for Disease Control and Prevention. Cancer Survivors. United States, 2007. CenterWatch. Available at http://www.cdc.gov/mmwr/preview/mmwrhtml/mm6009a1.htm. Accessed August 2017.
4
68
102
190206
0
50
100
150
200
250
1995 2001 2007 2016 2017
Cancer survivors (millions)
3.0
9.8
11.7
15.5
0
2
4
6
8
10
12
14
16
18
1971 2001 2007 2016
*Cumulative number of cancer therapies approved by year starting from 1995

6 | WHO IS CELGENE? 118
5 | WORKING TOWARD A WORLD FREE FROM CANCERS
Major Scientific Advances in Cancer Treatment Pipeline Give Patients Hope
118
The cancer pipeline is ripe with with innovative therapeutic options. Emerging combinations of
medicines hold particular promise for controlling and killing cancer cells.
Source 3: World Medical innovation Forum: Cancer. “Disruptive Dozen 2016.” http://worldmedicalinnovation.org/wp-content/uploads/2016/04/Parners-FORUM-2016-BROCHURE-D12-Cancer-160422_0942_FREV1-WEB-X3-5M-SPREAD.pdf: Source 3 a: McGinley. L. “The list of cancers that can be treated by immunotherapy keeps growing.” The Washington Post. https//www.washingtonpost.com/news/to-your-health/wp/2016/04/19/breathrough-cancer-therapy-shows-growing-promise/Source 3 b: Batra S. et al. Cancer metabolism as a therapeutic target. Available at https://www.ncbi.nlm.nih.gov/pubmed/25184270. Accessed August 2017.Source 3 c: National Cancer Institute. Oncolytic Virus Therapy Shows Benefit in Patients with Melanoma. Available at . https://www.cancer.gov/news-events/cancer-currents-blog/2015/oncolyticvirus-melanoma. Accessed August 2017.
Dr. Louis WeinerDirector of the Georgetown Lombardi Comprehensive Cancer Center
“We’re really
seeing the fruits of many years of
research into what drives cancer and how it interacts
with the immune system to defeat it
and survive.
”
Chimeric AntigenReceptor (CAR) T-cell Adoptive Cell Therapy
involves the modification of individuals’ immune-boosting T-cells to target and kill blood cancer cells
Cancer Metabolism-Targeting Drugs
disrupt cancer cell metabolism and can impede cancer cell growth.
CRISPR Gene Editing allows researchers to manipulate cancer cell function
Immunotherapieshelp target and kill cancer cells by “releasing the breaks” on the immune system
Oncolytic Viral Therapies
zero in on cancer cells, replicate and cause them to rupture stimulating an immune response
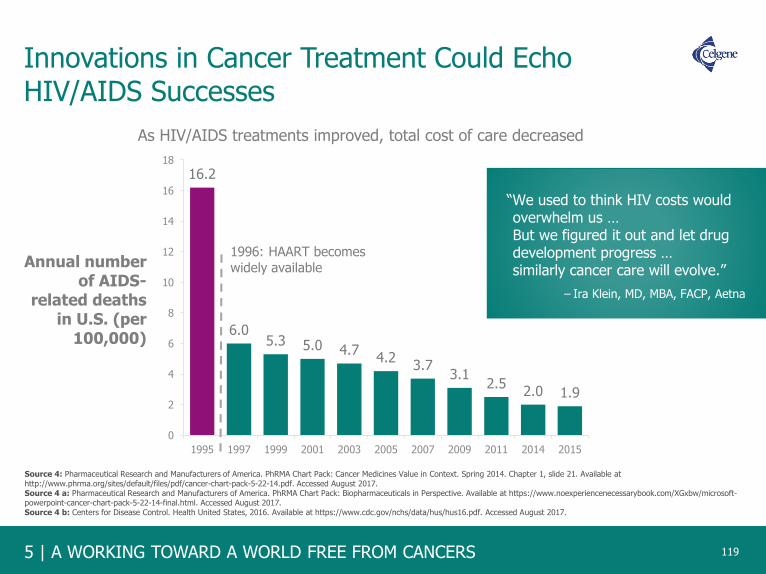
5 | A WORKING TOWARD A WORLD FREE FROM CANCERS
Innovations in Cancer Treatment Could Echo HIV/AIDS Successes
119
16.2
6.05.3 5.0 4.7
4.23.7
3.12.5
2.0 1.9
0
2
4
6
8
10
12
14
16
18
1995 1997 1999 2001 2003 2005 2007 2009 2011 2014 2015
Annual number of AIDS-
related deaths in U.S. (per
100,000)
“We used to think HIV costs would overwhelm us … But we figured it out and let drug development progress … similarly cancer care will evolve.”
As HIV/AIDS treatments improved, total cost of care decreased
1996: HAART becomes widely available
Source 4: Pharmaceutical Research and Manufacturers of America. PhRMA Chart Pack: Cancer Medicines Value in Context. Spring 2014. Chapter 1, slide 21. Available at http://www.phrma.org/sites/default/files/pdf/cancer-chart-pack-5-22-14.pdf. Accessed August 2017. Source 4 a: Pharmaceutical Research and Manufacturers of America. PhRMA Chart Pack: Biopharmaceuticals in Perspective. Available at https://www.noexperiencenecessarybook.com/XGxbw/microsoft-powerpoint-cancer-chart-pack-5-22-14-final.html. Accessed August 2017.Source 4 b: Centers for Disease Control. Health United States, 2016. Available at https://www.cdc.gov/nchs/data/hus/hus16.pdf. Accessed August 2017.
– Ira Klein, MD, MBA, FACP, Aetna

6 | WHO IS CELGENE? 120
5 | WORKING TOWARD A WORLD FREE FROM CANCERS
Hepatitis C (HCV): Cure Rates are Rising
120
Source 5: Pharmaceutical Research and Manufacturers of America. PhRMA Chart Pack: Biopharmaceuticals in Perspective. Spring 2017. Available at http://phrma-
docs.phrma.org/files/dmfile/Biopharmaceuticals-in-Perspective-2017.pdf. Accessed August 2017.Source 5 a: Pharmaceutical Research and Manufacturers of America. Decades of Innovation in Chronic Diseases. 2006 – 2016. Available at http://phrma-docs.phrma.org/sites/default/files/pdf/decade-of-innovation-chronic-disease.pdf. Calculated with Adis R&D Insight Database. Accessed January 2016. Accessed August 2017.
HCV GENOTYPE 1 PREVALENCE
2.4 million people HAVE GENOTYPE 1 HCV
Nearly 60 more medicines are in development offering to bring more coherent treatment options for patients with shorter
treatment duration and few side effects. INTERFERON FREE.
2ND GENERATION2011-2013
Protease Inhibitors with FIN
3RD GENERATION2013-2014
Polymerase Inhibitors with IFN
4TH GENERATION2014-2015
Combination Antiviral Therapies
90%CURED
1ST GENERATION2001-2010
Interferon and Ribavarin(IF-R)
41%CURED
48-week treatment 24-48-week treatment 12-week treatment 8-12-week treatmentINTERFERON FREE
94 -100%CURED
63-80%CURED

5 | A WORKING TOWARD A WORLD FREE FROM CANCERS
Novel Targeted Chronic Myeloid Leukemia (CML) Therapies Help Patients Live Longer and Healthier
121
Source 6: National Cancer Institute, Surveillance Epidemiology and End Results (SEER). Available at http://seer.cancer.gov/statfacts/html/ld/cmyl.html. Accessed August 2017. Source 6 a: U.S. Food and Drug Administration. Gleevec. Available at http://www.accessdata.fda.gov/scripts/cder/daf/index.cfm?event=overview.process&ApplNo=021335. Accessed August 2017. Source 6 b: U.S. Food and Drug Administration. Sprycel. Available at http://www.accessdata.fda.gov/scripts/cder/daf/index.cfm?event=overview.process&ApplNo=021986. Accessed August 2017. Source 6 c: U.S. Food and Drug Administration. Tasigna. Available at http://www.accessdata.fda.gov/scripts/cder/daf/index.cfm?event=overview.process&ApplNo=022068. Accessed August 2017.
Three New CML
Therapies Contributed to
50%decline in people dying from CML*
*Number of new deaths per 100,000 people, age-adjusted
Over the period 2001-2013:

6 | WHO IS CELGENE? 122
5 | WORKING TOWARD A WORLD FREE FROM CANCERS
Innovative Chronic Myeloid Leukemia (CML) Therapies Yielded Large Economic Returns
122
Source 7: Yin W, Penrod JR, Maclean JR, et al. Value of survival gains in chronic myeloid leukemia. Am J Manag Care 2012;18(11Suppl):S257-64. Available at http://www.ajmc.com/journals/supplement/2012/a386_12nov_oncology/a386_12nov_onclogy_yin_s257to64/P-3. Accessed August 2017.
CREATED MORE THAN
IN SOCIAL VALUE
Of which approximately
of this value is retained by patients and society
*Based on first- and second-line tyrosine kinase inhibitors
is recouped by pharmaceutical
companies
*
90% 10%

5 | A WORKING TOWARD A WORLD FREE FROM CANCERS
Biopharmaceutical Research Companies Play a Pivotal Role in Drug Discovery and Development
123
– NIH, Office of Intramural Research (OIR),Office of Technology Transfer (OTT)
“Today, most important developments in
medical science typically begin in
laboratories, such as the discovery of
specific new biological molecules,
processes, or pathways, or innovative
applications of existing knowledge … [The]
real impact for public health generally
comes after several more significant steps
– including further R&D, testing, approval
by appropriate regulatory bodies (such as
the FDA), manufacturing and distribution.”
The private sector makes the largest R&D contributions in translating basic research findings into
therapeutic advances for patients
Source 8: Chakravarthy R, Cotter K, DiMasi J, Milne C‐P, Wendel N; Tufts Center for the Study of Drug Development. Public and private sector contributions to the research & development of the most
transformational drugs of the last 25 years. Available at http://csdd.tufts.edu/files/uploads /PubPrivPaper2015.pdf. Published January 2015. Accessed August 2017. Source 8 a: Biopharmaceutical Research and Development. The Process Behind New Medicines. Available at http://phrma-docs.phrma.org/sites/default/files/pdf/rd_brochure_022307.pdf. Accessed August 2017.
Share of Contributions to Key R&D Milestones for the Most Transformative Medicines of the Past 25 Years
58%
73%
81%
42%
27%19%
Discovery Development Manufacturing
Public
Private

6 | WHO IS CELGENE? 124
5 | WORKING TOWARD A WORLD FREE FROM CANCERS
Biopharmaceutical Companies do the Vast Majority of Research to Translate Basic Science into New Medicines
124
While basic science is often initiated in government and academia, it is biopharmaceutical firms that provide
the necessary critical mass, expertise and experience needed to develop new medicines.
2016 Biopharmaceutical R&D Investment:
$89.8 Billion (est.)
Applied Research
Basic
ResearchApplied
Research
Basic Research
Management &
Administration
2016 NIH Research Spending:
$30.5 Billion
In addition to basic research and biopharmaceutical related
research, NIH supports applied research on
medical devices, diagnostics, prevention and other areas.
Source 9: Chakravarthy R, Cotter K, DiMasi J, Milne C-P, Wendel N; Tufts Center for the Study of Drug Development (CSDD). Public and private sector contributions to the research & development of the most transformational drugs of the last 25 years.http://csdd.tufts.edu/files/uploads/PubPrivPaper2015.pdf. Published January 2015. Accessed August 2017.Source 9 a: Pharmaceutical Research and Manufacturers of America. Biopharmaceuticals in Perspective, Summer 2018. Available at https://www.phrma.org/report/chart-pack-biopharmaceuticals-in-perspective-summer-2018. Accessed December 2018.
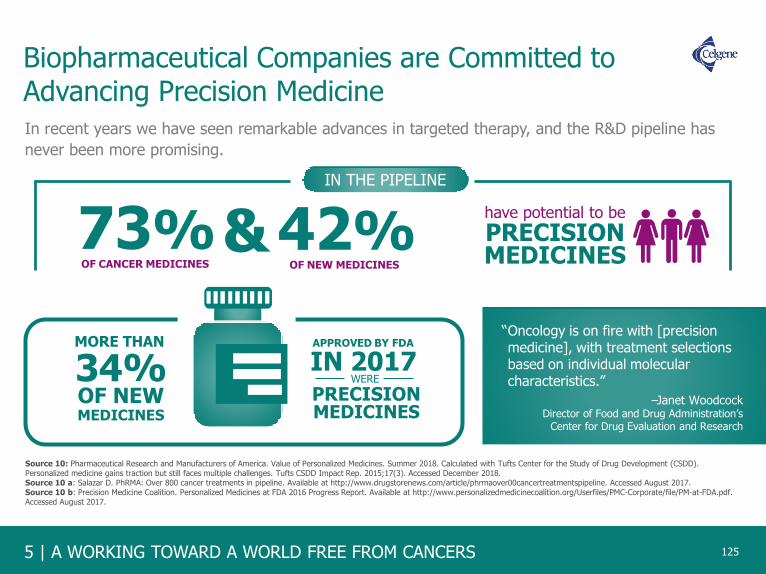
5 | A WORKING TOWARD A WORLD FREE FROM CANCERS
Biopharmaceutical Companies are Committed to Advancing Precision Medicine
125
In recent years we have seen remarkable advances in targeted therapy, and the R&D pipeline has
never been more promising.
73%OF CANCER MEDICINES
have potential to be
PRECISIONMEDICINES
& 42%OF NEW MEDICINES
Source 10: Pharmaceutical Research and Manufacturers of America. Value of Personalized Medicines. Summer 2018. Calculated with Tufts Center for the Study of Drug Development (CSDD). Personalized medicine gains traction but still faces multiple challenges. Tufts CSDD Impact Rep. 2015;17(3). Accessed December 2018.Source 10 a: Salazar D. PhRMA: Over 800 cancer treatments in pipeline. Available at http://www.drugstorenews.com/article/phrmaover00cancertreatmentspipeline. Accessed August 2017.Source 10 b: Precision Medicine Coalition. Personalized Medicines at FDA 2016 Progress Report. Available at http://www.personalizedmedicinecoalition.org/Userfiles/PMC-Corporate/file/PM-at-FDA.pdf. Accessed August 2017.
IN THE PIPELINE
MORE THAN
OF NEW34%MEDICINES
APPROVED BY FDA
IN 2017WERE
PRECISIONMEDICINES
–Janet WoodcockDirector of Food and Drug Administration’s
Center for Drug Evaluation and Research
“Oncology is on fire with [precision medicine], with treatment selections based on individual molecular characteristics.”

6 | WHO IS CELGENE? 126
5 | WORKING TOWARD A WORLD FREE FROM CANCERS
Ongoing Research and Use of a Medicine Over Time Reveal Additional Value That May Not Have Been Recognized Initially
126
1ST MAJOR MILESTONE
FOR PATIENTS
AN FDAand
KNOWLEDGEThrough
continued research and
real-world clinical practice
THERAPY’Sof a
- Earlier use- Use in combination with other agents- Use in specific sub-populations of patients using diagnostics- Use in other disease indications+Additional value
may be realized over time
AND SOCIETY
EMERGESOVER TIME
FULL POTENTIAL
– American Society of Clinical Oncology
“The relative value of a given cancer treatment is likely to change over its lifetime … the assessment of the value of any treatment must be dynamic and adapt to new medical information that may better inform its use, mitigate its toxicity, or modify its place in the treatment landscape.”
APPROVAL
INTRODUCTION OF NEW THERAPY IS A
Source 11: Sweeney N Gross T F. Boston Associates. The Value of Innovation in Oncology: Recognizing Emerging Benefits Over Time White Paper May 2015. Available at http://studyres.com/doc/2762501/cancer-medicines. Accessed August 2017.Source 11 a: Schnipper L E et al. American Society of Clinical Oncology Statement: A Conceptual Framework to Assess the Value of Cancer Treatment Options. Journal of Clinical Oncology. Available at http://ascopubs.org/doi/full/10.1200/jco.2015.61.6706. Accessed November 2017.

5 | A WORKING TOWARD A WORLD FREE FROM CANCERS
Over Time, Targeted Oncology Medicines Generate Additional Treatment Options for New Indications
127
2 1 2 31
4 3 4
1
79
6
11
14
2 1
4
2
2
26
53
3
9
10
0
5
10
15
20
2001 2002 2003 2004 2005 2006 2007 2008 2009 2010 2011 2012 2013 2014 2015
Targeted Oncology Medicine FDA Approval Type by Year
First Approvals Subsequent Approvals
Through ongoing research, our understanding of the genetic and molecular mutations driving cancer cell
growth is uncovering commonalities among cancer types and the medicines used to treat them.
Source 12: IMS Institute for Healthcare Informatics, “Medicines Use and Spending in the U.S.: A Review of 2015 and Outlook to 2020”; CMS National health Expenditures Projections. April 2016. Available at file:///C:/Users/nicole.ferrito/Downloads/IMS_Institute_Medicines_Use_and_Spending_in_2015%20(2).pdf. Accessed August 2017.

6 | WHO IS CELGENE? 128
5 | WORKING TOWARD A WORLD FREE FROM CANCERS
Increasing Competition Within Therapeutic Categories
128
The time a medicine is the only therapy available in its pharmacologic class has declined from a
median of more than 10 years in the 1970s to close to 2 years in the 2000s.
Source 13: 1970s data: Tufts Center for the Study of Drug Development, unpublished data, March 2010; 2005‐2011 data: Tufts Center for the Studyof Drug Development. First‐in‐class drugs in competitive development races with later entrants. Tufts CSDD Impact Rep. 2015;17(6). Accessed August 2017.
Source 13 a: Statista.com. Time between approval of first and second drugs in a therapeutic class. Available at https://www.statista.com/statistics/215468/time-taken-for-approval-of-drugs-in-a-therapeutic-class-in-the-us/. Accessed August 2017.Source 13 b: Biopharmaceuticals in Perspective, Spring 2016. Available at http://phrma-docs.phrma.org/files/dmfile/chart-pack-biopharmaceuticals-in-perspective4.pdf. Calculated from Adis R&D Insight Database. Accessed August 2017.
10.2
2.30
2
4
6
8
10
12
1970s 2005-2011
Me
dia
nN
um
be
r o
f Y
ea
rs
Year of Approval of First-in-Class Medicine
Time Between Approval of First and Second Medicines in a Pharmacologic Class
of second medicines in a class
were approved within 2.3 years
of the first medicine’s approval
were approved within just
4 months

5 | A WORKING TOWARD A WORLD FREE FROM CANCERS
Generics
Increased Competition Among Innovator Brands and Generics Helps to Reduce Costs for the Healthcare System
129
Source 14: QuintilesIMS. Treating hepatitis C virus infection. Available at http://www.healthline.com/health/hepatitis-c/full-medication-list#5. Accessed August 2017.Source 14 a: Britt R. MarketWatch. Gilead to discount its pricey Sovaldi drug. Available at http://www.marketwatch.com/story/gilead-to-discount-its-pricey-sovaldi-drug-2015-02-04. Accessed August 2017. Source 14 b: Gilead FDA Approval Timeline. Available at http://www.gilead.com/medicines/productapprovaltimeline. Accessed August 2017.
Innovator Brands
Mental Health
Hypertension
Cholesterol
Antiulcerants
Nervous System Disorders
Pain
Cancer Anti-Nauseants
Oncology
Anticoagulants
Antibacterials
Respiratory
Diabetes
$44 Billion
$29 Billion
$28 Billion
$22 Billion
$16 Billion
$13 Billion
$11.8 Billion
$10 Billion
$9.1 Billion
$8.8 Billion
$7.4 Billion
$5.5 Billion
2016 Savings from
Generics in Billions
Generic mental health,
hypertension, cholesterol
and ulcer medications
account for half of the
savings in the last 10 years
INCREASED
COMPETITION
AMONG
INNOVATOR
BRANDS
FROM NEW HEPATITIS C THERAPIES
FROM WHEN HEPATITIS C TREATMENT FIRST
REACHED THE MARKET
RESULTED IN
~50%DECREASE
IN TREATMENT COST
In only 3 years
Generic competition
saved the U.S.
healthcare system
$1.67 trillion from
2007-2016
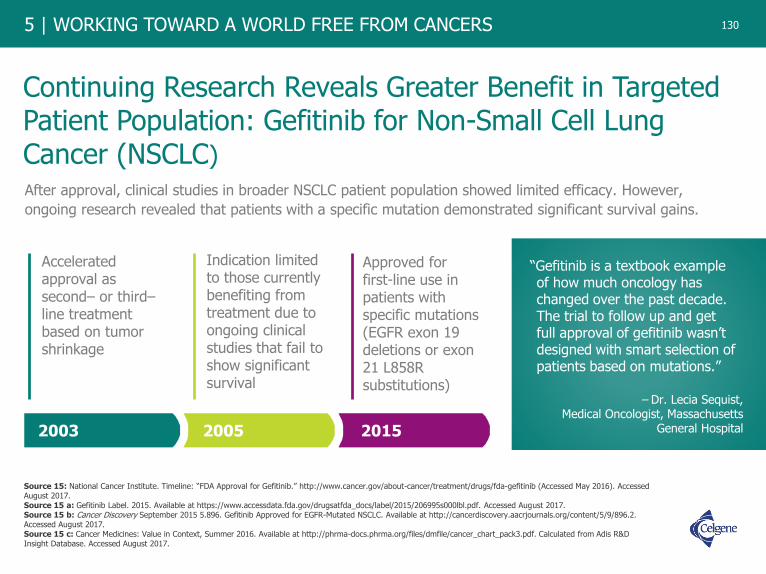
6 | WHO IS CELGENE? 130
5 | WORKING TOWARD A WORLD FREE FROM CANCERS
Continuing Research Reveals Greater Benefit in Targeted Patient Population: Gefitinib for Non-Small Cell Lung Cancer (NSCLC)
130
After approval, clinical studies in broader NSCLC patient population showed limited efficacy. However,
ongoing research revealed that patients with a specific mutation demonstrated significant survival gains.
– Dr. Lecia Sequist, Medical Oncologist, Massachusetts
General Hospital
“Gefitinib is a textbook example of how much oncology has changed over the past decade. The trial to follow up and get full approval of gefitinib wasn’t designed with smart selection of patients based on mutations.”
2003 2005 2015
Accelerated approval as second– or third–line treatment based on tumor shrinkage
Indication limited to those currently benefiting from treatment due to ongoing clinical studies that fail to show significant survival
Approved for first-line use in patients with specific mutations (EGFR exon 19 deletions or exon 21 L858R substitutions)
Source 15: National Cancer Institute. Timeline: “FDA Approval for Gefitinib.” http://www.cancer.gov/about-cancer/treatment/drugs/fda-gefitinib (Accessed May 2016). Accessed August 2017. Source 15 a: Gefitinib Label. 2015. Available at https://www.accessdata.fda.gov/drugsatfda_docs/label/2015/206995s000lbl.pdf. Accessed August 2017.Source 15 b: Cancer Discovery September 2015 5.896. Gefitinib Approved for EGFR-Mutated NSCLC. Available at http://cancerdiscovery.aacrjournals.org/content/5/9/896.2. Accessed August 2017.Source 15 c: Cancer Medicines: Value in Context, Summer 2016. Available at http://phrma-docs.phrma.org/files/dmfile/cancer_chart_pack3.pdf. Calculated from Adis R&D Insight Database. Accessed August 2017.
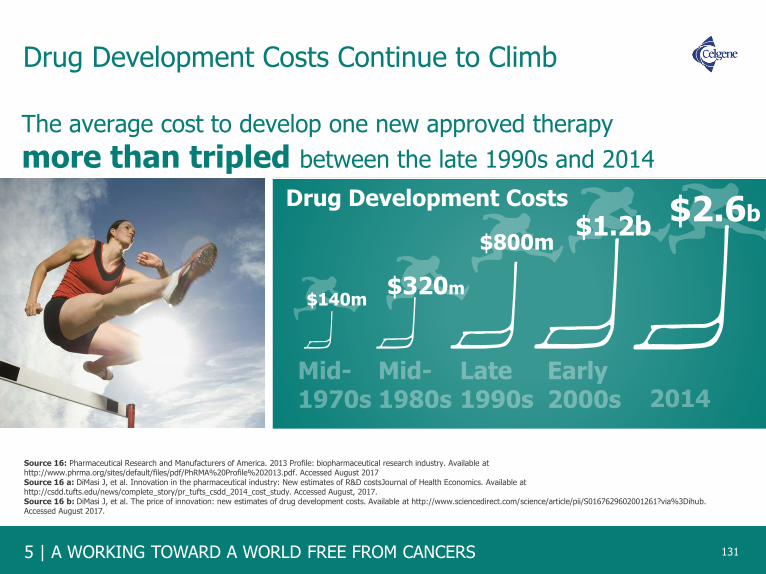
5 | A WORKING TOWARD A WORLD FREE FROM CANCERS
Drug Development Costs Continue to Climb
131
The average cost to develop one new approved therapy
more than tripled between the late 1990s and 2014
$140m$320m
$800m$1.2b
Drug Development Costs $2.6b
131
Source 16: Pharmaceutical Research and Manufacturers of America. 2013 Profile: biopharmaceutical research industry. Available at http://www.phrma.org/sites/default/files/pdf/PhRMA%20Profile%202013.pdf. Accessed August 2017 Source 16 a: DiMasi J, et al. Innovation in the pharmaceutical industry: New estimates of R&D costsJournal of Health Economics. Available at http://csdd.tufts.edu/news/complete_story/pr_tufts_csdd_2014_cost_study. Accessed August, 2017.Source 16 b: DiMasi J, et al. The price of innovation: new estimates of drug development costs. Available at http://www.sciencedirect.com/science/article/pii/S0167629602001261?via%3Dihub. Accessed August 2017.

6 | WHO IS CELGENE? 132
5 | WORKING TOWARD A WORLD FREE FROM CANCERS
Society Benefits from New Treatments and, Ultimately, Lower Costs Forever
132
Source 17: Pharmaceutical Research and Manufacturers of America. Drug Discovery and Development: Understanding the R&D Process. Available at http://www.phrma.org/sites/default/files/pdf/rd_brochure_022307.pdf. Accessed August 2017. Source 17 a: DiMasi J. Journal of Health Economics. Innovation in the pharmaceutical industry: New estimates of R&D costs. Available at http://dx.doi.org/10.1016/j.jhealeco.2016.01.012. Accessed August 2017. Source 17 b: U.S. Food and Drug Administration. Frequently Asked Questions on Patents and Exclusivity. Available at https://www.fda.gov/drugs/developmentapprovalprocess/ucm079031.htm#howlongpatentterm. Accessed September 2017.
Developing a new medicine takes an average of 10-15 years; the Congressional Budget Office
reports that “relatively few drugs survive the clinical trial process.” Innovative therapies have a
limited time in their lifecycle to recapture investment and fund future innovation.
1APPROXIMATELY
5,000to
10,000COMPOUNDS
5COMPOUNDS
DISCOVERY ANDDEVELOPMENT
FDAREVIEW
$2.6 BILLION
3-6 YEARSPreclinical
0.5-2 YEARSFDA Review
INNOVATOREXCLUSIVITY
5 – 10.5 YEARSFDA-Approved
Therapy
GENERIC
FOREVER6-7 YEARSClinical Trials

5 | A WORKING TOWARD A WORLD FREE FROM CANCERS
Harnessing Innovation in Rare Disease
Since the passage of the Orphan Drug Act in 1983, we have seen tremendous advances in treatments for rare diseases. The rapid pace of the science holds significant promise for the future.
133
85-90%
RARE DISEASES
560MEDICINES
THERE ARE MORE THAN
in development for
OF RARE
DISEASES ARE
SERIOUS OR LIFE-
THREATENING
30MILLIONAMERICANS
RARE DISEASES AFFECT
THAT’S 1 IN 10
7,000DIFFERENT RARE DISEASES EXIST TODAY
Approved treatments are available for
ONLY 5%of all rare diseases
Source 18: Pharmaceutical Research and Manufacturers of America (PhRMA). “A Decade of Innovation in Rare Diseases.” Available at http://phrma-docs.phrma.org/sites/default/files/pdf/PhRMA-Decade-of-Innovation-Rare-Diseases.pdf. Accessed December 2018.

6 | WHO IS CELGENE? 134
5 | WORKING TOWARD A WORLD FREE FROM CANCERS
U.S. Orphan Drug Act (1983) Impact on Innovation
134
Source 19: U.S. Food and Drug Administration, Developing Products for Rare Diseases & Conditions. Available at http://www.fda.gov/ForIndustry/DevelopingProductsforRareDiseasesConditions/default.htm. Accessed August 2017.Source 19 a: U.S. Food and Drug Administration, Office of Orphan Product Development, Orphan Drug Designations and Approvals Database, 1983-1996. Available at https://www.accessdata.fda.gov/scripts/opdlisting/oopd/listResult.cfm. Accessed August 2017. Source 19 b: U.S. Food and Drug Administration, Office of Orphan Product Development, Orphan Drug Designations and Approvals Database, 1997-2018. Available at https://www.accessdata.fda.gov/scripts/opdlisting/oopd/listResult.cfm. Accessed December 2018.
Number of Drug Approvals for Rare Diseases
<10
1973-1983
139
1984-1996
621
1997-2018

5 | A WORKING TOWARD A WORLD FREE FROM CANCERS
Number of New Orphan Drug Designations Climb But Approvals Not Keeping Pace in the U.S.
135
Number of orphan drug designations
and approvals
1985 1990 1995 2000 2005 2010
Source 20: Karst K R, Sasinowski F J. The Orphan Drug Act: 30 Year and Still Going Strong. Available http://www.fdalawblog.net/fda_law_blog_hyman_phelps/2013/02/the-orphan-drug-act-30-years-and-still-going-strong.html. Accessed August 2017.Source 20 a: U.S. Food and Drug Administration. Office of Orphan Drug Products. Available at https://www.fda.gov/downloads/AboutFDA/ReportsManualsForms/Reports/BudgetReports/UCM488554.pdf. Accessed August 2017.Source 20 b: Orphan Drug Report 2014. Available at http://info.evaluategroup.com/rs/evaluatepharmaltd/images/2014OD.pdf. Accessed August 2017.
2015
Orphan drug approvals
Orphan drug designations
0
50
100
150
200
250
300
350

6 | WHO IS CELGENE? 136
5 | WORKING TOWARD A WORLD FREE FROM CANCERS
Growth in European Orphan Drug Development
136
8
122
0
20
40
60
80
100
120
140
€150
€490
0
100
200
300
400
500
600
Drugs for Rare Diseases Receiving Marketing Authorization in Europe
European Investment in Orphan Drug R&D, 2000 and 2008
Orphan drug expenditures are expected to account for less than 5% of total European pharmaceutical expenditures by 2020, confirming both the affordability of orphan drugs and the sustainability of this new model for health care systems.
Millions €
2000 2008Pre-orphan druglegislation
(Before 2000)
Post-orphan drugLegislation
(2000-2018*)
Numberof Drugs
Available
Source 21: European Medicines Agency. Committee for Orphan Medicinal Products (COMP) meeting report on the review of applications for orphan designation. February 2018. Available at http://www.ema.europa.eu/docs/en_GB/document_library/Committee_meeting_report/2016/11/WC500216127.pdf. Accessed April 2018.Source 21 a: Mestre-Ferrandiz J, Garau M, O’Neill P, Sussex J; OHE Consulting. Assessment of the Impact of Orphan Medicinal Products on the European Economy and Society. November, 2010. Available at http://www.ohe.org/publications/article/assessment-of-the-impact-of-orphan-medicinal-products-oneurope-15.cfm. Accessed August 2017.Source 21 b: Schey C, et al. Estimating the budget impact of orphan medicines in Europe: 2010 - 2020. Orphanet J Rare Dis. 2011 Sep 27;6:62. doi: 10.1186/1750-1172-6-62. Available at https://www.ncbi.nlm.nih.gov/pmc/articles/PMC3191371/. Accessed August 2017.
*Rare disease drugs receiving marketing authorization in EU from 2000 through April 2018

5 | A WORKING TOWARD A WORLD FREE FROM CANCERS
U.S. is the Leader in Biopharmaceutical Innovation, 1998-2014
137
The U.S. produces more than half of all
the intellectual property related to
new medicines
Source 22: Pharmaceutical Research and Manufacturers of America http://phrma-docs.phrma.org/files/dmfile/Biopharmaceuticals-in-Perspective-2017.pdf. Analysis of National Science Foundation, National Science Board, data. USPTO patents granted in pharmaceuticals, by region/country/economy: selected years, 1998–2014. Available at http://www.nsf.gov/statistics/2016/nsb20161/uploads/1/9/at06-50.pdf. Accessed August 2017.
U.S. (55.2%)
Asia*(5.4%)
Japan(6.4%)
China(1.8%)
Other(9.5%)
E.U. (21.6%)
U.S. Patents Granted in Pharmaceutical Technology by Region/Country of Inventor, 2016
*Asia includes India, Malaysia, Singapore, South Korea, Taiwan and others.

6 | WHO IS CELGENE? 138
5 | WORKING TOWARD A WORLD FREE FROM CANCERS
We are at a Critical Crossroads for Medical Innovation
138
R&D Investment Longer, Better, Healthier Lives
AMAJOR PARADOXThe potentialof science is
greater than ever …
but the outlook for
investment has
never been more
uncertain
138

5 | A WORKING TOWARD A WORLD FREE FROM CANCERS
Notes and Sources1. Adis R&D Insight Database, from Biopharmaceuticals in Perspective, Spring 2016. Chapter 2, Slide 22. Available at http://phrma-docs.phrma.org/files/dmfile/chart-pack-biopharmaceuticals-in-
perspective4.pdf. Accessed August 2017.
2. FDA. Approved Drugs for Oncology. Available at https://www.centerwatch.com/drug-information/fda-approved-drugs/therapeutic-area/12/oncology. Accessed April 2018.2 a: American Cancer Society. Facts & Figures 2018: Rate of Deaths From Cancer Continues Decline. Available at https://www.cancer.org/latest-news/facts-and-figures-2018-rate-of-deaths-from-cancer-continues-decline.html. Accessed April 2018.2 b: Center for Disease Control and Prevention. Cancer Survivors. United States, 2007. CenterWatch. Available at http://www.cdc.gov/mmwr/preview/mmwrhtml/mm6009a1.htm. Accessed August 2017.
3. World Medical innovation Forum: Cancer. “Disruptive Dozen 2016.” http://worldmedicalinnovation.org/wp-content/uploads/2016/04/Parners-FORUM-2016-BROCHURE-D12-Cancer-160422_0942_FREV1-WEB-X3-5M-SPREAD.pdf. Accessed October 2017.3 a: McGinley. L. “The list of cancers that can be treated by immunotherapy keeps growing.” The Washington Post. https//www.washingtonpost.com/news/to-your-health/wp/2016/04/19/breathrough-cancer-therapy-shows-growing-promise/3 b: Batra S. et al. Cancer metabolism as a therapeutic target. Available at https://www.ncbi.nlm.nih.gov/pubmed/25184270. Accessed August 2017.3 c: National Cancer Institute. Oncolytic Virus Therapy Shows Benefit in Patients with Melanoma. Available at https://www.cancer.gov/news-events/cancer-currents-blog/2015/oncolyticvirus-melanoma. Accessed August 2017.
4. Pharmaceutical Research and Manufacturers of America. PhRMA Chart Pack: Cancer Medicines Value in Context. Spring 2014. Chapter 1, slide 21. Available at http://www.phrma.org/sites/default/files/pdf/cancer-chart-pack-5-22-14.pdf. Accessed August 2017. 4 a. Pharmaceutical Research and Manufacturers of America. PhRMA Chart Pack: Biopharmaceuticals in Perspective. Available at https://www.noexperiencenecessarybook.com/XGxbw/microsoft-powerpoint-cancer-chart-pack-5-22-14-final.html. Accessed August 2017.4 b: Centers for Disease Control. Health United States, 2016. Available at https://www.cdc.gov/nchs/data/hus/hus16.pdf. Accessed August 2017.
5. Pharmaceutical Research and Manufacturers of America. PhRMA Chart Pack: Biopharmaceuticals in Perspective. Spring 2017. Available at http://phrma-docs.phrma.org/files/dmfile/Biopharmaceuticals-in-Perspective-2017.pdf. Accessed August 2017.5 a: Pharmaceutical Research and Manufacturers of America. Decades of Innovation in Chronic Diseases. 2006 – 2016. Available at http://phrma-docs.phrma.org/sites/default/files/pdf/decade-of-innovation-chronic-disease.pdf. Calculated with Adis R&D Insight Database. Accessed January 2016. Accessed August 2017.
6. National Cancer Institute, Surveillance Epidemiology and End Results (SEER). Available at http://seer.cancer.gov/statfacts/html/ld/cmyl.html. Accessed August 2017. 6 a: U.S. Food and Drug Administration. Gleevec. Available at http://www.accessdata.fda.gov/scripts/cder/daf/index.cfm?event=overview.process&ApplNo=021335. Accessed August 2017. 6 b: U.S. Food and Drug Administration. Sprycel. Available at http://www.accessdata.fda.gov/scripts/cder/daf/index.cfm?event=overview.process&ApplNo=021986. Accessed August 20176 c: U.S. Food and Drug Administration. Tasigna. Available at http://www.accessdata.fda.gov/scripts/cder/daf/index.cfm?event=overview.process&ApplNo=022068. Accessed August 2017.
7. Yin W, Penrod JR, Maclean JR, et al. Value of survival gains in chronic myeloid leukemia. Am J Manag Care 2012;18(11Suppl):S257-64. Available at http://www.ajmc.com/journals/supplement/2012/A386_12nov_Oncology/A386_12nov_Onclogy_Yin_S257to64/. Accessed August 2017.
8. Chakravarthy R, Cotter K, DiMasi J, Milne C‐P, Wendel N; Tufts Center for the Study of Drug Development. Public and private sector contributions to the research & development of the most
transformational drugs of the last 25 years. http://csdd.tufts.edu/files/uploads /PubPrivPaper2015.pdf. Published January 2015. Accessed August 2017.
8 a: Biopharmaceutical Research and Development. The Process Behind New Medicines. Available at http://phrma-docs.phrma.org/sites/default/files/pdf/rd_brochure_022307.pdf. Accessed August 2017
9. Chakravarthy R, Cotter K, DiMasi J, Milne C-P, Wendel N; Tufts Center for the Study of Drug Development (CSDD). Public and private sector contributions to the research & development of the most transformational drugs of the last 25 years. Available at http://csdd.tufts.edu/files/uploads/PubPrivPaper2015.pdf. Published January 2015. Accessed August 2017.
9 a: Pharmaceutical Research and Manufacturers of America. Biopharmaceuticals in Perspective, Summer 2018. Available at https://www.phrma.org/report/chart-pack-biopharmaceuticals-in-perspective-summer-2018. Accessed December 2018.
139
6 | WHO IS CELGENE? 140
5 | WORKING TOWARD A WORLD FREE FROM CANCERS 140
Notes and Sources (cont.)10. Pharmaceutical Research and Manufacturers of America. Value of Personalized Medicines. Summer 2018. Calculated with Tufts Center for the Study of Drug Development (CSDD). Personalized
medicine gains traction but still faces multiple challenges. Tufts CSDD Impact Rep. 2015;17(3). Accessed December 2018.
10 a: Salazar D. PhRMA: Over 800 cancer treatments in pipeline. Available at http://www.drugstorenews.com/article/phrmaover00cancertreatmentspipeline. Accessed August 2017.10 b: Precision Medicine Coalition. Personalized Medicines at FDA 2016 Progress Report. Available at http://www.personalizedmedicinecoalition.org/Userfiles/PMC-Corporate/file/PM-at-FDA.pdf. Accessed August 2017.
11. Sweeney N Gross T F. Boston Associates. The Value of Innovation in Oncology: Recognizing Emerging Benefits Over Time White Paper May 2015. Available at http://studyres.com/doc/2762501/cancer-medicines. Accessed August 2017 11 a: Schnipper L E et al. American Society of Clinical Oncology Statement: A Conceptual Framework to Assess the Value of Cancer Treatment Options. Journal of Clinical Oncology. Available at http://ascopubs.org/doi/full/10.1200/jco.2015.61.6706. Accessed November 2017.
12. IMS Institute for Healthcare Informatics, “Medicines Use and Spending in the U.S.: A Review of 2015 and Outlook to 2020”; CMS National health Expenditures Projections. April 2016. Available at file:///C:/Users/nicole.ferrito/Downloads/IMS_Institute_Medicines_Use_and_Spending_in_2015%20(2).pdf. Accessed August 2017.
13. 1970s data: Tufts Center for the Study of Drug Development, unpublished data, March 2010; 2005‐2011 data: Tufts Center for the Study of Drug Development. First‐in‐class drugs in competitive development races with later entrants. Tufts CSDD Impact Rep. 2015;17(6).13 a: Statista.com. Time between approval of first and second drugs in a therapeutic class. Available at https://www.statista.com/statistics/215468/time-taken-for-approval-of-drugs-in-a-therapeutic-class-in-the-us/. Accessed August 2017.13 b: Biopharmaceuticals in Perspective, Spring 2016. Available at http://phrma-docs.phrma.org/files/dmfile/chart-pack-biopharmaceuticals-in-perspective4.pdf. Calculated from Adis R&D Insight Database. Accessed August 2017.
14. QuintilesIMS. Treating hepatitis C virus infection. Available at http://www.healthline.com/health/hepatitis-c/full-medication-list#5. Accessed August 2017.
14 a: Britt R. MarketWatch. Gilead to discount its pricey Sovaldi drug. Available at http://www.marketwatch.com/story/gilead-to-discount-its-pricey-sovaldidrug-2015-02-04. Accessed August 2017. 14 b: Gilead FDA Approval Timeline. Available at http://www.gilead.com/medicines/productapprovaltimeline. Accessed August 2017.
15. National Cancer Institute. Timeline: “FDA Approval for Gefitinib.” http://www.cancer.gov/about-cancer/treatment/drugs/fda-gefitinib (Accessed May 2016). Accessed August 2017.
15 a: Gefitinib Label. 2015. Available at https://www.accessdata.fda.gov/drugsatfda_docs/label/2015/206995s000lbl.pdf. Accessed August 2017.15 b: Cancer Discovery September 2015 5.896. Gefitinib Approved for EGFR-Mutated NSCLC. Available at http://cancerdiscovery.aacrjournals.org/content/5/9/896.2. Accessed August 2017.15 c: Cancer Medicines: Value in Context, Summer 2016. Available at http://phrma-docs.phrma.org/files/dmfile/cancer_chart_pack3.pdf. Calculated from Adis R&D Insight Database. Accessed August 2017.
16. Pharmaceutical Research and Manufacturers of America (PhRMA). 2013 Profile: biopharmaceutical research industry. Available at
http://www.phrma.org/sites/default/files/pdf/PhRMA%20Profile%202013.pdf. Accessed August, 2015. Paul SM, Mytelka DS, Dunwiddie CT, et al. How to improve R&D productivity: the
pharmaceutical industry’s grand challenge. Nat Rev Drug Discov. 2010;9(3):203-14. Tufts Center for the Study of Drug Development. Cost to develop and win marketing approval for a new drug
is $2.6 billion.
16 a: DiMasi J, et al. Innovation in the pharmaceutical industry: New estimates of R&D costs Journal of Health Economics. Available at
http://csdd.tufts.edu/news/complete_story/pr_tufts_csdd_2014_cost_study. Accessed August 2017.
16 b: DiMasi J, et al. The price of innovation: new estimates of drug development costs. Available at http://www.sciencedirect.com/science/article/pii/S0167629602001261?via%3Dihub. Accessed
August 2017

5 | A WORKING TOWARD A WORLD FREE FROM CANCERS
Notes and Sources (cont.)
141
17. U.S. Food and Drug Administration, Developing Products for Rare Diseases & Conditions. Available at http://www.fda.gov/ForIndustry/DevelopingProductsforRareDiseasesConditions/default.htm.
Accessed August 2017.
17 a: DiMasi J. Journal of Health Economics. Innovation in the pharmaceutical industry: New estimates of R&D costs. Available at http://dx.doi.org/10.1016/j.jhealeco.2016.01.012. Accessed
August 2017.
17 b: U.S. Food and Drug Administration. Frequently Asked Questions on Patents and Exclusivity. Available at
https://www.fda.gov/drugs/developmentapprovalprocess/ucm079031.htm#howlongpatentterm. Accessed September 2017.
18. Pharmaceutical Research and Manufacturers of America (PhRMA). “A Decade of Innovation in Rare Diseases” http://phrma-docs.phrma.org/sites/default/files/pdf/PhRMA-Decade-of-Innovation-
Rare-Diseases.pdf. Accessed July 2017.
19. U.S. Food and Drug Administration, Developing Products for Rare Diseases & Conditions. Available at http://www.fda.gov/ForIndustry/DevelopingProductsforRareDiseasesConditions/default.htm.
Accessed August 2017.
19 a: U.S. Food and Drug Administration, Office of Orphan Product Development, Orphan Drug Designations and Approvals Database, 1983-1996. Available at
https://www.accessdata.fda.gov/scripts/opdlisting/oopd/listResult.cfm. Accessed August 2017.
19 b: U.S. Food and Drug Administration, Office of Orphan Product Development, Orphan Drug Designations and Approvals Database, 1996-2018. Available at
https://www.accessdata.fda.gov/scripts/opdlisting/oopd/listResult.cfm. Accessed December 2018.
20. Karst K R, Sasinowski F J. The Orphan Drug Act: 30 Year and Still Going Strong. Available http://www.fdalawblog.net/fda_law_blog_hyman_phelps/2013/02/the-orphan-drug-act-30-years-and-
still-going-strong.html. Accessed August 2017.
20 a: U.S. Food and Drug Administration. Office of Orphan Drug Products. Available at https://www.fda.gov/downloads/AboutFDA/ReportsManualsForms/Reports/BudgetReports/UCM488554.pdf.
Accessed August 2017.
20 b: Orphan Drug Report 2014. Available at http://info.evaluategroup.com/rs/evaluatepharmaltd/images/2014OD.pdf. Accessed August 2017.
21. European Medicines Agency. Committee for Orphan Medicinal Products (COMP) meeting report on the review of applications for orphan designation. February 2018. Available at
http://www.ema.europa.eu/docs/en_GB/document_library/Committee_meeting_report/2016/11/WC500216127.pdf. Accessed April 2018.
21 a: Mestre-Ferrandiz J, Garau M, O’Neill P, Sussex J; OHE Consulting. Assessment of the Impact of Orphan Medicinal Products on the European Economy and Society.
November, 2010. Available at http://www.ohe.org/publications/article/assessment-of-the-impact-of-orphan-medicinal-products-oneurope-15.cfm. Accessed August 2017.
21 b: Schey C, et al. Estimating the budget impact of orphan medicines in Europe: 2010 - 2020. Orphanet J Rare Dis. 2011 Sep 27;6:62. doi: 10.1186/1750-1172-6-62.Available at
https://www.ncbi.nlm.nih.gov/pmc/articles/PMC3191371/. Accessed August 2017.
22. Pharmaceutical Research and Manufacturers of America http://phrma-docs.phrma.org/files/dmfile/Biopharmaceuticals-in-Perspective-2017.pdf. Analysis of National Science Foundation, National
Science Board, data. USPTO patents granted in pharmaceuticals, by region/country/economy: selected years, 1998–2014. Available at
http://www.nsf.gov/statistics/2016/nsb20161/uploads/1/9/at06-50.pdf. Accessed August 2017.

6 | WHO IS CELGENE? 142
5 | WORKING TOWARD A WORLD FREE FROM CANCERS 142

6
6 | CELGENE
CELGENECREATING THE FUTURE THROUGH MEDICAL INNOVATION
Passion, innovation and courage have been in the company’s genes since its founding. Celgene’s unwavering focus on medical innovation underscores its position in a healthcare ecosystem that has delivered longer, healthier lives to patients.
From helping people obtain their medications to using cutting-edge scientific technology to discover new treatments, Celgene’s entrepreneurial spirit, collaborative culture and commitment to rare diseases creates a unique platform for transforming patient outcomes. At every level, it is growing and evolving.
Celgene has become a leader in discovering, developing and delivering innovative medicine to patients with unmet needs, by digging deeper to resolve unanswered scientific questions and working tirelessly to improve the lives of people worldwide.
143
James Castro was diagnosed with multiple myeloma

6 | WHO IS CELGENE? 144
6 | CELGENE 144

6 | WHO IS CELGENE? 145
“In my many years at Celgene, I have been proud towork for a company that consistently puts patients
first in all aspects of its business, whether it’s focusingon research and development of innovative therapies
with the highest unmet need, or supporting patients
through the various stages of their disease journey.
Chad Saward
Patient Advocacy ”145

6 | WHO IS CELGENE? 146
6 | CELGENE
Delivering on Our Promise to Bring New Treatments to Patients in Need
146
Source: Celgene data on file.Source 1: European Commission. The 2018 EU Industrial R&D Investment Scoreboard. European Commission. Available at http://iri.jrc.ec.europa.eu/scoreboard18.html. Accessed December 2018. .
$0
$1,000
$2,000
$3,000
$4,000
$5,000
$6,000
$7,000
2003 2004 2005 2006 2007 2008 2009 2010 2011 2012 2013 2014 2015 2016 2017 2018
Celgene R&D investmentin millions of dollars GAAP
Celgene reinvested more than 37 percent* of revenue into R&D in 2018. In fact, according to the 2018 EU Industrial R&D Investment Scoreboard, Celgene ranked #1 in R&D intensity† as compared to other biopharmaceutical companies and #3 overall – including aerospace and defense, automobiles and other transport, chemicals, health industries, ICT sectors and industrials.
*Based on U.S. Generally Accepted Accounting Principles.

6 | CELGENE
Research and Development Centers of Excellence
147
CITRESeville, Spain
Immuno-Oncology Research Seattle, WA
Drug DiscoveryAlliance DevelopmentEpigenetics/SignalingSan Diego, CA
Nonclinical & EarlyClinical DevelopmentSummit East/West, NJ
I&I Thematic Center of Excellence MedChemCambridge, MA
Translational DevelopmentEpigeneticsSan Francisco, CA

6 | WHO IS CELGENE? 148
6 | CELGENE
Changing the Course of Disease by Focusing onthe Cause and Not the Symptoms
148
Celgene’s Hematology franchise is the foundation on which our company was
built. From our earliest efforts in myeloma to ongoing clinical studies in multiple diseases, our therapies are transforming the landscape of the treatment of certain blood cancers.
Our research focuses on treating the underlying disease using a combination
of actions to attack cancer cells and support the body’s own defense system.
Our hematology portfolio includes epigenetic therapies that impact tumor cells’ ability to survive and reproduce. This mechanism of action has allowed us to contribute to the great strides in
diseases such as myelodysplastic syndromes and
T-cell lymphomas.
Research continues around next-generation therapies in our current
indications and in other diseases with significant unmet needs, including acute
myeloid leukemia, non-Hodgkin lymphoma, diffuse large B-cell
lymphoma, beta-thalassemia and more.
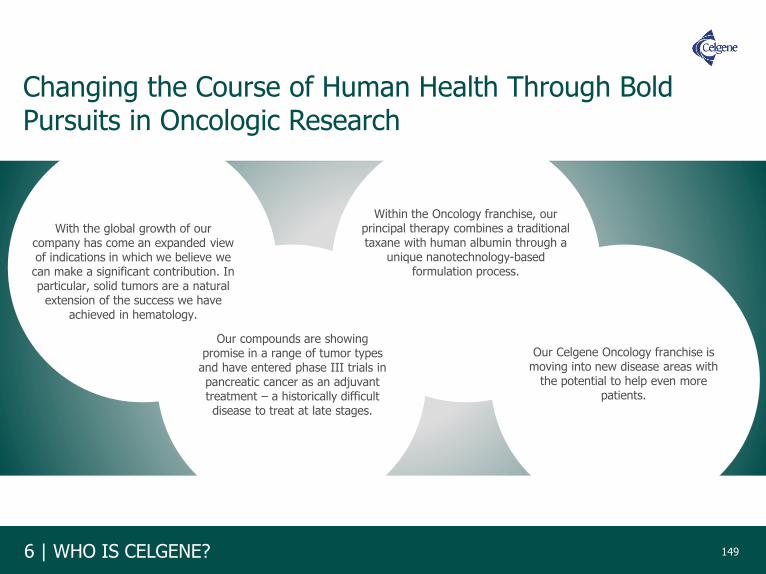
6 | WHO IS CELGENE?
Changing the Course of Human Health Through Bold Pursuits in Oncologic Research
149
With the global growth of our company has come an expanded view of indications in which we believe we can make a significant contribution. In particular, solid tumors are a natural
extension of the success we have achieved in hematology.
Our compounds are showing promise in a range of tumor types
and have entered phase III trials in pancreatic cancer as an adjuvant treatment – a historically difficult disease to treat at late stages.
Within the Oncology franchise, our principal therapy combines a traditional taxane with human albumin through a
unique nanotechnology-based formulation process.
Our Celgene Oncology franchise is moving into new disease areas with
the potential to help even more patients.
149

4 | BETTER HEALTHCARE, BETTER OUTCOMES
The best way to predictthe future is to invent it.“Alan Kay
American Computer Scientist ”150