Embed Size (px)
Citation preview
© copyright Intellidex (Pty) Ltdwww.intellidex.co.za1
The Value of BEE DealsRESEARCH
REPORT
June 2015
THE VALUE OF BEE DEALSA study of the total value created for beneficiaries through BEE deals conducted by the 100 largest companies on the JSE
AUTHORS:STUART THEOBALD, CFAORIN TAMBO, CFAPHIBION MAKUWERERECOLIN ANTHONY
www.intellidex.co.za

The Value of BEE Deals
© copyright Intellidex (Pty) Ltdwww.intellidex.co.za2

© copyright Intellidex (Pty) Ltdwww.intellidex.co.za3
The Value of BEE Deals
EXECUTIVE SUMMARY
industrials (also R57bn). Relative to overall sector market capitalisation, mining has also generated the most value, equivalent to 11.8% of market value, followed by healthcare (7.2%) and banks (6.0%).
• The three largest deals by value created are FirstRand’s R23.2bn deal, Exxaro’s 2006 deal which is now worth R16.8bn and Sanlam’s R14.4bn deal. When looked at from the perspective of the percentage of market capitalisation, mining companies dominated with the top three being Exxaro (46%), Northam (34%) and Impala Platinum (28%), using market capitalisations as at end-December 2014. Anglo American’s deals are estimated at R3.3bn; however if the deals it facilitated in listed subsidiaries are included, Anglo’s value creation is R53.3bn (and arguably higher if other related companies are included), making it the largest BEE deal value creator of all companies.
• When the drivers of value creation are assessed, the clearest and most important determinant is the performance of the overall JSE. On average, during the life time of individual deals, the all share index returned a compound annual return of 13.8%, according to our calculations. This was below the 20-year average return of the all share index of 17.2%, but was sufficient to more than cover the cost of debt, which we estimate to have averaged 85% of the prime rate during the period. The underperformance relative to the all share index indicates that the timing of deals was less than optimal. The most successful deals were naturally where share price performance was very positive. There is a strong correlation between deal value created and the relative outperformance of the company’s share price. Of the 10 largest deals, the relevant companies outperformed in their sectors by an average of 6%.
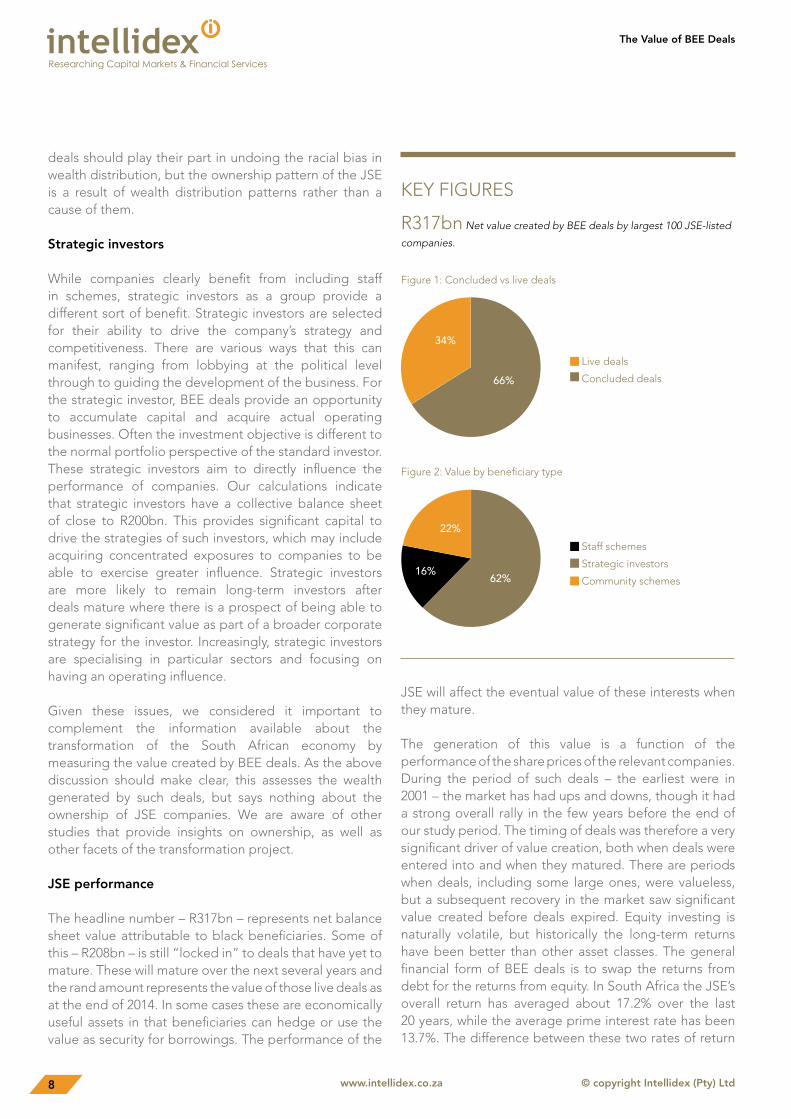
• Black economic empowerment deals undertaken by the JSE’s 100 largest companies since 2000 have generated R317bn in total value attributable to beneficiaries. This is value generated from deals that had matured before, or were live, as at 30 December 2014, and is net of any debt or other financial obligations attached to deals. This figure is gross of tax that may be due by beneficiaries.
• Of this amount, R52bn (16%) is attributable to staff schemes, R196bn (62%) to strategic investment partners and R69bn (22%) to broad-based community schemes. Strategic partners invest through investment companies that often have large, broad-based beneficiary groups as shareholders.
• Of the total, R108bn (34%) is value created by deals that had matured up to and including 31 December 2014; and R209bn (66%) was value in deals that were still “live”. Matured deals are those where the value is no longer encumbered by any trading restriction or financial obligation, so beneficiaries are free to use that value as they want. Live deals have funding or trading restrictions (“lock-ins”) and our calculations represent the net asset value of those deals as at 31 December 2014. The eventual value of live deals when they mature will be subject to market performance subsequent to our valuation date. Given that the JSE’s all share index appreciated by 5% in the five months to end of May, the value of live deals will have increased since our valuations.
• Last year was a record for the value of maturing deals, with R59.8bn of value delivered to beneficiaries in calendar 2014.
• From an industry perspective, the mining sector has been the largest generator of value with a total of R101bn. It is followed by banks (R57bn) and
The Value of BEE Deals
© copyright Intellidex (Pty) Ltdwww.intellidex.co.za4
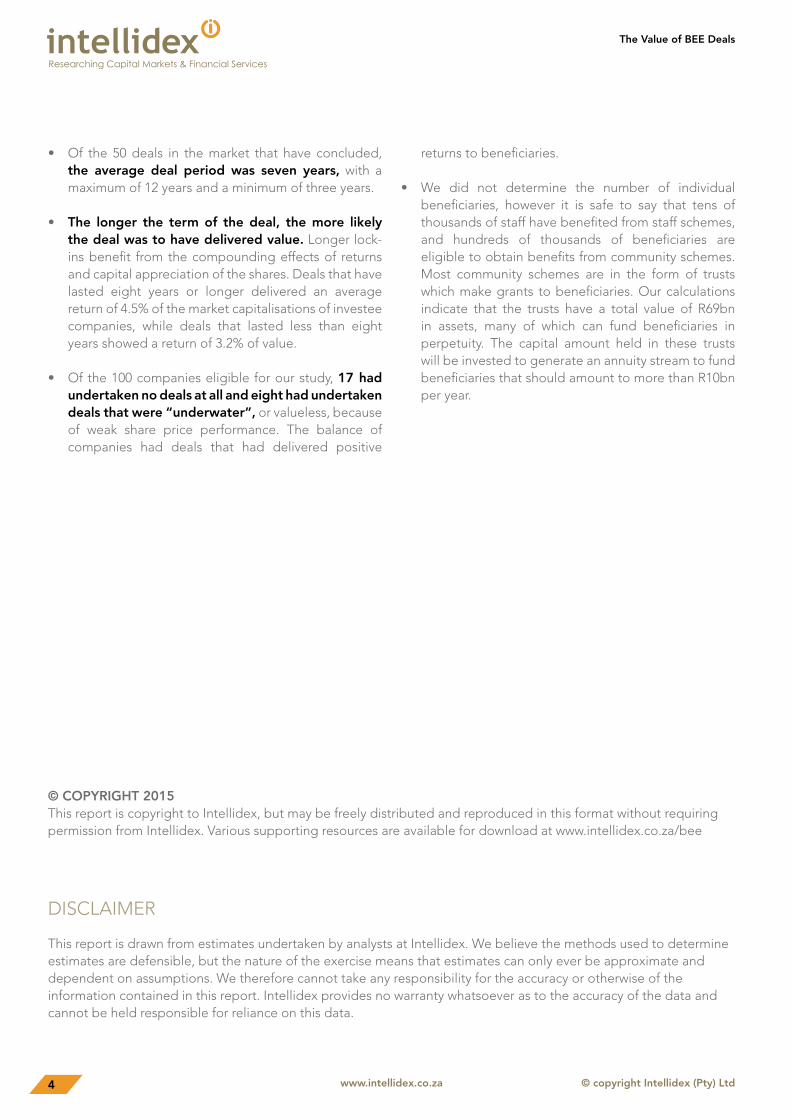
• Of the 50 deals in the market that have concluded, the average deal period was seven years, with a maximum of 12 years and a minimum of three years.
• The longer the term of the deal, the more likely the deal was to have delivered value. Longer lock-ins benefit from the compounding effects of returns and capital appreciation of the shares. Deals that have lasted eight years or longer delivered an average return of 4.5% of the market capitalisations of investee companies, while deals that lasted less than eight years showed a return of 3.2% of value.
• Of the 100 companies eligible for our study, 17 had undertaken no deals at all and eight had undertaken deals that were “underwater”, or valueless, because of weak share price performance. The balance of companies had deals that had delivered positive
returns to beneficiaries.
• We did not determine the number of individual beneficiaries, however it is safe to say that tens of thousands of staff have benefited from staff schemes, and hundreds of thousands of beneficiaries are eligible to obtain benefits from community schemes. Most community schemes are in the form of trusts which make grants to beneficiaries. Our calculations indicate that the trusts have a total value of R69bn in assets, many of which can fund beneficiaries in perpetuity. The capital amount held in these trusts will be invested to generate an annuity stream to fund beneficiaries that should amount to more than R10bn per year.
© COPYRIGHT 2015This report is copyright to Intellidex, but may be freely distributed and reproduced in this format without requiring permission from Intellidex. Various supporting resources are available for download at www.intellidex.co.za/bee
DISCLAIMER
This report is drawn from estimates undertaken by analysts at Intellidex. We believe the methods used to determine estimates are defensible, but the nature of the exercise means that estimates can only ever be approximate and dependent on assumptions. We therefore cannot take any responsibility for the accuracy or otherwise of the information contained in this report. Intellidex provides no warranty whatsoever as to the accuracy of the data and cannot be held responsible for reliance on this data.
© copyright Intellidex (Pty) Ltdwww.intellidex.co.za5
The Value of BEE Deals
CONTENTS
EXECUTIVE SUMMARY ...........................................................................................................................................................3
AKNOWLEDGEMENTS ..........................................................................................................................................................6
1. INTRODUCTION .................................................................................................................................................................7
2. FEATURES OF OVERALL VALUE CREATION ..................................................................................................................12
3. TIMING OF DEALS ............................................................................................................................................................13
4. JSE PERFORMANCE IMPACT ..........................................................................................................................................13
5. VALUE CREATION PER INDUSTRY ..................................................................................................................................15
6. VALUE CREATION BY BENEFICIARY TYPE.....................................................................................................................15
7. FULL LIST OF BEE DEALS BY TOP 100 JSE-LISTED COMPANIES ...............................................................................17
8. METHODOLOGY, DEFINITIONS AND ASSUMPTIONS ................................................................................................28
NOTES ON THE RESEARCH METHODS AND DEFINITIONS ..........................................................................................28
The Value of BEE Deals
© copyright Intellidex (Pty) Ltdwww.intellidex.co.za6
ACKNOWLEDGEMENTS
This project benefited from the support of many people. In particular the finance and investor relations departments of most of the JSE’s 100 largest companies assisted us with information and in reviewing our calculations. Many invested several hours of their time into doing so and we are very grateful for their efforts.
Special thanks go to Chia-Chao Wu at economic empowerment rating agency Empowerdex and Carel Vosloo at Rand Merchant Bank who both provided important input to help us develop our conceptual approach to the task.
We also acknowledge funding support from Laurie Dippenaar which made this project possible.
The conclusions and opinions contained in this report are solely those of the authors, as are any errors.
© copyright Intellidex (Pty) Ltdwww.intellidex.co.za7
The Value of BEE Deals
1. INTRODUCTION
Black economic empowerment is a national South African project aimed at helping to undo the legacy of Apartheid that is reflected in the pattern of ownership and other economic activity in the country. One element of this project has been to use the shares of JSE-listed companies to create assets in the hands of black beneficiaries. To do so, companies entered into transactions that aimed to transfer ownership of shares in those companies and, where relevant, the dividends that owners of shares receive, to black beneficiaries. Such transactions were generally funded using some form of debt or debt-like mechanism.
The ambition of this project was to determine just how much value these deals have generated. It makes no comment on other issues that are important including skills development, employment equity, enterprise development or even the pattern of ownership of the economy. This value was achieved by ensuring black beneficiaries became owners of interests in companies, but this is transitory in that those beneficiaries are naturally free to dispose of such stakes once deals mature. This project therefore has little to say about the pattern of ownership of JSE-listed companies, but for the first time calculates the quantum of asset value that black beneficiaries have acquired through such deals.
Beneficiary types
We have analysed deals in terms of three different “types” of beneficiaries: staff, strategic investors and community groups. Each of these beneficiary types has different economic considerations. Staff members are ordinary natural persons and in the case of many strategic investors and community groups, ordinary natural persons are the ultimate beneficiaries too, and receive either shares or cash at maturity of deals.
Standard investment theory tells us that the rational strategy of any investor is to diversify exposures such that risk and return are optimally balanced. BEE deals tend to deliver value that is undiversified in that exposures are narrowly focused on investee companies. We should expect, then, that beneficiaries would rebalance their investments, disposing of concentrated exposures and acquiring diversifying assets.
We should also expect that individuals will adjust their exposures according to lifecycle stage, using proceeds to settle debt and acquire assets early in their earnings cycle, but building savings later in their careers to fund retirement. Long-term savings are appropriately invested in equities such as those listed on the JSE, so the racial pattern of long-term savings in South Africa needs to normalise before we can expect to see a normal racial pattern in ownership of JSE-listed securities.
These considerations support a normative expectation that the ownership stakes that BEE deals provide are unlikely to form long-term ownership interests. BEE deals generate capital in the hands of beneficiaries that can be used in many ways, ranging from consumption to funding new business start-ups. Deals ensure improved balance sheets of black beneficiaries, creating equity value, but those balance sheets can be deployed in multiple ways as soon as deals mature. This is a desirable outcome – it would be counterproductive to lock beneficiaries into illiquid equity exposures merely to achieve black ownership, but that are otherwise economically irrational. The objective should be to generate assets that can serve an economic purpose. That is achieved by ensuring black beneficiaries are able to use those assets to pursue rational economic objectives including diversifying asset exposures and optimising life cycle consumption and investing patterns. In an economy in which there is no race-based bias to income or wealth distribution, we would expect to see no race-based bias in JSE-listed company ownership. BEE
Typical BEE deal stages:
1. A quantity of shares representing a certain percentage of a company is issued to entities controlled by the beneficiaries.
2. The market value of those shares, usually with some small discount, is set as the opening notional financing obligation.
3. The financing obligation increases each year by the funding rate, which is usually a percentage of the prime interest rate.
4. Some or all dividends received are allocated to reducing the notional financing obligation, with the balance paid to beneficiaries.
5. At expiry of the deal, usually after seven to 10 years, the remaining notional funding obligation is settled with the company buying back and
cancelling shares of equivalent value at that point.
6. The remaining shares are distributed to beneficiaries. The value of these shares represents the net value of the deal at expiry.
The Value of BEE Deals
© copyright Intellidex (Pty) Ltdwww.intellidex.co.za8
deals should play their part in undoing the racial bias in wealth distribution, but the ownership pattern of the JSE is a result of wealth distribution patterns rather than a cause of them.
Strategic investors
While companies clearly benefit from including staff in schemes, strategic investors as a group provide a different sort of benefit. Strategic investors are selected for their ability to drive the company’s strategy and competitiveness. There are various ways that this can manifest, ranging from lobbying at the political level through to guiding the development of the business. For the strategic investor, BEE deals provide an opportunity to accumulate capital and acquire actual operating businesses. Often the investment objective is different to the normal portfolio perspective of the standard investor. These strategic investors aim to directly influence the performance of companies. Our calculations indicate that strategic investors have a collective balance sheet of close to R200bn. This provides significant capital to drive the strategies of such investors, which may include acquiring concentrated exposures to companies to be able to exercise greater influence. Strategic investors are more likely to remain long-term investors after deals mature where there is a prospect of being able to generate significant value as part of a broader corporate strategy for the investor. Increasingly, strategic investors are specialising in particular sectors and focusing on having an operating influence.
Given these issues, we considered it important to complement the information available about the transformation of the South African economy by measuring the value created by BEE deals. As the above discussion should make clear, this assesses the wealth generated by such deals, but says nothing about the ownership of JSE companies. We are aware of other studies that provide insights on ownership, as well as other facets of the transformation project.
JSE performance
The headline number – R317bn – represents net balance sheet value attributable to black beneficiaries. Some of this – R208bn – is still “locked in” to deals that have yet to mature. These will mature over the next several years and the rand amount represents the value of those live deals as at the end of 2014. In some cases these are economically useful assets in that beneficiaries can hedge or use the value as security for borrowings. The performance of the
JSE will affect the eventual value of these interests when they mature.
The generation of this value is a function of the performance of the share prices of the relevant companies. During the period of such deals – the earliest were in 2001 – the market has had ups and downs, though it had a strong overall rally in the few years before the end of our study period. The timing of deals was therefore a very significant driver of value creation, both when deals were entered into and when they matured. There are periods when deals, including some large ones, were valueless, but a subsequent recovery in the market saw significant value created before deals expired. Equity investing is naturally volatile, but historically the long-term returns have been better than other asset classes. The general financial form of BEE deals is to swap the returns from debt for the returns from equity. In South Africa the JSE’s overall return has averaged about 17.2% over the last 20 years, while the average prime interest rate has been 13.7%. The difference between these two rates of return
KEY FIGURES
R317bn Net value created by BEE deals by largest 100 JSE-listed
companies.
34%
66%
Figure 1: Concluded vs live deals
Live deals
Concluded deals
Figure 2: Value by beneficiary type
Staff schemes
Strategic investors
Community schemes
22%
62%16%

© copyright Intellidex (Pty) Ltdwww.intellidex.co.za9
The Value of BEE Deals
has, on average, been the source of asset creation by BEE deals.
Equity returns are volatile while debt costs are relatively stable. In any “normal” debt-to-equity swap, this volatility mismatch is a risk that has to be compensated in the form of a risk premium. The intuition is that the volatility of equity creates bankruptcy risk – large short-
term downward movements in equity value can lead to significant net negative value for periods, but over time the average returns from equity normalise with a positive margin over the cost of debt. The economic cost of BEE deals is that the investee companies effectively pay this risk premium; they absorb the bankruptcy risk. BEE deals affect the overall bankruptcy risk of any company which negatively affects share prices; however BEE deals are important to companies’ ability to operate successfully in South Africa so undertaking a deal can be net share price positive. It is clear also that the probability of BEE deals succeeding increases over time. The longer the BEE deal’s time frame, therefore, the greater the likelihood of large returns.
Deal structures
The “cost” to companies of the deals is the implied option premium in the structures. Where values have been calculated for this premium, figures in the region of 3% of the value of companies have been suggested. It might be argued that the BEE project could have instead been achieved through the simple transfer of this cost to black beneficiaries. This, however, would omit an important element to the overall project, which is to align incentives with the objective of increasing the value of JSE-listed companies. By giving beneficiaries a stake in the prosperity of companies, better outcomes may be achieved than would be the case in a simple transfer of value.
The form of deals has changed over time as financial structuring techniques have evolved, regulations have been introduced and expectations changed. The “state of the art” deals aim to deliver on a range of objectives. Deals now typically involve three different beneficiary groups: black staff, who can be incentivised and retained through their inclusion in deals; black strategic investors who can contribute to the overall companies’ strategy and competiveness; and community groups who are usually broad-based constituencies that become beneficiaries of philanthropic activities, and are often affected by the companies’ operations. This “typical” deal form has been influenced by different considerations regarding black empowerment, such as the broadness of value creation, but also by debates regarding the interests of corporate stakeholders globally. BEE deals have been influenced by a “stakeholder” view of capitalism, in that beneficiaries are not just typical investors, but also those
CONTEXT
How much is R317bn?Figure 3: 1.8 times the total amount of corporate
income tax paid in 2014
Figure 4: 1.1 times the total value of agricultural land
and equipment in SA
350
300
250
200
150
100
50
0Tax take Deal value
320
310
300
290
280
270
260Value of agri land
& equipment
Deal value
R179.5
R317.0
R317.0
R285.0
Sources: Sars, department of agriculture, Intellidex
The Value of BEE Deals
© copyright Intellidex (Pty) Ltdwww.intellidex.co.za10
who have interests in a company such as employees and communities around their places of operation. The inclusion of these stakeholders in BEE deals has been an interesting feature of transactions which aligns them with global best practice views on stakeholder capitalism.
In this report we reflect on all of these issues in analysing the value created by BEE deals. Our key findings are summarised in the executive summary at the start of this report, and we reflect more deeply on the issues that have driven value generation in what follows. We hope in this report to support ongoing debates about the structure and purpose of BEE deals. We are struck, however, by
the general conclusion that BEE deals have generated a significant amount of value that will have contributed to the overall ambition of black economic empowerment. Deals have played an important role in normalising the economy, even though so much more remains to be done.
© copyright Intellidex (Pty) Ltdwww.intellidex.co.za11
The Value of BEE Deals
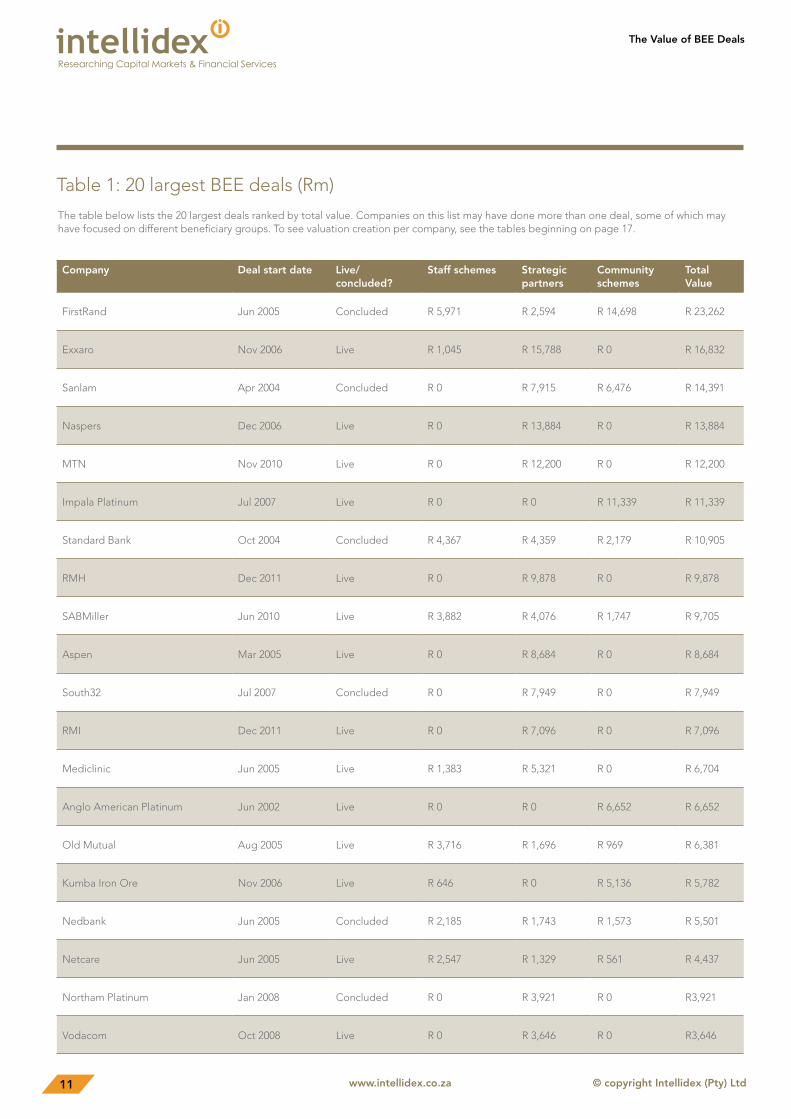
Table 1: 20 largest BEE deals (Rm)
The table below lists the 20 largest deals ranked by total value. Companies on this list may have done more than one deal, some of which mayhave focused on different beneficiary groups. To see valuation creation per company, see the tables beginning on page 17.
Company Deal start date Live/concluded?
Staff schemes Strategic partners
Community schemes
Total Value
FirstRand Jun 2005 Concluded R 5,971 R 2,594 R 14,698 R 23,262
Exxaro Nov 2006 Live R 1,045 R 15,788 R 0 R 16,832
Sanlam Apr 2004 Concluded R 0 R 7,915 R 6,476 R 14,391
Naspers Dec 2006 Live R 0 R 13,884 R 0 R 13,884
MTN Nov 2010 Live R 0 R 12,200 R 0 R 12,200
Impala Platinum Jul 2007 Live R 0 R 0 R 11,339 R 11,339
Standard Bank Oct 2004 Concluded R 4,367 R 4,359 R 2,179 R 10,905
RMH Dec 2011 Live R 0 R 9,878 R 0 R 9,878
SABMiller Jun 2010 Live R 3,882 R 4,076 R 1,747 R 9,705
Aspen Mar 2005 Live R 0 R 8,684 R 0 R 8,684
South32 Jul 2007 Concluded R 0 R 7,949 R 0 R 7,949
RMI Dec 2011 Live R 0 R 7,096 R 0 R 7,096
Mediclinic Jun 2005 Live R 1,383 R 5,321 R 0 R 6,704
Anglo American Platinum Jun 2002 Live R 0 R 0 R 6,652 R 6,652
Old Mutual Aug 2005 Live R 3,716 R 1,696 R 969 R 6,381
Kumba Iron Ore Nov 2006 Live R 646 R 0 R 5,136 R 5,782
Nedbank Jun 2005 Concluded R 2,185 R 1,743 R 1,573 R 5,501
Netcare Jun 2005 Live R 2,547 R 1,329 R 561 R 4,437
Northam Platinum Jan 2008 Concluded R 0 R 3,921 R 0 R3,921
Vodacom Oct 2008 Live R 0 R 3,646 R 0 R3,646
The Value of BEE Deals
© copyright Intellidex (Pty) Ltdwww.intellidex.co.za12
2. FEATURES OF OVERALL VALUE CREATION
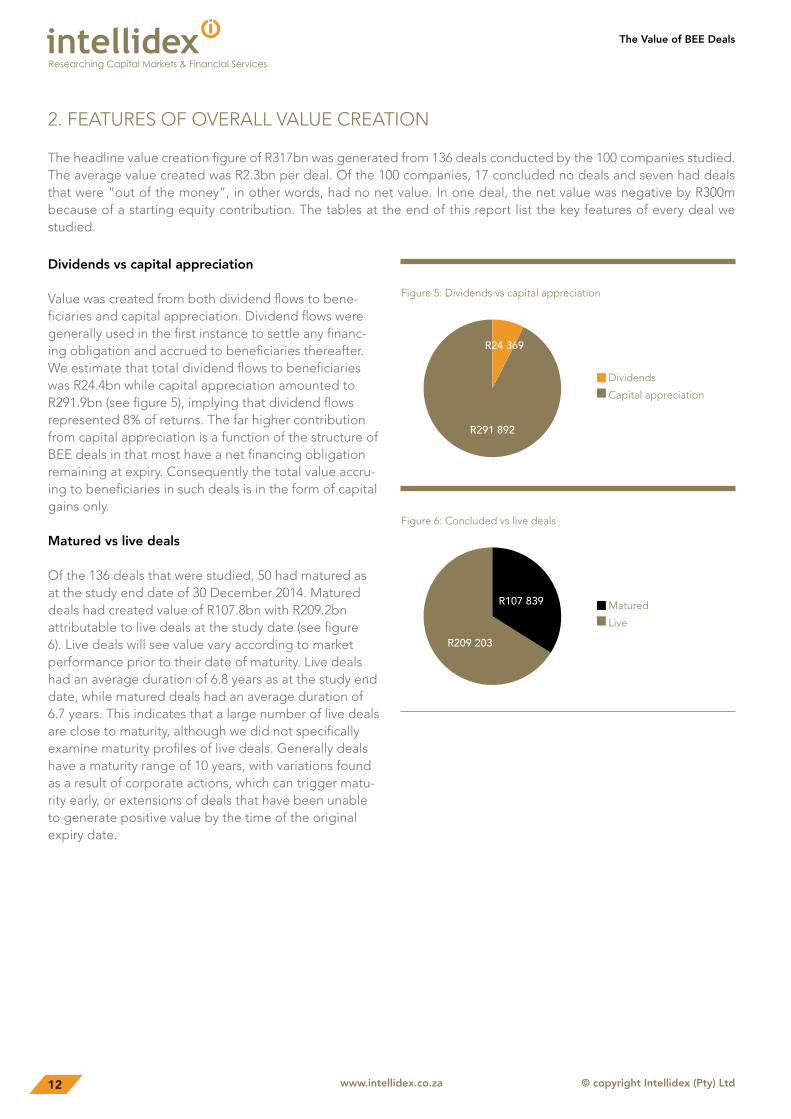
The headline value creation figure of R317bn was generated from 136 deals conducted by the 100 companies studied. The average value created was R2.3bn per deal. Of the 100 companies, 17 concluded no deals and seven had deals that were “out of the money”, in other words, had no net value. In one deal, the net value was negative by R300m because of a starting equity contribution. The tables at the end of this report list the key features of every deal we studied.
R24 369
Figure 5: Dividends vs capital appreciation
Dividends
Capital appreciation
R291 892
R107 839
Figure 6: Concluded vs live deals
Matured
Live
R209 203
Dividends vs capital appreciation
Value was created from both dividend flows to bene-ficiaries and capital appreciation. Dividend flows were generally used in the first instance to settle any financ-ing obligation and accrued to beneficiaries thereafter. We estimate that total dividend flows to beneficiaries was R24.4bn while capital appreciation amounted to R291.9bn (see figure 5), implying that dividend flows represented 8% of returns. The far higher contribution from capital appreciation is a function of the structure of BEE deals in that most have a net financing obligation remaining at expiry. Consequently the total value accru-ing to beneficiaries in such deals is in the form of capital gains only.
Matured vs live deals
Of the 136 deals that were studied, 50 had matured as at the study end date of 30 December 2014. Matured deals had created value of R107.8bn with R209.2bn attributable to live deals at the study date (see figure 6). Live deals will see value vary according to market performance prior to their date of maturity. Live deals had an average duration of 6.8 years as at the study end date, while matured deals had an average duration of 6.7 years. This indicates that a large number of live deals are close to maturity, although we did not specifically examine maturity profiles of live deals. Generally deals have a maturity range of 10 years, with variations found as a result of corporate actions, which can trigger matu-rity early, or extensions of deals that have been unable to generate positive value by the time of the original expiry date.
© copyright Intellidex (Pty) Ltdwww.intellidex.co.za13
The Value of BEE Deals
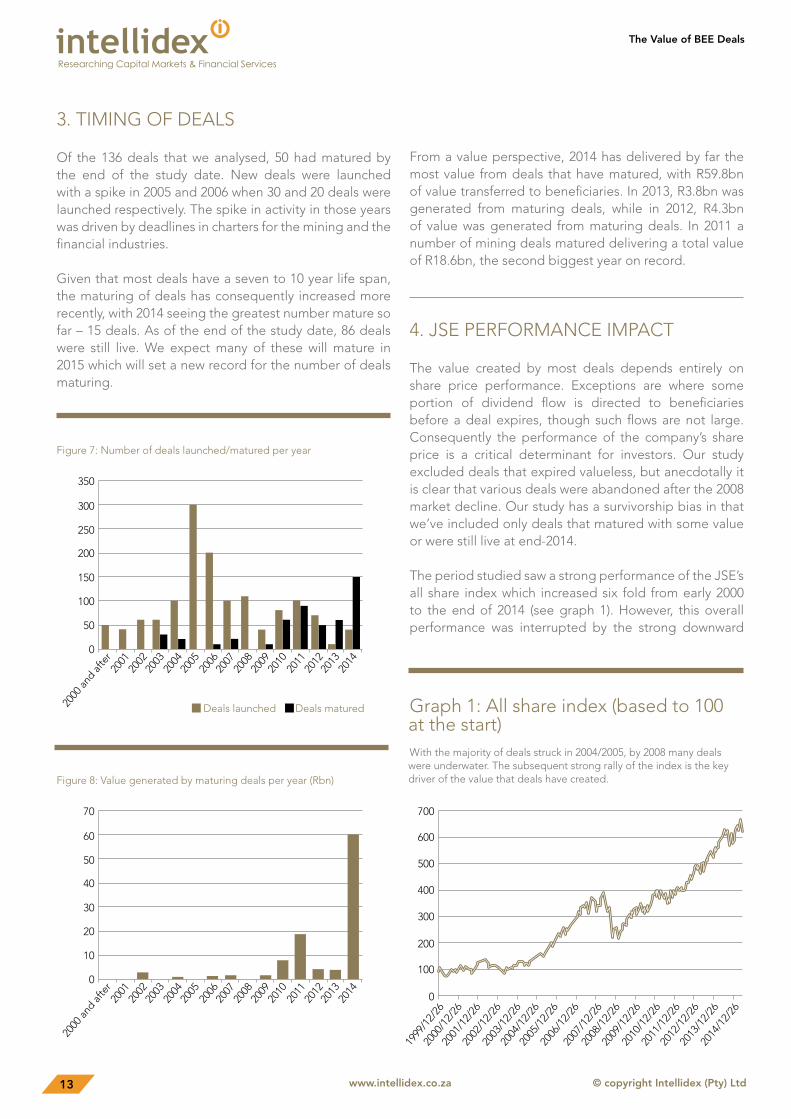
4. JSE PERFORMANCE IMPACT
The value created by most deals depends entirely on share price performance. Exceptions are where some portion of dividend flow is directed to beneficiaries before a deal expires, though such flows are not large. Consequently the performance of the company’s share price is a critical determinant for investors. Our study excluded deals that expired valueless, but anecdotally it is clear that various deals were abandoned after the 2008 market decline. Our study has a survivorship bias in that we’ve included only deals that matured with some value or were still live at end-2014.
The period studied saw a strong performance of the JSE’s all share index which increased six fold from early 2000 to the end of 2014 (see graph 1). However, this overall performance was interrupted by the strong downward
700
600
500
400
300
200
100
0
1999
/12/
2620
00/1
2/26
2001
/12/
2620
02/1
2/26
2003
/12/
2620
04/1
2/26
2005
/12/
2620
06/1
2/26
2008
/12/
2620
09/1
2/26
2010
/12/
2620
11/1
2/26
2012
/12/
2620
13/1
2/26
2014
/12/
26
2007
/12/
26
Graph 1: All share index (based to 100 at the start)With the majority of deals struck in 2004/2005, by 2008 many deals were underwater. The subsequent strong rally of the index is the key driver of the value that deals have created.
3. TIMING OF DEALS
Of the 136 deals that we analysed, 50 had matured by the end of the study date. New deals were launched with a spike in 2005 and 2006 when 30 and 20 deals were launched respectively. The spike in activity in those years was driven by deadlines in charters for the mining and the financial industries.
Given that most deals have a seven to 10 year life span, the maturing of deals has consequently increased more recently, with 2014 seeing the greatest number mature so far – 15 deals. As of the end of the study date, 86 deals were still live. We expect many of these will mature in 2015 which will set a new record for the number of deals maturing.
Figure 7: Number of deals launched/matured per year
350
300
250
200
150
100
50
0
2000
and af
ter
2001
2002
2003
2004
2005
2006
2007
2008
2009
2010
2011
2012
2013
2014
Deals launched Deals matured
Figure 8: Value generated by maturing deals per year (Rbn)
70
60
50
40
30
20
10
0
2000
and af
ter
2001
2002
2003
2004
2005
2006
2007
2008
2009
2010
2011
2012
2013
2014
From a value perspective, 2014 has delivered by far the most value from deals that have matured, with R59.8bn of value transferred to beneficiaries. In 2013, R3.8bn was generated from maturing deals, while in 2012, R4.3bn of value was generated from maturing deals. In 2011 a number of mining deals matured delivering a total value of R18.6bn, the second biggest year on record.
The Value of BEE Deals
© copyright Intellidex (Pty) Ltdwww.intellidex.co.za14
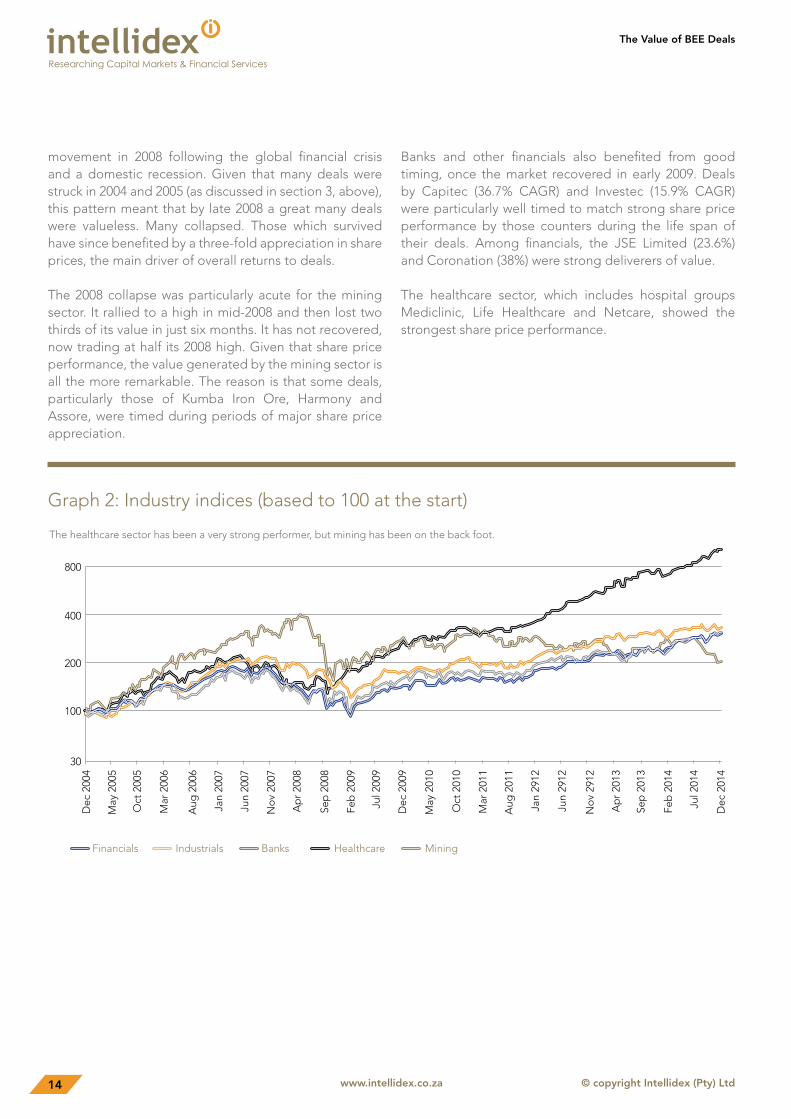
Graph 2: Industry indices (based to 100 at the start)
The healthcare sector has been a very strong performer, but mining has been on the back foot.
800
400
200
100
30
Dec
200
4
May
200
5
Oct
200
5
Mar
200
6
Aug
200
6
Jan
2007
Jun
2007
No
v 20
07
Ap
r 20
08
Sep
200
8
Feb
200
9
Jul 2
009
Dec
200
9
May
201
0
Oct
201
0
Mar
201
1
Aug
201
1
Jan
2912
Jun
2912
No
v 29
12
Ap
r 20
13
Sep
201
3
Feb
201
4
Jul 2
014
Dec
201
4
movement in 2008 following the global financial crisis and a domestic recession. Given that many deals were struck in 2004 and 2005 (as discussed in section 3, above), this pattern meant that by late 2008 a great many deals were valueless. Many collapsed. Those which survived have since benefited by a three-fold appreciation in share prices, the main driver of overall returns to deals.
The 2008 collapse was particularly acute for the mining sector. It rallied to a high in mid-2008 and then lost two thirds of its value in just six months. It has not recovered, now trading at half its 2008 high. Given that share price performance, the value generated by the mining sector is all the more remarkable. The reason is that some deals, particularly those of Kumba Iron Ore, Harmony and Assore, were timed during periods of major share price appreciation.
Banks and other financials also benefited from good timing, once the market recovered in early 2009. Deals by Capitec (36.7% CAGR) and Investec (15.9% CAGR) were particularly well timed to match strong share price performance by those counters during the life span of their deals. Among financials, the JSE Limited (23.6%) and Coronation (38%) were strong deliverers of value.
The healthcare sector, which includes hospital groups Mediclinic, Life Healthcare and Netcare, showed the strongest share price performance.
Financials Industrials Banks Healthcare Mining

© copyright Intellidex (Pty) Ltdwww.intellidex.co.za15
The Value of BEE Deals
6. VALUE CREATION BY BENEFICIARY TYPE
The standard model for BEE deals has evolved into one where three groups of beneficiaries are included – staff, strategic investors and community groups. (The definitions of these groups are on pages 29-30.) The evolution of this deal type represents the development of insights into how deals can best deliver value to companies and the influence of the stakeholder capitalism debate that has taken place internationally. The debate over the broadness of deals has also contributed to this trend in that staff and community groups often include thousands of end-beneficiaries. Such deal structures include the full ambit of black stakeholders who become invested in the success of the investee business.
Of the 136 deals studied with positive value, 51 deals included a staff component, 93 had a strategic investor component and 43 had a community scheme. Only 14 deals included all three groups, but this does not imply that only 14 companies have benefited those groups – several companies did multiple deals, with
5. VALUE CREATION PER INDUSTRY
BEE deals have been undertaken by all industry sectors in the South African economy. From a value-creation perspective, mining has been by far the largest generator of wealth, creating R101bn of value. That is almost twice as much as the next biggest value generator, banks, which created R57bn of value (see table 2). Mining is also the largest value generator when considered from a proportional point of view, generating value equivalent to 11.8% of the market capitalisation of the companies in the sector. That is followed by healthcare, consisting of the hospital groups Life Healthcare, Mediclinic and Netcare, which have each undertaken substantial deals. Banks are the third-largest group proportionately, followed by financials, which are dominated by the large insurance companies.
Comparatively little value has been generated in the retail sector. This is largely because few companies have undertaken deals, though in the course of our research we were told that various companies are in the process of negotiating deals. Among those that have undertaken deals, Massmart, Spar, Woolworths, Clicks and Mr Price have generated good returns for beneficiaries. Another six companies in the sector had undertaken no deals by the time of our research date.
Sector Total value
(Rm)
Value as % of
mkt cap
Banks R 57,228 6.0%
Financials R 32,358 5.4%
Healthcare R 14,289 7.2%
Industrial R 56,740 2.1%
Investment companies R 10,431 4.2%
Mining R 100,915 11.8%
Pharmaceutical R 9,568 5.0%
Property R 8,872 3.9%
Retail R 7,677 1.8%
Telecoms R 17,246 2.7%
Travel & Leisure R 1,636 3.6%
Table 2: Value creation per industry sector
Industrial companies are the next lowest proportional value creator. This has largely been because of the relatively poor performance of share prices of the industrial sector. Of the 47 companies in the sector, five have not undertaken deals, the largest of which is ArcelorMittal, which negotiated but did not conclude a deal in 2011.
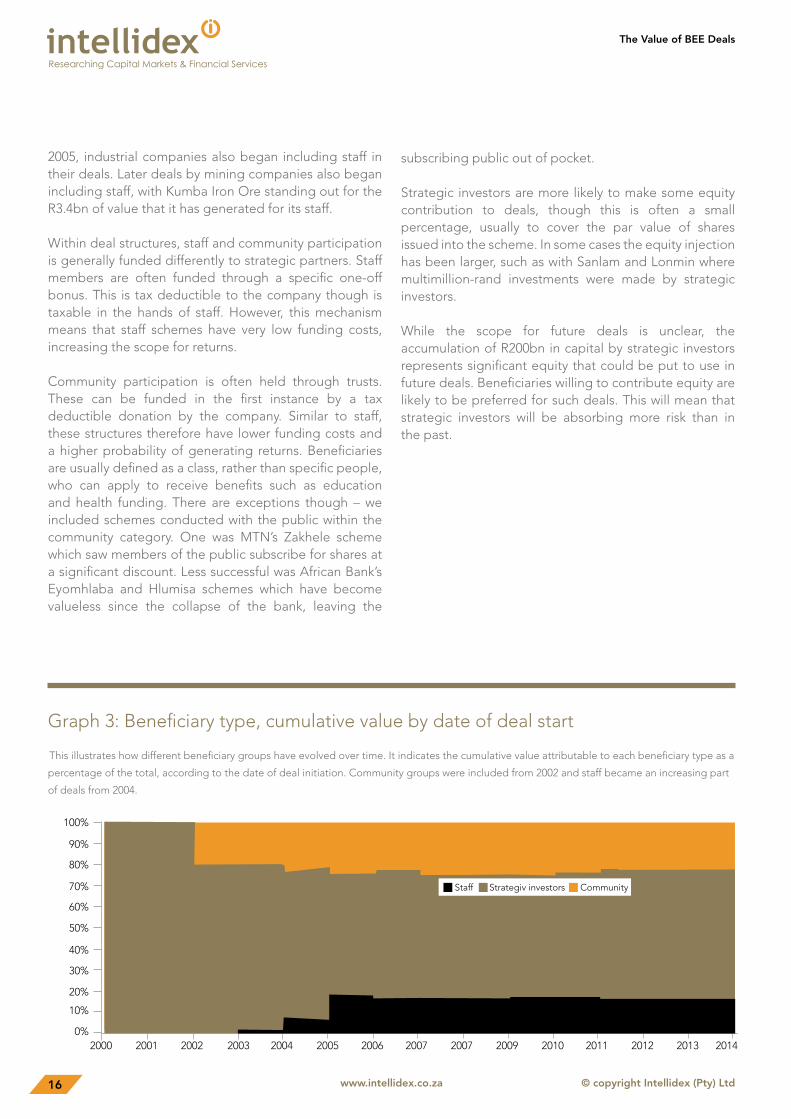
each focused on a different type of beneficiary group. Graph 3 illustrates the trend towards including staff and community schemes. Initially deals were done entirely with specific strategic investors, usually associated with prominent black individuals. From late 2001, broad-based community groups were introduced into deals and quickly became a feature of deals done thereafter. Beginning in 2003 but accelerating rapidly through 2005, staff schemes became an important component in deals. Deals with no strategic partners were the exception. A few deals prior to 2005 included broad-based trusts only. This has become more common since, with some deals including staff only, and some have included community trusts only.
Early community schemes were set up within the mining industry with large values attributable to such schemes in deals done by Anglo American Platinum and Gold Fields. Staff schemes were driven particularly by the financial sector, which began doing deals in 2003. From mid-
The Value of BEE Deals
© copyright Intellidex (Pty) Ltdwww.intellidex.co.za16
Graph 3: Beneficiary type, cumulative value by date of deal start
This illustrates how different beneficiary groups have evolved over time. It indicates the cumulative value attributable to each beneficiary type as a
percentage of the total, according to the date of deal initiation. Community groups were included from 2002 and staff became an increasing part
of deals from 2004.
2000 2001 2002 2003 2004 2005 2006 2007 2007 2009 2010 2011 2012 2013 20140%
10%
20%
30%
40%
50%
60%
70%
80%
90%
100%
Staff Strategiv investors Community
2005, industrial companies also began including staff in their deals. Later deals by mining companies also began including staff, with Kumba Iron Ore standing out for the R3.4bn of value that it has generated for its staff.
Within deal structures, staff and community participation is generally funded differently to strategic partners. Staff members are often funded through a specific one-off bonus. This is tax deductible to the company though is taxable in the hands of staff. However, this mechanism means that staff schemes have very low funding costs, increasing the scope for returns.
Community participation is often held through trusts. These can be funded in the first instance by a tax deductible donation by the company. Similar to staff, these structures therefore have lower funding costs and a higher probability of generating returns. Beneficiaries are usually defined as a class, rather than specific people, who can apply to receive benefits such as education and health funding. There are exceptions though – we included schemes conducted with the public within the community category. One was MTN’s Zakhele scheme which saw members of the public subscribe for shares at a significant discount. Less successful was African Bank’s Eyomhlaba and Hlumisa schemes which have become valueless since the collapse of the bank, leaving the
subscribing public out of pocket.
Strategic investors are more likely to make some equity contribution to deals, though this is often a small percentage, usually to cover the par value of shares issued into the scheme. In some cases the equity injection has been larger, such as with Sanlam and Lonmin where multimillion-rand investments were made by strategic investors.
While the scope for future deals is unclear, the accumulation of R200bn in capital by strategic investors represents significant equity that could be put to use in future deals. Beneficiaries willing to contribute equity are likely to be preferred for such deals. This will mean that strategic investors will be absorbing more risk than in the past.

© copyright Intellidex (Pty) Ltdwww.intellidex.co.za17
The Value of BEE Deals
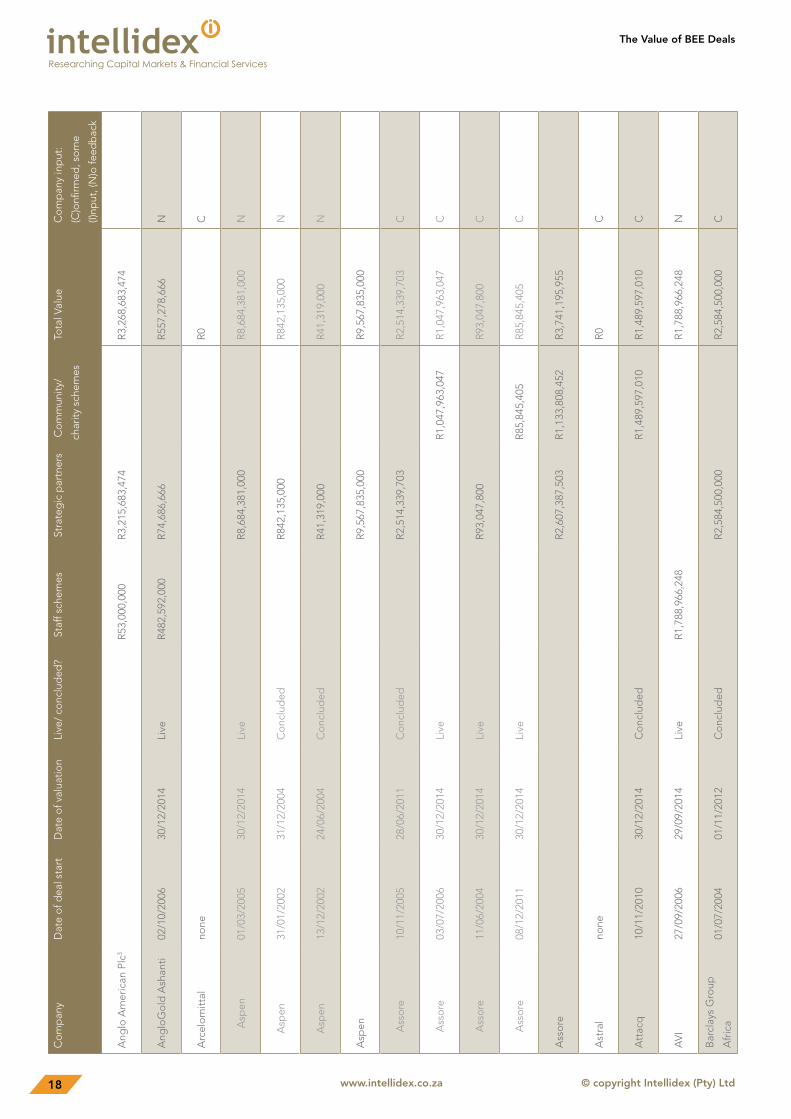
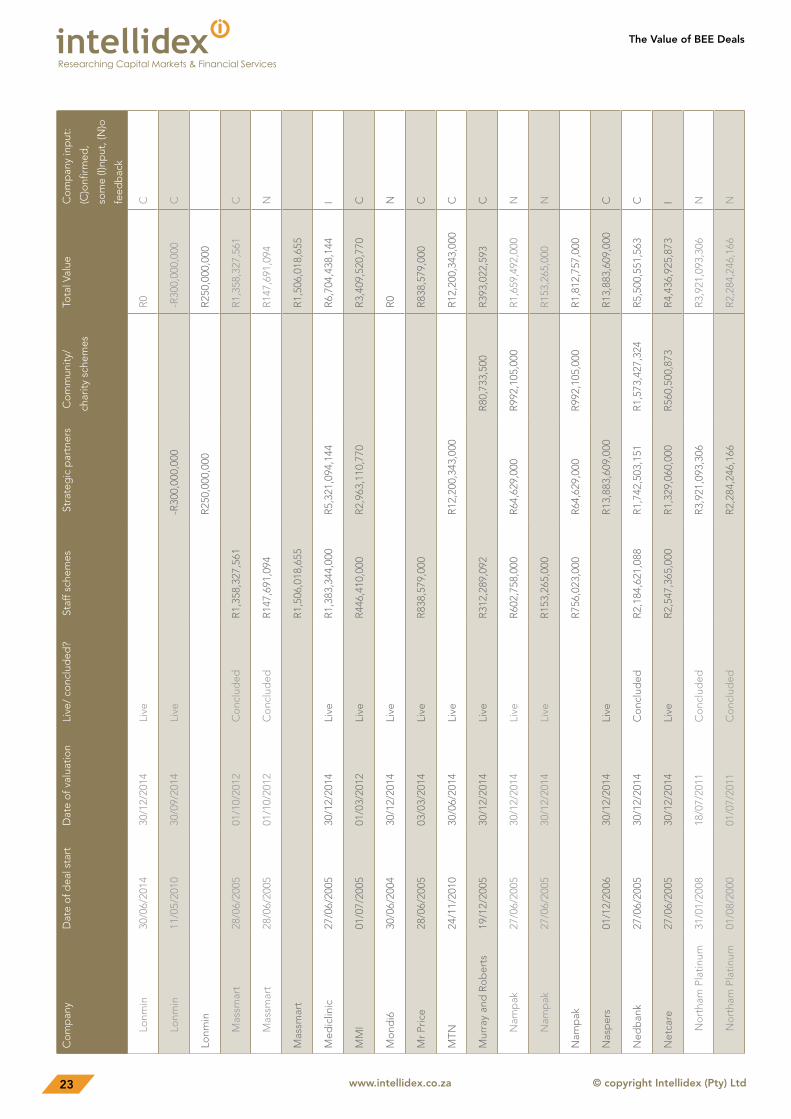
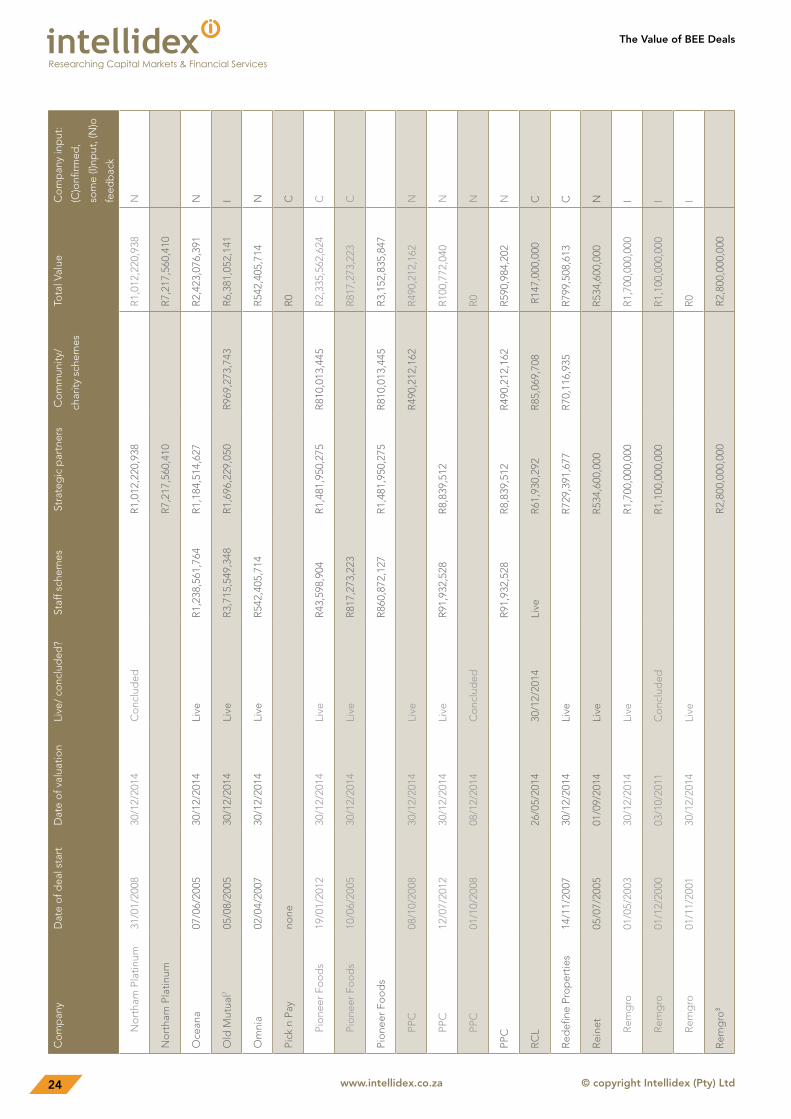
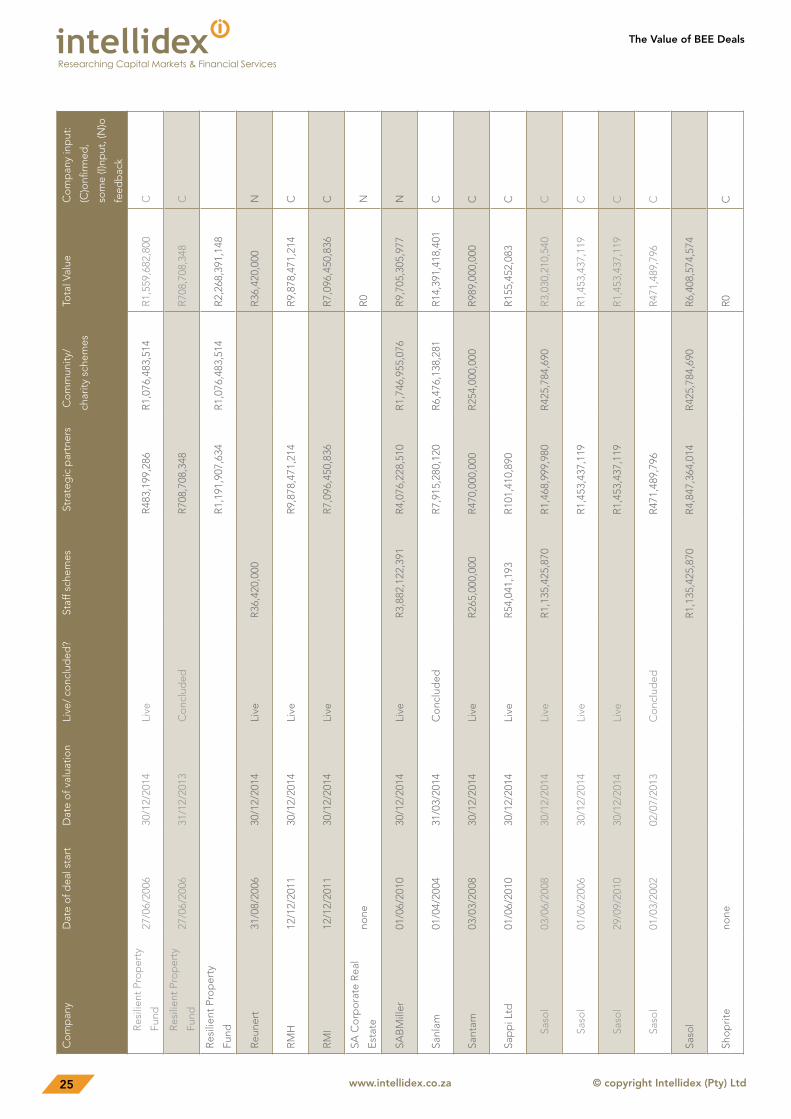
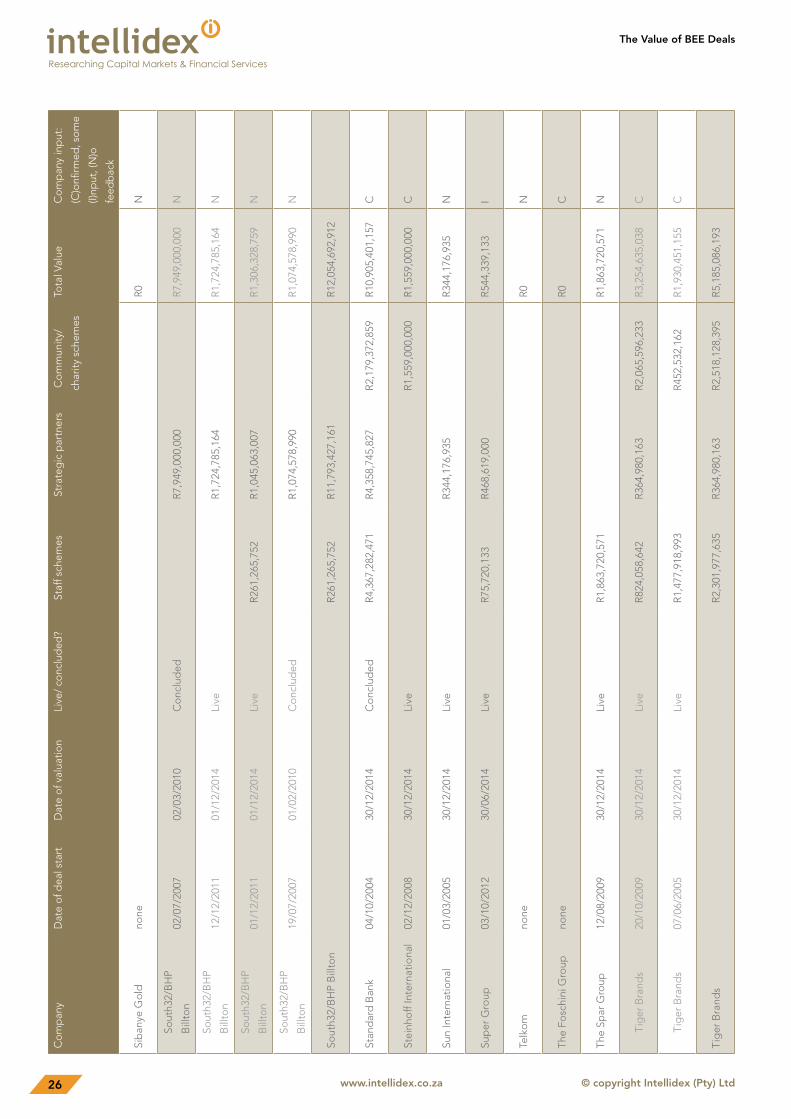
7. FULL LIST OF BEE DEALS BY TOP 100 JSE-LISTED COMPANIES
See methodology and notes for details of research process. This spreadsheet with additional columns is available to download from www.intellidex.co.za/bee.
Co
mp
any
Dat
e o
f dea
l
star
t
Dat
e o
f val
ua-
tion
Live
/
conc
lud
ed?
Sta
ff sc
hem
es S
trat
egic
par
tner
s
Co
mm
unity
/
char
ity s
chem
es
Tota
l Val
ueC
om
pan
y in
put
:
(C)o
nfirm
ed, s
om
e
(I)np
ut, (
N)o
feed
bac
k
Acu
cap
Pro
per
ties
05/0
9/20
0602
/06/
2014
Co
nclu
ded
R
263,
886,
859
R
263,
886,
859
N
Ad
cock
Ing
ram
01/0
4/20
1030
/12/
2014
Live
R
0C
AE
CI
07/1
0/20
1130
/12/
2014
Live
R63
3,65
0,79
5R
248,
833,
856
R19
2,17
6,56
5R
1,07
4,66
1,21
6N
Afr
ican
Rai
nbo
w
Min
eral
s120
/04/
2005
30/1
2/20
14Li
ve
R
2,44
8,77
0,04
9R
2,44
8,77
0,04
9N
Ale
xand
er F
orb
es03
/04/
2003
03/0
6/20
07C
onc
lud
edR
138,
466,
400
R16
4,39
1,97
2R
43,5
59,6
37R
243,
539,
609
C
Ang
lo A
mer
ican
Plat
inum
03/0
6/20
0201
/12/
2014
Live
R6,
651,
599,
540
R6,
651,
599,
540
N
Ang
lo A
mer
ican
Plat
inum
01/0
8/20
0016
/05/
2011
Co
nclu
ded
R
2,28
4,24
6,16
6
R2,
284,
246,
166
N
Ang
lo A
mer
ican
Plat
inum
01/0
6/20
0930
/12/
2014
Live
R
924,
845,
117
R
924,
845,
117
N
Ang
lo A
mer
ican
Plat
inum
01/1
1/20
0631
/12/
2014
Live
R42
0,00
0,00
0R
420,
000,
000
N
Ang
lo A
mer
ican
Plat
inum
11/0
6/20
0830
/12/
2014
Live
R39
2,82
1,51
2
R
392,
821,
512
N
Ang
lo A
mer
ican
Plat
inum
03/0
3/20
0330
/12/
2014
Co
nclu
ded
R
90,0
00,0
00
R90
,000
,000
N
Ang
lo A
mer
ican
Plat
inum
2
R39
2,82
1,51
2R
3,29
9,09
1,28
3R
7,07
1,59
9,54
0R
10,7
63,5
12,3
35
Ang
lo A
mer
ican
Plc
08/1
1/20
0009
/10/
2006
Co
nclu
ded
R
1,17
3,80
0,00
0
R1,
173,
800,
000
I
Ang
lo A
mer
ican
Plc
03/0
7/20
0730
/12/
2014
Live
R
1,13
3,08
4,08
4
R1,
133,
084,
084
I
Ang
lo A
mer
ican
Plc
03/0
4/20
0601
/12/
2014
Live
R53
,000
,000
R83
5,82
6,41
7
R88
8,82
6,41
7I
Ang
lo A
mer
ican
Plc
01/0
8/20
0203
/01/
2012
Co
nclu
ded
R
72,9
72,9
73
R72
,972
,973
I
The Value of BEE Deals
© copyright Intellidex (Pty) Ltdwww.intellidex.co.za18
Co
mp
any
Dat
e o
f dea
l sta
rtD
ate
of v
alua
tion
Live
/ co
nclu
ded
? S
taff
sche
mes
Str
ateg
ic p
artn
ers
Co
mm
unity
/
char
ity s
chem
es
Tota
l Val
ueC
om
pan
y in
put
:
(C)o
nfirm
ed, s
om
e
(I)np
ut, (
N)o
feed
bac
k
Ang
lo A
mer
ican
Plc
3
R53
,000
,000
R3,
215,
683,
474
R
3,26
8,68
3,47
4
Ang
loG
old
Ash
anti
02/1
0/20
0630
/12/
2014
Live
R48
2,59
2,00
0R
74,6
86,6
66
R55
7,27
8,66
6N
Arc
elo
mitt
alno
ne
R0
C
Asp
en01
/03/
2005
30/1
2/20
14Li
ve
R8,
684,
381,
000
R
8,68
4,38
1,00
0N
Asp
en31
/01/
2002
31/1
2/20
04C
onc
lud
ed
R84
2,13
5,00
0
R84
2,13
5,00
0N
Asp
en13
/12/
2002
24/0
6/20
04C
onc
lud
ed
R41
,319
,000
R
41,3
19,0
00N
Asp
en
R
9,56
7,83
5,00
0
R9,
567,
835,
000
Ass
ore
10/1
1/20
0528
/06/
2011
Co
nclu
ded
R
2,51
4,33
9,70
3
R2,
514,
339,
703
C
Ass
ore
03/0
7/20
0630
/12/
2014
Live
R1,
047,
963,
047
R1,
047,
963,
047
C
Ass
ore
11/0
6/20
0430
/12/
2014
Live
R
93,0
47,8
00
R93
,047
,800
C
Ass
ore
08/1
2/20
1130
/12/
2014
Live
R85
,845
,405
R85
,845
,405
C
Ass
ore
R2,
607,
387,
503
R1,
133,
808,
452
R3,
741,
195,
955
Ast
ral
none
R
0C
Att
acq
10/1
1/20
1030
/12/
2014
Co
nclu
ded
R1,
489,
597,
010
R1,
489,
597,
010
C
AV
I 27
/09/
2006
29/0
9/20
14Li
veR
1,78
8,96
6,24
8
R
1,78
8,96
6,24
8N
Bar
clay
s G
roup
Afr
ica
01/0
7/20
0401
/11/
2012
Co
nclu
ded
R
2,58
4,50
0,00
0
R2,
584,
500,
000
C

© copyright Intellidex (Pty) Ltdwww.intellidex.co.za19
The Value of BEE Deals
Co
mp
any
Dat
e o
f dea
l sta
rtD
ate
of v
alua
tion
Live
/ co
nclu
ded
? S
taff
sche
mes
Str
ateg
ic p
artn
ers
Co
mm
unity
/
char
ity s
chem
es
Tota
l Val
ueC
om
pan
y in
put
:
(C)o
nfirm
ed, s
om
e
(I)np
ut, (
N)o
feed
bac
k
Bar
low
orld
22/0
9/20
0830
/09/
2013
Co
nclu
ded
R30
8,60
0,00
0
R11
2,16
3,24
4R
420,
763,
244
C
Bar
low
orld
21/0
7/20
0525
/09/
2012
Co
nclu
ded
R
125,
000,
000
R
125,
000,
000
C
Bar
low
orld
22/0
9/20
0830
/12/
2014
Live
R11
,185
,426
R11
,185
,426
C
Bar
low
orld
R
319,
785,
426
R12
5,00
0,00
0R
112,
163,
244
R55
6,94
8,67
1
Bid
vest
03/0
3/20
0307
/04/
2011
Co
nclu
ded
R
1,91
1,73
3,60
6
R1,
911,
733,
606
C
Bra
it01
/10/
2004
01/0
3/20
10C
onc
lud
ed
R17
5,02
0,00
0
R17
5,02
0,00
0N
Cap
itec
29/0
6/20
0530
/12/
2014
Live
R72
,783
,000
R3,
132,
330,
000
R
3,20
5,11
3,00
0C
Clic
ks01
/02/
2011
30/1
2/20
14Li
ve
R64
5,35
2,00
0
R64
5,35
2,00
0C
Co
rona
tion
01/0
4/20
0528
/02/
2013
Co
nclu
ded
R
1,65
0,70
1,95
3
R1,
650,
701,
953
C
Cur
ro04
/05/
2012
30/1
2/20
14Li
ve
R53
2,23
2,35
4
R53
2,23
2,35
4N
Dis
cove
ry26
/09/
2005
30/1
2/20
14Li
veR
589,
306,
000
R1,
805,
831,
343
R
2,39
5,13
7,34
3C
Dis
tell
21/0
9/20
0530
/12/
2014
Co
nclu
ded
R58
5,00
0,00
0R
520,
000,
000
R19
5,00
0,00
0R
1,30
0,00
0,00
0C
Em
ira28
/08/
2006
30/1
2/20
14Li
veR
59,2
60,0
00R
474,
080,
000
R59
,260
,000
R59
2,60
0,00
0N
Exx
aro
28/1
1/20
0630
/12/
2014
Live
R1,
044,
594,
565
R15
,787
,875
,586
R
16,8
32,4
70,1
51C
Exx
aro
26/0
9/20
1130
/12/
2014
Live
R31
2,62
3,51
0
R
312,
623,
510
C
Exx
aro
4
R1,
357,
218,
075
R15
,787
,875
,586
R
17,1
45,0
93,6
61

The Value of BEE Deals
© copyright Intellidex (Pty) Ltdwww.intellidex.co.za20
Co
mp
any
Dat
e o
f dea
l sta
rtD
ate
of v
alua
tion
Live
/ co
nclu
ded
? S
taff
sche
mes
Str
ateg
ic p
artn
ers
Co
mm
unity
/
char
ity s
chem
es
Tota
l Val
ueC
om
pan
y in
put
:
(C)o
nfirm
ed, s
om
e
(I)np
ut, (
N)o
feed
bac
k
Fam
ous
Bra
nds
none
R
0C
Firs
tRan
d27
/06/
2005
30/1
2/20
14C
onc
lud
edR
5,97
0,80
0,00
0R
2,59
3,74
0,00
0R
14,6
97,8
60,0
00R
23,2
62,4
00,0
00C
Fort
ress
01/0
4/20
1101
/04/
2014
Co
nclu
ded
R
112,
689,
000
R10
4,02
1,00
0R
216,
710,
000
I
Fort
ress
17/0
3/20
1430
/12/
2014
Live
R17
4,80
8,50
5R
174,
808,
505
C
Fort
ress
12/1
2/20
1230
/12/
2014
Live
R35
,182
,249
R35
,182
,249
C
Fort
ress
R11
2,68
9,00
0R
314,
011,
754
R42
6,70
0,75
4
Foun
tain
head
Pro
per
ty T
rust
none
R
0N
Go
ld F
ield
s15
/03/
2004
17/0
3/20
09C
onc
lud
ed
R1,
806,
000,
000
R
1,80
6,00
0,00
0N
Go
ld F
ield
s05
/10/
2010
30/1
2/20
14Li
veR
759,
119,
475
R78
0,34
2,83
6R
3,71
9,67
2R
1,54
3,18
1,98
3N
Go
ld F
ield
s
R75
9,11
9,47
5R
2,58
6,34
2,83
6R
3,71
9,67
2R
3,34
9,18
1,98
3
Grin
dro
d23
/02/
2009
30/0
6/20
14C
onc
lud
ed
R56
0,00
0,00
0
R56
0,00
0,00
0C
Gro
wth
po
int
30/0
8/20
0530
/12/
2014
Live
R
1,16
6,93
3,01
9
R1,
166,
933,
019
N
Gro
wth
po
int
30/0
8/20
0505
/03/
2013
Co
nclu
ded
R
394,
999,
776
R
394,
999,
776
N
Gro
wth
po
int
08/1
2/20
0610
/10/
2013
Co
nclu
ded
R
139,
411,
327
R
139,
411,
327
N
Gro
wth
po
int
R1,
701,
344,
121
R
1,70
1,34
4,12
1
Har
mo
ny G
old
07/0
9/20
0101
/02/
2002
Co
nclu
ded
R
1,20
0,00
0,00
0
R1,
200,
000,
000
I

© copyright Intellidex (Pty) Ltdwww.intellidex.co.za21
The Value of BEE Deals
Co
mp
any
Dat
e o
f dea
l sta
rtD
ate
of v
alua
tion
Live
/ co
nclu
ded
? S
taff
sche
mes
Str
ateg
ic p
artn
ers
Co
mm
unity
/
char
ity s
chem
es
Tota
l Val
ueC
om
pan
y in
put
:
(C)o
nfirm
ed, s
om
e
(I)np
ut, (
N)o
feed
bac
k
Har
mo
ny G
old
01/0
3/20
0209
/03/
2010
Co
nclu
ded
R
200,
000,
000
R
200,
000,
000
I
Har
mo
ny G
old
01/0
3/20
0102
/04/
2002
Co
nclu
ded
R
119,
000,
000
R
119,
000,
000
I
Har
mo
ny G
old
01/0
6/20
1230
/12/
2014
Live
R
100,
000,
000
R
100,
000,
000
I
Har
mo
ny G
old
03/0
6/20
1330
/12/
2014
Live
R
7,70
0,00
0
R7,
700,
000
I
Har
mo
ny G
old
R1,
626,
700,
000
R
1,62
6,70
0,00
0
Har
mo
ny G
old
/Ang
lo
Plat
inum
01/0
3/20
0101
/12/
2014
Live
R
16,3
70,0
57,8
11
R16
,370
,057
,811
N
Ho
sken
Co
nso
lidat
ed
Inve
stm
ents
5no
ne
R0
N
Hyp
rop
none
R
0C
Illo
vono
ne
R0
N
Imp
ala
Plat
inum
02/0
7/20
0730
/12/
2014
Live
R11
,339
,390
,592
R11
,339
,390
,592
C
Imp
ala
Plat
inum
06/0
9/20
0430
/12/
2014
Live
R
1,44
6,12
0,00
0
R1,
446,
120,
000
C
Imp
ala
Plat
inum
05/0
6/20
0630
/12/
2014
Live
R83
0,58
9,55
5R
830,
589,
555
C
Imp
ala
Plat
inum
R1,
446,
120,
000
R12
,169
,980
,147
R13
,616
,100
,147
Imp
eria
l Ho
ldin
gs
09/1
2/20
0330
/12/
2014
Live
R1,
252,
178,
087
R1,
252,
178,
087
C
Imp
eria
l Ho
ldin
gs
01/0
3/20
0430
/12/
2014
Live
R20
0,00
0,00
0R
200,
000,
000
C
Imp
eria
l Ho
ldin
gs
R
1,45
2,17
8,08
7R
1,45
2,17
8,08
7

The Value of BEE Deals
© copyright Intellidex (Pty) Ltdwww.intellidex.co.za22
Co
mp
any
Dat
e o
f dea
l sta
rtD
ate
of v
alua
tion
Live
/ co
nclu
ded
? S
taff
sche
mes
Str
ateg
ic p
artn
ers
Co
mm
unity
/
char
ity s
chem
es
Tota
l Val
ueC
om
pan
y in
put
:
(C)o
nfirm
ed, s
om
e
(I)np
ut, (
N)o
feed
bac
k
Inve
stec
01/0
4/20
0301
/08/
2011
Co
nclu
ded
R47
3,67
0,00
0R
1,41
8,00
0,00
0
R1,
891,
670,
000
C
Invi
cta
01/0
6/20
1101
/12/
2014
Co
nclu
ded
R
0N
Invi
cta
23/0
3/20
0701
/06/
2011
Co
nclu
ded
R
0N
Invi
cta
R0
Ital
tile
07/0
6/20
0730
/12/
2014
Live
R
151,
047,
085
R68
,084
,074
R21
9,13
1,15
9C
Ital
tile
28/0
5/20
1230
/12/
2014
Live
R17
2,70
4,00
0R
172,
704,
000
C
Ital
tile
R15
1,04
7,08
5R
240,
788,
074
R39
1,83
5,15
9
JSE
2
8/06
/200
630
/12/
2014
Co
nclu
ded
R
84,1
58,4
12R
299,
104,
666
R38
3,26
3,07
8C
KA
P In
dus
tria
lno
ne
R0
C
Kum
ba
Iron
Ore
21/1
1/20
0630
/12/
2014
Live
R64
6,00
0,00
0
R5,
136,
302,
541
R5,
782,
302,
541
C
Kum
ba
Iron
Ore
21/1
1/20
0617
/11/
2011
Co
nclu
ded
R2,
723,
582,
423
R2,
723,
582,
423
C
Kum
ba
Iron
Ore
R
3,36
9,58
2,42
3
R5,
136,
302,
541
R8,
505,
884,
964
Lew
isno
ne
R0
N
Lib
erty
01/1
0/20
0430
/12/
2014
Live
R93
3,18
8,67
6R
947,
971,
612
R45
8,13
1,67
9R
2,33
9,29
1,96
7C
Life
Hea
lthca
re27
/06/
2005
30/0
6/20
10C
onc
lud
ed
R3,
147,
765,
877
R
3,14
7,76
5,87
7I
Lonm
in07
/06/
2005
11/0
5/20
10C
onc
lud
ed
R55
0,00
0,00
0
R55
0,00
0,00
0C
© copyright Intellidex (Pty) Ltdwww.intellidex.co.za23
The Value of BEE Deals
Co
mp
any
Dat
e o
f dea
l sta
rtD
ate
of v
alua
tion
Live
/ co
nclu
ded
? S
taff
sche
mes
Str
ateg
ic p
artn
ers
Co
mm
unity
/
char
ity s
chem
es
Tota
l Val
ueC
om
pan
y in
put
:
(C)o
nfirm
ed,
som
e (I)
nput
, (N
)o
feed
bac
k
Lonm
in30
/06/
2014
30/1
2/20
14Li
ve
R0
C
Lonm
in11
/05/
2010
30/0
9/20
14Li
ve
-R30
0,00
0,00
0
-R30
0,00
0,00
0C
Lonm
in
R
250,
000,
000
R
250,
000,
000
Mas
smar
t28
/06/
2005
01/1
0/20
12C
onc
lud
edR
1,35
8,32
7,56
1
R
1,35
8,32
7,56
1C
Mas
smar
t28
/06/
2005
01/1
0/20
12C
onc
lud
edR
147,
691,
094
R14
7,69
1,09
4N
Mas
smar
t
R1,
506,
018,
655
R1,
506,
018,
655
Med
iclin
ic27
/06/
2005
30/1
2/20
14Li
veR
1,38
3,34
4,00
0R
5,32
1,09
4,14
4
R6,
704,
438,
144
I
MM
I01
/07/
2005
01/0
3/20
12Li
veR
446,
410,
000
R2,
963,
110,
770
R
3,40
9,52
0,77
0C
Mo
ndi6
30/0
6/20
0430
/12/
2014
Live
R
0N
Mr
Pric
e28
/06/
2005
03/0
3/20
14Li
veR
838,
579,
000
R83
8,57
9,00
0C
MTN
24/1
1/20
1030
/06/
2014
Live
R
12,2
00,3
43,0
00
R12
,200
,343
,000
C
Mur
ray
and
Ro
ber
ts19
/12/
2005
30/1
2/20
14Li
veR
312,
289,
092
R
80,7
33,5
00R
393,
022,
593
C
Nam
pak
27/0
6/20
0530
/12/
2014
Live
R60
2,75
8,00
0R
64,6
29,0
00R
992,
105,
000
R1,
659,
492,
000
N
Nam
pak
27/0
6/20
0530
/12/
2014
Live
R15
3,26
5,00
0
R
153,
265,
000
N
Nam
pak
R
756,
023,
000
R64
,629
,000
R99
2,10
5,00
0R
1,81
2,75
7,00
0
Nas
per
s01
/12/
2006
30/1
2/20
14Li
ve
R13
,883
,609
,000
R
13,8
83,6
09,0
00C
Ned
ban
k27
/06/
2005
30/1
2/20
14C
onc
lud
edR
2,18
4,62
1,08
8R
1,74
2,50
3,15
1R
1,57
3,42
7,32
4R
5,50
0,55
1,56
3C
Net
care
27/0
6/20
0530
/12/
2014
Live
R2,
547,
365,
000
R1,
329,
060,
000
R56
0,50
0,87
3R
4,43
6,92
5,87
3I
No
rtha
m P
latin
um31
/01/
2008
18/0
7/20
11C
onc
lud
ed
R3,
921,
093,
306
R
3,92
1,09
3,30
6N
No
rtha
m P
latin
um01
/08/
2000
01/0
7/20
11C
onc
lud
ed
R2,
284,
246,
166
R
2,28
4,24
6,16
6N
The Value of BEE Deals
© copyright Intellidex (Pty) Ltdwww.intellidex.co.za24
Co
mp
any
Dat
e o
f dea
l sta
rtD
ate
of v
alua
tion
Live
/ co
nclu
ded
? S
taff
sche
mes
Str
ateg
ic p
artn
ers
Co
mm
unity
/
char
ity s
chem
es
Tota
l Val
ueC
om
pan
y in
put
:
(C)o
nfirm
ed,
som
e (I)
nput
, (N
)o
feed
bac
k
No
rtha
m P
latin
um31
/01/
2008
30/1
2/20
14C
onc
lud
ed
R1,
012,
220,
938
R
1,01
2,22
0,93
8N
No
rtha
m P
latin
um
R
7,21
7,56
0,41
0
R7,
217,
560,
410
Oce
ana
07/0
6/20
0530
/12/
2014
Live
R1,
238,
561,
764
R1,
184,
514,
627
R
2,42
3,07
6,39
1N
Old
Mut
ual7
05/0
8/20
0530
/12/
2014
Live
R3,
715,
549,
348
R1,
696,
229,
050
R96
9,27
3,74
3R
6,38
1,05
2,14
1I
Om
nia
02/0
4/20
0730
/12/
2014
Live
R54
2,40
5,71
4
R
542,
405,
714
N
Pick
n P
ayno
ne
R0
C
Pio
neer
Fo
od
s19
/01/
2012
30/1
2/20
14Li
veR
43,5
98,9
04R
1,48
1,95
0,27
5R
810,
013,
445
R2,
335,
562,
624
C
Pio
neer
Fo
od
s10
/06/
2005
30/1
2/20
14Li
veR
817,
273,
223
R81
7,27
3,22
3C
Pio
neer
Fo
od
s
R86
0,87
2,12
7R
1,48
1,95
0,27
5R
810,
013,
445
R3,
152,
835,
847
PPC
08/1
0/20
0830
/12/
2014
Live
R49
0,21
2,16
2R
490,
212,
162
N
PPC
12/0
7/20
1230
/12/
2014
Live
R91
,932
,528
R8,
839,
512
R
100,
772,
040
N
PPC
01/1
0/20
0808
/12/
2014
Co
nclu
ded
R
0N
PPC
R
91,9
32,5
28R
8,83
9,51
2R
490,
212,
162
R59
0,98
4,20
2N
RC
L
26/0
5/20
1430
/12/
2014
Live
R61
,930
,292
R85
,069
,708
R14
7,00
0,00
0C
Red
efine
Pro
per
ties
14/1
1/20
0730
/12/
2014
Live
R
729,
391,
677
R70
,116
,935
R79
9,50
8,61
3C
Rei
net
05/0
7/20
0501
/09/
2014
Live
R
534,
600,
000
R
534,
600,
000
N
Rem
gro
01/0
5/20
0330
/12/
2014
Live
R
1,70
0,00
0,00
0
R1,
700,
000,
000
I
Rem
gro
01/1
2/20
0003
/10/
2011
Co
nclu
ded
R
1,10
0,00
0,00
0
R1,
100,
000,
000
I
Rem
gro
01/1
1/20
0130
/12/
2014
Live
R
0I
Rem
gro
8
R
2,80
0,00
0,00
0
R2,
800,
000,
000
© copyright Intellidex (Pty) Ltdwww.intellidex.co.za25
The Value of BEE Deals
Co
mp
any
Dat
e o
f dea
l sta
rtD
ate
of v
alua
tion
Live
/ co
nclu
ded
? S
taff
sche
mes
Str
ateg
ic p
artn
ers
Co
mm
unity
/
char
ity s
chem
es
Tota
l Val
ueC
om
pan
y in
put
:
(C)o
nfirm
ed,
som
e (I)
nput
, (N
)o
feed
bac
k
Res
ilien
t Pr
op
erty
Fund
27/0
6/20
0630
/12/
2014
Live
R
483,
199,
286
R1,
076,
483,
514
R1,
559,
682,
800
C
Res
ilien
t Pr
op
erty
Fund
27/0
6/20
0631
/12/
2013
Co
nclu
ded
R
708,
708,
348
R
708,
708,
348
C
Res
ilien
t Pr
op
erty
Fund
R1,
191,
907,
634
R1,
076,
483,
514
R2,
268,
391,
148
Reu
nert
31/0
8/20
0630
/12/
2014
Live
R36
,420
,000
R36
,420
,000
N
RM
H12
/12/
2011
30/1
2/20
14Li
ve
R9,
878,
471,
214
R
9,87
8,47
1,21
4C
RM
I12
/12/
2011
30/1
2/20
14Li
ve
R7,
096,
450,
836
R
7,09
6,45
0,83
6C
SA C
orp
ora
te R
eal
Est
ate
none
R
0N
SAB
Mill
er01
/06/
2010
30/1
2/20
14Li
veR
3,88
2,12
2,39
1R
4,07
6,22
8,51
0R
1,74
6,95
5,07
6R
9,70
5,30
5,97
7N
Sanl
am01
/04/
2004
31/0
3/20
14C
onc
lud
ed
R7,
915,
280,
120
R6,
476,
138,
281
R14
,391
,418
,401
C
Sant
am03
/03/
2008
30/1
2/20
14Li
veR
265,
000,
000
R47
0,00
0,00
0R
254,
000,
000
R98
9,00
0,00
0C
Sap
pi L
td01
/06/
2010
30/1
2/20
14Li
veR
54,0
41,1
93R
101,
410,
890
R
155,
452,
083
C
Saso
l03
/06/
2008
30/1
2/20
14Li
veR
1,13
5,42
5,87
0R
1,46
8,99
9,98
0R
425,
784,
690
R3,
030,
210,
540
C
Saso
l01
/06/
2006
30/1
2/20
14Li
ve
R1,
453,
437,
119
R
1,45
3,43
7,11
9C
Saso
l29
/09/
2010
30/1
2/20
14Li
ve
R1,
453,
437,
119
R
1,45
3,43
7,11
9C
Saso
l01
/03/
2002
02/0
7/20
13C
onc
lud
ed
R47
1,48
9,79
6
R47
1,48
9,79
6C
Saso
l
R1,
135,
425,
870
R4,
847,
364,
014
R42
5,78
4,69
0R
6,40
8,57
4,57
4
Sho
prit
eno
ne
R0
C
The Value of BEE Deals
© copyright Intellidex (Pty) Ltdwww.intellidex.co.za26
Co
mp
any
Dat
e o
f dea
l sta
rtD
ate
of v
alua
tion
Live
/ co
nclu
ded
? S
taff
sche
mes
Str
ateg
ic p
artn
ers
Co
mm
unity
/
char
ity s
chem
es
Tota
l Val
ueC
om
pan
y in
put
:
(C)o
nfirm
ed, s
om
e
(I)np
ut, (
N)o
feed
bac
k
Sib
anye
Go
ldno
ne
R0
N
Sout
h32/
BH
P
Bill
ton
02/0
7/20
0702
/03/
2010
Co
nclu
ded
R
7,94
9,00
0,00
0
R7,
949,
000,
000
N
Sout
h32/
BH
P
Bill
ton
12/1
2/20
1101
/12/
2014
Live
R
1,72
4,78
5,16
4
R1,
724,
785,
164
N
Sout
h32/
BH
P
Bill
ton
01/1
2/20
1101
/12/
2014
Live
R26
1,26
5,75
2R
1,04
5,06
3,00
7
R1,
306,
328,
759
N
Sout
h32/
BH
P
Bill
ton
19/0
7/20
0701
/02/
2010
Co
nclu
ded
R
1,07
4,57
8,99
0
R1,
074,
578,
990
N
Sout
h32/
BH
P B
illto
n
R26
1,26
5,75
2R
11,7
93,4
27,1
61
R12
,054
,692
,912
Stan
dar
d B
ank
04/1
0/20
0430
/12/
2014
Co
nclu
ded
R4,
367,
282,
471
R4,
358,
745,
827
R2,
179,
372,
859
R10
,905
,401
,157
C
Stei
nho
ff In
tern
atio
nal
02/1
2/20
0830
/12/
2014
Live
R1,
559,
000,
000
R1,
559,
000,
000
C
Sun
Inte
rnat
iona
l01
/03/
2005
30/1
2/20
14Li
ve
R34
4,17
6,93
5
R34
4,17
6,93
5N
Sup
er G
roup
03/1
0/20
1230
/06/
2014
Live
R75
,720
,133
R46
8,61
9,00
0
R54
4,33
9,13
3I
Telk
om
none
R
0N
The
Fosc
hini
Gro
upno
ne
R0
C
The
Spar
Gro
up12
/08/
2009
30/1
2/20
14Li
veR
1,86
3,72
0,57
1
R
1,86
3,72
0,57
1N
Tig
er B
rand
s20
/10/
2009
30/1
2/20
14Li
veR
824,
058,
642
R36
4,98
0,16
3R
2,06
5,59
6,23
3R
3,25
4,63
5,03
8C
Tig
er B
rand
s07
/06/
2005
30/1
2/20
14Li
veR
1,47
7,91
8,99
3
R45
2,53
2,16
2R
1,93
0,45
1,15
5C
Tig
er B
rand
s
R2,
301,
977,
635
R36
4,98
0,16
3R
2,51
8,12
8,39
5R
5,18
5,08
6,19
3
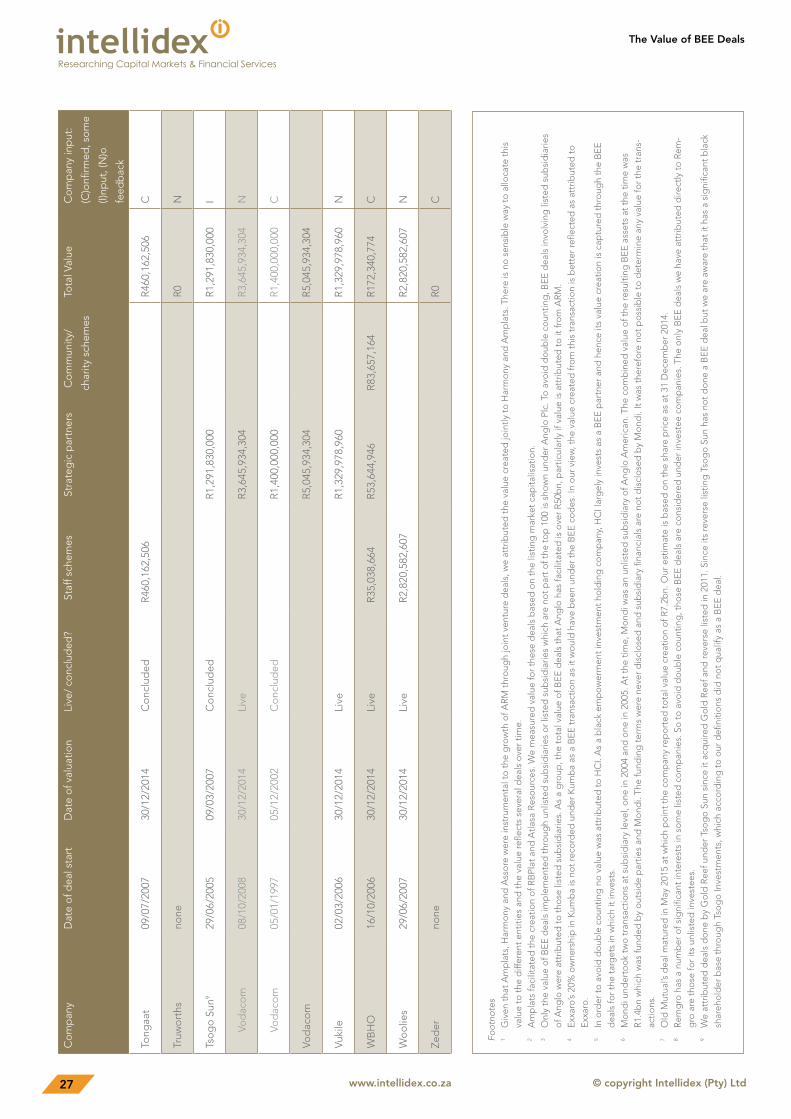
© copyright Intellidex (Pty) Ltdwww.intellidex.co.za27
The Value of BEE Deals
Foot
note
s
1
Giv
en t
hat
Am
pla
ts, H
arm
ony
and
Ass
ore
wer
e in
stru
men
tal t
o t
he g
row
th o
f AR
M t
hro
ugh
join
t ve
ntur
e d
eals
, we
attr
ibut
ed t
he v
alue
cre
ated
join
tly t
o H
arm
ony
and
Am
pla
ts. T
here
is n
o s
ensi
ble
way
to
allo
cate
thi
s va
lue
to t
he d
iffer
ent
entit
ies
and
the
val
ue re
flect
s se
vera
l dea
ls o
ver
time.
2 A
mp
lats
faci
litat
ed t
he c
reat
ion
of R
BPl
at a
nd A
tlasa
Res
our
ces.
We
mea
sure
d v
alue
for
thes
e d
eals
bas
ed o
n th
e lis
ting
mar
ket
cap
italis
atio
n.3
Onl
y th
e va
lue
of B
EE
dea
ls im
ple
men
ted
thr
oug
h un
liste
d s
ubsi
dia
ries
or
liste
d s
ubsi
dia
ries
whi
ch a
re n
ot
par
t o
f the
to
p 1
00 is
sho
wn
und
er A
nglo
Plc
. To
avo
id d
oub
le c
oun
ting
, BE
E d
eals
invo
lvin
g li
sted
sub
sid
iarie
s o
f Ang
lo w
ere
attr
ibut
ed t
o t
hose
list
ed s
ubsi
dia
ries.
As
a g
roup
, the
to
tal v
alue
of B
EE
dea
ls t
hat
Ang
lo h
as fa
cilit
ated
is o
ver
R50
bn,
par
ticul
arly
if v
alue
is a
ttrib
uted
to
it fr
om
AR
M.
4 E
xxar
o’s
20%
ow
ners
hip
in K
umb
a is
no
t re
cord
ed u
nder
Kum
ba
as a
BE
E t
rans
actio
n as
it w
oul
d h
ave
bee
n un
der
the
BE
E c
od
es. I
n o
ur v
iew
, the
val
ue c
reat
ed fr
om
thi
s tr
ansa
ctio
n is
bet
ter
refle
cted
as
attr
ibut
ed t
o
Exx
aro
.5
In o
rder
to
avo
id d
oub
le c
oun
ting
no
val
ue w
as a
ttrib
uted
to
HC
I. A
s a
bla
ck e
mp
ow
erm
ent
inve
stm
ent
hold
ing
co
mp
any,
HC
I lar
gel
y in
vest
s as
a B
EE
par
tner
and
hen
ce it
s va
lue
crea
tion
is c
aptu
red
thr
oug
h th
e B
EE
d
eals
for
the
targ
ets
in w
hich
it in
vest
s.6
Mo
ndi u
nder
too
k tw
o t
rans
actio
ns a
t su
bsi
dia
ry le
vel,
one
in 2
004
and
one
in 2
005.
At
the
time,
Mo
ndi w
as a
n un
liste
d s
ubsi
dia
ry o
f Ang
lo A
mer
ican
. The
co
mb
ined
val
ue o
f the
resu
lting
BE
E a
sset
s at
the
tim
e w
as
R1.
4bn
whi
ch w
as fu
nded
by
out
sid
e p
artie
s an
d M
ond
i. Th
e fu
ndin
g t
erm
s w
ere
neve
r d
iscl
ose
d a
nd s
ubsi
dia
ry fi
nanc
ials
are
no
t d
iscl
ose
d b
y M
ond
i. It
was
the
refo
re n
ot
po
ssib
le t
o d
eter
min
e an
y va
lue
for
the
tran
s-ac
tions
.7
Old
Mut
ual’s
dea
l mat
ured
in M
ay 2
015
at w
hich
po
int
the
com
pan
y re
po
rted
to
tal v
alue
cre
atio
n o
f R7.
2bn.
Our
est
imat
e is
bas
ed o
n th
e sh
are
pric
e as
at
31 D
ecem
ber
201
4.8
Rem
gro
has
a n
umb
er o
f sig
nific
ant
inte
rest
s in
so
me
liste
d c
om
pan
ies.
So
to
avo
id d
oub
le c
oun
ting
, tho
se B
EE
dea
ls a
re c
ons
ider
ed u
nder
inve
stee
co
mp
anie
s. T
he o
nly
BE
E d
eals
we
have
att
ribut
ed d
irect
ly t
o R
em-
gro
are
tho
se fo
r its
unl
iste
d in
vest
ees.
9 W
e at
trib
uted
dea
ls d
one
by
Go
ld R
eef u
nder
Tso
go
Sun
sin
ce it
acq
uire
d G
old
Ree
f and
reve
rse
liste
d in
201
1. S
ince
its
reve
rse
listin
g T
sog
o S
un h
as n
ot
do
ne a
BE
E d
eal b
ut w
e ar
e aw
are
that
it h
as a
sig
nific
ant
bla
ck
shar
eho
lder
bas
e th
roug
h Ts
og
o In
vest
men
ts, w
hich
acc
ord
ing
to
our
defi
nitio
ns d
id n
ot
qua
lify
as a
BE
E d
eal.
Co
mp
any
Dat
e o
f dea
l sta
rtD
ate
of v
alua
tion
Live
/ co
nclu
ded
? S
taff
sche
mes
Str
ateg
ic p
artn
ers
Co
mm
unity
/
char
ity s
chem
es
Tota
l Val
ueC
om
pan
y in
put
:
(C)o
nfirm
ed, s
om
e
(I)np
ut, (
N)o
feed
bac
k
Tong
aat
09/0
7/20
0730
/12/
2014
Co
nclu
ded
R46
0,16
2,50
6
R
460,
162,
506
C
Truw
ort
hsno
ne
R0
N
Tso
go
Sun
929
/06/
2005
09/0
3/20
07C
onc
lud
ed
R1,
291,
830,
000
R
1,29
1,83
0,00
0I
Vod
aco
m08
/10/
2008
30/1
2/20
14Li
ve
R3,
645,
934,
304
R
3,64
5,93
4,30
4N
Vod
aco
m05
/01/
1997
05/1
2/20
02C
onc
lud
ed
R1,
400,
000,
000
R
1,40
0,00
0,00
0C
Vod
aco
m
R
5,04
5,93
4,30
4
R5,
045,
934,
304
Vuki
le02
/03/
2006
30/1
2/20
14Li
ve
R1,
329,
978,
960
R
1,32
9,97
8,96
0N
WB
HO
16/1
0/20
0630
/12/
2014
Live
R35
,038
,664
R53
,644
,946
R83
,657
,164
R17
2,34
0,77
4C
Wo
olie
s29
/06/
2007
30/1
2/20
14Li
veR
2,82
0,58
2,60
7
R
2,82
0,58
2,60
7N
Zed
erno
ne
R0
C
The Value of BEE Deals
© copyright Intellidex (Pty) Ltdwww.intellidex.co.za28
NOTES ON THE RESEARCH METHODS AND DEFINITIONS
1. Top 100 companies. The companies in the study were determined by, firstly, taking the 100 companies with the highest weighting in the JSE’s Swix Index as at 31 December 2014. That list was then reviewed to remove companies with no substantial South African operations, including Richemont, British American Tobacco and several property companies with secondary listings on the JSE but no operations in SA. That left us with the 100 companies which we list in this report, which to our minds reflect the 100 largest JSE-listed companies ranked according to holdings by South African shareholders, with non-South African companies removed.
2. Net asset value. Our ambition in determining NAV was to calculate the value that had either accrued to beneficiaries through dividends or distributions made on the maturity of schemes, and/or the implied net value of the schemes as at 31 December 2014 if they had not matured. For the most part, calculating the value of matured schemes was relatively straightforward, while complications arose in the calculation of the value of live schemes, particularly with regard to the financial obligations that may be attached to such schemes. The assumptions made in order to do so are discussed below.
3. Taxation. Our ambition was to calculate value attributable to beneficiaries gross of any tax liability that may be due by the beneficiary. In other words, our aim was to determine value at the moment it becomes attributable to the beneficiary, rather than after any tax had been deducted. However, any taxes that are properly attributable to the scheme itself or the company involved, were netted off in the normal course of estimating the value of the scheme. It follows that the calculations in this report represent value attributable to beneficiaries gross of any actual or potential tax payable by them, but net of any tax that may have been paid by the scheme or company.
4. BEE deals. A BEE deal is one where the beneficiaries are black, as defined in the Broad-Based Black Economic Empowerment Act, and where the deal has been enabled by the company concerned. The company itself must have been a facilitator of the deal either through vendor financing or guarantees. We excluded deals where the company played no part in facilitating the deal, such as when empowerment investors bought into a company on an arm’s-length
8. METHODOLOGY, DEFINITIONS AND ASSUMPTIONS
The aim of this exercise was to calculate the total net asset value created from black economic empowerment (BEE) deals undertaken by the 100 largest companies on the JSE up to and including 31 December 2014.
The following process was used in doing so.
1. Beginning in January 2015, Intellidex analysed all publicly available information and developed estimates of the value created through companies’ BEE deals. This relied substantially on announcements made on the Stock Exchange News Service, circulars to shareholders and annual reports. This provided various levels of detail though in most cases Intellidex had to make some assumptions in order to estimate value creation, generally regarding the cost of finance that was embedded in deals. While we aimed to capture each and every deal undertaken by the eligible companies, it is always possible that we missed some in our research process.
2. Intellidex’s initial estimates were sent to the JSE companies concerned with a request to review the estimates and to provide missing information to improve the assumptions our estimates relied on.
3. Most companies replied with comments on our estimates, either confirming them as accurate or providing corrections and additional information to improve them. Some companies provided full information while others cited confidentiality regarding specific pieces of information. In some cases, companies provided us with information to help determine our estimates provided we kept the specific information confidential. Other companies did not respond despite repeated efforts to solicit responses. Where we had no response and/or companies would not provide some necessary pieces of information, we relied on our estimates. The table of the 100 companies indicates which companies fell into which category.
4. Intellidex’s analysts reviewed all the information sent in by companies to ensure consistency in the way calculations were determined.
© copyright Intellidex (Pty) Ltdwww.intellidex.co.za29
The Value of BEE Deals
basis. One somewhat odd outcome of this approach is that companies that are themselves BEE companies in that they are already majority black-owned, often have not undertaken any BEE deals. However, such companies may have played a part in the BEE deals of other JSE-listed companies. One example is HCI, which does not count as having undertaken any BEE deal but is majority black-owned, though it has been counted as part of other deals that other companies have facilitated.
5. Subsidiaries and double counting. A holding company can often facilitate deals in its listed subsidiaries generating value that can be attributed both to the holding company and the subsidiaries. In order to remove double counting, we attributed value first to the subsidiary, attributing only the remaining value to the holding company. Examples where this was important include Anglo American and subsidiaries Kumba Iron Ore and Anglo American Platinum.
6. Unlisted assets. A number of companies conducted deals at the level of subsidiaries which are not listed. In such cases we had to estimate the value of the unlisted assets. This was typically the case in the mining sector where deals tend to be at the level of the operating mine. In doing so we used Ebitda multiples to determine a value and/or a competent persons report on the value of mineral assets.
7. Financing obligations. Given our ambition to determine net value, we had to determine a value for liabilities attached to deals, particularly the funding. Funding in BEE deals is typically of two sorts: actual debt injected into a vehicle for the BEE deal through loans and/or preference share funding, or notional funding where no debt is injected into the vehicle but a notional funding obligation is accumulated during the life time of the deal and settled at the end. In addition, in some cases, the beneficiaries injected equity of their own, which we deducted. In deals that had matured, the deduction of liabilities was usually straightforward. In live deals, it was considerably more complicated. Where the terms of preference share funding/debt were disclosed, we calculated the cost of funding up to 31 December 2014 and the outstanding liability, and deducted this from the asset value. In the case of notional schemes, where the escalation factors and details of the treatment of dividend flows were disclosed, we applied that information to calculate the size of the notional financing obligation as at 30 December 2014, and deducted this from the value of the assets at that date. In cases where the escalation
factors and/or treatment of dividend flows were not available, we assumed that the notional funding cost was 85% of the prime rate (which was the rate used by most schemes that did disclose) and we assumed that 100% of dividends were offset against this funding obligation. We are aware that in most schemes some small proportion of dividends are paid out to beneficiaries, but often this proportion was not available. The impact of such payouts is not particularly material given that our approach still attributes any such value to the beneficiaries’ balance sheet, though the compounding effect will lead to increasing mismatch between our estimated notional obligations and actual obligations over time.
8. Effective date. For matured schemes the effective date was that at which all outstanding conditions related to the deal expired. Usually this is the date that the final value fully accrues to the beneficiaries and is no longer encumbered by any lock-ins or other restrictions. An important consequence of this approach is that we did not include any value created post the maturation of schemes. So if a scheme matured but beneficiaries remained invested in the scheme and gained substantial further value, this did not count towards the value created through the deal itself. In our view after the deal matures, the value creation is no longer being facilitated by the company, but by the investment decisions of the beneficiary. For all deals that were still live as at the end of 2014, the effective date of the calculation was usually 31 December 2014. There were some exceptions where the availability of audited accounts made it more appropriate to use a date different to 30 December 2014, but always within a few months of that date. Such cases are listed on the table of firms.
9. Types of beneficiaries. The distinction between three “types” of beneficiaries has become clearer in more recent deals, which generally split beneficiaries between staff, strategic investment partners, and community schemes. In some cases the difference between types was not clear cut, such as when a strategic partner has a large broad-based community trust as beneficiaries. In general, though, the following was used to separate assets according to types of beneficiary:
9.1 Staff schemes. These were usually employee share ownership schemes in which black employees are beneficiaries and receive shares and dividends and have voting rights attached to the shares. Where ESOPs were general schemes with all staff
The Value of BEE Deals
© copyright Intellidex (Pty) Ltdwww.intellidex.co.za30
participating, we took the proportion of staff who are black and used that to allocate a portion of NAV accordingly. Only ESOPs that were explicitly part of empowerment scheme were considered, leaving out general share option schemes that may be used in the companies.
9.2 Strategic partners. In general, these are black-owned investment companies and/or prominent black individuals. These are not necessarily narrowly based as various strategic investors have large beneficiary bases, including non-profit trusts, in their shareholding base. Usually such investors are required to provide some form of business assistance with participation tied to performance targets. Often partners take board positions in the investee companies. The type of investor is expected to actively support the strategies of the business.
9.3 Community partners. These types of investors are generally trusts and/or other forms of non-profit entity and tend to be the most broad-based type of beneficiary. The beneficiaries are either defined as a type, with various ways beneficiaries access benefits such as scholarships or other types of support, or specifically named beneficiaries who receive benefits. Their interests are represented by trustees of the trusts that hold the assets. Trusts may be evergreen, in that they will continue to hold assets and distribute benefits forever onward, however the effective date of valuation for our purposes is the date of maturation of the scheme and encumbrance of the assets in the hands of the trust. We also included schemes that involved customers and members of the public within the community partner type.
10. Start date. We took the effective start date of the schemes to be that announced by the companies concerned. Usually this date represented the date the shares in the company are issued.
11. Options and other derivatives. We recognise that the optionality in some schemes has value, but we decided not to try and include this value in any of our calculations. Value arises because live schemes effectively include some downside protection in that beneficiaries are protected from any loss. This protection is a form of insurance that can legitimately be seen as having a premium value. However, because our objective was to determine the present value as at 31 December for live schemes, we are effectively assessing schemes “as if” they had matured on that date. It therefore makes sense to exclude the option values as we are assuming that as at that point there was no option. In some cases, option premiums were embedded in the values and there was no way for us to remove these, though in our view none of these cases had a material value.

© copyright Intellidex (Pty) Ltdwww.intellidex.co.za31
The Value of BEE Deals

The Value of BEE Deals
© copyright Intellidex (Pty) Ltdwww.intellidex.co.za32
Intellidex (Pty) Ltd1st Floor, Building 3, Inanda Greens Office Park54 Weirda Road WestSandton2194Tel: +27 (0)10 072 0472Email: [email protected]