Embed Size (px)
Citation preview
J. Energy Power Sources
Vol.1, No.5, 2014, pp. 242-249
Received: September1, 2014, Published: November30, 2014
Journal of Energy
and Power Sources
www.ethanpublishing.com
The Value of Battery Diagnostics and Prognostics
Matthieu Dubarry, Arnaud Devie and Bor Yann Liaw
Hawaii Natural Energy Institute, University of Hawaii at Mānoa, Honolulu, HI 96822, USA
Corresponding author: Matthieu Dubarry ([email protected])
Abstract: Battery diagnostics and prognostics techniques are often being underused and their value undermined because of the lack of
adequate communication tools to transfer the understanding between the material scientists, who understand the inner working of the
battery, and the engineers, who need to ensure proper battery usage. Even with the complex postmortem analyses, it is often very
difficult to correlate what happened during practical use with laboratory testing, especially in a quantitative manner with temporal
resolution. Here we explain a simple yet practical diagnostic and prognostic technique that could transfer such knowledge
quantitatively with temporal variations to enable battery diagnostics and prognostics for better BMS design.
Keywords: Battery diagnostics and prognostics, dQ/dV, SOC estimation, SOH estimation, mechanistic model, degradation
mechanisms.
1. Introduction
In the last two decades batteries have become an
important part of our lifestyle, from portable
electronics, electrified vehicles, to recent integration of
renewable energy into the electric grid. The art of
battery design and performance engineering follows a
conventional wisdom of “design, build, and test”
paradigm to deliver products that could meet the design
goals and specifications for a specific use. To warrant
such performance specifications and to ensure safety
and reliability, BMS (Battery Management Systems)
are developed and implemented in battery systems to
monitor and control the battery performance.
Unfortunately, engineers who design BMS usually
have little understanding of the electrochemical
processes involved in the batteries. It is particularly
true for Li-ion batteries that operate with more
complicated chemistries than Ni-MH or lead-acid
batteries and thus require much more sophisticated
controls. As a result, engineers tend to implement
black-box models (derived from empirical correlations)
in the BMS for both SOC and SOH tracking. Although
empirical models work well within the initial use of a
battery, they tend to fail when they are needed the
most, on aged cells. To mitigate this problem, a new
strategy needs to be developed to overcome the issues
raised from empirical models and approaches. The
great disconnect between real life situations and
laboratory testing needs to be addressed. We believe a
more mechanistic approach using basic principles
would be a better solution.
Here we present at tool to translate laboratory testing
observations quantitatively to engineers to facilitate
diagnostics, control and management of battery system
in the field. The intent is to establish a quantitative,
coherent and consistent understanding of battery
degradation in a time-resolved, quantifiable manner. We
believe this approach shall positively impact the
next-generation BMS design for emerging applications.
Battery degradation is influenced by many factors,
either at the single cell level or at the assembly level,
and their effects are often inter-related. As the system is
being scaled up from single cells to modules and packs,
the number of stress factors increase and their coupling
intensifies. It is thus critical to resolve them as much as
possible beforehand.
The Value of Battery Diagnostics and Prognostics
243
Here we outlined some comments regarding these
factors to help deciphering and distinguishing them in
the approach:
At the single cell level, degradation factors have
thermodynamics and kinetics origins. The variations of
these properties are affected by the environment (e.g.,
temperature or pressure) and duty cycle (e.g., voltage,
rate) [1-4].
At the assembly level: Additional factors need to be
considered with a large number of cells in a topological
arrangement. For instance, cell quality and its
variability, presence of an internal temperature
gradient or heat distribution, imbalance among the cells
are all critical considerations in BMS. Other factors
include contact resistance variation with time and other
conditions due to vibration or corrosion. Although not
a topic in this work, these assembly level factors play a
critical role in a battery system’s reliability. Interested
readers should refer to Refs. [5-6] regarding the
impacts on battery performance from cell variability.
The imbalance issue and quantifying the effect on
performance of a battery assembly is currently under
investigation in our laboratory [7-8]. A study on how to
properly define and estimate SOC from a cell to a
battery pack has recently been published [7].
One of the most critical aspects in applying practical
diagnostics and prognostics tools is the ability to
categorize and quantify contributions from different
attributes of the degradation processes. Fig. 1 presents
a schematic of all major degradation mechanisms that
could occur in a typical Li-ion cell [1]. These
mechanisms have been reported in the literature by
various authors [1-3]. However, most of the
observations are obtained from post-mortem physical
measurements or characterization techniques that are
cost prohibitive to implement or just inadequate for
online diagnostics and prognostics.
Readily available electrical measurements thus
remain the most cost effective method to monitor the
battery condition. Analyzing the voltage, current, and
temperature of the battery is feasible within the BMS.
Online diagnostics and prognostics will then be
possible if the degradation mechanism can be
deciphered from those measurements.
Fig. 1 Schematic of possible degradation processes in a Li-ion battery. Adapted with permission from [1].
The Value of Battery Diagnostics and Prognostics
244
In our previous studies we have shown that it is
indeed possible and that the degradation mechanisms
presented in Fig. 1 can be classified according to their
effects on the electrochemical behavior of the cell [4,
9]. Every degradation mechanisms could belong to at
least one of three categories of attributes to
degradation: i.e., (1) LAM (Loss of Active Materials),
(2) LLI (Loss of Lithium Inventory), and (3) change in
reaction kinetics as often indicated by a rising cell
impedance (Fig. 1). Using such simple classification,
we were able to translate qualitative degradation
phenomena into quantifiable contributions from the
three categories of degradation.
Two methods are instrumental in achieving
quantification. One is tracking the SOC of the cell
using the OCV (Open Circuit Voltage) measurements
[10]. The other is tracking the SOH using the
incremental capacity (dQ/dV) analysis [4-5]. To
facilitate dQ/dV analysis, we developed a model to
emulate degradation losses based on the attributes [4].
Such a capability enables handling of the
aging-pathway dependence with great flexibility.
In this work, we would like to describe in details
how to perform a successful incremental capacity
analysis, both experimentally and using our
mechanistic model. We are hoping that engineers and
material scientist will both embrace this framework to
better communicate their observations on a common
ground. This will, we believe, increase the value of
battery diagnostics and prognostics.
2. Approach Description
2.1 Identifying the Factors to Cell Degradation
The essence of classifying three attributes of
degradation is to identify and quantify single cell level
factors and their variations in aging. A typical
discharge curve spells the variations of voltage (which
indicates what reaction is taking place) as a function
of displaced charge (i.e., capacity, which depicts the
extent of the reaction). Since a battery is a chemical
system, the state of the battery is only defined when all
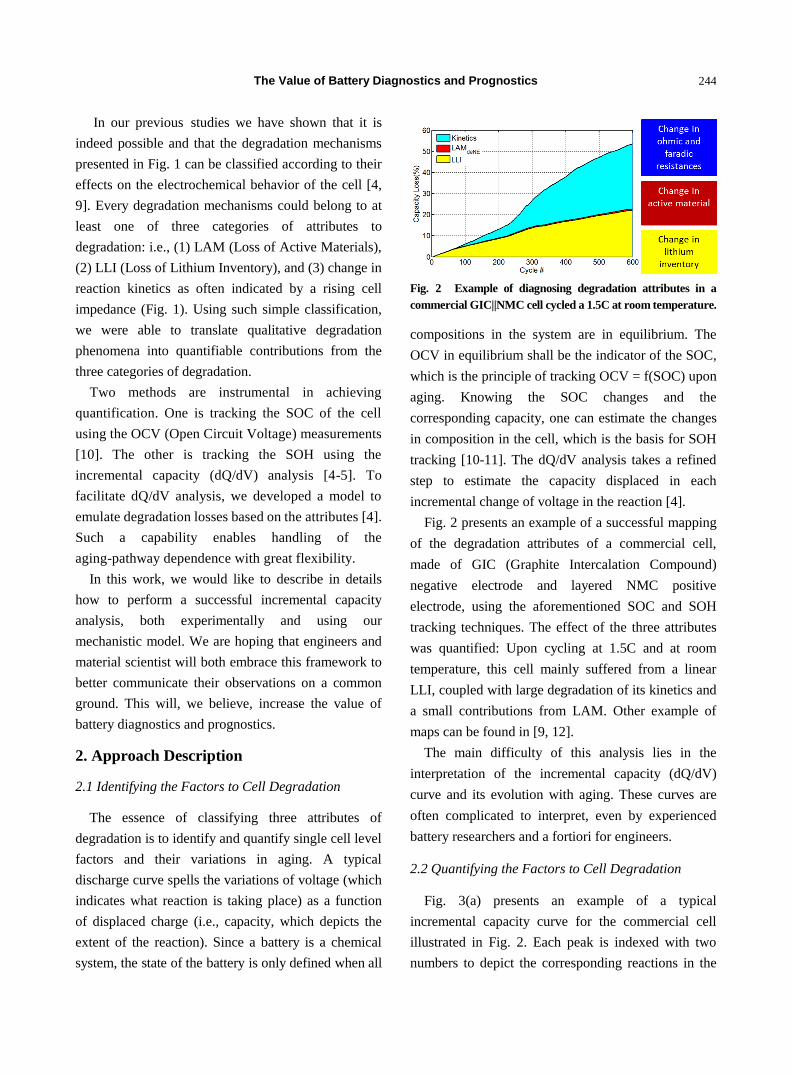
Fig. 2 Example of diagnosing degradation attributes in a
commercial GIC||NMC cell cycled a 1.5C at room temperature.
compositions in the system are in equilibrium. The
OCV in equilibrium shall be the indicator of the SOC,
which is the principle of tracking OCV = f(SOC) upon
aging. Knowing the SOC changes and the
corresponding capacity, one can estimate the changes
in composition in the cell, which is the basis for SOH
tracking [10-11]. The dQ/dV analysis takes a refined
step to estimate the capacity displaced in each
incremental change of voltage in the reaction [4].
Fig. 2 presents an example of a successful mapping
of the degradation attributes of a commercial cell,
made of GIC (Graphite Intercalation Compound)
negative electrode and layered NMC positive
electrode, using the aforementioned SOC and SOH
tracking techniques. The effect of the three attributes
was quantified: Upon cycling at 1.5C and at room
temperature, this cell mainly suffered from a linear
LLI, coupled with large degradation of its kinetics and
a small contributions from LAM. Other example of
maps can be found in [9, 12].
The main difficulty of this analysis lies in the
interpretation of the incremental capacity (dQ/dV)
curve and its evolution with aging. These curves are
often complicated to interpret, even by experienced
battery researchers and a fortiori for engineers.
2.2 Quantifying the Factors to Cell Degradation
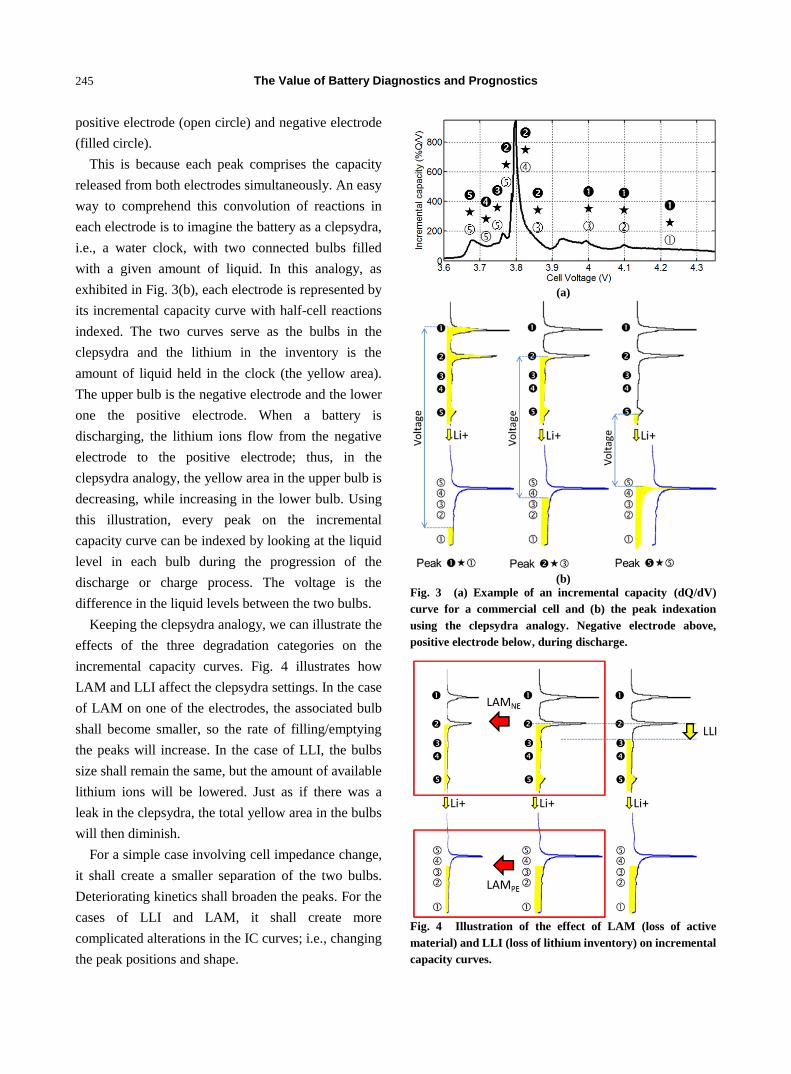
Fig. 3(a) presents an example of a typical
incremental capacity curve for the commercial cell
illustrated in Fig. 2. Each peak is indexed with two
numbers to depict the corresponding reactions in the
The Value of Battery Diagnostics and Prognostics
245
positive electrode (open circle) and negative electrode
(filled circle).
This is because each peak comprises the capacity
released from both electrodes simultaneously. An easy
way to comprehend this convolution of reactions in
each electrode is to imagine the battery as a clepsydra,
i.e., a water clock, with two connected bulbs filled
with a given amount of liquid. In this analogy, as
exhibited in Fig. 3(b), each electrode is represented by
its incremental capacity curve with half-cell reactions
indexed. The two curves serve as the bulbs in the
clepsydra and the lithium in the inventory is the
amount of liquid held in the clock (the yellow area).
The upper bulb is the negative electrode and the lower
one the positive electrode. When a battery is
discharging, the lithium ions flow from the negative
electrode to the positive electrode; thus, in the
clepsydra analogy, the yellow area in the upper bulb is
decreasing, while increasing in the lower bulb. Using
this illustration, every peak on the incremental
capacity curve can be indexed by looking at the liquid
level in each bulb during the progression of the
discharge or charge process. The voltage is the
difference in the liquid levels between the two bulbs.
Keeping the clepsydra analogy, we can illustrate the
effects of the three degradation categories on the
incremental capacity curves. Fig. 4 illustrates how
LAM and LLI affect the clepsydra settings. In the case
of LAM on one of the electrodes, the associated bulb
shall become smaller, so the rate of filling/emptying
the peaks will increase. In the case of LLI, the bulbs
size shall remain the same, but the amount of available
lithium ions will be lowered. Just as if there was a
leak in the clepsydra, the total yellow area in the bulbs
will then diminish.
For a simple case involving cell impedance change,
it shall create a smaller separation of the two bulbs.
Deteriorating kinetics shall broaden the peaks. For the
cases of LLI and LAM, it shall create more
complicated alterations in the IC curves; i.e., changing
the peak positions and shape.
(a)
(b)
Fig. 3 (a) Example of an incremental capacity (dQ/dV)
curve for a commercial cell and (b) the peak indexation
using the clepsydra analogy. Negative electrode above,
positive electrode below, during discharge.
Fig. 4 Illustration of the effect of LAM (loss of active
material) and LLI (loss of lithium inventory) on incremental
capacity curves.

The Value of Battery Diagnostics and Prognostics
246
Using this exercise, one can associate changes in
the incremental capacity signature to one of the
degradation categories without in-depth understanding
of the underlying electrochemical reactions. However,
this graphical method suffers some limitation;
although qualitative and quantitative information are
decipherable it might be extremely time consuming. It
also lacks the ability to define protocols to fully
analyze the data in a systematic manner. Well aware
of these limitations, we went on to develop a
mechanistic model that eases the analysis by
emulating the cell response under different
hypothetical conditions. In other words, it allows
playing with the clepsydra bulbs size and content and
deriving the changes in voltage response and capacity
retention. Named ‘alawa, the Hawaiian word for “to
diagnose”, this toolbox offers unprecedented
diagnostics and prognostics abilities using a simple
graphical user interface [4] which could be used by
solid state materials scientists and engineers alike.
Being able to diagnose the possible mechanisms
involved in degradation, we hope that the
communication among the researchers and engineers
prevails to improve the cell performance, reliability
and safety.
2.3 Cell Emulation
The emulation process must start with the
replication of the tested cell architecture (Fig. 5(a)) in
the ‘alawa toolbox, i.e., building the initial clepsydra.
This can be done by using half-cell data of both the
negative and the positive electrode. This data can be
gathered by harvesting electrodes of a similar cell or
by using data of similar chemistry from a database.
Once the individual electrodes’ responses are selected,
a matching procedure is necessary.
The matching of the electrodes depends on 2
parameters: The initial loading ratio and offset. The
LR (Loading Ratio) corresponds to the capacity ratio
between the two electrodes, i.e., the size of the bulbs
relative to each other. The OFS (Offset) correspond
to the shift between the electrodes induced during the
(a)
(b)
Fig. 5 (a) Cell architecture emulated in the ‘alawa toolbox
and (b) comparison of the IC curves of the experimental and
emulated cells.
formation of the cell (initial SEI growth and/or
irreversible material loss during the first few cycles),
i.e., the quantity of liquid spilled out when filling the
clepsydra.
Once the cell is successfully emulated, the voltage
signature of the tested and of the emulated cells
should overlap perfectly. The comparison of the IC
signatures for our example cell is presented in Fig.
5(b). On this figure it can be seen that the emulation
successfully replicated the experimental cell voltage
response. On this cell, there are 4 regions, labeled A to
D, that are especially important to emulate properly. A
(i.e., ❺*⑤) is mainly influenced by the last reaction
on the negative electrode and provides indication of
the limiting electrode at the end of discharge. B (i.e.,
❷*④) reflects the main phase transformation on the
positive electrode. C position is set by the stage ❷ to
stage ❶ graphite transition and is an excellent tracker
The Value of Battery Diagnostics and Prognostics
247
of the electrodes matching. D (i.e., ❶*①) is principally
influenced by a solid solution on the positive electrode
and gives direct information on the quantity of
positive electrode material. Further details on the
procedure to perform the initial emulation of
commercial cells can be found in [5, 13-14].
The second step is the degradation emulation. As
explained before, the full cell response can be
calculated from the individual electrodes and 2
parameters, LR and OFS. Assuming the chemistry of
the electrodes is not changing, any degradation can
then be described by a change on the LRini and
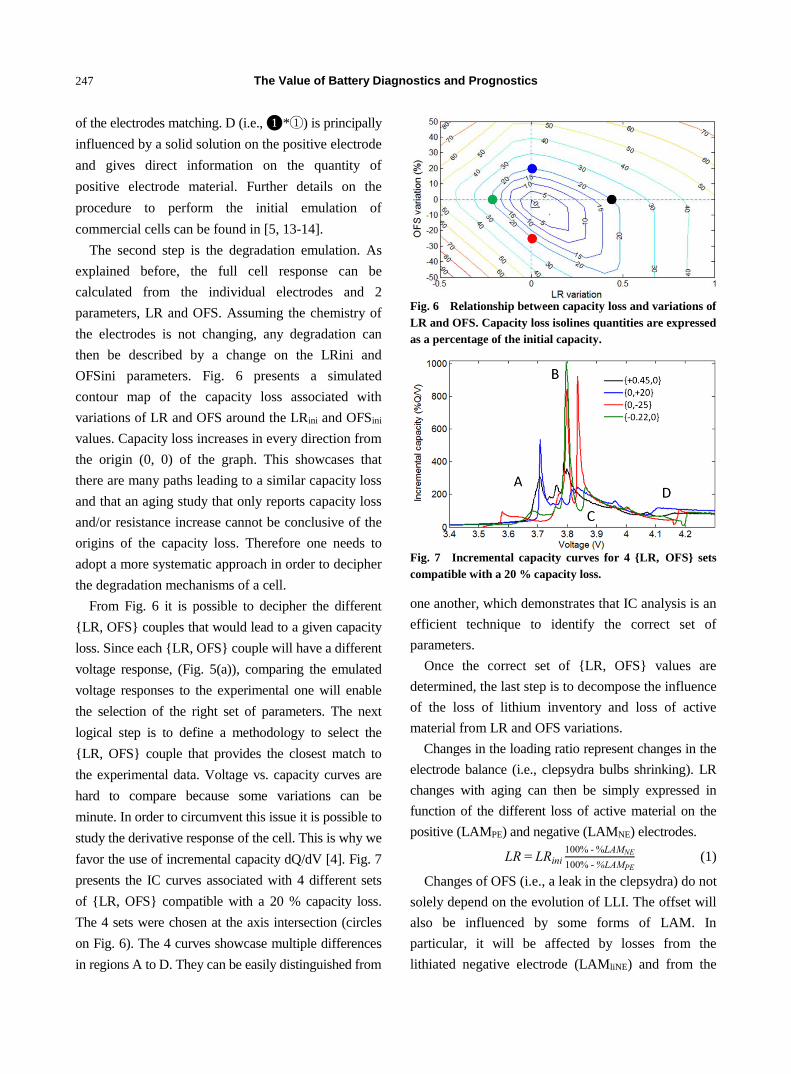
OFSini parameters. Fig. 6 presents a simulated
contour map of the capacity loss associated with
variations of LR and OFS around the LRini and OFSini
values. Capacity loss increases in every direction from
the origin (0, 0) of the graph. This showcases that
there are many paths leading to a similar capacity loss
and that an aging study that only reports capacity loss
and/or resistance increase cannot be conclusive of the
origins of the capacity loss. Therefore one needs to
adopt a more systematic approach in order to decipher
the degradation mechanisms of a cell.
From Fig. 6 it is possible to decipher the different
{LR, OFS} couples that would lead to a given capacity
loss. Since each {LR, OFS} couple will have a different
voltage response, (Fig. 5(a)), comparing the emulated
voltage responses to the experimental one will enable
the selection of the right set of parameters. The next
logical step is to define a methodology to select the
{LR, OFS} couple that provides the closest match to
the experimental data. Voltage vs. capacity curves are
hard to compare because some variations can be
minute. In order to circumvent this issue it is possible to
study the derivative response of the cell. This is why we
favor the use of incremental capacity dQ/dV [4]. Fig. 7
presents the IC curves associated with 4 different sets
of {LR, OFS} compatible with a 20 % capacity loss.
The 4 sets were chosen at the axis intersection (circles
on Fig. 6). The 4 curves showcase multiple differences
in regions A to D. They can be easily distinguished from
Fig. 6 Relationship between capacity loss and variations of
LR and OFS. Capacity loss isolines quantities are expressed
as a percentage of the initial capacity.
Fig. 7 Incremental capacity curves for 4 {LR, OFS} sets
compatible with a 20 % capacity loss.
one another, which demonstrates that IC analysis is an
efficient technique to identify the correct set of
parameters.
Once the correct set of {LR, OFS} values are
determined, the last step is to decompose the influence
of the loss of lithium inventory and loss of active
material from LR and OFS variations.
Changes in the loading ratio represent changes in the
electrode balance (i.e., clepsydra bulbs shrinking). LR
changes with aging can then be simply expressed in
function of the different loss of active material on the
positive (LAMPE) and negative (LAMNE) electrodes.
LR = LRini100% - %LAMNE
100% - %LAMPE
(1)
Changes of OFS (i.e., a leak in the clepsydra) do not
solely depend on the evolution of LLI. The offset will
also be influenced by some forms of LAM. In
particular, it will be affected by losses from the
lithiated negative electrode (LAMliNE) and from the

The Value of Battery Diagnostics and Prognostics
248
delithiated positive electrode (LAMdePE). More
explanation on this effect, induced by the geometry of
the system, can be found in [4]. Overall, the changes of
OFS with aging can be expressed as:
OFS = OFSini + %LLI +
LR %LAMliNE - LR
LRini
%LAMdePE (2)
With both equations, Fig. 6 can be modified to
include the aging paths of each of the main degradation
mechanisms. They are represented by directional
arrows on Fig. 8.
Unfortunately there are too many unknowns to solve
Eqs. (1) and (2) directly and resolution is only possible
with the help of the voltage response. The key here is to
look at the IC variations in regions A to D induced by
aging from each of the main degradation modes, such
as depicted in Table 1. The goal is to find one region
where the intensity is affected solely by one of the
LAM (positive or negative electrode). For this cell this
will be region D (red square on Table 1). Therefore,
from the changes of region D, the exact quantity of
LAMPE can be calculated. This will enable the
calculation of LAMNE from Eq. (1).
Fig. 8 Relationship between capacity loss and variations of
LR and OFS with the aging paths of the principal
degradation mechanisms.
Table 1 Evolution of regions A to D with aging.
Degradation mode A B C D
LLI
LAMdePE
LAMliPE
LAMdeNE
LAMliNE
With both LAMPE and LAMNE quantifiable; the
quantity of lithium ions lost can then be calculated
from Eq. (2). This quantity of lost lithium ions includes
the LLI and the lithium ions trapped in the negative
electrode (LAMliNE).
To summarize, the process for quantifying the
degradation mechanism of the cell can be outlined in
four steps:
(1) Build a cell replica and determine the LRini and
OFSini quantities;
(2) Identify the {LR, OFS} couples that match the
observed capacity loss;
(3) Select the {LR, OFS} couple that best matches
the voltage variation;
(4) Use the voltage response as well as Eqs. (1) and
(2) to calculate the amount of lost lithium ions and
active material on the positive and negative electrodes.
If this quantifying process is performed periodically
upon the usage of the cells, the pace of the
degradation modes throughout the aging process can
be established. Using these trends, one can estimate
the degradation modes at later cycles and emulate the
resulting capacity loss. This enables prognostics.
Since we estimate the evolution of the degradation
modes independently, the accuracy of the resulting
prognosis is greatly improved compared to
conventional extrapolation of the capacity loss. With
this technique, we proved that the onset of the second
stage of degradation with accelerated aging could be
explained and predicted [4].
3. Conclusions
Here we present a practical approach for battery
diagnostics and prognostics. It offers a coherent and
consistent understanding of the battery behavior in a
neat and quantifiable manner, and it has been
incorporated into a mechanistic model [4] that has
been applied successfully to commercial cells of
different chemistries [13-14]. It is important to
recognize that this mechanistic approach is
fundamentally different from the conventional

The Value of Battery Diagnostics and Prognostics
249
empirically based diagnostics and prognostic methods.
It offers the possibility to communicate quantitative
information of battery degradation among researchers
and engineers, bridging the gap between communities.
Acknowledgment
The funding support was provided by the Idaho
National Laboratory (INL) under the U.S. Department
of Energy, EERE Office, Developmental and Applied
Diagnostic Testing (DADT) program (Contract No.
DE-AC07-05ID14517). We are grateful to Timothy
Murphy and Kevin Gering (INL) for their support.
References
[1] J. Groot, State of health estimation of Li ion batteries cycle
life test methods, Thesis for the Division of Electric Power
Engineering, Department of Energy and Environment,
Chalmers University of Technology, Chalmers Bibliotek,
2012.
[2] M. Broussely, P. Biensan, F. Bonhomme, P. Blanchard, S.
Herreyre, K. Nechev, R.J. Staniewicz, Main aging
mechanisms in Li ion batteries, J. Power Sources 146
(2005) 90-96.
[3] J. Vetter, P. Novák, M.R. Wagner, C. Veit, K.C. Möller,
J.O. Besenhard, M. Winter, M. Wohlfahrt-Mehrens, C.
Vogler, A. Hammouche, Ageing mechanisms in lithium-ion
batteries, J. Power Sources 147 (2005) 269-281.
[4] M. Dubarry, C. Truchot, B.Y. Liaw, Synthesize battery
degradation modes via a diagnostic and prognostic model,
J. Power Sources 219 (2012) 204-216.
[5] M. Dubarry, N. Vuillaume, B.Y. Liaw, From single cell
model to battery pack simulation for Li-ion batteries, J.
Power Sources, 186 (2009) 500-507.
[6] M. Dubarry, N. Vuillaume, B.Y. Liaw, Origins and
accommodation of cell variations in Li-ion battery pack
modeling, Int. J. Energy Res. 34 (2010) 216-231.
[7] C. Truchot, M. Dubarry, B.Y. Liaw, State-of-charge
estimation and uncertainty for lithium-ion battery strings,
Appl. Energy 119 (2014) 218-227.
[8] M. Dubarry, C. Truchot, A. Devie B.Y. Liaw, Two-point
State-of-Charge Determination in Lithium-ion Battery
Packs, J. Electrochem. Soc., 2015. (submitted)
[9] M. Dubarry, C. Truchot, B.Y. Liaw, K. Gering, S. Sazhin,
D. Jamison, C. Michelbacher, Evaluation of commercial
lithium-ion cells based on composite positive electrode for
plug-in hybrid electric vehicle applications. Part II.
Degradation mechanism under 2C cycle aging, J. Power
Sources 196 (2011) 10336-10343.
[10] M. Dubarry, V. Svoboda, R. Hwu, B.Y. Liaw, Capacity
loss in rechargeable lithium cells during cycle life testing:
The importance of determining state-of-charge, J. Power
Sources 174 (2007) 1121-1125.
[11] M. Dubarry, V. Svoboda, R. Hwu, B.Y. Liaw, Incremental
capacity analysis and close-to-equilibrium OCV
measurements to quantify capacity fade in commercial
rechargeable lithium batteries, Electrochem. Solid-State
Lett. 9 (2006) A454-A457.
[12] M. Dubarry, C. Truchot, B.Y. Liaw, K. Gering, S. Sazhin,
D. Jamison, C. Michelbacher, Evaluation of commercial
lithium-ion cells based on composite positive electrode for
plug-in hybrid electric vehicle applications: III. Effect of
thermal excursions without prolonged thermal aging, J.
Electrochem. Soc. 160 (2013) A191-A199.
[13] A. Devie, M. Dubarry, B.Y. Liaw, Diagnostics of Li-ion
commercial cells, experimental case studies, ECS Trans.
58 (2014) 193-205.
[14] M. Dubarry, C. Truchot, B.Y. Liaw, Cell degradation in
commercial LiFePO4 cells with high-power and
high-energy designs, J. Power Sources 258 (2014)
408-419.