Embed Size (px)
Citation preview
The Value Energy Efficiency As A Resource Option
Three Decades of PNW Experience
US DOE, IEA and RAP
Workshop on Policies for Energy Provider Delivery of Energy Efficiency
April 18, 2012
Tom Eckman
Northwest Power and Conservation Council
Utility Programs, Energy Codes & Federal Efficiency Standards
Now Produced Over 40,000 GWH/yr of Savings
slide 2
0
5,000
10,000
15,000
20,000
25,000
30,000
35,000
40,000
45,000
1978 1983 1988 1993 1998 2003 2008
GW
H/y
r
Utility Programs NEEA Programs State Codes Federal Standards
Utility Delivered or Funded Programs & Initiatives Acquired 60% of the Savings
slide 3
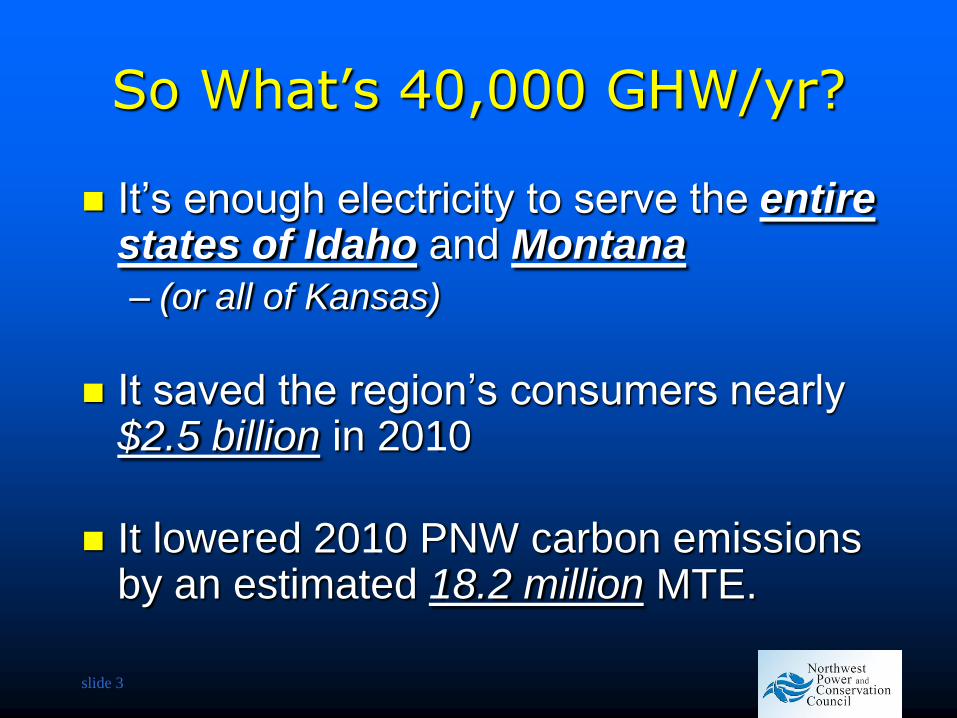
So What’s 40,000 GHW/yr?
It’s enough electricity to serve the entire states of Idaho and Montana
– (or all of Kansas)
It saved the region’s consumers nearly $2.5 billion in 2010
It lowered 2010 PNW carbon emissions by an estimated 18.2 million MTE.
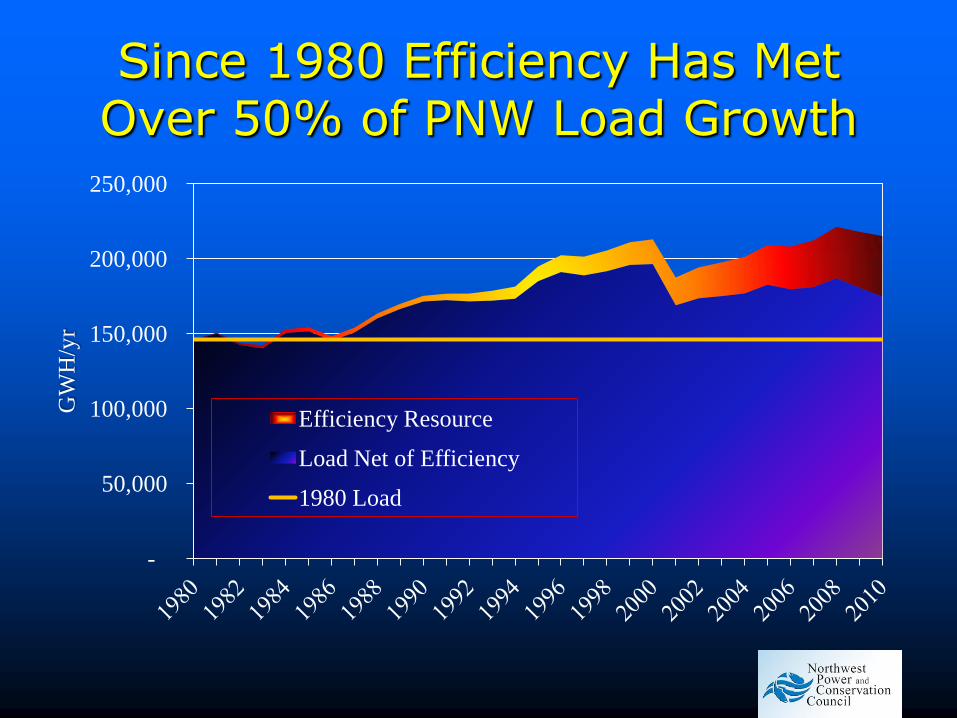
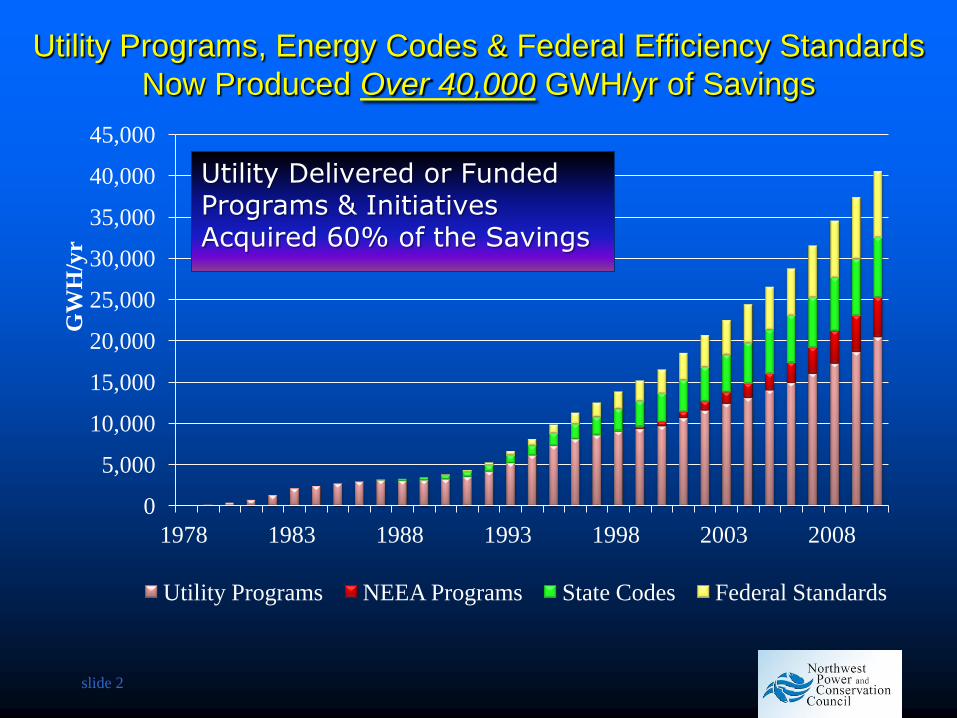
Since 1980 Efficiency Has Met Over 50% of PNW Load Growth
-
50,000
100,000
150,000
200,000
250,000
GW
H/y
r
Efficiency Resource
Load Net of Efficiency
1980 Load
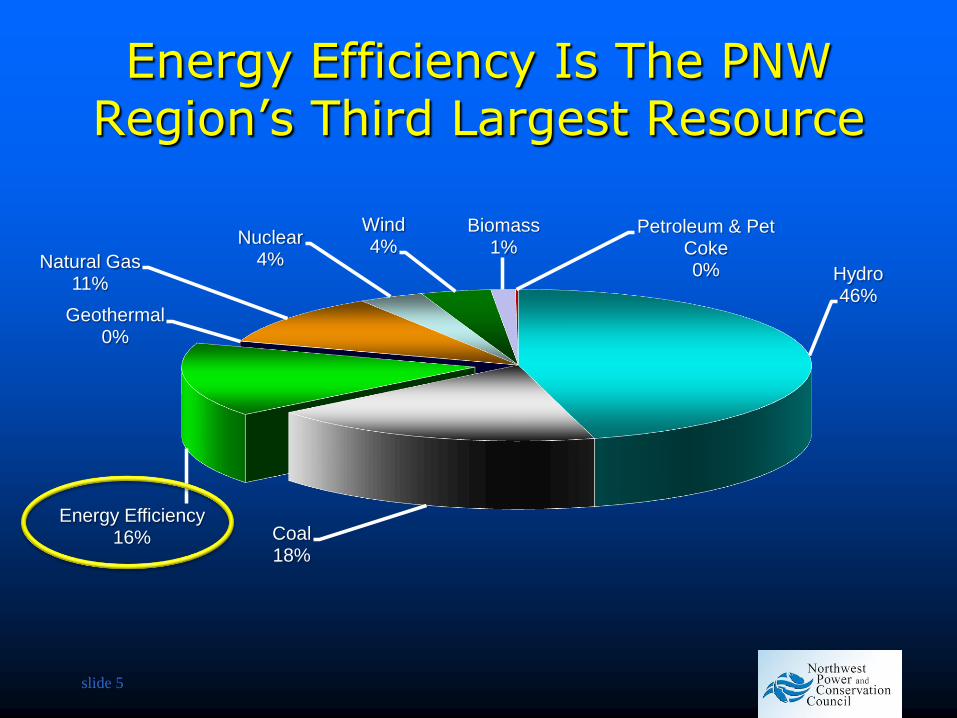
Energy Efficiency Is The PNW Region’s Third Largest Resource
slide 5
Hydro 46%
Coal 18%
Energy Efficiency 16%
Geothermal 0%
Natural Gas 11%
Nuclear 4%
Wind 4%
Biomass 1%
Petroleum & Pet Coke 0%
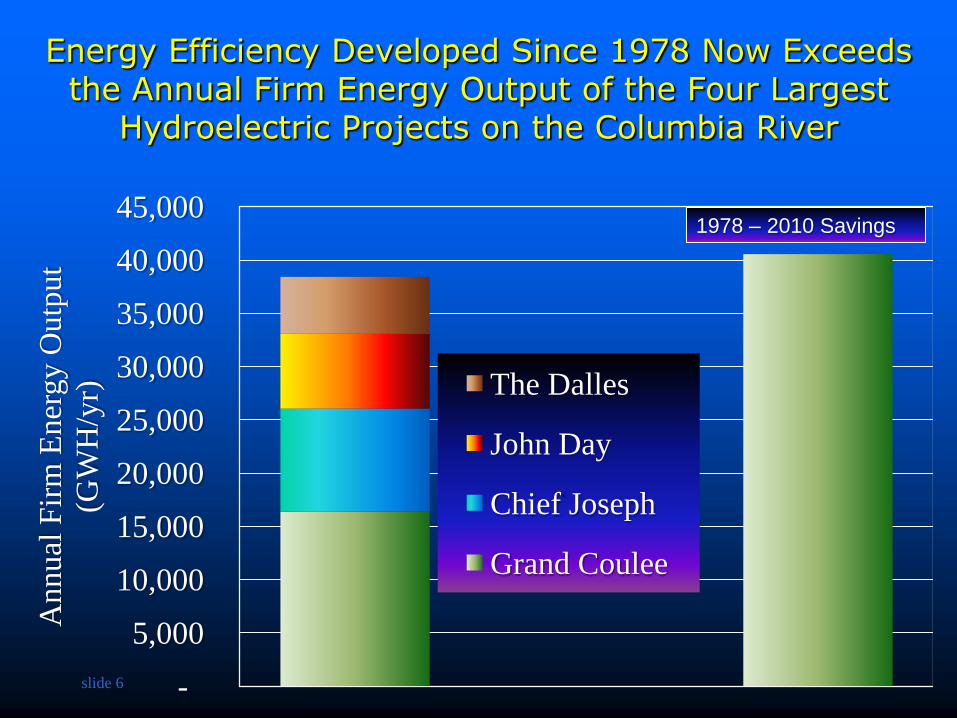
Energy Efficiency Developed Since 1978 Now Exceeds the Annual Firm Energy Output of the Four Largest
Hydroelectric Projects on the Columbia River
slide 6 -
5,000
10,000
15,000
20,000
25,000
30,000
35,000
40,000
45,000
Annual
Fir
m E
ner
gy
Outp
ut
(GW
H/y
r) The Dalles
John Day
Chief Joseph
Grand Coulee
1978 – 2010 Savings
slide 7
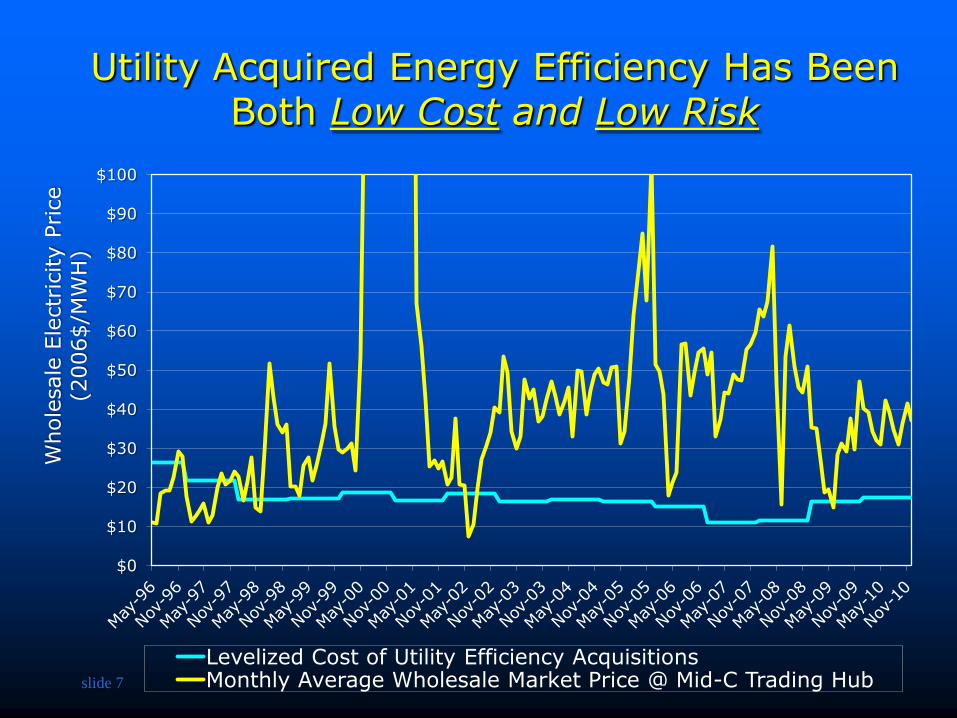
Utility Acquired Energy Efficiency Has Been Both Low Cost and Low Risk
$0
$10
$20
$30
$40
$50
$60
$70
$80
$90
$100
Whole
sale
Ele
ctr
icity P
rice
(2006$/M
WH
)
Levelized Cost of Utility Efficiency Acquisitions Monthly Average Wholesale Market Price @ Mid-C Trading Hub
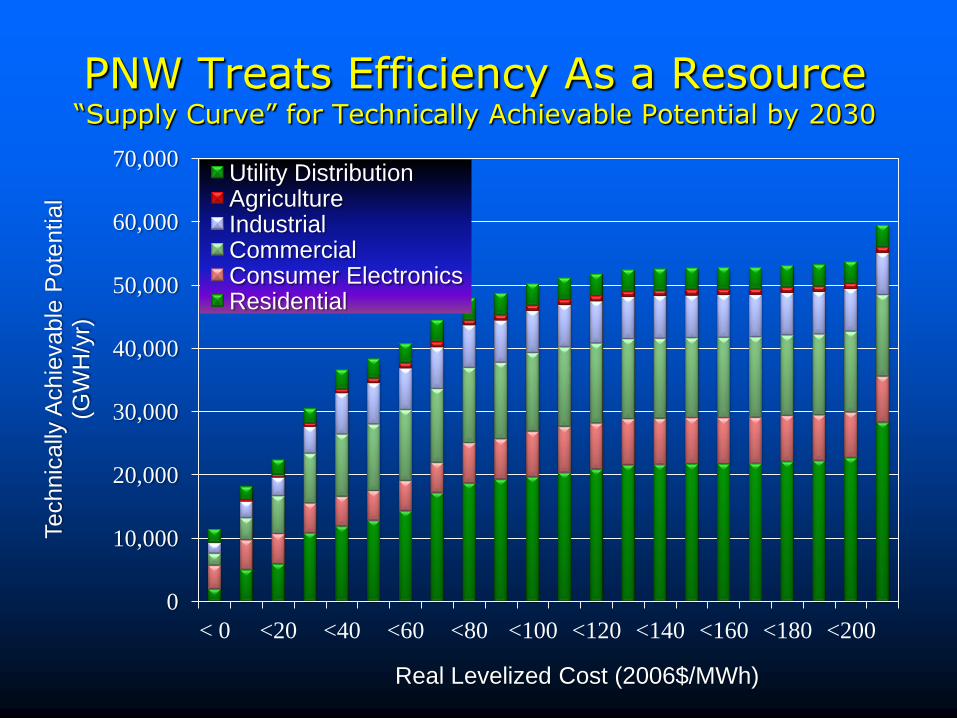
PNW Treats Efficiency As a Resource “Supply Curve” for Technically Achievable Potential by 2030
0
10,000
20,000
30,000
40,000
50,000
60,000
70,000
< 0 <20 <40 <60 <80 <100 <120 <140 <160 <180 <200
Technic
ally
Achie
vable
Pote
ntial
(GW
H/y
r)
Real Levelized Cost (2006$/MWh)
Utility Distribution Agriculture Industrial Commercial Consumer Electronics Residential
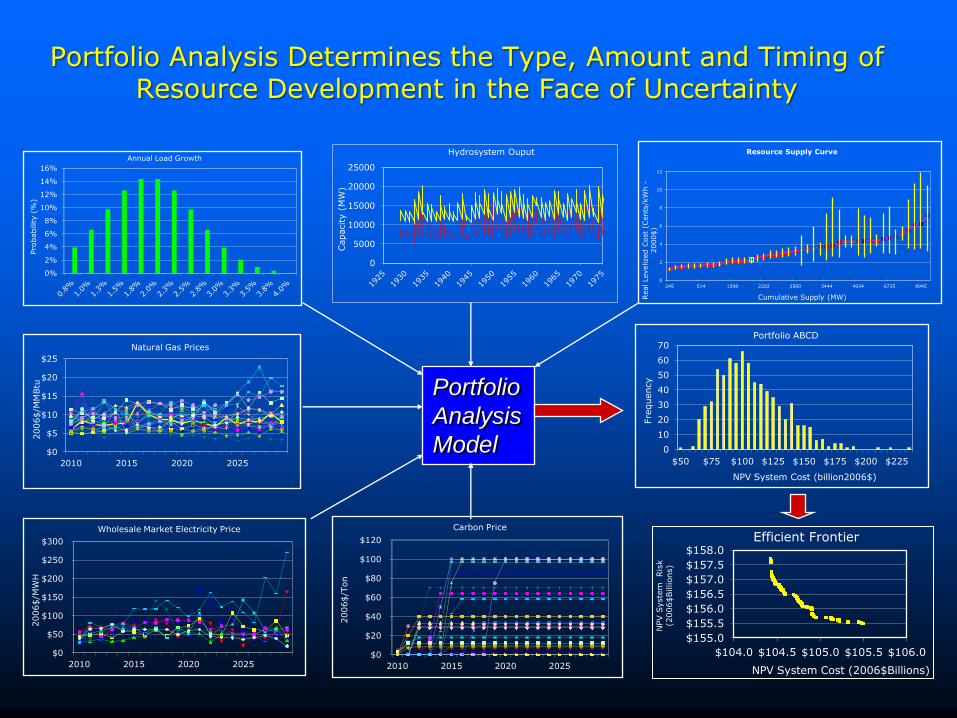
Portfolio Analysis Determines the Type, Amount and Timing of Resource Development in the Face of Uncertainty
0%
2%
4%
6%
8%
10%
12%
14%
16%
Pro
bability (
%)
Annual Load Growth
$0
$5
$10
$15
$20
$25
2010 2015 2020 2025
2006$/M
MBtu
Natural Gas Prices
$0
$50
$100
$150
$200
$250
$300
2010 2015 2020 2025
2006$/M
WH
Wholesale Market Electricity Price
0
5000
10000
15000
20000
25000
Capacity (
MW
)
Hydrosystem Ouput
0
2
4
6
8
10
12
245 514 1598 2202 2560 3444 4934 6735 8945
Real Levelized C
ost
(Cents
/kW
h -
2000$)
Cumulative Supply (MW)
Resource Supply Curve
Portfolio
Analysis
Model
$0
$20
$40
$60
$80
$100
$120
2010 2015 2020 2025
2006$/T
on
Carbon Price
0
10
20
30
40
50
60
70
$50 $75 $100 $125 $150 $175 $200 $225
Fre
quency
NPV System Cost (billion2006$)
Portfolio ABCD
$155.0
$155.5
$156.0
$156.5
$157.0
$157.5
$158.0
$104.0 $104.5 $105.0 $105.5 $106.0 N
PV S
yste
m Ris
k
(2006$Billions)
NPV System Cost (2006$Billions)
Efficient Frontier
slide 10
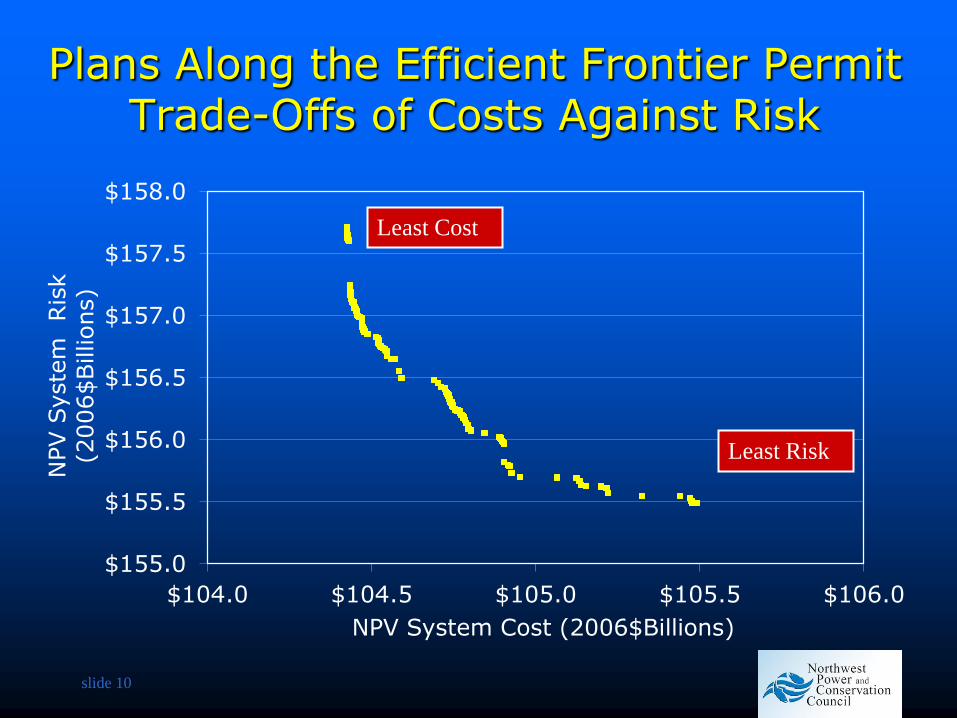
Plans Along the Efficient Frontier Permit Trade-Offs of Costs Against Risk
$155.0
$155.5
$156.0
$156.5
$157.0
$157.5
$158.0
$104.0 $104.5 $105.0 $105.5 $106.0
NPV S
yste
m Ris
k
(2006$Billions)
NPV System Cost (2006$Billions)
Least Risk
Least Cost
slide 11
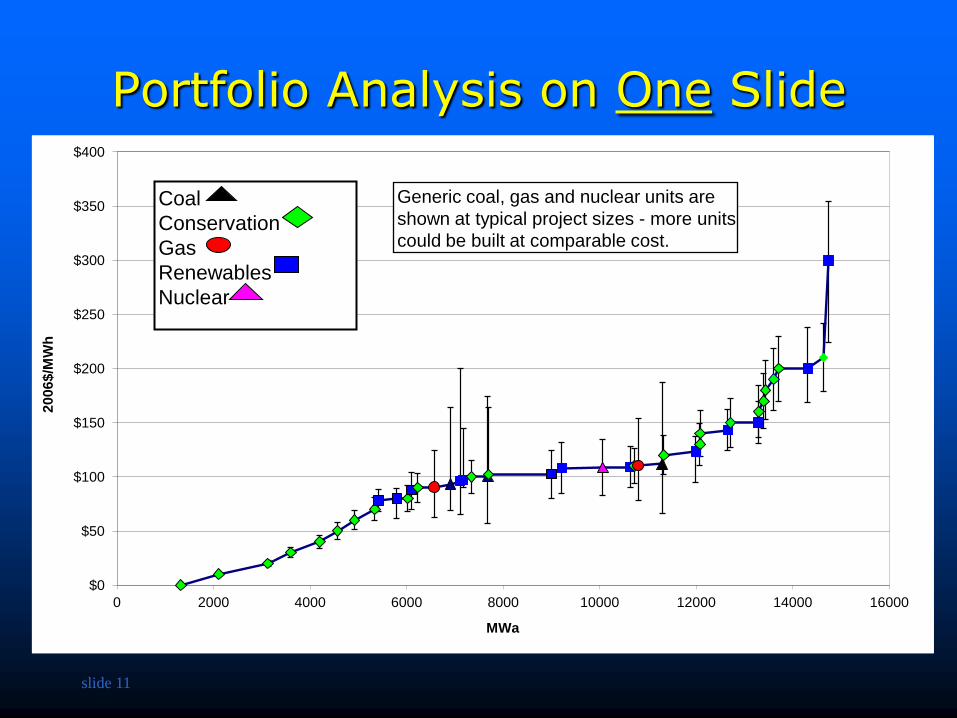
Portfolio Analysis on One Slide
$0
$50
$100
$150
$200
$250
$300
$350
$400
0 2000 4000 6000 8000 10000 12000 14000 16000
20
06
$/M
Wh
MWa
Coal
Conservation
Gas
Renewables
Nuclear
Generic coal, gas and nuclear units are
shown at typical project sizes - more units
could be built at comparable cost.
$0
$50
$100
$150
$200
$250
$300
$350
$400
0 2000 4000 6000 8000 10000 12000 14000 16000
20
06
$/M
Wh
MWa
Coal
Conservation
Gas
Renewables
Nuclear
Generic coal, gas and nuclear units are
shown at typical project sizes - more units
could be built at comparable cost.
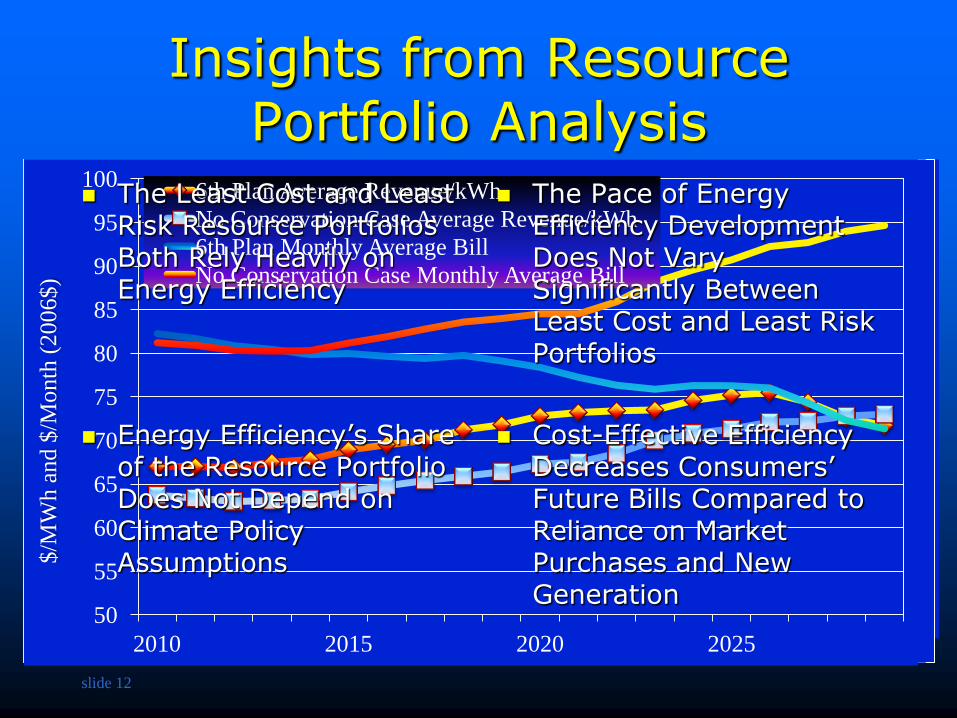
Insights from Resource Portfolio Analysis
slide 12
0
10,000
20,000
30,000
40,000
50,000
60,000
0 20 40 60 80 100 120
Eff
icie
ncy
Res
ou
rce A
dd
itio
ns
(GW
H/y
r)
Portfolios On Efficient Frontier
Least Cost
Portfolios
Least Risk Portfolios
-
10,000
20,000
30,000
40,000
50,000
60,000
2010 2015 2020 2025
Cum
ula
tive
Dev
elopm
ent
(GW
H/y
r)
Year
Least Cost
Least Risk
- 10 20 30 40 50 60
Least Cost Plan
Least Risk Plan
Current Carbon Policy Case
$100 Carbon Price
$20 Carbon Price
Cumulative Efficiency Development (1,000 GWh/yr) 50
55
60
65
70
75
80
85
90
95
100
2010 2015 2020 2025
$/M
Wh a
nd $
/Month
(2006$)
6th Plan Average Revenue/kWh
No Conservation Case Average Revenue/kWh
6th Plan Monthly Average Bill
No Conservation Case Monthly Average Bill
The Least Cost and Least Risk Resource Portfolios Both Rely Heavily on Energy Efficiency
The Pace of Energy Efficiency Development Does Not Vary Significantly Between Least Cost and Least Risk Portfolios
Energy Efficiency’s Share
of the Resource Portfolio Does Not Depend on Climate Policy Assumptions
Cost-Effective Efficiency Decreases Consumers’ Future Bills Compared to Reliance on Market Purchases and New Generation
slide 13
Why We Rely on Energy Efficiency
It’s A Cheap (avg. 2.4 cents/kWh) Hedge Against Market Price Spikes
It’s Not Subject to Fuel Price Risk
It’s Not Subject to Carbon Control Risk
It’s Significant Enough In Size to Delay “build decisions” on generation
IF you can find any other resource with the same characteristics . . . buy them.