Embed Size (px)
Citation preview

Humanities and Social Sciences 2016; 4(2): 26-33
http://www.sciencepublishinggroup.com/j/hss
doi: 10.11648/j.hss.20160402.12
ISSN: 2330-8176 (Print); ISSN: 2330-8184 (Online)
The Utilizing of Geographical Information System for Showing Distribution Burglary in Sheffield City, United Kingdom
Zana Fattah Ali
Geography Department, Koya University, Koya, Iraq
Email address: [email protected]
To cite this article: Zana Fattah Ali. The Utilizing of Geographical Information System for Showing Distribution Burglary in Sheffield City, United Kingdom.
Humanities and Social Sciences. Vol. 4, No. 2, 2016, pp. 26-33. doi: 10.11648/j.hss.20160402.12
Received: January 26, 2016; Accepted: February 23, 2016; Published: March 12, 2016
Abstract: Burglary is one of the dangerous types of crime in society. The rate of this phenomenon has increased in the areas
that have negative impact on the relationship between residents with government law. This increase also shows that the low of
the security in this society make their people do not feel better security of life. This study concentrates of the utilized
Geographical Information System (GIs) to identify the level of burglary and the factors that have a big related with it in
Sheffield in 2011. In addition, (MapInfo 10 and Arc GIs 10) play a role in detecting and presenting data due to the utility of
maps. GIS could have a charmed role in displaying the ratio and distribution of the burglary in each sector of the city, and
sociocultural impacts on the residents. The criteria that were involved in this study contains (student, age 16-29, unemployed,
white and black African, sharing house and no qualification). Both of CASWEB 2011 census and Edina UK Border were used
to collect the data and create the map in Sheffield.
Keywords: Geography, GIS & Burglary Rate in Sheffield City
1. Introduction
In criminal statutes, if a person enters other peoples'
premises with the intention of committing crimes, hence that
person is committed a crime. Burglary is classified as a
specific kind of the class theft crime. Like other types of
theft, a person is guilty of burglary when he aims at stealing
something from someone with intention of permanently
depriving it from its owner (Anonymous, 2005). The
definition of burglary has changed over the time; in the
English case law, the burglary is breaking into people’s house
with the intention of committing crimes during the night and
different offense of break-in during the day. However, this
definition has changed from 20th century; break- in to other
people’s premises with the intent of committing this offense
at any time of the day can be considered as burglary
(Burglary, 2013).
In a study that is conducted on international crimes and
justice statistics, as a respond to a question asked whether
they can follow the definition of burglary, 41 per cent in total
of 71 countries responded that they have understood the term
of burglary (Helsinki, 2010).
In the twentieth century, this kind of crime (Burglary) was
most popular in many countries in the worldwide;
particularly, in those countries that have high rates of
population. According to Shover (1991) in the 1960 the
proportion of Burglary was 508, 6 per 100,000 people in the
United State, but in 1984 this proportion has been
dramatically increasing to 1,263 per 100,000. (GIs) played a
major role in collecting data about all crimes, generally
burglary. Primarily, Grubesic and Murray (2001, p21) argued
that (GIs) mapping techniques "utilised to investigate the link
between juvenile delinquency and social or cultural
characteristics". The Major goal of this study is to focus on
the using GIs technique for spatial analysis of burglary crime
in Sheffield.
1.1. Background
This kind of theft is one of the most popular sorts in the
worldwide. Any society that suffers from this type of crime,
people can feel unsafe about their properties and valuable
stuffs, and this can be regarded as a dangerous pronominal.

27 Zana Fattah Ali: The Utilizing of Geographical Information System for Showing Distribution
Burglary in Sheffield City, United Kingdom
Different techniques and devices have been used to indicate
the places of the crimes such as GIS which can be used to
collect data in this respect.
In recent years, many studies have been conducted by
depending on GIS to gather data about the different types of
crimes. A study that is carried out by Chainey and Ratcliffe
in (2005) in Chester, England has made use of GIS to
indicate the places of the crimes on maps and also provides a
table to indicate the rates and types of crimes in a specific
area. This implementation has made the maps and tables
available for the public through internet. Therefore, people
can have access to them from everywhere and at any time.
Another study which was implemented by Peng Chen, Tao
Chen and Hongyong Yuan in Beijing, China in (2007)
indicates that in 1980s, before inventing GIS, it was hard to
detect the places where the crimes occurred. However, the
invention of GIS, in the years after, accelerates the process of
investigation by using peoples address who had committed
the crime and indicating the places where had more crimes.
In analysing the crimes, such as burglary and robbery the
recordings of the study had many important attributes in the
process of the crime analysis by using GIs map such as a”
unique reference number, Date of offence, Time of offence,
Type of offence, Offence address”.
Another study that has been carried out by Canter, P.R. in
Marylan, USA in (1997), discussed the use of GIs in
mapping the burglary and robbery crimes. It showed the
crimes using Polygon, point and line. This study also
mentions that a large number of burglary crimes had accrued
outside the areas where targeted by police as the police
mostly focuses on the areas which had more crimes.
1.2. The Objective of This Study
Burglary is one of the serious issues that have a huge
impact on the humanity and personal life. This paper focuses
on the using of GIS technique in distributing and selecting
the rate of percentage Burglary crime in Sheffield. It also
explains the factors that have influence on burglary.
1.3. The Study Areas
Sheffield is one of the most significant and greenest cities
in United Kingdom. It is located in the centre of the United
Kingdom, in the South Yorkshire, in the intersection of 53°
23' North latitude, 3° 47' West longitude. Figure 1: illustrated
the Geographical location of Sheffield in UK. It is the fourth
largest city in UK. According to UK official census, the
number of its population was 552,694 in 2011 and covered an
area of 368 KM2.
2. Methodology
They are several types of methods to collect data in
connection to this study. GIs is a modern technique that has a
great role in collecting data, then joining and displaying on
map. Both of the MapInfo 10, Arc GIs 10 and Microsoft
word 2010 are made use of to provide the maps. Computer
and printer are two kinds of the hardwired that mainly
participate in conducting this study. In addition, there are
different types of source that are essential to get many kinds
of data about this study. For instance, this site, www, edina.
ac. ak / ukborder can be utilized to produce maps in all UK
cities, and it also use www, Census. ac. uk/ CASWEB to
provide UK census population and spatial data. Furthermore,
there are many kinds of sources that are useful for getting
information about this study such as books, articles and
journals. All the sources are available in the library and
subspace.
Fig. 1. Geographical Location of the Sheffield City in the United Kingdom.
Sources (Goggle Map).
2.1. Data Collection
The data collection in this study depends on the secondary
data. It using CASWEB 2011 census for obtaining
percentage of burglary crime in Sheffield for each word. All
the data was collected in census 2011. It is evident that, all
maps were downloaded from Edina UK Border on the
internet. It can also make use of the Google map to select
geographical location of Sheffield city in United Kingdom.
2.2. Utilize UK Census
For answering this question, why census is important?
Census data is very significant because it is gathering correct
Humanities and Social Sciences 2016; 4(2): 26-33 28
information about the proportion of population in any
country across the world. In this way, they get data about the
annual population increase. Census data is most essential
source to help government for collecting data in many
aspects in UK, such as (age, gender, crime, heals, education,
migration, marital status unemployed and birth or mortality
(Valencia, 2002). In the last century census was carried out
by one time per ten years due to lack of the developed
technological devices and methods, but in the last few
decades due to the improvement in technology, obtaining
census become easy. Census in UK is conducted by separate
source. For example, in Wales and England is collected by
Office for National Statistics (ONS), in North Ireland the
census is implemented by Northern Ireland statistics and
Research Agency (NISRA), whereas the General Register
Office has a major role in carrying out census in Scotland
(Martin and Tranmer, 2001). GIs technique played a key role
in selecting the location by using address zone. According to
Lovett and Gale (2002) GIs are utilized to collect data and
create map for General practitioner surgery locations, such as
address zone, community transportation services, road newt
works and bus routes in UK. This study draws on the 2011
UK census for all the aspects. The burglary data will be
collected to find out how many people do this crime annually
in all UK cities.
2.3. Burglary Crime Policy
Burglary are changes according to different types of law in
any countries, each countries has a specific law for burglary.
In the past, due to lack of a strong security and low cultural
level, particularly in the developing countries, the rate of
burglary was high. Norris (2007) reported in December 2005,
under supervision UK the European Parliament legislate a
law that allow to use internet and telephone services by
police to discover the crime location by recording mobile and
telephone number. In the last two decades, the number of
burglary was decrease in UK. As a Home Office Public
Service Agreement (HOPSA) the proportion of burglary was
dramatically reduced by % 25 in 2005 compere to 2003
(Drake, 2008). According to planning research by National
Strategy Action Plan (DTLR) implemented during 20 years
in the poorest part in British the rate of burglary was
dramatically reduce. This is due to the increase in the job
opportunities in the target areas, improving health quality and
providing better housing to life (Bell and Jones, 2002). After
year 1990 till now UK government is providing a better
home security, and helps to increase people's annual income
as well as raises CCTV for public places. Tilley and Farrell
(2011) argue that in the past 15 years from 1995 to 2008 the
rate of burglary was decreased by 58 per cent in England and
Wales. This is due to providing better security devices in
households and increasing annual income personally. Tilley
and Farrell (2011) believe that the majority of households is
more likely to be burglary their annual income was lower.
According to the Home Office (2015) sentences for the
burglary are different for instance, "Under Section 9 of the
Theft Act 1968 the maximum sentence that an individual
convicted of burglary will be provided with is as follows:
� 14 years – where the offence was committed in respect
of a building which is a dwelling
� 10 years – where the offence was committed in relation
to any other buildings
Section 4 of the Crime (Sentences) Act 1997 specifies a
minimum 3 year prison sentence for third-time domestic
burglary
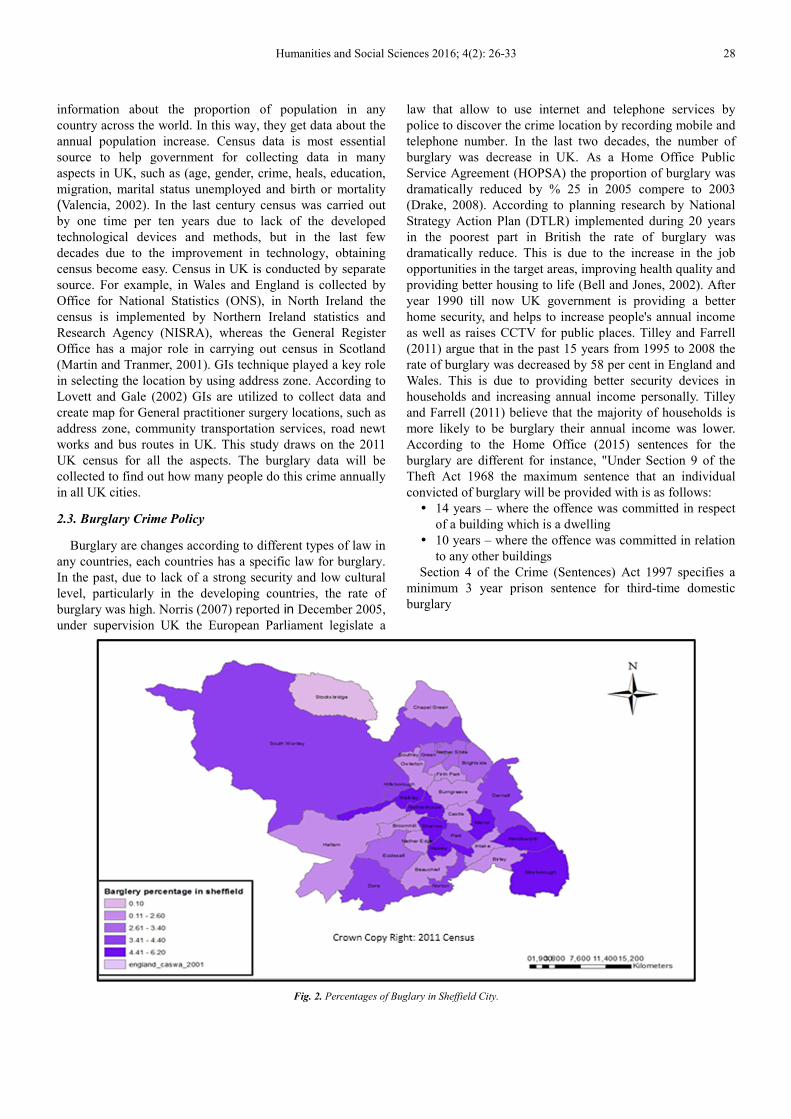
Fig. 2. Percentages of Buglary in Sheffield City.

29 Zana Fattah Ali: The Utilizing of Geographical Information System for Showing Distribution
Burglary in Sheffield City, United Kingdom
This figure illustrates that the percentage of burglary crime in different parts in Sheffield. The high rate of burglary is located
in city centre and South east (Dark Blue colour) and the lower proportion of burglary is located in various parts, such as North
and around city centre (light Purple colour).
Fig. 3. Percentage of Student Activity in Sheffield.
The figure 3 shows that the high proportion of people that have a student activity is located in the city centre (Blue colour)
and the lower rate of student is located in the South and a big part of the North and North west (Green colour).
Fig. 4. Percentage of Unemployed in Sheffield.

Humanities and Social Sciences 2016; 4(2): 26-33 30
This figure exhibits that a great percentage of Unemployed is located in the middle city (Dark Green and Green colour). But
it can be seen clearly that the less high proportions of people that are Unemployed occur in a huge part in North and North
West and South (Red and Orange colour).
Fig. 5. Percentage of Sharing House in Sheffield.
A huge level of population that live in Sharing house is located in mid-city centre (Dark Brown colour) and the lower
percentage of sharing house is distributed around the city centre in North, South, West and East (Dark and light Blue colour).
Fig. 6. Percentage of People Ages 16-29 in Sheffield.

31 Zana Fattah Ali: The Utilizing of Geographical Information System for Showing Distribution
Burglary in Sheffield City, United Kingdom
These figure (Fig. 6) exhibits that the high rate percentage of people that aged between 16 and 29 is located in the mid
Sheffield city (Red and Brown colour). The (dark Green and Green colour) shows the lowest level of people that aged between
16 and 29 are distributed across various part in (North, North West, South and South West).
Fig. 7. Percentage of White and Black African in Sheffield.
The majority of white and black African people live in the city centre in Sheffield (dark Blue and Blue colour). But the
lower proportion of those is located in South and big part in the North and North West (Maroon and Yalloworange colour)
Fig. 8. Percentage of People with no Qualification in Sheffield.

Humanities and Social Sciences 2016; 4(2): 26-33 32
Figure 8: demonstrates that the high proportion of people
with no qualification in Sheffield is located in different part
in city centre and East (Dark and Light Blue colour), whereas
the rate is less high in The South West (Maroon colour).
3. Analyses and Discussion
To analyse different types of information on any study, we
should answer three main questions. The questions are what,
where and how as well as illustrating the links between these
questions.
In this study, generally, places the emphasis on the
analysis and the specification of the highest rate of burglary
in Sheffield. The highest rate of burglaries have occurred in
the city centre and in some parts near to the city centre and
south east of the city, as it has been shown on figure 1.
As it can be clearly seen on the maps above, burglary is
more frequent in the places which have a higher number of
student residences near the city centre. And the places where
the number of students is low the rate of the crime is much
lower. It is clear evidence that the number of student
residences have the influence on the rate of the crime.
Unemployment is another reason behind such crime. The
places that have more unemployed people the rate of the
burglaries is much higher compare to other places. Some of
them resort to burglary as an alternative of legally gaining
money to support their income as it can help them to
continue their life.
Sharing houses, such as flats and accommodations that
contain people from different ages, background and
nationality have higher rate of the burglaries compare to
other types of properties. This can lead to high rate as it's
easier for people share some of their stuffs with those who
they live with. For instance, students from different
nationalities may share their own stuffs with other; this can
be easily taken by others.
On figure 6 it can be seen that the majority of people who
are committing such type of crime are aged between 16 to 29
years old. And the majority of them have no qualifications.
It can be observed that the places that have a higher
number of African people from both gender has a higher
percentage of burglary compare to the places with few
number of African residents.
According to the above data, places with a higher student
resident, people aged between 16 to 29, sharing house,
unemployment and places with majority of African people
residents are the main factors of increasing the burglary
crime.
4. Conclusion
It’s evident that any place that has a high proportion of
burglary will leave some negative impact on the social life,
security and individual behaviours in the society. This paper
determine Geographical Information System (GIS) which
identified the level of burglary in Sheffield and it also clarify
the causes that influencing the burglary such as international
students, because of the limited incomes they might steal
their needs from neighbourhoods. Unemployment, is another
influential burglary due to the lack job opportunity, sharing
house, those people that allocating house their incomes are
mostly inadequate which is supportive for doing this crime.
Furthermore, ethnic groups also participate in this crime
because this group thought that they are not known by the
people in this province so they do not pay attention for the
notoriety. Finally, the people with no qualification cause to
increase the number of the burglary as the low of the
education and scarce of the work. GIS has an import role on
specifying the demography of population in specific places.
Moreover, by using this technique we can design different
maps to display different phenomenon. This study has used
different types of measurement to determine the rate of
burglary and the factors that related to it.
References
[1] ANONYMOUS, (2005). "Crime and Burglary Protection" Safety Now, (238) 1.
[2] BELL, R., and JONES, G. (2002). Youth policies in the UK: A chronological map.
[3] BUGLARY, (2013) Encyclopædia Britannica Inc.
[4] CANTER, P.R (1997). Geographic information systems and crime analysis in Baltimore County, Maryland. In: D. Weisburd and J.T. McEwen, eds., Crime Mapping and Crime Prevention. Monsey, NY: Criminal Justice Press.
[5] CHAINEY. S and RATCLIFFE. J (2005). GIS and crime mapping, John Wiley, Chichester.
[6] DRAKE, L. M., and SIMPER, R. (2008). The measurement of police force efficiency: an assessment of UK Home Office policy. Contemporary Economic Policy, 23(4), 465-482.
[7] GRUBESIC, T and MURRAY, A (2001). Detecting hot-spots using cluster analysis and GIs. In Paper presented at the 5th annual international crime mapping research conference, Dallas, Texas, USA.
[8] HELSINKI, (2010) “international statistics on crime and justice”. [Online]. last access 29th March 2013 at: http://www.heuni.fi/Satellite?blobtable=MungoBlobs&blobcol=urldata&SSURIapptype=BlobServer&SSURIcontainer=Default&SSURIsession=false&blobkey=id&blobheadervalue1=inline;%20filename=Hakapaino_final_07042010.pdf&SSURIsscontext=Satellite%20Server&blobwhere=1266335656647&blobheadername1=Content-Disposition&ssbinary=true&blobheader=application/pdf.
[9] Home Office Counting Rules for Recorded Crime, (2015). Burglary Dwelling & Burglary non Dwelling. [Online]. last access 22nd Feb. 2016 at: https://www.gov.uk/government/uploads/system/uploads/attachment_data/file/419548/count-burglary-april-2015.pdf
[10] LOVETT, A., HANES, R., SUNNENBERG, G., and GALE, S. (2002). Car travel time and accessibility by bus to general practitioner services: a study using patient registers and GIS. Social Science & Medicine, 55(1), 97-111.

33 Zana Fattah Ali: The Utilizing of Geographical Information System for Showing Distribution
Burglary in Sheffield City, United Kingdom
[11] MARTIN, D., NOLAN, A., and TRANMER, M (2001). The application of zone-design methodology in the 2001 UK Census. Environment and Planning A, 33(11), 1949-1962.
[12] NORRIS, C. (2007). The intensification and bifurcation of surveillance in British criminal justice policy. European Journal on Criminal Policy and Research, 13(1-2), 139-158.
[13] PENG, Tao and HONGYONG, Yuan (2010). "GIS based crime risk analysis and management in cities" IEEE, 3721.
[14] SHOVER, N. (1991) "Burglary" Crime and Justice, (14), 73-113.
[15] TILLEY, N., TSELONI, A., and FARRELL, G. (2011). Income Disparities of Burglary Risk Security Availability during the Crime Drop. British Journal of Criminology, 51(2), 296-313.
[16] VAENCIA, R. R. (2002). Chicano school failure and success: Past, present, and future. Rutledge.