Embed Size (px)
Citation preview

7/27/2019 The Utility of the Eddy Covariance Techniques as a Tool in Carbon Accounting Tropical Savanna as a Case Study
http://slidepdf.com/reader/full/the-utility-of-the-eddy-covariance-techniques-as-a-tool-in-carbon-accounting 1/13
CSIRO PUBLISHING
www.publish.csiro.au/journals/ajb Australian Journal of Botany, 2005, 53, 663–675
The utility of the eddy covariance techniques as a tool in carbon accounting:
tropical savanna as a case study
Lindsay B. HutleyA,D , Ray Leuning B , Jason Beringer C and Helen A. CleughB
ATropical Savanna CRC and School of Science and Primary Industries, Charles Darwin University,
Darwin, NT 0909, Australia.BCSIRO Marine and Atmospheric Research, PO Box 1666, Canberra, ACT 2601, Australia.
CSchool of Geography and Environmental Science, Monash University, PO Box 11A,
Clayton, Vic. 3800, Australia.DCorresponding author. Email: [email protected]
Abstract. Global concern over rising atmospheric CO2 concentrations has led to a proliferation of studies of carbon
cycling in terrestrial ecosystems. Associated with this has been widespread adoption of the eddy covariance method to provide direct estimates of mass and energy exchange between vegetation surfaces and the atmosphere. With the
eddy covariance method, fast-response instruments (10–20 Hz) are typically mounted above plant canopies and the
fluxes are calculated by correlating turbulent fluctuations in vertical velocity with fluctuations in various scalars
such as CO2, water vapour and temperature. These techniques allow the direct and non-destructive measurement
of the net exchange of CO2 owing to uptake via photosynthesis and loss owing to respiration, evapotranspiration
and sensible heat. Eddy covariance measurements have a high temporal resolution, with fluxes typically calculated
at 30-min intervals and can provide daily, monthly or annual estimates of carbon uptake or loss from ecosystems.
Such measurements provide a bridge between ‘bottom-up’ (e.g. leaf, soil and whole plant measures of carbon
fluxes) and ‘top-down’ approaches (e.g. satellite remote sensing, air sampling networks, inverse numerical methods)
to understanding carbon cycling. Eddy covariance data also provide key measurements to calibrate and validate
canopy- and regional-scale carbon balance models. Limitations of the method include high establishment costs,
site requirements of flat and relatively uniform vegetation and problems estimating fluxes accurately at low wind speeds. Advantages include spatial averaging over 10–100 ha and near-continuous measurements. The utility of the
method is illustrated in current flux studies at ideal sites in northern Australia. Flux measurements spanning 3 years
have been made at a mesic savanna site (Howard Springs, Northern Territory) and semi-arid savanna (Virginia
Park, northern Queensland). Patterns of CO2 and water vapour exchange at diurnal, seasonal and annual scales
are detailed. Carbon dynamics at these sites are significantly different and reflect differences in climate and land
management (impacts of frequent fire and grazing). Such studies illustrate the utility of the eddy covariance method
and its potential to provide accurate data for carbon accounting purposes. If full carbon accounting is implemented,
for ideal sites, the eddy covariance method provides annual estimates of carbon sink strength accurate to within
10%. The impact of land-use change on carbon sink strength could be monitored on a long-term basis and provide
a valuable validation tool if carbon trading schemes were implemented.
Introduction
The carbon cycle is pivotal to the earth system, being linked
to the biosphere, atmosphere, geosphere and hydrosphere,
and is strongly coupled to other cycles of nutrients, water
and energy. Carbon accounting involves the quantification of
sources and sinks of carbon (particularly CO2) from various
carbon pools, including terrestrial ecosystems. Precise
measurement and monitoring of the carbon cycle in time and
space is difficult, but the development of the eddy covariance
method over the last three decades is providing a direct
measure of the exchange of carbon between land surfaces
and the atmosphere (Baldocchi et al . 1988; Baldocchi
2003). Eddy covariance (EC) is a micrometeorological
method that directly measures the integrated mass and
energy exchange between a uniform surface (e.g. plant
canopy, soil, water body) and the atmosphere. For vegetated
surfaces, the method involves the deployment of fast-
response instruments (samples taken at 10 or 20 Hz) above
plant canopies, which measure the covariance of vertical
wind velocities and scalars such as CO2, water vapour
© CSIRO 2005 10.1071/BT04147 0067-1924/05/070663

7/27/2019 The Utility of the Eddy Covariance Techniques as a Tool in Carbon Accounting Tropical Savanna as a Case Study
http://slidepdf.com/reader/full/the-utility-of-the-eddy-covariance-techniques-as-a-tool-in-carbon-accounting 2/13
664 Australian Journal of Botany L. B. Hutley et al.
and temperature. The turbulent upward and downward
movements of air (eddies) that develop within and above
plant canopies are responsible for the net exchange of mass
(CO2, water vapour) and energy (heat) between the canopy
and the lower atmosphere. During the daytime, CO2 fluxes
represent the net exchange of carbon owing to canopy
photosynthesis (uptake) and ecosystem respiration (loss).Ecosystem respiration ( Re) comprises both autotrophic
(root, stems, leaves) and heterotrophic (soil microorganisms)
respiration and occurs continuously, but is the dominant CO2
flux at night.
Fluxes measured with EC systems are representative
of canopy exchanges integrated over areas ranging from
hundreds of hectares to many square kilometres. The
EC system considers the canopy as a single functional unit
and it integrates the complex interactions between organisms
in an ecosystem. Fluxes are calculated continuously, at
30- or 60-min intervals. This enables high-resolution
temporal sampling not possible by using inventoryapproaches, and integration of these fluxes over time enables
net daily, weekly, monthly, seasonal or annual exchanges of
carbon to be calculated. Such data can be used to assess
whether sites are sources or sinks of carbon, to validate
existing methods and to estimate parameters required by
models (Wang et al . 2001). Eddy covariance studies thus
provide data at temporal and spatial scales that yield process-
level understanding that is readily applicable to ecological
studies. In a recent review, Baldocchi (2003) f ound more than
800 peer-review papers associated with the EC method, with
a rapid increase in activity in the past decade.
The operation of EC systems has traditionally relied
on micrometeorologists and atmospheric scientists, but
technological advances now enable plant ecologists and
ecophysiologists to use this method as a tool in landscape
ecology and physiology. This paper provides information
for a general plant science audience on the nature of EC
methods and their utility in carbon accounting and as an
ecological tool in general. The paper briefly discusses
the theoretical basis of the method, recent advances in
instrumentation and the constraints of the method. These
themes will be illustrated by documenting the application of
the method at two contrasting tropical savanna ecosystems
of northern Australia, where it has been deployed to examine
carbon budgets.
Theoretical considerations
Turbulent motions are responsible for the net exchange of
mass (CO2, water vapour), momentum and energy between
the canopy and the lower atmosphere. Modern application
of the EC method (Baldocchi et al. 1988) is grounded in
the theory of fluid dynamics and micrometeorology (for an
introductory text, see Arya 2001), which provides a rigorous
physical description of mass and energy exchange. Initial
attempts at using EC theory to measure mass exchange have
been made over short crops under ideal conditions of flat
terrain and uniform crop structure (e.g. Swinbank 1951).
Early work focused on heat and momentum transfer between
crops and the lower atmosphere and were fundamental
to developing theory and instrumentation for the later
addition of CO2 flux measurements during the late 1960s
and early 1970s (Baldocchi 2003). The precision of theseearly estimates of CO2 fluxes were constrained by limits in
instrumentation stability and responsiveness, problems that
have largely been overcome with the recent development of
low-power, fast-response water vapour and CO2 analysers
and sonic anemometers for the measurement of the turbulent
three-dimensional wind components.
The physical principles involved with the EC technique
can be seen by examining an imaginary control volume
of air with sides 2 L and height h placed over a vegetated
surface (Fig. 1). Conservation of mass of quantity c, with
concentration cc, requires that the change in mass stored
in the volume is equal to the net (vector) sum of the massflowing through the walls of the volume. Under steady
conditions, there is no change of mass in the volume and so
the fluxes through the walls are in balance. With the further
restriction of horizontally homogeneous flow, the horizontal
fluxes <ucc> and <vcc> into and out of the end and side
walls of the volume are in balance, where u and v are the
horizontal velocities in the direction of the mean wind and
normal to it. The angle brackets indicate spatial averages
across the faces of the walls. Under steady, horizontally
homogenous conditions, net fluxes occur only in the vertical
direction and hence the flux into the base of the volume, plus
the net exchange of mass across all plant surfaces within the
volume, is equal to the spatially averaged vertical flux across
the upper surface, <wcc>, assuming this is above the tallest
vegetation and w is the vertical velocity. Measurements
across the ‘lid’ of the control volume thus provide the
desired net exchange between the underlying surface and
the atmosphere.
Measurements on a single tower cannot provide the
required spatial average across the upper surface of
the volume, so it is necessary to assume that air
flowing past the measurement point provides an adequate
sample of the motions responsible for the vertical
exchange across the lid. Under these circumstances, a
time-average vertical flux across the lid replaces the spatialaverage <wcc>=wcc, where the overbar indicates a time-
average. Micrometeorologists conventionally partition the
velocities and concentrations into mean and fluctuating
components so that w = w + w and cc = cc + cc and hence
the time-average flux is given by
F c = wcc = (w + w)(cc + cc) = w cc + wcc. (1)
The two terms containing averages of fluctuating
quantities are zero by definition and hence do not appear
in Equation 1. The vertical flux is thus the sum of two

7/27/2019 The Utility of the Eddy Covariance Techniques as a Tool in Carbon Accounting Tropical Savanna as a Case Study
http://slidepdf.com/reader/full/the-utility-of-the-eddy-covariance-techniques-as-a-tool-in-carbon-accounting 3/13
Eddy covariance techniques in carbon accounting Australian Journal of Botany 665
Fig. 1. A Cartesian control volume placed over a vegetated surface.
terms, one the product of the mean vertical velocity and
the mean concentration at height h, and the second, the
covariance between fluctuations in the vertical velocity w
and the concentration cc.
Prior to publication of the seminal paper by Webb
et al . (1980) (WPL hereafter), it was assumed that w = 0
and that the vertical turbulent flux density is simply
F c = wc
c
. WPL showed that the assumption that w = 0 is
not quite correct and neglect of this term in Equation 1 can
give significantly incorrect estimates of F c, particularly for
CO2 andother trace gases.The vertical velocity termcan only
be neglected when constituent c is measured as the mixing
ratio relative to dry air, χc, and then the flux is calculated
correctly as
F c = cd w χc, (2)
where cd is the molar density of dry air. Unfortunately,
instruments used to measure CO2 and water vapour typically
measure cc rather than χc so it is necessary to determine
w for use in Equation 1. WPL developed the necessary
theory, along with the steps needed to calculate the eddyfluxes of heat ( H ), water vapour ( E ) and CO2 ( F c). Further
information on the theoretical and practical aspects of
micrometeorological measurements may also be found in
Leuning and Judd (1996) and Leuning (2004).
When combined with standard meteorological
measurements (photosynthetically active radiation ( PAR),
wind speed, vapour pressure deficit (VPD), temperature,
atmospheric pressure)and structural descriptors of vegetation
(e.g. LAI , basal area, canopy height), the EC method provides
comprehensive datasets describing biotic fluxes and their
abiotic determinants. However, the method does have
limitations. Flux tower installations represent a significant
investment in infrastructure, including core sensors (3D
anemometer, gas analysers), associated meteorological
instrumentation and maintenance requirements, although
real costs have reduced considerably in the last 10 years.
Despite technological advances, instrument failure can be
frequent, especially duringperiods of extreme meteorological
conditions. As a result, site-specific gap-filling strategies
need to be employed to estimate missing flux data from
empirical models developed using periods with reliable data
that are correlated with meteorological variables (Papale and
Valentini 2003).
Eddy covariance measures can systematically
underestimate nocturnal respiration fluxes if cold-air
drainage flows occur under low wind speed, stable
atmospheric conditions (Aubinet et al . 2002), or when
averaging periods are too short to sample all the intermittent
motions contributing to the flux through the lid of the
control volume (Fig. 1). These errors can lead to large
long-term, systematic errors in ecosystem carbon budgets(Moncrieff et al . 1996), because annual net ecosystem
production ( NEP ) is the small difference between the two
large quantities of photosynthesis and respiration. For
example, Kruijt et al . (2004) calculated a two-fold range
in ecosystem respiration rate in an Amazonian rainforest,
depending on the method used to evaluate these fluxes. To
eliminate such errors, nocturnal fluxes are typically replaced
by empirical relationships between ecosystem respiration
and soil moisture and temperature. These relationships are
derived from flux measurements on windy nights, when

7/27/2019 The Utility of the Eddy Covariance Techniques as a Tool in Carbon Accounting Tropical Savanna as a Case Study
http://slidepdf.com/reader/full/the-utility-of-the-eddy-covariance-techniques-as-a-tool-in-carbon-accounting 4/13
666 Australian Journal of Botany L. B. Hutley et al.
there is good coupling between turbulence within and above
the canopy (Goulden et al . 1996).
As implied by Fig. 1 and Equation 1, eddy flux
measurements need to be made above relatively flat
terrain with uniform vegetation structure extending upwind
of the measurement location. For ecologists, this can
impose considerable limits on ecosystem types that can be investigated (e.g. ecosystems in mountainous terrain).
Measurements at non-ideal sites can systematically bias
flux estimates, with errors compounding when fluxes are
integrated over daily or annual time periods, temporal scales
of most interest to ecologists. However, recent theoretical
advances (Massman and Lee 2002) are improving our ability
to make satisfactory flux measurements under non-ideal
conditions (Baldocchi et al . 2000; Finnigan 2002). There is
also uncertainty relating to basic calculation of fluxes from
raw data and also post-processing algorithms, with debate
centring on the need to filter raw data and optimal averaging
times (e.g. 15, 30 or 60 min). Work on these problems iscontinuing (Finnigan et al . 2003).
While spatial heterogeneity places limitations on
micrometeorological methods, heterogeneity also poses
severe sampling challenges to traditional ecological
methods, and complete studies should include multiple
approaches to estimating carbon and water budgets as
mutual constraints.
Utility of eddy covariance as an ecological tool
Global systematic observations are essential to underpin
research to improve our understanding of ecosystems and
climate–earth systems (IPCC 2001). Modelling of these
systems is limited by our process-based understanding and
observational data. The EC method measures the ecosystem
response to environmental variations at time scales from
hours to years, providing valuable insight into the processes
controlling CO2 and water vapour exchange, as well as
ecosystem sensitivity to climate variability.
With the increasing focus on relationships between global
climate and the carbon cycle, ecological production indices
such as gross primary production (GPP ) and net primary
production ( NPP ), as used by ecologists, do not provide
a complete description of the terrestrial carbon cycle, as
they do not specifically include soil-derived fluxes or fluxes
associated with disturbance events. Soil carbon fluxes are akey component of global carbon balance and climate change
may have a large impact on shifts in soil carbon storage
(Valentini et al . 2000). As EC flux measurements represent
net exchange of CO2 from all sources and sinks within
an ecosystem, integration of daily flux measurements over
annual periods provides an estimate of the NEP , also called
net ecosystem exchange ( NEE ), which represents the net
annual ecosystem-scale exchange of carbon. NEP / NEE is a
measure of the carbon sequestration rate for an ecosystem
relative to the atmosphere, quantifying carbon accumulation
or loss. These quantities are related to the more commonly
used GPP and NPP as follows:
NPP = GPP − Ra
NEP = NPP − Rh
NBP = NEP −D (3)
where Ra and Rh are autotrophic and heterotrophicrespiration, respectively. NBP is the net biome production
(Steffen et al . 1998), which uses D, a measure of the loss
of carbon from an ecosystem because of disturbance agents,
such as fire and insect plagues. NBP represents carbon
fluxes over periods of decades to centuries that include
the relevant cycles of disturbance as opposed to annual
estimates, and reflects the mean return time or frequency
of disturbance events and their impact on the ecosystem
carbon balance.
Relationships between total ecosystem respiration, Re
(= Ra + Rh), and soil temperature and moisture can be
derived from nocturnal eddy fluxes (Falge et al . 2002), but Re can also be partitioned into Ra and Rh by using chambers
which measure soil, stem and leaf scale respiration. When
combined with site measures of stem increment, litter fall
and component respiration, EC data provide a complete
description of carbon fluxes between ecosystem carbon pools
and provide powerfuldatasetsto calibrate and validatecanopy
and ecosystem scale biogeochemistry models.
Much of the power of the EC technique as an ecological
tool comes from the ability to compare fluxes and cycling
across contrasting sites or across bioclimatic gradients.
For instance, Law et al . (2002) compared carbon and
water exchange over forest, grassland, crops and tundra,
and found global relationships between gross ecosystem
production and evapotranspiration. Similarly, Wilson et al .
(2002) examined the diurnal patterns of surface energy
and carbon fluxes across stations in Europe and North
America. They confirmed the dependence of the surface
energy balance on factors such as available radiant energy,
leaf area index, surface resistance to evapotranspiration,
atmospheric transport resistance, stomatal response to VPD
andadvection. They also found that the timing of peak carbon
uptake varied across climatic zones and that it was useful to
group ecosystems into plant functional types for evaluating
carbon exchanges (Falge et al . 2002).
The utility of the EC technique is fully realised when it iscoupled with other ecological, remote-sensing and modelling
methods. This suite of measurements provides a direct means
of testing carbon cycle, ecological and hydrological models.
Furthermore, EC fluxes can be used to improve algorithms
used to scale up from canopy to regional estimates of NEP
and evaporation (e.g. Eamus et al . 2001; Baldocchi et al .
2001; Wang and Barrett 2003; Isaac et al . 2004). Baldocchi
et al . (1996) recommended that this method be employed for
terrestrial ecosystems of the world to help close regional and
global carbon and water budgets.

7/27/2019 The Utility of the Eddy Covariance Techniques as a Tool in Carbon Accounting Tropical Savanna as a Case Study
http://slidepdf.com/reader/full/the-utility-of-the-eddy-covariance-techniques-as-a-tool-in-carbon-accounting 5/13
Eddy covariance techniques in carbon accounting Australian Journal of Botany 667
Traditional studies of ecosystem-scale carbon exchange
can offer complementary information and has involved the
collection of data related to component processes (e.g. leaf
photosynthesis, heterotrophic and autotrophic respiration,
stem or biomass increment, litter fall, root turnover). Rates
of CO2 exchange have been measured by using chambers
or cuvettes enclosing leaves, stems and soil. Such measurescan be scaled up in a ‘bottom-up’ approach, often via a
canopy model, to construct canopy- or stand-scale carbon
balance (McGuire et al . 2001). Scaling from point measures
of leaf, stem or soil gas exchange to canopy/stand scale
is problematic because characterisation of canopy-scale
gas exchange via chamber measurement limits spatial and
temporal sampling, and may not reflect the variation of
gas exchange within plant canopies (Roderick et al . 2001).
Leaf, soil and whole-tree chambers have been used to derive
environmental response functions that describe responses to
radiation, temperature, vapour pressure and soil moisture.
Moreover, chamber measurements tend to modify leaf,canopy (Denmead et al . 1993) or soil (Hooper et al . 2002)
microclimate and introduce biases (Davidson et al . 2002).
Denmead et al . (1993) found significant overestimation of
tree-scale CO2 assimilation rates, with water-use efficiency
overestimated by as much as 50% as measured by chambers
compared to micrometeorological methods. Canopy-scale
gas exchange models driven by leaf level data require
complex methods of scaling from leaf to canopy-scale fluxes
of heat and mass (Leuning et al . 1995). These include
spatial descriptions of canopy LAI , submodels describing
radiative and turbulent transfer through the canopy coupled
to submodels of photosynthesis and stomatal conductance
that are parameterised for both sunlit and shaded leaves
(DePury and Farquhar 1997; Wang and Leuning 1998;
Roderick et al . 2001).
Eddy covariance data can be used to derive
ecophysiological responses to radiation, temperature,
vapour pressure and soil moisture deficit. These functions
can be readily incorporated into ecosystem-scale physiology
models for calibration and verification. The need to capture
small-scale ecosystem complexity (leaf and microbial level)
can be reduced through the use of EC data. EC measurements
of canopy fluxes are of most value to models when they
are matched to the same scale (canopy-scale models). Such
canopy-scale models form the backbone of land-surfacemodels (Bonan et al . 2002) used in larger-scale climate and
earth-systems models (Blackmon et al . 2001).
Eddy covariance measurements provide a bridge between
these ‘bottom-up’ and ‘top-down’ approaches such as
satellite remote sensing (Anderson et al . 2004), air sampling
networks and inverse numerical methods (Kaminski and
Heimann 2001), which assess regional or global carbon
budgets. All these tools need to be utilised to provide an
integrated understanding of carbon cycling in ecosystems.
Data assimilation methods allow carbon fluxes to be
constrained through multiple data sources including short-
term canopy fluxes, longer-term carbon-pool measurements,
remote sensing and modelling. The utility of this technique is
detailed by Barrett et al . (2005, this issue) and will ultimately
allow more robust estimates of carbon balances across
a range of scales.
Application of EC in savannas of northern Australia
Two EC sites have been established in the tropical savannas
of northern Australia to examine patterns of carbon,
water and energy exchange as a function of climate and
land management. Tropical savannas of northern Australia
representabout 10%of the world’s savanna biome (Woinarski
et al . 2001). Given the size of this biome, the nature
of the dominant land-management practices that includes
frequent burning and pastoralism, which produce significant
greenhouse gas emission, there is a need for better
understanding of carbon stocks and fluxes in this region.
A frequent fire regime (Williams et al . 2002) and stronglyseasonal climate results in complex carbon dynamics (Chen
et al . 2003; Beringer et al . 2004) and generic productivity
models may not be appropriate for estimating carbon flux in
this ecosystem (see Barrett et al . 2005).
Savanna flux sites
Oursiteshave been establishedto representthe broad climatic
range of tropical savanna in northern Australia. Howard
Springs, near Darwin, Northern Territory, is a wet coastal
tropical savanna receiving an annual rainfall of 1750 mm
and is subjected to near-annual fire frequency (Hutley et al .
2000). By contrast, Virginia Park, Queensland, is a semi-
arid (670 mm annual rainfall) savanna site subjected to
heavy grazing pressure (Leuning et al . 2005). Continuous
flux measurements have been made at these two sites
since mid-2001 and provide key data describing seasonal
and interannual variation of savanna carbon exchange.
Comparative site data for the two savanna flux stations are
given in Table 1.
The Howard Springs site has been subjected to a
range of ecological studies over a 10-year period. It is
located within the Howard River catchment near Darwin,
with vegetation at this site representative of mesic open-
forest savanna, consisting of an overstorey dominated by
Eucalyptus tetrodonta (F.Muell.) and E. miniata (Cunn.ex Schauer). The understorey is dominated by C4 grasses
such as annual Sorghum and Heteropogon (Hutley et al .
2000). Flux measurements commenced at this site during
1997, with 10-day measurement campaigns conducted at
key periods during the strongly seasonal wet–dry climate
cycle (Hutley et al . 2000; Eamus et al . 2001). The EC
method was used to estimate annual evapotranspiration,
which was then combined with measurements of soil and
groundwater dynamics and streamflow data to construct a
catchment water balance for the Howard River catchment

7/27/2019 The Utility of the Eddy Covariance Techniques as a Tool in Carbon Accounting Tropical Savanna as a Case Study
http://slidepdf.com/reader/full/the-utility-of-the-eddy-covariance-techniques-as-a-tool-in-carbon-accounting 6/13
668 Australian Journal of Botany L. B. Hutley et al.
Table 1. Site features for the Howard Springs and Virginia Park flux sites
Characteristic Howard Springs, NT Virginia Park, Qld
Location 12◦1724S, 131◦524E 19◦5300S, 146◦3314E
Mean annual rainfall (mm) 1750 667
Mean annual temperatures 31.9/23.2 30.1/17.1
(max./min.,
◦
C)Soil texture Sands, sandy loams, red Kandosol Sandy loam, Alfisol
Vegetation type Open-forest savanna Low open-woodland savanna
Canopy species Eucalyptus tetrodonta, E. miniata, E. crebra, E. drepanophylla
Erythrophleum chlorostachys,
Terminalia ferdinandiana
Understorey species Sorghum spp., Heteropogon contortus Aristida spp., Eriachne spp.
Stand height (m) 14–16 5–8
Stem density (ha−1) 500–700 20–30
LAI , wet season 0.9/1.4 0.3/1.0
(overstorey/understorey)
LAI , dry season 0.6/0.02 0.3/0
(overstorey/understorey)
Land use Vacant crown land Pastoral lease
(Cook et al . 1998; Hutley et al . 2000). Daily carbon fluxes
from thesecampaigns were extrapolated to estimate an annual
NEP for the site with a sink of 2.8 t C ha−1 year −1 calculated
for the period 1997–1998 (Eamus et al . 2001). Improvements
in flux instrumentation in the late 1990s meant that near-
continuous flux measurements have been possible from 2001
to the present at the Howard Springs site. More recent work
has focused on the impacts of fire on carbon sink strength,
energy balance and feedback to meso-scale climate patterns
(Beringer et al . 2003; Williams et al . 2004). Chen et al .
(2003) used inventory methods at this and similar sites of theDarwin region and constructed a carbon balance for tropical
savanna; such studies provide valuable comparative data for
the eddy flux measurements.
In contrast to the mesic Howard Springs site, the Virginia
Park flux site is located in a heavily grazed semi-arid savanna,
40 km north-east of Charters Towers, in tropical northern
Queensland (Table 1). Vegetation at the Virginia Park site
consists of scattered E. crebra and E. drepanophylla trees
5–8 m tall, 30–40 m apart, with a visual estimate of LAI of 0.3
(Leuning et al .2005).AC4 grassyunderstorey is also present
duringthe November–April summer wetseason ( LAI < 1)but
extensive grazing results in little grass cover (dead or alive)
during the dry season. Soils surrounding the tower are alfisols
characterised by a marked contrast in texture, ranging from
sandy loams to clay loams in the A horizon, to heavy clays
in the B horizon. These deeply weathered soils are generally
low in nutrients (Mott et al . 1985).
Flux instrumentation
Eddy flux instruments were mounted above each savanna site
by using guyed towers, 23 and 27 m in height at the Howard
Springs and Virginia Park sites, respectively. Terrain at both
sites is flat (∼1◦ or less) with extensive fetch of savanna
vegetation in all directions from the towers and, as such, both
sites canbe considered to be near ideal for EC measures.Core
instrumentation at each site consists of open-pathinfrared gas
analysers that measure CO2 and water vapour concentrations
and sonic anemometers that measure turbulent wind vectors
and virtual air temperature. At the Howard Springs site, a
3D ultrasonic anemometer (CampbellScientific Inc.,CSAT3,
Campbell Scientific Inc.) is being used with a LI 7500
open-path CO2/H2O analyser (Licor Inc., Lincoln, USA). At
Virginia Park, an LI 7500 gas analyser is matched with atype HS sonicanemometer (GillInstruments Ltd, Lymington,
UK). At both sites, all flux variables are sampled at 20 Hz,
with 30- and 60-min mean fluxes calculated at the Howard
Springs and Virginia Park sites, respectively. All CO2 fluxes
are corrected for the effects of air density fluctuations arising
from sensible and latent heat fluxes (Webb et al . 1980).
Artificial neural network analyses (Papale and Valentini
2003) wereused at both sites to developgap-filling algorithms
and corrections to nocturnal CO2 fluxes (Baldocchi et al .
2000). Daily rainfall, air temperature, relative humidity and
soil moisture andsoil heat flux arealso measured at both sites.
Further details of instrumentation may be found in Beringer
et al . (2003) and Leuning et al . (2005). Daily estimates of
net carbon exchange from the contrasting mesic, tall-grass
savanna at Howard Springs and the semi-arid savanna site at
Virginia Park are available from March 2001 to March 2004,
and represent the most comprehensive mass and energy flux
database for any Australian ecosystem.
Seasonal patterns of energy and CO2 fluxes
Long-term flux data collection enables examination of the
responses of plant canopies to environmental drivers over
7/27/2019 The Utility of the Eddy Covariance Techniques as a Tool in Carbon Accounting Tropical Savanna as a Case Study
http://slidepdf.com/reader/full/the-utility-of-the-eddy-covariance-techniques-as-a-tool-in-carbon-accounting 7/13
Eddy covariance techniques in carbon accounting Australian Journal of Botany 669
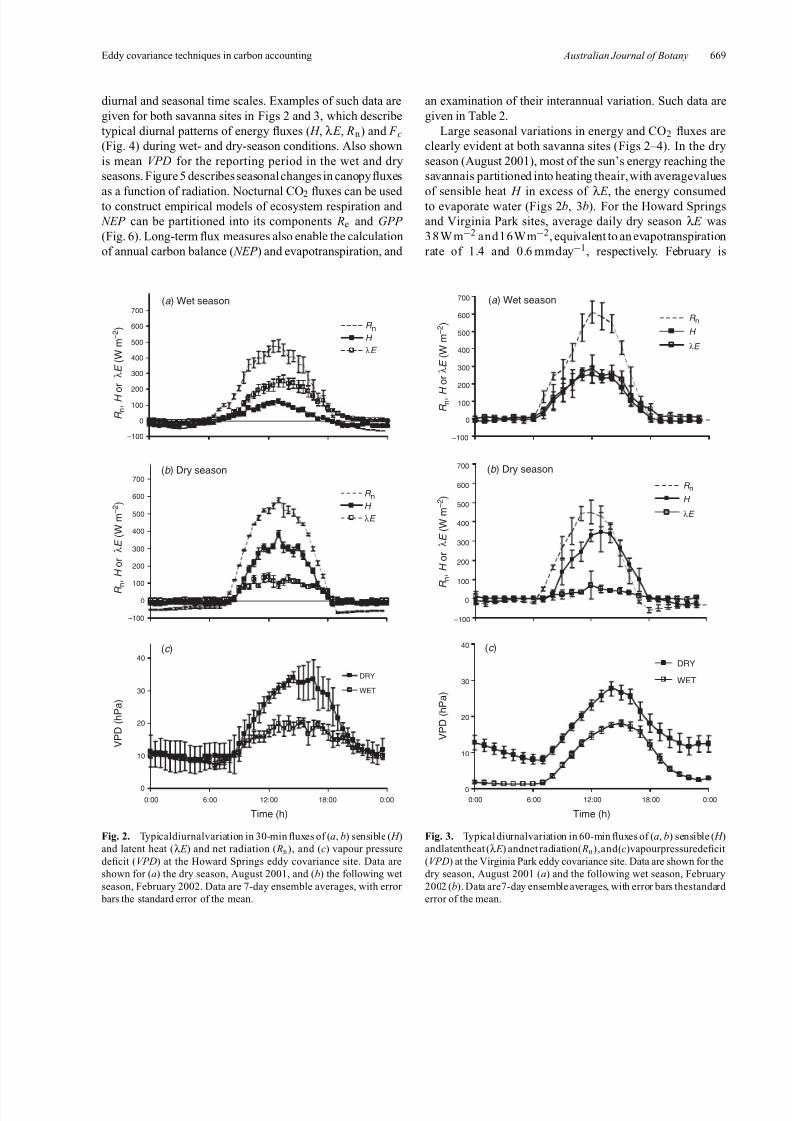
diurnal and seasonal time scales. Examples of such data are
given for both savanna sites in Figs 2 and 3, which describe
typical diurnal patterns of energy fluxes ( H , λ E , Rn) and F c(Fig. 4) during wet- and dry-season conditions. Also shown
is mean VPD for the reporting period in the wet and dry
seasons. Figure 5 d escribes seasonal changes in canopy fluxes
as a function of radiation. Nocturnal CO2 fluxes can be used to construct empirical models of ecosystem respiration and
NEP can be partitioned into its components Re and GPP
(Fig. 6). Long-term flux measures also enable the calculation
of annual carbon balance ( NEP ) and evapotranspiration, and
–100
0
100
200
300
400
500
600
700(b ) Dry season
–100
0
100
200
300
400
500
600
700
R n
H
λ E
(a ) Wet season
R n , H o r λ E ( W m
– 2 )
0
10
20
30
40
0:00 6:00 12:00 18:00 0:00
Time (h)
DRY
WET
V P D ( h P a )
(c )
R n , H o r
λ E ( W m
– 2 )
R n
H
λ E
Fig. 2. Typicaldiurnalvariation in 30-min fluxes of (a, b) sensible ( H )
and latent heat (λ E ) and net radiation ( Rn ), and (c) vapour pressure
deficit (VPD) at the Howard Springs eddy covariance site. Data are
shown for (a) the dry season, August 2001, and (b) the following wet
season, February 2002. Data are 7-day ensemble averages, with error
bars the standard error of the mean.
an examination of their interannual variation. Such data are
given in Table 2.
Large seasonal variations in energy and CO2 fluxes are
clearly evident at both savanna sites (Figs 2– 4). In the dry
season (August 2001), most of the sun’s energy reaching the
savannais partitioned into heating theair, with averagevalues
of sensible heat H in excess of λ E , the energy consumed to evaporate water (Figs 2b, 3b). For the Howard Springs
and Virginia Park sites, average daily dry season λ E was
3 8 W m−2 and16Wm−2, equivalent to an evapotranspiration
rate of 1.4 and 0.6 mmday−1, respectively. February is
–100
0
100
200
300
400
500
600
700
R n
H
λ E
R n
H
λ E
`
–100
0
100
200
300
400
500
600
700
0
10
20
30
40
(b ) Dry season
(a ) Wet season
R n , H
o r λ E ( W m
– 2 )
0:00 6:00 12:00 18:00 0:00
Time (h)
DRY
WET
V P D ( h P a )
(c )
R n , H o
r λ E ( W m
– 2 )
Fig. 3. Typical diurnalvariation in 60-min fluxes of (a, b) sensible ( H )
andlatentheat (λ E ) andnet radiation( Rn),and(c)vapourpressuredeficit
(VPD) at the Virginia Park eddy covariance site. Data are shown for the
dry season, August 2001 (a) and the following wet season, February
2002 (b). Data are7-day ensemble averages, with error bars thestandard
error of the mean.

7/27/2019 The Utility of the Eddy Covariance Techniques as a Tool in Carbon Accounting Tropical Savanna as a Case Study
http://slidepdf.com/reader/full/the-utility-of-the-eddy-covariance-techniques-as-a-tool-in-carbon-accounting 8/13
670 Australian Journal of Botany L. B. Hutley et al.
–20
–15
–10
–5
0
5
10
F c
( µ m o l m – 2 s
– 1 ) (a ) Wet season
–20
–15
–10
–5
0
5
10
00:00 06:00 12:00 18:00 00:00
Time (h)
(b ) Dry season
–20
–15
–10
–5
0
5
10
–20
–15
–10
–5
0
5
10
00:00 06:00 12:00 18:00 00:00
(c ) Wet season
(d ) Dry season
Fig. 4. Typical diurnalvariationin CO2 fluxesat(a, b) Howard Springs and(c, d ) VirginiaPark.Dataare for (a, c) thewetseason, February 2002,and (b, d ) the dry season, August 2001. Data are 7-day ensemble averages, with error bars the standard error of the mean. Negative values imply
net carbon uptake by the ecosystem, positive values imply a carbon source.
typically one of the wettest months in the wet–dry tropics of
northern Australia and this is reflected in wet-season rates of
λ E , which were more than double the dry-season rates. At
Howard Springs, peak λ E was 250 W m−2 and about two-
thirds of the available energy was used in evapotranspiration,
whereas at Virginia Park, peak λ E was 300Wm−2 and
available energy was partitioned almost equally between
H and λ E (Figs 2a, 3a). Despite a lower wet-season LAI
at Virginia Park (Table 1), the mean evapotranspirationrate was 3.5 mm day−1, compared with the 2.8 mm day−1
observed at Howard Springs for this same period. Higher
wet-season evapotranspiration rates at Virginia Park were
due to more net radiation for the reporting period (cf.
Figs 2a, 3a). The daily integral of Rn at Virginia Park was
14.2 MJday−1, compared with 10.7 MJ day−1 at Howard
Springs, caused by greater cloud cover associated with the
northern Australian monsoon. While Rn was 33% greater at
VirginiaPark than at Howard Springs, evapotranspiration was
only 25% higher. The discrepancy resulted from lower VPDs
in early morning and late afternoon at Virginia Park (cf.
Figs 2c, 3c) which contributed to lower evapotranspiration
rates than at Howard Springs at those times. Peak daytime
values of VPD were similar at both sites.
Large seasonal differences in CO2 fluxes were also
evident at both sites (Fig. 4). By the micrometeorological
convention, negative values of F c represent a net downward
flux of CO2 from the atmosphere to the ecosystem, via
uptake from photosynthesis. Daily maximal values of F cexceeded −15µmolm−2 s−1 during the wet season at both
sites (Fig. 4a, c), close to wet-season rates observed in
savannas in Africa (Hanan et al . 1998; Verhoef et al . 1996;
Monteny et al . 1997) and South America (Miranda et al .
1997). At Virginia Park, daily averaged F c for the wet season
was−2.35µmolCO2 m−2 s−1, correspondingto a netuptake
of −2.4gC m−2 day−1. Fluxes were close to zero during
the dry season, when soil moisture availability was low
(Fig. 4d ) and the ecosystem was essential carbon ‘neutral’,
with a net flux of +0.02gCm−2 day−1, a small net loss

7/27/2019 The Utility of the Eddy Covariance Techniques as a Tool in Carbon Accounting Tropical Savanna as a Case Study
http://slidepdf.com/reader/full/the-utility-of-the-eddy-covariance-techniques-as-a-tool-in-carbon-accounting 9/13
Eddy covariance techniques in carbon accounting Australian Journal of Botany 671
y = –0.002x + 0.109
R 2
= 0.366
y = –0.02x + 6.63
R 2
= 0.93
–20
–15
–10
–5
0
5
10
0 500 1000 1500 2000
PFD (µmol m–2 s–1)
Wet
Dry
F c
( µ m o l m – 2 s
– 1 )
Fig. 5. Relationship between 30-min average CO2 flux ( F c) and PFD
for theHoward Springs site for the wet- (February 2001) anddry-season
(August 2001) measurement periods.
of CO2 to the atmosphere. Seasonal variations in F c were
also evident at the Howard Springs site (Fig. 4a, b) where
the daily integral of F c was −1.07gCm−2 day−1 during
the wet season. This C sink was maintained into the dry
season with F c at −0.23gCm−2 day−1 for the August 2001
reporting period.
Like λ E , wet-season magnitudes of F c at Virginia
Park were higher than those observed at Howard Springs,
despite a lower LAI . This could be explained by lower radiation at Howard Springs than at Virginia Park, although
mid-day maximal rates of F c were similar at both sites
(Fig. 4a, c). However, the average nocturnal respiration rate
was approximately 35% higher at Howard Springs than at
Virginia Park (Fig. 4a, c) and the larger treesizeanddensity at
Howard Springs (Table 1) resulted in an increased respiration
for this site compared with Virginia Park. This reduced the
daily net CO2 uptake, despite similar rates of canopy uptake
during the daytime.
Table 2. Annual water and carbon budgets for Virginia Park (VP) and Howard Springs (HS) sites for the two
hydrological years between July 2001 and June 2003GPP , gross primary production. NEP , net ecosystem production. Here GPP is given as a negative value representing
carbon uptake by the ecosystem. GPP = F c− Re, where Re is ecosystem respiration. NEP = F c, so a negative sign
indicates net uptake of carbon by the ecosystem, positive a net source of carbon. NEP is calculated with 24-h fluxes.
The data for these years at Howard Springs include the impact of fire. See Table 3 f or details
Period Site Rainfall Evapotranspiration GPP NEP
(mmyear −1) (mm year −1) (t C ha−1 year −1) (t C ha−1 year −1)
Jul 2001–Jun 2002 VP 571 540 −5.76 +0.21
HS 1699 978 −16.8 −0.7
Jul 2002–Jun 2003 VP 360 388 −1.82 +0.49
HS 1487 892 −18 −1.64
–25
–20
–15
–10
–5
0
5
10
0:00 6:00 12:00 18:00 0:00
Time (h)
C O 2 f l u x ( µ m o l m
– 2 s
– 1 )
GPP
Re
Fc
Fig. 6. Component fluxes ( F c, Re, GPP ) derived fromeddy covariance
data from the Howard Springs site during the early wet season16–29 December 2001. Data are 13-day ensemble averages, with error
bars the standard error of the mean.
Flux data can also be used to develop ecophysiological
response functions to radiation, temperature, vapour pressure
and soil moisture deficit. An example is given in Fig. 5,
which shows a strong relationship between F c and above-
canopy radiation for the Howard Springs site. Available soil
moisture decreasesas the dry season progresses(Hutley et al .
2000) and both the slope and intercept of this relationship
are significantly different, suggesting that the radiation-use
efficiency and LAI of the ecosystem changes with season
(Fig. 5). Such functions are fundamental drivers of canopy
physiology models and provide powerful data for model
calibration and validation.
Annual productivity estimates
Continuous EC measurements of λ E and F c enable the
calculation of annual water and carbon balances. An
example is given in Table 2 for the savanna sites for two
hydrological years, July 2001–June 2003. At Virginia Park,

7/27/2019 The Utility of the Eddy Covariance Techniques as a Tool in Carbon Accounting Tropical Savanna as a Case Study
http://slidepdf.com/reader/full/the-utility-of-the-eddy-covariance-techniques-as-a-tool-in-carbon-accounting 10/13
672 Australian Journal of Botany L. B. Hutley et al.
rainfall in the 2001–2002 wet season was just below the
long-term average but rainfall in the subsequent wet season
was in the lowest 15th percentile (Leuning et al . 2005).
Rainfall and evapotranspiration were in close balance for
the 2 years shown, but low rainfall and evapotranspiration in
the second wet season caused a strong reduction in daytime
GPP compared with the first year. Despite these largedifferences in GPP , there was a small net loss of carbon
by the ecosystem in both years, largely because carbon
uptake in the wet season is dominated by the C4 grass
understorey (Eamus et al . 2001) and this is subsequently
lost through heavy grazing by cattle and by plant respiration.
These results also suggest little or no net carbon gain by
the trees during the reporting period. It is likely that the
duration of high F c during the wet season at Virginia Park
site would be short-lived, constrained by the short duration
of available moisture given the low annual rainfall. The
wetter Howard Springs site was a net carbon sink on an
annual basis (Table 2), despite having lower wet-season peak F c than Virginia Park during the reporting period and the
occurrence of frequent fire (Table 3). Ability to compare
such differences at various sites underlines the utility of
long-term flux measurements in gaining greater
understanding of carbon cycling within ecosystems.
This is especially important in seasonal ecosystems such as
savannas, which are subject to large inter-annual variation
in the timing, duration and size of wet seasons (Cook
and Heerdegen 2001). Short-term measurements may not
adequately capture variation in fluxes associated with the
dynamics of climate.
The EC method is being used at the Howard Springs site
to investigate the effects of fire on energy balance, surface
albedo and carbon dynamics. Up to 75% of all fires in
Australia occur in the savanna and fire is one of the most
significant ecological determinants of savanna form and
function (Williams et al . 2002). Key questions concern the
effects of frequent dry-season fires on savanna productivity,
resultant greenhouse gas emissions and impacts on the
Table 3. Estimates of NEP (excluding fire) and NBP
(tCha−1 year−1) for the Howard Springs site, based on 2 years
of flux measurements that include fire events and previous
measurements without fire events included
NBP is calculated assuming fire occurrence of two in every 3 years.The calculated mean includes the value of NEP for the 2 years with
fire and the NEP value of Eamus et al . (2001), which was estimated
by using fluxes made during fire-free periods
Parameter 2001–2002 2002–2003 Eamus et al . (2001)
Re +16.1 +15.6
GPP −16.8 −18.0
NEP −0.7 −2.6 −2.81
Fire losses +0.52 +0.96
NEP —fire −0.18 −1.64
NBP Average of 2 values=−1.54
atmosphere from smoke, changes in albedo and energy
partitioning (Beringer et al . 2003). Fluxes prior, during and
afterindividual fire events have beenmonitored at the Howard
Springs site since 2001 and have provided data on carbon
sink strength following fire (Table 3). Annual production
indices GPP , NEP and NBP have been calculated for
2001–2003 and data can be compared with findings of Eamus et al . (2001) who provided an NEP estimate at
the Howard Springs site without the effects of fire. Data
given in Table 3 suggest that fire reduces net biome
productivity by at least 50%. Howard Springs remains a
weak carbon sink despite frequent burning, in contrast
to Virginia Park, which is essentially carbon neutral or
a small source of carbon to the atmosphere, with annual
productivity more determined by annual rainfall and
grazing pressure. Fire is absent at Virginia Park owing to
reduced fuel loads caused by grazing. The flux data provide
insights into factors contributing to carbon sink strength
( NEP/NBP ) as a function of climate (rainfall) and land management (fire frequency and grazing), with assessment
of seasonal and interannual variability of these factors
also possible.
Utility of eddy covariance in carbon accounting
Carbon accounting can be broadly defined as the
quantification of changes to carbon stocks, via emissions or
sinks, usingconsistent and transparent methods (IPCC 2001).
The Kyoto Protocol, as it is currently defined, provides for the
calculation of sinks in restricted ‘Kyoto’ forests during non-
contiguouscommitment periods. As such, the KyotoProtocol
is essentially a ‘partial’ carbon accounting system. A more
rigorous or full carbon accounting system would quantify all
atmospheric exchanges of CO2 from both autotrophic and
heterotrophic components of an ecosystem ( NEP ) and would
be applied continuously (Steffen et al . 1998). Monitoring of
biomass increment alone ( NPP ) is insufficient as it does not
account for carbon loss from soils and longer-term net biome
production ( NBP ) which include losses via disturbance
which also require quantification (Schulze et al . 2000).
Implementing full carbon accounting represents a major
challenge but would provide a more effective means of
understanding and managing terrestrial carbon cycling and
greenhouse emissions.Although Australia has not ratified the
Kyoto Protocol, the Australian Government has developed the National Carbon Accounting System (NCAS) to provide
data on terrestrial carbon cycling for Australian ecosystems,
in particular, focusing on greenhouse gas sources and sinks
as a result of land-use change. The NCAS system uses the
FullCAM model (Richards 2001), which is a full carbon-
accounting model with a range of empirical submodels that
calculates exchanges of carbon, loss and uptake between
the terrestrial ecosystems and the atmosphere. Impacts of
land-management practices (e.g. fire, harvest and thinning,
tillage) on carbon pools and fluxes in forest, agricultural and

7/27/2019 The Utility of the Eddy Covariance Techniques as a Tool in Carbon Accounting Tropical Savanna as a Case Study
http://slidepdf.com/reader/full/the-utility-of-the-eddy-covariance-techniques-as-a-tool-in-carbon-accounting 11/13
Eddy covariance techniques in carbon accounting Australian Journal of Botany 673
transitional (afforestation, reforestation, deforestation) sites
can also be modelled (Richards 2001). FullCAM has been
used to predict changes to soil organic carbon pools under a
range of afforestation scenarios (Paul et al . 2003) and rates
of litter decomposition under Australian conditions (Paul
and Polglase 2004), but requires further verification,
especially in tropical environments. Under a full carbonaccounting and trading environment, there is potential
for changes in land management in Australian savannas
that result in carbon sinks to be claimed as carbon
credits. For instance, a measurable and documented
decrease in human-induced CO2 emissions via changed
fire or grazing management could be counted in future
trading schemes.
Given the requirements of partial and possibly full
carbon accounting in the future, the EC method would
appear to provide a useful tool for quantification and
verification of ecosystem sink strength, given its ability
to monitor NEP / NBP directly and non-destructively and provide estimates of NPP and GPP . Advances of the last two
decades have enabled modern EC systems, at ideal sites, to
estimate CO2 fluxes, evapotranspiration and carbon balance
witherrorsoflessthan10%(Baldocchi 2003). Improvements
in flux technology will foster collaborative research between
flux scientists and ecologists, plant physiologists, modellers,
remote sensors and, it is hoped, land managers and
policy makers. Such synergies between some of these
research disciplines are evident with the development of
international research networks, such as Fluxnet (Baldocchi
et al . 2001, http://daac.ornl.gov/FLUXNET). This is a
global network of flux towers of over 250 registered
sites that are monitoring long-term carbon fluxes,
providing key data examining climatic controls and
interannual variability of mass and energy exchange from
terrestrial ecosystems.
Given the scale and number of measurements being made
as part of this international network, estimates of NEP and
NBP are possible for a suite of natural and agricultural
ecosystems, with integration providing quantification of the
global terrestrial carbon sink. Large uncertainties associated
with the size of this sink remain and such networks provide a
powerful approach to reduce such uncertainty. Major regional
networks include Ameriflux (America—71 towers), Europe
(CarboEurope—39), Canada (Fluxnet-Canada—21),Asia (AsiaFlux—41) Australia (Ozflux—5) and Africa
(Afriflux—6). At the time of writing, there are five flux
sites within the Australia network (Ozflux) and clearly
more investment in this network is required. For tropical
savanna of northern Australia, advances have been made
in quantifying carbon flux (Eamus et al . 2001; Leuning
et al . 2005), impacts of disturbance (Beringer et al . 2004;
Williams et al . 2004) and carbon stocks (Chen et al .
2003; Williams et al . 2005, this issue), with measurements
on-going. Full carbon accounting within this ecosystem
could be made with more confidence than for most
Australian ecosystems.
Ideally, multiscale methods and models are required to
quantify the carbon budget. Studies are needed that combine
measurements of process at plant and stand scales (e.g.
soil, stem and leaf respiration), fluxes at canopy scale
through to regional- and even continental-scale estimatesemploying measurements of CO2 in the planetary boundary
layer and inversion modelling methods (House et al . 2003;
Xiao et al . 2004). No single method provides data on
the numerous terms of the carbon balance in terrestrial
ecosystems at all scales from the local to global. Networks
such as Fluxnet and EUROFLUX (Valentini 2003) provide
a collaborative mechanism, with participants working on
problems at all required scales and such groups may provide
integrated, verifiable and transparent methods for improved
understanding of carbon cycling in terrestrial ecosystems
and the implementation of more meaningful full carbon
accounting systems.
References
Anderson MC, Norman JM, Mecikalski JR, Torn RD, Kustas WP,
Basara JB (2004) A multiscale remote sensing model for
disaggregating regional fluxes to micrometeorological scales.
Journal of Hydrometeorology 5, 343–363.
doi: 10.1175/1525-7541(2004)005<0343:AMRSMF>2.0.CO;2
Arya P (2001) ‘Introduction to micrometeorology.’ (Academic Press:
San Diego, CA)
Aubinet M, Heinesch B, Longdoz B (2002) Estimation of the carbon
sequestration by a heterogeneous forest: night flux corrections,
heterogeneity of the site and inter-annual variability. Global Change
Biology 8, 1053–1071.
doi: 10.1046/j.1365-2486.2002.00529.xBaldocchi DD, Hicks BB, Meyers TP (1988) Measuring biosphere–
atmosphere exchanges of biologically related gases with
micrometeorological methods. Ecology 69, 1331–1340.
Baldocchi D, Valentini R, Running S, Oechel W, Dahlman R (1996)
Strategies for measuring and modelling carbon dioxide and water
vapour fluxes over terrestrial ecosystems. Global Change Biology
2, 159–168.
Baldocchi DD, Finnigan JJ, Wilson KW, Paw UKT, Falge E (2000)
On measuring net ecosystem carbon exchange in complex terrain
over tall vegetation. Boundary-Layer Meteorology 96, 257–291.
doi: 10.1023/A:1002497616547
Baldocchi D, Falge E, Gu LH, Olson R, Hollinger D, Running S,
Anthoni P, Bernhofer C, Davis K, Evans R, Fuentes J, Goldstein A,
Katul G, Law B, Lee XH, Malhi Y, Meyers T, Munger W, Oechel W,
U KTP, Pilegaard K, Schmid HP, Valentini R, Verma S, Vesala T,Wilson K, Wofsy S (2001) FLUXNET: a new tool to study the
temporal and spatial variability of ecosystem-scale carbon dioxide,
water vapor, and energy flux densities. Bulletin of the American
Meteorological Society 82, 2415–2434.
Baldocchi DD (2003) Assessing the eddy covariance technique
for evaluating carbon dioxide exchange rates of ecosystems,
past, present and future. Global Change Biology 9, 479–492.
doi: 10.1046/j.1365-2486.2003.00629.x
Barrett D, Hill M, Hutley LB, Beringer J, Xu J, Cook GD, Carter J,
Williams RJ (2005) Prospects for improving savanna biophysical
models using multiple-constraints model-data assimilation
methods. Australian Journal of Botany 53, 689–714.

7/27/2019 The Utility of the Eddy Covariance Techniques as a Tool in Carbon Accounting Tropical Savanna as a Case Study
http://slidepdf.com/reader/full/the-utility-of-the-eddy-covariance-techniques-as-a-tool-in-carbon-accounting 12/13
674 Australian Journal of Botany L. B. Hutley et al.
Beringer J, Hutley LB, Tapper NJ, Coutts A, Kerley A, O’Grady AP
(2003) Fire impacts on surface heat, moisture and carbon fluxes
from a tropical savanna in north Australia. International Journal of
Wildland Fire 12, 333–340. doi: 10.1071/WF03023
Beringer J, Hutley LB, Tapper NJ (2004) Savanna fires and
their impact on net ecosystem productivity, 26th conference
on agricultural and forest meteorology, 23–27 August,
Vancouver, BC, Canada. Paper 4.6 (http://ams.confex.com/ams/AFAPURBBIO/techprogram/paper 79342.htm).
Blackmon M, Boville B, Bryan F, Dickinson R, Gent P, Kiehl J,
Moritz R, Randall D, Shukla J, Solomon S, Bonan G, Doney S,
Fung I, Hack J, Hunke E, Hurrell J, Kutzbach J, Meehl J,
Otto-Bliesner B, Saravanan R, Schneider EK, Sloan L, Spall M,
Taylor K, Tribbia J, Washington W (2001) The Community Climate
System Model. Bulletin of the American Meteorological Society
82, 2357–2376.
doi: 10.1175/1520-0477(2001)082<2357:TCCSM>2.3.CO;2
Bonan GB, Oleson KW, Vertenstein M, Levis S, Zeng XB, Dai YJ,
Dickinson RE, Yang ZL (2002) The land surface climatology of the
community land model coupled to the NCAR community climate
model. Journal of Climate 15, 3123–3149.
doi: 10.1175/1520-0442(2002)015<3123:TLSCOT>2.0.CO;2
Chen X, Hutley LB, Eamus D (2003) Carbon balance of a
tropical savanna of northern Australia. Oecologia 137, 405–416.
doi: 10.1007/s00442-003-1358-5
Cook GD, Heerdegen RG (2001) Spatial variation in the duration of
the rainy season in monsoonal Australia. International Journal of
Climatology 21, 1723–1732. doi: 10.1002/joc.704
Cook PG, Hatton TH, Pidsley D, Herczeg AL, Held A, O’Grady A
(1998) Water balance of a tropical woodland ecosystem, northern
Australia: a combination of micro-meteorological, soil physical
and groundwater chemical approaches. Journal of Hydrology
210, 161–177.
doi: 10.1016/S0022-1694(98)00181-4
Davidson EA, Savage K, Verchot LV, Navarro R (2002) Minimizing
artefacts and biases in chamber-based measurements of soil
respiration. Agricultural and Forest Meteorology 113, 21–37.doi: 10.1016/S0168-1923(02)00100-4
Denmead OT, Dunin FX, Wong SC, Greenwood EAN (1993)
Measuring water use efficiency of eucalypt trees with chambers
and micrometeorological techniques. Journal of Hydrology 150,
649–664. doi: 10.1016/0022-1694(93)90130-2
DePury DGG, Farquhar GD (1997) A commentary on the use of a
sun/shade model to scale from the leaf to a canopy. Agricultural
and Forest Meteorology 95, 257–260.
doi: 10.1016/S0168-1923(99)00038-6
Eamus D, Hutley LB, O’Grady AP (2001) Daily and seasonal patterns
of carbon and water fluxes above a north Australian savanna. Tree
Physiology 21, 977–988.
Falge E, Baldocchi D, Tenhunen J, Aubinet M, Bakwin P, Berbigier P,
Bernhofer C, Burba G, Clement R, Davis KJ, Elbers JA,
Goldstein AH, Grelle A, Granier A, Guomundsson J, Hollinger D,Kowalski AS, Katul G, Law BE, Malhi Y, Meyers T, Monson RK,
MungerJW, Oechel W, Paw KT, Pilegaard K, RannikU, Rebmann C,
Suyker A, Valentini R, Wilson K, Wofsy S (2002) Seasonality of
ecosystem respiration and gross primary production as derived from
FLUXNET measurements. Agricultural and Forest Meteorology
113, 53–74.
Finnigan J (2002) Momentum transfer to complex terrain. Geophysical
Monograph Series 129, 285–300.
Finnigan JJ, Clement R, Malhi Y, Leuning R, Cleugh HA (2003) A
re-evaluation of long-term flux measurements techniques part I,
averaging and coordinate rotation. Boundary-Layer Meteorology
107, 1–48. doi: 10.1023/A:1021554900225
Goulden ML, Munger WJ, Fan SM, Daube BC, Wofsy SC
(1996) Measurements of carbon sequestration by long-term eddy
covariance: methods and a critical evaluation of accuracy. Global
Change Biology 2, 69–182.
Hanan NP, Kabat P, Dolman JA, Elbers JA (1998) Photosynthesis and
carbonbalanceof a Sahelian fallow savanna.GlobalChange Biology
4, 523–538. doi: 10.1046/j.1365-2486.1998.t01-1-00126.x
HouseJI, PrenticeIC, Ramankutty N,HoughtonRA, Heimann M (2003)Reconciling apparent inconsistencies in estimates of terrestrial
CO2 sources and sinks. Tellus. Series B, Chemical and Physical
Meteorology 55, 345–363.
Hooper DU, Cardon ZG, Chapin FS, Durant M (2002) Corrected
calculations for soil and ecosystem measurements of CO2 flux using
the LI-COR 6200 portable photosynthesis system. Oecologia 132,
1–11. doi: 10.1007/s00442-002-0870-3
Hutley LB, O’Grady AP, Eamus D (2000) Evapotranspiration from
eucalypt open-forest savanna of Northern Australia. Functional
Ecology 14, 183–194. doi: 10.1046/j.1365-2435.2000.00416.x
Isaac PR, Leuning R, Hacker JM, Cleugh HA, Coppin PA,
Denmead OT, Raupach MR (2004) Estimation of regional
evapotranspiration by combining aircraft and ground-based
measurements. Boundary-Layer Meteorology 110, 69–98.
doi: 10.1023/A:1026054317990
IPCC (2001) IPCC Third Assessment Report. Climatic Change.
Intergovernmental Panel on Climate Change, Geneva,
Switzerland.
Kaminski T, Heimann M (2001) Inverse modeling of atmospheric
carbon dioxide fluxes. Science 294, 259.
doi: 10.1126/science.294.5541.259a
Kruijt B, Elbers JA, von Randow C, Araujo AC, Oliveira PJ,
Culf A, Manzi AO, Nobre AD, Kabat P, Moors EJ (2004) The
robustness of eddy correlation fluxes for Amazon rain forest
conditions. Ecological Applications 14, S101–S113.
Law BE, Falge E, Gu L, Baldocchi DD, Bakwin P, Berbigier P,
Davis K, Dolman AJ, Falk M, Fuentes JD, Goldstein A, Granier A,
Grelle A, Hollinger D, Janssens IA, Jarvis P, Jensen NO, Katul G,
Mahli Y, Matteucci G, Meyers T, Monson R, Munger W, Oechel W,Olson R, Pilegaard K, Paw KT, Thorgeirsson H, Valentini R,
Verma S, Vesala T, Wilson K, Wofsy S (2002) Environmental
controls over carbon dioxide and water vapor exchange
of terrestrial vegetation. Agricultural and Forest Meteorology
113, 97–120. doi: 10.1016/S0168-1923(02)00104-1
Leuning R (2004) Measurements of trace gas fluxes in the
atmosphere using eddy covariance, WPL corrections revisited.
In ‘Handbook of micrometeorology, a guide for surface
flux measurements and analysis’. (Eds X Lee, W Massman,
B Law) pp. 119–132. (Kluwer Academic Publishers: Dordrecht,
The Netherlands)
Leuning R, JuddMJ (1996) The relative meritsof open- andclosed-path
analysers for measurements of eddy fluxes. Global Change Biology
2, 241–253.
Leuning R, Kelliher FM, DePury DGG, Schulze E-D (1995) Leaf nitrogen photosynthesis conductance and transpiration scaling
from leaves to canopies. Plant, Cell & Environment 18,
1183–1200.
Leuning R, Cleugh HA, Zegelin S, Hughes D (2005) Carbon and water
fluxes over a temperate Eucalyptus forest and a tropical wet/dry
savanna in Australia: measurements and comparison with MODIS
remote sensing estimates. Agricultural and Forest Meteorology 129,
151–173.
Massman WJ, Lee X (2002) Eddy covariance flux corrections
and uncertainties in long-term studies of carbon and energy
exchanges. Agricultural and Forest Meteorology 113, 121–144.
doi: 10.1016/S0168-1923(02)00105-3

7/27/2019 The Utility of the Eddy Covariance Techniques as a Tool in Carbon Accounting Tropical Savanna as a Case Study
http://slidepdf.com/reader/full/the-utility-of-the-eddy-covariance-techniques-as-a-tool-in-carbon-accounting 13/13
Eddy covariance techniques in carbon accounting Australian Journal of Botany 675
McGuire AD, Sitch S, Clein JS, Dargaville R, Esser G, Foley J,
Heimann M, Joos F, Kaplan J, Kicklighter DW, Meier RA,
Melillo JM, Moore B, Prentice I, Ramankutty N, Reichenau T,
Schloss A, Tian H, Williams LJ, Wittenberg U (2001) Carbon
balance of the terrestrial biosphere in the twentieth century: analyses
of CO2, climate and land use effects with four process-based
ecosystem models. Global Biogeochemical Cycles 15, 183–206.
doi: 10.1029/2000GB001298Miranda AC, Miranda HS, Lloyd J, Grace J, Francey RJ, McIntyre JA,
Meir P, Riggan P, Lockwood R, Brass J (1997) Fluxes of carbon,
water and energy over Brazilian cerrado: an analysis using eddy
covariance and stable isotopes. Plant, Cell & Environment 20,
315–328. doi: 10.1046/j.1365-3040.1997.d01-80.x
Moncrieff JB, Malhi Y, Leuning R (1996) The propagation of errors in
long-term measurements of land-atmosphere fluxes of carbon and
water. Global Change Biology 2, 231–240.
Monteny BA, Lhomme JP, Cehbouni A, Troufleau D, Amado M,
Sicot M, Verhoef A, Galle S, Said F, Lloyd CR (1997) The role
of the Sahelian biosphere on the water and the C cycle during
the HAPEX–Sahel experiment. Journal of Hydrology 188–189,
516–535. doi: 10.1016/S0022-1694(96)03191-5
Mott JJ, Williams J, Andrew MH, Gillison AN (1985) Australian
savanna ecosystems. In ‘Ecology and management of the world’ssavannas’. (Eds JC Tothill, JJ Mott)(Australian Academyof Science:
Canberra)
Papale D, Valentini A (2003) A new assessment of European
forests carbon exchanges by eddy fluxes and artificial neural
network spatialization. Global Change Biology 9, 525–535.
doi: 10.1046/j.1365-2486.2003.00609.x
Paul KI, Polglase PJ (2004) Prediction of decomposition of litter under
eucalypts and pines using the FullCAM model. Forest Ecology and
Management 191, 73–92.
doi: 10.1016/j.foreco.2003.11.007
Paul KI, Polglase PJ, Richards GP (2003) Sensitivity analysis of
predicted change in soil carbon following afforestation. Ecological
Modelling 164, 137–152. doi: 10.1016/S0304-3800(03)00027-9
Richards GP (2001) The FullCAM carbon accounting model:
development, calibration and implementation for the National
Carbon Accounting System, National Carbon Accounting
System Technical Report No. 28, Australian Greenhouse Office,
Canberra.
Roderick ML, Farquhar GD, Berry SL, Noble IR (2001) On
the direct effect of clouds and atmospheric particles on the
productivity and structure of vegetation. Oecologia 129, 21–30.
doi: 10.1007/s004420100760
Schulze E-D, WirthC, Heimann M (2000)Managing forests afterKyoto.
Science 289, 2058–2059.
doi: 10.1126/science.289.5487.2058
Steffen W, Noble I, Candell J, Apps M, Schulze E-D, Jarvis PG,
Baldocchi DD, Ciais P, Cramer W, Ehleringer J, Farquhar G,
Field CB, Ghazi A, Gifford R, Heimann M, Houghton R,
Kabat P, K orner C, Lambin E, Linder S, Mooney HA,
Murdiyarso D, Post WM, Prentice IC, Raupach M, Schimel DS,
Shivdenko A, Valentini R (1998) The terrestrial carbon cycle
implications for the Kyoto Protocol. Science 280, 1393–1394.
doi: 10.1126/science.280.5368.1393
Swinbank WC (1951) The measurement of vertical transfer of heat
and water vapor by eddies in the lower atmosphere. Journal of
Meteorology 8, 135–145.
Valentini R (2003) EUROFLUX:an integrated network for studying the
long-term responses of biospheric exchanges. In ‘Fluxes of carbon,
water and energy of European forests’. (Ed. R Valentini) pp. 1–8.
(Springer: Berlin)
Valentini R, Matteucci G, Dolman AJ, Schulze E-D, Rebmann C,
Granier A, Gross P, Jensen NO, Pilegaard K, Grelle A,
Bernhofer C, Grunwald T, Kowalski AS, Vesala T, Rannik U,
Berbigier P, Loustau D, Guomundsson J, Thorgeirsson H,
Ibrom A, Morgenstern K, Clement R, Moncrieff J, Montagnani L,
Minerbi S, Jarvis PG (2000) Respiration as the main determinant
of carbon balance in European forest. Nature 404, 861–865.
doi: 10.1038/35009084Verhoef A, Allen SJ, De Bruin HAR, Jacobs CMJ, Heusinkveld BG
(1996) Fluxes of carbon dioxide and water vapour from a
Sahelian savanna. Agricultural and Forest Meteorology 80,
231–248. doi: 10.1016/0168-1923(95)02294-5
Wang Y-P, BarrettDJ (2003)Estimatingregionalterrestrial carbon fluxes
for the Australian continent using a multiple constraint approach. I.
Using remotely sensed data and ecological observations of net
primary production. Tellus 55B, 270–289.
Wang Y-P, Leuning R (1998) A two-leaf model for canopy
conductance photosynthesis and portioning of available energy. I.
Model description and comparison with a multi-layered
model. Agricultural and Forest Meteorology 91, 89–111.
doi: 10.1016/S0168-1923(98)00061-6
Wang YP, Leuning R, Cleugh HA, Coppin PA (2001) Parameter
estimation in surface exchange models using non-linear inversion: how many parameters can we estimate and which
measurements are most useful? Global Change Biology 7, 495–510.
doi: 10.1046/j.1365-2486.2001.00434.x
Webb EK, Pearman GI, Leuning R (1980) Correction of flux
measurements for density effects due to heat and water vapour
transfer. Quarterly Journal of the Royal Meteorological Society 106,
85–100. doi: 10.1256/smsqj.44706
Williams RJ, Griffiths AD, Allan G (2002) Fire regimes and
biodiversity in the wet–dry tropical savanna landscapes of northern
Australia. In ‘Flammable Australia: the fire regimes and biodiversity
of a continent’. (Eds RA Bradstock, JA Williams, AM Gill)
pp. 281–304. (Cambridge University Press: Cambridge)
Williams RJ, Hutley LB, Cook GD, Russell-Smith J, Edwards A,
Chen X (2004) Assessing the carbon sequestration potential of
mesic savannas in the Northern Territory, Australia: approaches,
uncertainties and potentialimpacts of fire. Functional Plant Biology
31, 415–422. doi: 10.1071/FP03215
Williams RJ, Zerihun A, Montagu K, Hoffman M, Hutley LB, Chen X
(2005) Allometry for estimating aboveground tree biomass
in tropical and subtropical eucalypt woodlands: towards
general predictive equations. Australian Journal of Botany 53,
607–619.
Wilson KB, Baldocchi DD, Aubinet M, Berbigier P, Bernhofer C,
Dolman H, Falge E, Field C, Goldstein A, Granier A, Grelle A,
Halldor T, Hollinger D, Katul G, Law BE, Lindroth A, Meyers T,
Moncrieff J,Monson R, Oechel W, Tenhunen J,Valentini R, Verma S,
Vesala T, Wofsy S (2002) Energy partitioning between latent and
sensible heat flux during the warm season at FLUXNET sites. Water
Resources Research 38, 1294.
Woinarski JCZ, Milne DJ, Wanganeen G (2001) Changes in mammal
population in relatively intact landscapes of Kakadu National
Park, Northern Territory, Australia. Austral Ecology 26, 360–370.
doi: 10.1046/j.1442-9993.2001.01121.x
Xiao XM, Hollinger D, Aber J, Goltz M, Davidson EA, Zhang QY,
Moore B (2004) Satellite-based modeling of gross primary
production in an evergreen needleleaf forest. Remote Sensing of
Environment 89, 519–534. doi: 10.1016/j.rse.2003.11.008
Manuscript received 22 September 2004, accepted 24 February 2005
http://www.publish.csiro.au/journals/ajb