Embed Size (px)
Citation preview

Elsevier Science 1
The Utility of Magic Lens Interfaces on Handheld Devices for Touristic Map Navigation
Jens Grubert1, Michel Pahud2, Raphael Grasset3, Dieter Schmalstieg4, Hartmut Seichter5
1,3,4,5 Graz University of Technology, ²Microsoft Research Redmond [email protected] [email protected] [email protected]
[email protected] [email protected]
Figure 1. Magic Lens interface used in the semi-controlled field study (column 1), participant interacting with
the interface during the semi-controlled field study (column 2), Magic Lens interface used in the lab study (column 3) and participant interacting with a large map used in the lab study (column 4).
Abstract
This paper investigates the utility of the Magic Lens metaphor on small screen handheld devices for map navigation given state of the art computer vision tracking. We investigate both performance and user experience aspects. In contrast to previous studies a semi-controlled field experiment (n=18) in a ski resort indicated significant longer task completion times for a Magic Lens compared to a Static Peephole interface in an information browsing task. A follow-up controlled laboratory study (n=21) investigated the impact of the workspace size on the performance and usability of both interfaces. We show that for small workspaces Static Peephole outperforms Magic Lens. As workspace size increases performance gets equivalent and subjective measurements indicate less demand and better usability for Magic Lens. Finally, we discuss the relevance of our findings for the application of Magic Lens interfaces for map interaction in touristic contexts.
Keywords: Augmented Reality; Static Peephole; Magic Lens; Semi-controlled Field Experiment
Journal logo
Elsevier Science 2
1. Introduction
Tourists who visit cities or resorts, which they are not familiar with, often use maps as tools to orient, explore and navigate these unknown physical environments. Digital maps on handheld devices, such as smartphones, make location-based services accessible and are popular tools to support touristic needs in these contexts. The dominant technique to interact with these digital maps on devices with touch screens is Static Peephole (SP) navigation using tap-n-drag and pinch-to-zoom as used for example in Google maps. Still, physical maps continue to play an important role in the tourism sector. They address navigational needs of users if there is no data connection, but can also highlight specific points of interests selected by local tourism associations which might not be easily accessible through general purpose map applications like Google Maps. Furthermore, large physical maps can provide more information at a glance (i.e. a larger information space size) than small screens but lack the advantage of dynamic adaptation and personalization common in digital maps. However, in a touristic place, large physical maps might facilitate the communication between groups of friends or between family members by being a common ground for the discussion [30]. For example, if someone is pointing at a specific location on the physical map, the rest of the group can immediately be aware of the pointed location.
Mobile Augmented Reality (AR) applications have the potential to overcome both the static nature of the information on physical maps and the small screen constraints of mobile digital maps through the Magic Lens (ML) metaphor. They typically overlay digital information such as 3D models on the physical world. This information is registered with up to six degrees of freedom on physical objects such as magazines and posters and allows for the tight visual integration between the real and the virtual and for spatial navigation of the mixed space around users. Recently, ML interfaces became popular as an interface for browsing the physical world in location-based applications [22] through Augmented Reality browsers like Junaio, Wikitude or Nokia City Lens. Augmented Reality browsers typically combine a ML, a SP and a list view for geo-referenced information [13] in the vicinity of the user. Also, ML interfaces have become popular with leisure-oriented activities in gaming and advertising [42] often relying on commercially available computer vision-based tracking systems provided by companies like Metaio or Qualcomm.
However, for non-leisure activities such as information browsing and navigation on (physical) maps the benefits and drawbacks of the individual interfaces are not yet thoroughly understood. Specifically, to the best of our knowledge there are no recent studies investigating the performance of Magic Lens and Static Peephole map navigation using state of the art tracking technologies which allow for a wide interaction space and today’s popular interaction methods like tap-n-drag for SP navigation. A better understanding of the potentials and pitfalls of these interaction methods, given current technology, is critical both for the designers of mobile interfaces as well as business stakeholders considering investments in the provision of novel services for tourists. Specifically, business stakeholders in the tourism domain need assessments on which user interface provides most value to users and, in turn, lead to user “click-through” as well as actual purchase or reservations. For example if ML interaction can deliver added-value in terms of performance or user experience in touristic contexts the effort of enabling ML interaction with large scale physical posters might be worthwhile. This effort consists among others of authoring 3D models, embedding video streams in a visually compelling way, and designing physical posters and maps specifically with the visual integration of disparate digital content in mind [15]. In contrast, if benefits of ML and SP interaction are comparable there is no need for added expenses and traditional location-based solutions, making small screen interaction sufficient to address the needs of tourists.
Our work therefore makes following contributions: First, we provide an up to date comparison of ML and SP navigation for a generic information browsing task on maps. We conducted a semi-controlled field experiment on a public map at the ski slopes of a tourist hotspot in the Austrian Alps. Our comparison revealed that even with state-of-the-art vision-based tracking ML is significant slower than a conventional SP interface with tap-n-drag for a common map size in public spaces. ML also does not perform better in terms of error rate and user experience. In addition, the study did not reveal significant effects of ML interaction on the audience or an effect

Elsevier Science 3
of the setting on the user experience rating of participants. Second, looking deeper into workspace size in a separate laboratory study, we could not see ML outperform SP, achieving at most equal performance with an increasing size of the map. But, ML significantly decreases demand and increases usability compared to SP. Third, we reflect on the implications of our findings for ML interaction in touristic scenarios.
2. Related work
ML, SP and Dynamic Peephole (DP) interaction have been studied in a variety of contexts, ranging from design space explorations [12][43][44][8], over controlled performance based evaluations [9][27][39] to field studies [17][30]. While SP interfaces typically move a scene behind a fixed virtual window (i.e. traditional pan and zoom using touch input) DP interfaces keep the information space fixed and move a viewing window (or virtual camera) over it (often through spatial input of users).
Several frames of references were explored for spatially aware displays (Magic Lens and Dynamic Peephole). Besides physical maps [41][15][35], VR environments [31], interactive screens [1][5] and media facades [6], physical notebooks [25], urban environments [13][14] and interaction without semantic connection to the environment [44] have been investigated. While many researchers are focusing on handheld displays like PDAs, smartphones or (to a lesser extend) tablets the rise of pico projection systems also induced a series of work about ML and DP interfaces using handheld projectors (for an introductory overview see e.g., [10]).
Controlled studies of of ML, DP and SP interaction encompassed fundamental interaction tasks such as target acquisition and visual search (finding a target object among distractors) tasks and higher level tasks such as navigation. Mehra et al. compared DP and SP metaphors for line-length discrimination using a desktop PC interface with mouse input. Their results indicated that DP interfaces are superior to SP interfaces for tasks in which spatial relationships matter and display size is limited [27].
In 2008, Rohs and Oulasvirta investigated target acquisition performance with ML and DP interfaces on a handheld device [36] and formulated a two part pointing model for ML including coarse physical and fine-grained virtual pointing. They also validated their model in a real-world pointing task for varying target shapes and visual contexts [37]. Cao et al. investigated peephole pointing for dynamically revealed targets [9] using a desktop PC and graphics tablet. The authors focused on a one-dimensional pointing task both for coupled (fixed on the screen center) and decoupled cursor position (independent of screen position). While these fundamental target acquisition studies are important as building blocks for designing spatially aware interfaces, to our knowledge human movement models like Fitt's law cannot easily be employed to predict performance of explorative map navigation tasks applicable for real-world scenarios such as finding a point of interest on a map or comparing prices of several map locations. Those map related tasks involve building up survey knowledge [40] and path planning in the presence or absence of a physical map.
To this end, Rohs et al. compared ML, SP (via joystick control) and DP interaction for explorative map navigation [39]. This work is the closest to our own studies in which they evaluated performance, motion patterns and user preferences for a locator task. They found that both DP and ML interaction outperformed SP navigation in terms of task completion time and degree of search space exploration but did not find significant differences between DP and ML interaction. Rohs et al. extended their previous study to include the impact of item density on ML interaction [38]. They found that the effectiveness of the visual context (ML) decreases with increasing item density compared to DP. In their studies participants generally preferred ML over DP interaction. They also found out that the availability of visual context (in the ML condition) led to more strongly guided search patterns whereas the DP condition resulted in uniform search patterns. The study results influenced the choice of item density used in our evaluations. Technical limitations of the studies included the small operational range between handheld device and map (6-21cm) and the low update rate of the tracker of only 10Hz. Mulloni et al. indicated that users adopt their behavior to the capabilities of the available tracking technologies for AR interaction [28]. Hence, it seems advisable to conduct comparisons between interfaces when the underlying technologies change

Elsevier Science 4
significantly, as it is the case with current AR tracking technologies. Current computer-vision-based tracking technology, as used in our studies, can be deployed in real-world environments supporting tracking with 30 Hz update rate and a vastly wider operational range (20-200 cm in our studies). Goh et al. investigated usability and perceptual aspects of three interfaces for searching and browsing geolocation-based information including ML, SP and list views [13]. Their results indicated that for searching, performance was similar across all three interfaces but for browsing, the map performed significantly worse than the list and AR interfaces. Also, the AR interface was always ranked last in terms of usability despite its better performance when compared to the map. However, Goh et al. did not address aspects of further user experience measures as we do in our first study. In another application task oriented study Yee et al. compared a peephole interface to a conventional pen operated scrolling interface in a performance oriented user study for selection, route planning and drawing tasks. The authors indicated mixed results (no significant differences in error rates or for the route planning task, faster for drawing and selection) [44]. Baldauf et al. compared the performance of two orientation-aware (including ML) and two orientation-agnostic techniques for interacting with interactive public displays through a smartphone in pointing, drag ‘n drop and drawing tasks [3]. Their results indicated that Magic Lens interaction is well suited for spontaneous pointing tasks with short interaction periods. While ML interaction could not outperform an orientation-agnostic alternative, participants found ML interaction more intuitive and fascinating. Most recently, Pahud et al. compared DP and SP for map navigation [32]. No performance advantage for DP could be identified for their selection tasks where the participants had to navigate (by panning and/or zooming) to locate a specific target on a map before selecting it. However, they observed that DP outperformed SP for repetitive back/forth navigation and selection tasks between two known targets. This observation would reinforce the opportunity to design DP experiences such as virtual shelves [24], or tool menus in specific locations in space. Pahud et al. also discussed that DP seems to also have an opportunity with compound tasks such as navigate and trace. In contrast, our work concentrates on spatially aware handheld devices with visual context, but the findings from Pahud et al. related to compound tasks and known targets might apply to ML experiences as well.
There is a large number of performance-based user studies on spatially-aware displays. However, to date there are comparably few studies focusing on qualitative aspects of spatially-aware mobile interaction. Olsson et al. presented one of the few studies that explored users’ experiences with mobile AR [33]. They conducted an online survey to explore the most satisfying and unsatisfying experiences with mobile AR applications. Their results, similar to research outcomes by Grubert et al. [16][22], conclude that mobile AR browsers are still mainly used due to their novelty value. Furthermore, qualitative aspects in collaborative settings of mobile AR were addressed by Morrison et al.. They conducted field trials using ethnographic observation methods on the collaborative use of handheld AR with a single device [30] and later expanded to synchronous use of multiple mobile devices [29]. One finding was that AR facilitates place-making and that it allows for ease of bodily configurations for the interacting group. This could indicate enhanced user experiences over traditional interfaces. Grubert et al. investigated performance, user experience and social aspects for mobile games at public spaces [17][18]. They compared a ML interface with SP for playing a game at public transport stops and found that the usage patterns were inconsistent among two public transportation stops which differed in their social setting. Specifically, their results indicate that the social context can have an influence on the user experience achievable with mobile AR; similar observations have been made for interactive installations [1]. We adopted the semi-controlled field experiment [7][21] setup of Grubert et al. for our first in-situ evaluation.
3. Semi-controlled field experiment
The municipality of Schladming is a key skiing resort in the Austrian Alps interested in innovating in ubiquitous and mobile technologies to further develop their tourism sector. As a decision aid for selecting technologies potentially driving tourism Schladming wants to get quantitative assessments if mobile AR

Elsevier Science 5
interfaces could add value for visitors. Specifically, they were interested to find out if mobile AR could provide added value to existing physical information infrastructure such as panorama posters and provide benefits over pure digital interfaces like Google Maps. Panorama posters of varying sizes showing positions of slopes and local businesses such as restaurants are widely distributed in the area (see Figure 2, right) and are a significant cost factor in advertisement budgets in the region. We chose them as reference information space for a study.
3.1. Study Design and Task
To address the question if ML interfaces could provide benefits over SP interfaces for map navigation we designed a within-subjects study comparing the effects those interfaces on user performance and user experience. We chose a semi-controlled field experiment design combining quantitative performance measures (task completion time, error rate) with subjective feedback (user experience questionnaires, semi-structured interviews) and observations (video recording and field notes).
One challenge in the design of our experiment (and other field experiments, cf. [7]) is to balance ecological validity (task relevance using an artifact relevant to people in the area) with a sound comparative study design and external validity (being able to transfer results out of the scope of the specific setup). Hence, similar to previous studies we chose a locator task [39]. Locator tasks are high level geoinformation tasks which typically require location search for an object with certain target attributes [34].
The specific task was to find the single lowest priced restaurant among 16 candidate locations on a ski field map. The candidate locations referred to existing restaurants in the region. A tap on the restaurant revealed the price (randomly generated for each location), a long press selected the restaurant (screen size 19x14mm in 60cm distance) as candidate. An icon on the physical map represented the restaurant; a corresponding bitmap was representing the restaurant on the mobile. Interface was the within-participants factor with two levels: ML and SP. The task had to be conducted 4 times per interface resulting in 2x4x16=128 locations (and 8 final targets) per participant. The starting order of the interface was counterbalanced but the tasks were blocked by interface.
Finding the lowest price could also easily be solved with a list view. However, we decided not to include a list view in our comparison to be able to generalize our findings to other locator tasks. General locator tasks can encompass non quantifiable attributes such as textual opinions of users which cannot automatically be sorted.
3.2. Apparatus and Location
The ML and SP interfaces were implemented in Unity 3D and deployed on a Samsung Galaxy SII smartphone. In landscape mode the smartphone screen has a physical extend of 9.32x5.6 cm with a resolution of 800x480 px (218 ppi). The physical camera has a vertical angle of view of 35 ° (horizontal 49 °). The physical camera parameters with a vertical field of view of 35 ° were matched accordingly with the virtual camera used in SP. Also the size of the virtual poster was matched with the size of the physical poster. Thus ML and SP interaction operated in coordinate systems with the same metric units. The translation of the SP camera parallel to the poster was determined by 𝑑𝑥 = 𝑡𝑜𝑢𝑐ℎ𝐷𝑒𝑙𝑡𝑎𝑥 ∗ 𝑇𝐹𝑥 ∗ 𝑝𝑧 for the x direction (equivalent for y) where 𝑑𝑥 is the translation delta in world space, 𝑡𝑜𝑢𝑐ℎ𝐷𝑒𝑙𝑡𝑎𝑥 is the drag distance in screen space (px), pz is the current distance of the SP camera to the poster in world space, and 𝑇𝐹𝑥 is a factor to scale the x (and y) translation dependent on the camera distance. 𝑇𝐹𝑥 was empirically set to 0.0076 in order to imitate the panning experience with Google Maps on the test device. Similarly, translation along the principal ray of the camera was implemented. The employed tracking system was the Qualcomm Vuforia SDK1 which is used in many commercial available AR applications and provides state of the art computer vision-based tracking performance.
——— 1 http://www.qualcomm.com/solutions/augmented-reality

Elsevier Science 6
The poster had an extend of 154x84 cm with its center position mounted at a height of 160 cm directly at a façade of the tourism office next to the ski slopes. The text depicting the labels used the Arial font with a text size of 21 pt on the poster (10 pt screen size in 60 cm viewing distance) using white color on light blue background which supports quick scanning of text. The 16 hut objects used as buttons had a size of 4x3 cm on the poster (or 2.5x3.5 % of the whole information space). The average candidate density of the poster (number of huts divided by poster size) was 12.2 items per m² and was derived through suggestions of previous studies [38].
The study was conducted outside the central tourism office and ski station (see Figure 2, left and right) during the ski season in March 2013, shortly after the FIS 2013 ski world championship in Schladming, Austria. Approximately 20 m away in front of the same building another bigger map was mounted with an extend of 2.3x1.3m but could not be used for the study for technical reasons.
3.3. Data Collection
We collected device, video and survey data complemented with photos and notes. A GoPro camera was mounted at a height of 2 m next to the poster behind a pillar to observe both users’ actions as well as reaction of passers-by. The video analysis was conducted by a single trained person. The categories for video analysis were derived from related studies [17][18].
Figure 2. Schematic top down view of the study location with Hall’s reaction bubbles [19] indicating the
intimate (0.5 m), personal (1.2 m) and social space (3.6 m) of the participants (left) and photograph of the location with one participant and three passers-by (right).
The interaction of the users with the interfaces was logged on the device. Specifically, the motion of the
physical camera (ML) and virtual camera was sampled at 10 Hz. We employed the AttrakDiff questionnaire [20] for capturing hedonic (stimulation, identity) and pragmatic user experience dimensions, the interest/enjoyment and value/usefulness sub-scales of the Intrinsic Motivation Inventory (IMI) [26] and an environmental distraction measure [17]. We analyzed quantitative data with the R statistical package, IBM SPSS and Microsoft Excel. Null hypothesis significance testing (NHST) was carried out at the 0.05 level. For the device data we excluded samples with more than 3 standard deviations away from the mean. For data which was not normal distributed and could not be transformed to normal distribution we employed non-parametric NHST. The reported confidence intervals were computed at a 95% level. With 17 participants, 2 interfaces and 4 trials per method 136 trials were recorded.
Elsevier Science 7
3.4. Hypotheses
Due to the findings of previous studies [39] we suspected that ML interaction will outperform SP interaction in terms of task completion time. Hence, our first hypothesis was: H1: Task completion time of ML will lower than for SP. Similar, previous studies indicated that users rated ML interaction more favorably than alternative interfaces for pointing and navigation tasks. Hence, our second hypothesis was: H2: Users will prefer ML over SP interaction.
3.5. Procedure
At the beginning of the study each participant was introduced to the general schedule of the experiment (after signing an informed consent form) and the setting of the task (i.e. looking for the best price for a meal at lunchtime). They then filled in a background questionnaire (demographics, technical skills). Afterward, the participants were introduced to both interfaces and were free to train both interfaces in a learning phase (with different symbols and locations used than in the main task). The learning phase was typically around 3-5 minutes and was stopped when participants felt comfortable in operating both interfaces. Afterwards, they were informed about the main task. They were specifically asked to conduct the task as fast and accurate as possible. The task was conducted for the first interface in 4 repetitions and participants were allowed to make a break between each repetition but nobody did so. The overall time per interface was around 5 minutes. After the first task block was completed participants filled out intermediate questionnaires (AttrakDiff, IMI, environmental distraction) which took around 5 minutes. The main task and rating procedure was then repeated for the second interface (order was counterbalanced). In the end the participant filled out a second background questionnaire and received a gift worth 10 Euros. The overall duration per participant was 30-40 minutes.
3.6. Participants
Eighteen volunteers from around the area participated in the study (12 males, 6 females) with 10 being between 18 and 34 years old (1<18, 4, 35-54, 3>55). All but one were right handed. The average height of participants was 175 cm high (sd=9 cm). All participants were smartphone users, none had experience with ML. On a five point Likert scale (never, …, very often) four participants indicated that they use mobile map applications very often, (7: often, 4: occasionally, 3: rarely). Two participants indicated to use physical maps during vacation very often (6: often, 7: occasionally, 3: rarely). We had to exclude data from one participant from the analysis due to logging problems.
3.7. Findings
In this section we report on the performance-based measures task completion time (TCT) and selection errors. We will also investigate motion patterns of the handheld device, gaze switches, user experience measures and audience behavior.
Task Completion Time
The TCT of ML was significant slower compared to the TCT of SP. A two-tailed paired t-test indicated a significant effect of interface (t(67)=5.34, p<0.05, Cohen’s d=0.6) on task completion time with ML having a higher TCT (M=44.8s, σ=15.8) than SP (M=34.9s, σ=11.2). In addition, effects of played levels (1-4th repetition) on TCT were investigated. A one-way repeated-measure ANOVA indicated a significant effect of level on TCT (ML: F(3,48)=10.92, p<0.01, η²=0.14, SP: F(3,48)=4.09, p=0.01, η²=0.07). The achieved power (1-β) for task completion time (TCT) was > 0.99. For ML post-hoc pairwise two-tailed t-tests with Bonferroni correction

Elsevier Science 8
revealed significant differences between level 1 and all other levels (see Table 1). For SP, post-hoc pairwise two-tailed t-tests with Bonferroni correction did not reveal significant differences between levels 1 and all other levels. However, a pairwise one-tailed t-test indicated significant differences between level 1 (MD: SD: ) and 4 MD SD, p = 0.046, see Table 2. To investigate if learning effects potentially caused the significant effect of interface on overall TCT we re-ran the analysis with only levels 2-4, but still a two-tailed paired t-test indicated a significant effect of interface (t(50)=5.34, p<0.05, Cohen’s d=0.58) on task completion time with ML having a higher TCT (M=41.39s, σ=13.6) than SP (M=33.4s, σ=11.3).
Table 1. TCTs (in seconds, mean and σ) for individual levels in ML condition and p-values from post-hoc
pairwise comparison (using one-tailed t-tests, bold values indicate sign. differences).
TCT (second) level 1 2 3 55 (18) 1 - - - 44 (13) 2 .003 - - 41 (15) 3 .0004 1.0 - 39 (13) 4 .0007 .20 1.0
Table 2. TCTs (in seconds, mean and σ) for individual levels in SP condition and p-values from post-hoc
pairwise comparison (using one-tailed t-tests, bold values indicate sign. differences).
TCT (second) level 1 2 3 40 (10) 1 - - - 34 (13) 2 .06 - - 33 (9) 3 .07 1.0 -
33 (12) 4 .046 1.0 1.0
Errors We investigated the number of selection errors (if a user chose a wrong target) and the candidate coverage
(how many candidates have been visited). A two-tailed Wilcoxon signed-rank test did not indicate a significant effect of interface (W=7.5, Z=0.36, p=0.72) on selection error. For both interfaces only 3 selection errors happened (with 17*4=68 targets). Similar, a two-tailed Wilcoxon signed-rank test did not indicate a significant effect of interface (W=4, Z=-1.28, p=0.2) on candidate coverage. From 1088 possible candidates (16 candidates x 4 levels x 17 participants) for ML 5 candidates (0.46 %) were not visited and for SP 9 candidates (0.82 %).
Motion Patterns
We explored how participants moved the handheld device relative to the physical and virtual posters. While we designed the system so that certain interaction distances are likely (based on the predefined hut and text sizes) we did not give instructions to participants how they should position themselves towards the poster. While in ML participants naturally had to hold the phone towards the poster, in SP they generally kept the phone more parallel to the ground. Figure 3 depicts the locations of the camera center in the x-y plane of the poster. The camera positions in ML refer to the physical location of the device relative to the poster. For SP the camera positions refer to the location of the virtual camera and do not correlate to the physical pose of the smartphone. For example, user could actually turn away from the printed poster in SP and still complete the task. It indicates that participants more closely followed the spatial layout of the hut candidates (which form a U-like shape on the poster) in the SP condition (right) than in the ML condition (left). For visualization purposes every 20th camera sample is shown in Figure 3 and 4 (0.5Hz). Over all participants (and all pose samples) the effect size of interface on the x position (px) was only small as indicated by two-tailed Wilcoxon rank sum test (W=379134424, Z=9.9,

Elsevier Science 9
p<0.001, Cohen's d=0.08). However, two-tailed Wilcoxon rank sum tests indicated a large effect size for the y position (py) (U=577568605, Z=119.73, p<0.001, Cohen’s d=1.19).
Kruskal-Wallis rank sum tests indicated significant effects of participant on camera movements in px (χ² (16) = 10385.58, p<0.01), py (χ² (16) = 19254.78, p<0.01) and pz (χ² (16) = 20325.38, p<0.01) both for ML and for SP (px: χ² (16) = 624.39, p<0.01, py: χ² (16) = 971.37, p<0.01, pz: χ² (16) = 9889.18, p<0.01) over all camera poses. However, there were more inter-personal differences in the for ML than for SP with medium and large effect sizes, specifically for motions parallel to the poster (see Table 3). Examples for the large variance in the x, y position between participants in ML are the blue and black dots in Figure 4 (left and middle). The standard deviation of horizontal movements was 6.1 cm for the participant indicated with the blue dots (h=185cm, male) and 26.1 cm for the participant indicated with the black dots (h=190cm, male). Figure 3 also indicates that in SP the variance in the sampled positions between participants is lower than in ML resulting in less heterogeneous inter-person motion patterns in SP.
Figure 3. Position in the x-y plane. ML camera centers: top row, left, SP camera center: top row, right, ML projected camera centers in poster plane. Dots with unique colors represent individual participants. The LOWESS (locally weighted scatterplot smoothing) curve is shown in blue. Every 20th camera sample is shown.
Table 3. Number of significant (p<.05) pairwise differences (from 136 possible) with medium (Cohen’s d =
[0.5, 0.8]) and large (Cohen’s d >= 0.8) effect sizes for motion in x, y and z plane of the poster.
px (projected px) py (projected py) pz # medium d # large d # medium d # large d # medium d # large d
ML 16 (14) 37 (22) 6 (3) 28 (16) 5 60 SP 7 0 5 0 19 24
In conjunction with the motion patterns in the x-y plane come large variations of px and py dependent on the
distance between camera and poster (see , left and middle) and rotations along the x and y axis in ML (see , right). Again for SP the range of motions along the z axis is smaller per participant.

Elsevier Science 10
Also, with ML in average the participants moved closer towards the poster (pz, ML mean; 61.9 cm σ=17.7, SP mean: 67.3 cm σ=18). The variations in z-distance also induced differences in label sizes and hut sizes.
Figure 4. Distance to poster in relation to the horizontal (left) and vertical (middle) positions and horizontal and vertical rotations (right). Dots with unique colors represent individual participants. Every 20th camera sample is shown.
Table 4 gives an overview about the median and 1st and 3rd quartile values at the moment of candidate
selection. Literature reports on recommend text sizes (8-12pt) [11] and soft button sizes [23] for handheld devices. The occurred sizes in our study fall into the previously reported ranges. This is indicates that users adopt their interaction distance to ensure readability and selectability of content.
Table 4. Text sizes (pt) and candidate button (hut) sizes at the moment of candidate selection.
ML SP 1st qu. MD 3rd qu. 1st qu. MD 3rd qu.
Text size (pt) 8 9.3 11.5 9.1 9.7 10.9 Hut width (mm) 16.2 19 23.4 16.6 17.7 19.8 Hut height (mm) 11.7 13.7 16.9 13.4 14.3 16.1
User Experience
We used the AttrakDiff questionnaire with 5-item scales (strongly disagree … strongly agree) to evaluate the effects of interface on pragmatic quality (PQ), hedonic quality-identification (HQ-I) and hedonic quality-stimulation (HQ-S) [20]. Complementary, the interest/enjoyment (IE) and value/usefulness (VU) scales of the Intrinsic Motivation Inventory were used [26]. Two-tailed Wilcoxon signed-rank tests did not reveal significant

Elsevier Science 11
effects of interface on PQ, HQ-I, HQ-S, IE and VU. The ratings and test statistics are shown in Table 5.
Table 5. Results of two-tailed Wilcoxon signed-rank tests did not indicate significant effects of interface on the depicted UX dimensions and mean and standard deviation of the ratings (scaled to -2..2).
UX Dimension ML M (σ) SP M (σ) W Z p Cohen’s d
PQ .32 (.65) .42 (.31) 47.5 -.83 .41 .28 HQ-I .64 (.65) .54 (.47) 75 .85 .39 .30 HQ-S .93 (.50) .54 (.81) 94 1.94 .06 .70
IE .61 (.85) .71 (.59) 46 -.3 .76 .10 VU .76 (.92) 1.1 (.56) 29.5 -1.38 .17 .49
As the study was conducted in a public setting we were also interested if users would feel potentially more
distracted by the audience (passers-by) if they would use expressive spatial interaction methods (as in ML) vs. more private and established interaction with SP. We employed a set of 3 statements previously used for similar purposes [17] to derive a single score for environmental distraction (by inverting the answers of two items and then averaging the individual answers just as for AttrakDiff and IMI). The statements were: 1. “It was hard to concentrate as I was distracted with the environment.”, 2. ”I felt comfortable using the system in the environment.”, 3, “I did not pay attention to the environment when using the system.” Again, a two-tailed Wilcoxon signed-rank test did not reveal a significant effect of interface on environmental distraction (W=62.5, Z=0.62, p=0.54, Cohen’s d=0.2) with ML having a mean of -.92 (σ=.87) and SP a mean of -1.1 (σ=.49). In addition, semi-structured post-hoc interview did not reveal benefits mentioned by the participants for the ML interface.
Audience Behavior
Using the recorded video data a trained coder identified 370 passers-by in the ML condition and 236 in the SP condition. Table 6 gives an overview of the identified reactions. While only a low number of passers-by interacted with the poster a comparable amount did so in both conditions.
Table 6. Reactions of passers-by.
Reaction ML SP no reaction 74% 79% glimpse 24% 18%
interaction with the poster 2% 3%
3.8. Discussion
The physicality of the ML interaction did not suffice to engage users more than a traditional screen based interaction and did not show performance benefits. Our results are in contrast to prior findings that user feel more engaged when using ML interfaces for leisure tasks [16] or that they can be more efficient compared to SP interfaces [39]. While we could not reveal learning effects we cannot exclude that longer-term learning effects can be discarded as a potential source of the performance difference.
The strong differences in motion patterns between ML and SP can be explained by the smaller number of degrees of freedom (DOF) in SP (3 DOF, only translation) vs. ML (6 DOF, orientation and translation) and by
Elsevier Science 12
the fact that ML employs direct pointing with continuous (and imprecise) spatial input. Specifically, ML allows panning and zooming simultaneously which can be very useful but also difficult to employ effectively by non-expert users. In contrast SP employs indirect pointing by tap-n-drag with non-continuous input; the virtual camera does not change its pose in the absent of user input. Furthermore, the physical extend of the interaction space is much larger in ML compared to SP (only 9.32x5.6 cm of screen space). This larger interaction space of ML paired with the larger number DOFs allows for more expressive interaction, however at the cost of precision. In addition, the larger inter-person differences in ML can hardly be explained by the physical characteristics of the participants like height alone. Also, it remains to be investigated if novelty effects of the ML interface are a major source of these large inter-person differences.
In previous studies participants mentioned the ML interface to be “more fun” and “engaging” [16] compared to an SP interface. However, this previous study evolved around a leisure oriented gaming task, whereas in our study we focused on a goal driven task which had no playful elements. It remains to be further investigated if mobile ML interfaces are beneficial solely in leisure-oriented tasks such as gaming or if goal-driven and productivity-oriented tasks in mobile settings can also benefit from such an interface metaphor. In touristic environments where users are not in a hurry, more enjoyable goal-driven tasks could be designed by including gaming elements even if it might affect performance.
The relative number of passers-by not noticing or only glimpsing is in line with findings of previous studies [16] [17]. Also, only a low number of participants intruded the personal space of the participants. However, in contrast to previous studies they actively interacted with the poster instead of watching the participant’s actions. The interaction seemed to be driven by an information need of the passers-by (e.g., locating a point of interest) which was addressed by referring to the poster. Participants noticed the intrusions into their personal space but did not interrupt their primary task. Also, in the post-hoc interviews participants did not mention that the social environment was distracting. However, it is not entirely clear to which extend the participants behavior was driven by demand characteristics and the fact they knew they were participating in a study and to which extend similar behavior could occur in a more naturalistic setting.
To summarize, the results of this semi-controlled field study did not reveal benefits of employing ML at this specific poster size for our given locator task. Hence, the tourist region of Schladming did not feel encouraged to employ a mobile Augmented Reality solution for this specific poster setup. However, previous work indicated that increasing the workspace size can lead to an improved performance of ML compared to interfaces, which do not utilize visual context, such as DP [38]. That leads us on to the second study which addressed the effect of workspace size on ML and SP interaction.
4. Lab study
We designed a follow-up lab study to investigate how varying workspace sizes would affect the performance of ML vs. SP navigation. Would the utility of visual context in ML help to outperform SP navigation as the information space increases? Or would the physical movements required for ML interaction mitigate any advantages that the visual context introduces?
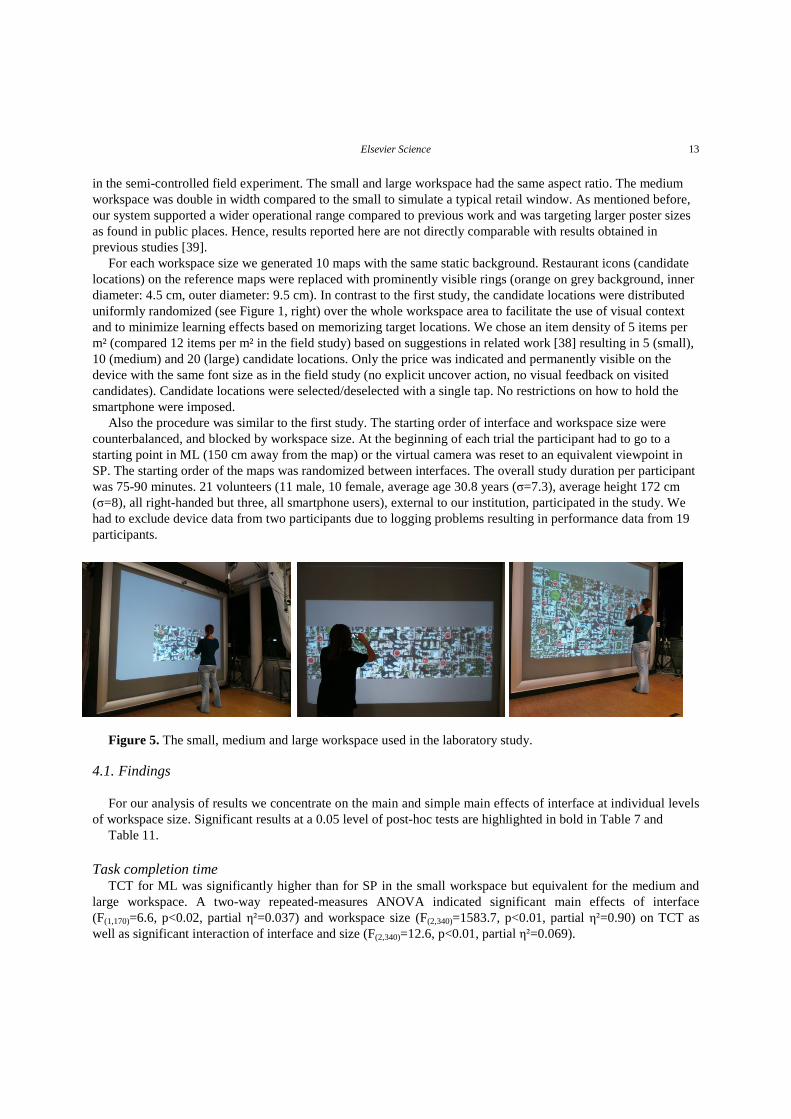
We chose a comparable experimental design to the field study and only highlight the main differences. We used interface (ML, SP) and workspace size (small: 137.5x75.5 cm, medium: 275x75.5 cm, large: 275x149 cm, see Figure 5) as within-subjects factors. The physical poster was replaced with a back-projection system (1400x1050 px) and the workspaces were centered at a height of 136 cm. The operational range of the tracking system was 20-200 cm and the update rate 30 Hz (cf. 6-21cm and 10 Hz in [39]).
The vertical extend and mounting height of the large workspace were chosen to maximize the area to be explored while still allowing ML usage when standing near it. The medium and small size had half and respectively a fourth of the area of the large workspace and depicted a cropped version of the used background map. While not having exactly the same area, the small size was comparable in dimensions with the poster used
Elsevier Science 13
in the semi-controlled field experiment. The small and large workspace had the same aspect ratio. The medium workspace was double in width compared to the small to simulate a typical retail window. As mentioned before, our system supported a wider operational range compared to previous work and was targeting larger poster sizes as found in public places. Hence, results reported here are not directly comparable with results obtained in previous studies [39].
For each workspace size we generated 10 maps with the same static background. Restaurant icons (candidate locations) on the reference maps were replaced with prominently visible rings (orange on grey background, inner diameter: 4.5 cm, outer diameter: 9.5 cm). In contrast to the first study, the candidate locations were distributed uniformly randomized (see Figure 1, right) over the whole workspace area to facilitate the use of visual context and to minimize learning effects based on memorizing target locations. We chose an item density of 5 items per m² (compared 12 items per m² in the field study) based on suggestions in related work [38] resulting in 5 (small), 10 (medium) and 20 (large) candidate locations. Only the price was indicated and permanently visible on the device with the same font size as in the field study (no explicit uncover action, no visual feedback on visited candidates). Candidate locations were selected/deselected with a single tap. No restrictions on how to hold the smartphone were imposed.
Also the procedure was similar to the first study. The starting order of interface and workspace size were counterbalanced, and blocked by workspace size. At the beginning of each trial the participant had to go to a starting point in ML (150 cm away from the map) or the virtual camera was reset to an equivalent viewpoint in SP. The starting order of the maps was randomized between interfaces. The overall study duration per participant was 75-90 minutes. 21 volunteers (11 male, 10 female, average age 30.8 years (σ=7.3), average height 172 cm (σ=8), all right-handed but three, all smartphone users), external to our institution, participated in the study. We had to exclude device data from two participants due to logging problems resulting in performance data from 19 participants.
Figure 5. The small, medium and large workspace used in the laboratory study.
4.1. Findings
For our analysis of results we concentrate on the main and simple main effects of interface at individual levels of workspace size. Significant results at a 0.05 level of post-hoc tests are highlighted in bold in Table 7 and
Table 11.
Task completion time TCT for ML was significantly higher than for SP in the small workspace but equivalent for the medium and
large workspace. A two-way repeated-measures ANOVA indicated significant main effects of interface (F(1,170)=6.6, p<0.02, partial η²=0.037) and workspace size (F(2,340)=1583.7, p<0.01, partial η²=0.90) on TCT as well as significant interaction of interface and size (F(2,340)=12.6, p<0.01, partial η²=0.069).

Elsevier Science 14
Table 7. Objective measurements in the laboratory study. Reported are mean and (σ).
Small Medium Large
TCT (second) ML SP
16.9 (4.9) 13.0 (3.4)
26.5 (7.8) 27.9 (9.2)
50.5 (11.7) 49.3 (12.1)
Selection errors (%) ML SP
1.1 (3.5) 1.8 (5.6)
4.1 (9.2) 9.9 (11.7)
5.3 (5.7) 5.3 (9.3)
Camera path length (meter) ML SP
4.6 (1.6) 4.7 (1.4)
7.6 (1.9) 11.8 (4.2)
11.9 (3.4) 20.8 (6.2)
Map visibility (%) ML SP
30.7 (9.3) 42.5 (13.0)
8.6 (3.5) 17.9 (4.5)
15.8 (6.7) 29.9 (8.4)
Post-hoc t-tests showed a significant simple main effect of interface for small workspace (t(170)=10.7, Cohen’s
d=0.82) but not for medium and large workspace. As the mean TCTs were similar for the medium and large workspace we ran a two-one-sided t-test (TOST) analysis with ε being the magnitude of the confidence interval of the SP condition. TOST results for medium (dF=170, p= 0.03, ε=2.77) and large workspace (dF=170, p=0.01, ε=3.64) confirmed equivalence of TCT between ML and SP. Selection errors
Selection errors were low for all conditions (see Table 7, row 2) and two-tailed Wilcoxon signed-rank tests did not reveal significant differences between individual conditions.
Motion-patterns.
We observed similar motion patterns for the small poster as in the field study. Figure 6 indicates the positions of the camera centers in the x-y plane of the workspace for ML (Figure 6, right) and SP (Figure 6. left) for all 3 map sizes (subsampling of 1 pose per 2 seconds for visualization purposes). The middle row of Figure 6 indicates the projected camera centers for ML in the workspace plane, taking the camera orientation into account. Figure 7 shows the x and y positions of the camera in relation to the workspace distance.

Elsevier Science 15
Figure 6. Camera position in the x-y plane of the small (row 1), medium (row 2) and large (row 3) workspace for ML (left) and SP (right), camera positions of ML projected on the workspace plane (middle). Dots with unique colors represent individual participants. Every 20th position sample is shown.
Over all participants the effect sizes of interface on the position px were only small and medium for py as
indicated by two-tailed Wilcoxon Rank Sum tests, showing similar results as in run 1 (for the small workspace), see Table 9. In addition the mean distances of the camera to the poster (pz columns in Table 9) were significantly smaller for ML compared to SP (see Table 8).
Table 8. Mean distances (in cm) between camera and the workspace and standard deviations (σ).
interface / size ML SP small 64.21 (34.8) 89.3 (57.7)
medium 58.7 (28.5) 94.7 (55.7) large 56.7 (33.8) 89.1 (53.8)
Table 9. Test statistics and effect sizes (Cohen’s d) of interface on the positions of the camera based on all
position samples. For px and py the values based on camera positions projected on the workspace plane are listed in parentheses.
px (projected px) py (projected py) pz
size d U Z p d U Z p d U Z p
small .02 (.01)
>4e8 (>4e8)
.94 (8.04)
.35 (<.001)
1.00 (1.19)
>6e8 (>6e8)
108.3 (122.4)
<.001 (<.001)
.68 >2.5e8 -76.05 <.001
medium .03 (.05)
>1.3e9 (>1.3e9)
5.07 (7.83)
<.001 (<.001)
1.42 (1.22)
>2e9 (>2e9)
188.8 (167.4)
<.001 (<.001)
1.12 >5.9e8 -158.15 <.001
large .01 (-1.12)
>4.5e9 (>4.3e9)
3.10 (-11.7)
.002 (<.001)
.28 (.32)
>5e9 (>5e9)
61.5 (71.51)
<.001 (<.001)
1.12 >1.9e9 -212.5 <.001
Elsevier Science 16
Figure 7. Camera distance in relation to the horizontal camera positions (columns 1-2) and vertical camera positions (columns 3-4) for the small (row 1), medium (row 2) and large workspace (row 3). Dots with unique colors represent individual participants. Every 20th position sample is shown.
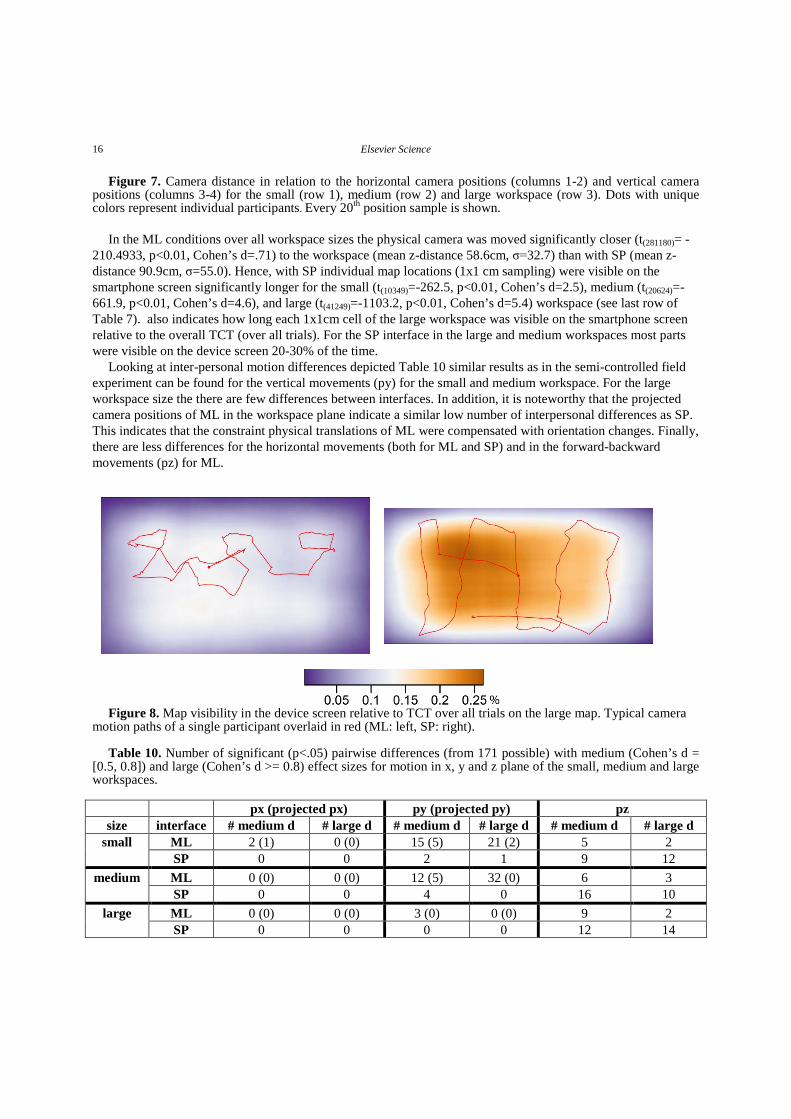
In the ML conditions over all workspace sizes the physical camera was moved significantly closer (t(281180)= -
210.4933, p<0.01, Cohen’s d=.71) to the workspace (mean z-distance 58.6cm, σ=32.7) than with SP (mean z-distance 90.9cm, σ=55.0). Hence, with SP individual map locations (1x1 cm sampling) were visible on the smartphone screen significantly longer for the small (t(10349)=-262.5, p<0.01, Cohen’s d=2.5), medium (t(20624)=-661.9, p<0.01, Cohen’s d=4.6), and large (t(41249)=-1103.2, p<0.01, Cohen’s d=5.4) workspace (see last row of Table 7). also indicates how long each 1x1cm cell of the large workspace was visible on the smartphone screen relative to the overall TCT (over all trials). For the SP interface in the large and medium workspaces most parts were visible on the device screen 20-30% of the time.
Looking at inter-personal motion differences depicted Table 10 similar results as in the semi-controlled field experiment can be found for the vertical movements (py) for the small and medium workspace. For the large workspace size the there are few differences between interfaces. In addition, it is noteworthy that the projected camera positions of ML in the workspace plane indicate a similar low number of interpersonal differences as SP. This indicates that the constraint physical translations of ML were compensated with orientation changes. Finally, there are less differences for the horizontal movements (both for ML and SP) and in the forward-backward movements (pz) for ML.
Figure 8. Map visibility in the device screen relative to TCT over all trials on the large map. Typical camera motion paths of a single participant overlaid in red (ML: left, SP: right).
Table 10. Number of significant (p<.05) pairwise differences (from 171 possible) with medium (Cohen’s d =
[0.5, 0.8]) and large (Cohen’s d >= 0.8) effect sizes for motion in x, y and z plane of the small, medium and large workspaces.
px (projected px) py (projected py) pz
size interface # medium d # large d # medium d # large d # medium d # large d small ML 2 (1) 0 (0) 15 (5) 21 (2) 5 2
SP 0 0 2 1 9 12 medium ML 0 (0) 0 (0) 12 (5) 32 (0) 6 3
SP 0 0 4 0 16 10 large ML 0 (0) 0 (0) 3 (0) 0 (0) 9 2
SP 0 0 0 0 12 14

Elsevier Science 17
Demand and usability Demand and usability were investigated with the NASA TLX and the Pragmatic Quality (PQ) dimension of
AttrakDiff [20]. Two-way repeated-measures ANOVA indicated significant main effects of interface and workspace size on the TLX and PQ dimensions but are not reported due to space constraints. Similar, post-hoc t-tests indicated significant differences for the main effect of interface for the TLX dimensions highlighted in bold in Table 11 (ten point scale low to high) but are not reported here. For pragmatic quality (five point bipolar scale,-2..2), post-hoc two-tailed t-tests did not indicate significant differences for small and medium but for the large workspace (t(20)=2.6, p=0.01, Cohen’s d=0.6).
Table 11.TLX and PQ dimensions. Reported are mean and standard deviation (σ).
Small Medium Large
Mental Demand ML SP
2.4 (1.6) 2.4 (1.7)
3.5 (2.1) 4.2 (2.2)
4.5 (2.2) 5.6 (2.8)
Physical Demand
ML SP
3.8 (2.4) 2.1 (1.7)
4.0 (2.3) 3.3 (2.3)
4.5 (2.2) 5.6 (2.8)
Temporal Demand
ML SP
3.81 (2.6) 3.19 (2.4)
3.7 (2.1) 5.0 (2.2)
4.5 (2.6) 5.2 (2.8)
Performance ML SP
2 (2.3) 1.6 (2.2)
1.4 (1.4) 2.5 (2.2)
2.1 (1.8) 2.9 (2.2)
Effort ML SP
3.5 (2.3) 2.6 (1.9)
3.5 (2.1) 4.3 (2.4)
4.9 (2.5) 5.3 (2.5)
Frustration ML SP
2.6 (2.3) 2.0 (2.0)
2.6 (1.9) 3.3 (2.5)
3.2 (2.4) 4.5 (2.8)
Pragmatic Quality
ML SP
0.5 (0.8) 0.7 (0.7)
0.6 (0.6) 0.3 (0.7)
0.4 (.08) -0.2 (0.7)
Preference and map knowledge.
Preference for the interfaces was dependent on the workspace size, too. For the small workspace five participants preferred ML, 16 preferred SP. For medium and large, ML was largely preferred (medium: 14 ML, 7 SP, large: 19 ML, 2 SP). Reasons mentioned by participants in post-hoc interviews for preferring ML for the large map included having a “better overview”, “seeing both the overview and detail at once” which “avoids strenuous zooming gestures”, “feeling more confident that no [candidate] location was missed”. This is also highlighted by 17 participants reporting that ML supported them better in building map knowledge (4 for SP). These advantages diminished as the workspace size and number of items decreased making the SP interface “sufficient”. In contrast, the SP interface was reported to be “more stable”.
4.2. Discussion
Subjective ratings and feedback in the post-hoc interviews indicated potential usability benefits for ML for the medium and large workspace. Participants reported less mental demand (medium and large), physical demand (large) or frustration (large) for ML. For the large workspace ML had a significant higher pragmatic quality rating. “Better overview” and a “better sense where near-by candidates are located” were commonly reported by participants. That the physical map played a subtle role became apparent when participants reported to have relied on their “peripheral vision to sense where I am on the map” while focusing on the handheld screen. Peripheral vision but also active gaze switches might have been used to correct the upcoming navigation decisions, e.g., by “avoiding empty areas”. We assume that the presence of the physical map supports acquisition of survey knowledge [39]. However, we did not observe many participants actively planning a route prior to

Elsevier Science 18
navigating the workspace, but this might be due to the nature of our task. Specifically, it remains to be investigated if results are consistent if the semantic value of the visual context increases; i.e. if the map structure supports the user not only on a perceptual level. How building and usage of survey knowledge using split attention between a handheld screen and a physical map at a different focal plane works remains to be further explored.
Significant shorter camera motion paths in ML for the medium and large workspaces seem to confirm the subjective feedback. The added degrees of freedom of the ML camera (translation and orientation) over SP (translation only) can explain the shorter motion paths as around 30° of change in pitch were common for navigating the medium and large workspace in ML. However, the increased degrees of freedom of ML come at the cost of text readability due to perspective foreshortening (which we did explicitly not correct for with billboarding). This is also apparent in the smaller mean distances between camera and workspaces. In SP participants were able to read the text from further away as the camera was always perpendicular to the text plane. Participants stated: “labels were better readable [in SP]”. In fact, participants reported strategies to find the right z-distance that would allow them to “barely identify the numbers” to avoid pinch and spread gestures for switching between overview and detail. The differences in motion patterns between interfaces were similar as in the semi-controlled field experiment. However, we did not observe as many inter-personal differences in ML for the horizontal motion parallel to the workspace. This could be explained by the fact that, in contrast to the poster of the semi-controlled field experiment, in the lab study the candidate locations were uniformly (and randomly) distributed across the whole workspace. Compared to the laboratory study in the semi-controlled field experiment the participants could more conveniently browse the candidate locations by rotating instead of translating once they found a suitable position. This highlights the fact that the attributes of the physical artifacts (in our case the poster design) have to be carefully taken into consideration when designing ML interfaces. For the vertical motion parallel to the poster inter-personal differences were similar high between the field and the laboratory runs for the small and medium workspace size. Their vertical extend was similar to the one of the field run. However, for the large workspace size in the laboratory study there were only few differences between ML and SP. This could be explained by the observation that participants could not easily visit the candidate locations by pure rotation but had to physically translate to be able to read the labels. The lower number of inter-personal differences in the z-distance to the poster for ML between lab and field run can be explained by the fact that in the laboratory setting participants had to start each trial from a constant z-distance and then moved towards the poster. In the semi-controlled field experiment participants could move freely during the whole experiment.
Regarding the small workspace size it appeared that SP outperforms ML, confirming the results of our first study. No benefits could be found for task completion time and subjective measures. In the interviews participants reported to see no advantages of ML for the small workspace as they could “quickly navigate” the digital workspace with SP without losing overview. This is in contrast to previous findings [39]. This performance difference could be explained by the effect of current input modalities for SP (touch-based screen interaction) and the lack of prior knowledge of ML navigation. For the medium and large workspaces we found equivalent TCTs. It remains an open question if with further advancements in tracking technologies ML can outperform SP or if human motor skills play a more dominant role. Despite the results we found about TCTs one should carefully consider the importance of performance relative to hedonic and affective user experience dimensions in touristic contexts. If performance is not a priority, e.g., if tourists are not in a hurry ML should be considered has a design candidate for supporting map navigation tasks.
4.3. Limitations
Reflecting on our approach to investigate the benefits and drawbacks of ML interaction for map navigation we identified a number of limitations. Depending on the viewpoint semi-controlled field experiments can be seen to either combine the best of two worlds – internal validity from laboratory experiments with ecological validity of

Elsevier Science 19
field studies – or to make too many compromises. Specifically, one can argue that collecting qualitative feedback in a task embedded in the natural routines of users should be preferred over performance-based measures in a field situation as the later can diminish the ecological validity of results. On the other hand it is worthwhile to observe that both performance measures and subjective feedback can be consistent between laboratory and field situations as is the case for our studies. Also one can argue that in a tourism context affective and hedonic aspects of user experience should be addressed more in the interaction design and that our application is too task focused. While we agree that these aspects should be considered for the design of actual products and services in our comparative study settings we wanted to investigate if the interface metaphor alone leads to differences in user experience.
5. Discussion and Conclusion
Several implications can be drawn for ML interaction with maps in tourism. First, supporting relatively simple locator tasks on maps through ML, which are solely goal-oriented, are likely to only add value to an experience if the map size is larger than DIN A0. The gained overview of ML interaction for large maps cannot be easily compensated with focus and context techniques on small screen devices due to screen space constraints. Designers of such experiences should carefully consider spatial affordances of the physical posters which they want to augment beyond following basic guidelines like a proper mounting height of the poster. Specifically, the spatial constraints between the individual locations on the poster which should be augmented and the user can have an impact on the usability of the whole system.
Second, results do not implicate that mobile AR applications for smaller map sizes such as foldable pocket maps are of no use. They do highlight the fact that such applications focusing on locator tasks should go beyond the support of pure utilitarian value and try to address hedonic and emotional aspects in their interaction design. Also, there is a whole class of further tasks which could benefit from ML interaction also on smaller maps. Specifically, it would be interesting to purse this work with tasks that are going beyond a predefined goal, e.g., tasks where survey knowledge is critical to success.
Furthermore, ML and DP can support one handed spatial navigation which is not practically possible with SP. This can be relevant when touch interaction is not an option, e.g., when carrying gloves on a ski slope. Another opportunity for investigating benefits of ML in tourism are social experiences where multiple tourists (friends or family) are collaborating together on a large physical map to perform a task such as planning their visit of a place. Even though there are other ways to search for points of interests, like restaurants, or to plan routes without ML (such as one person searching on her phone and the others looking over the shoulder, or everybody searching on their phone at the same time) there is potential that ML based experiences might be more enjoyable for the tourists [30]. It would be interesting to study if there is more collaboration and enthusiasm on such experience with a physical map and participants with their own ML versus a virtual map and participants with their own SP in a tourism context. ML can also allow tourists to personalize tourists’ experiences when interacting with a physical map. For example, seeing only the point of interests on the map relevant to a particular user, have different font sizes for better accessibility, etc.
Finally, business stakeholders should carefully consider alternatives to creating ML experiences for large printed maps. Specifically, interactive public displays can be a viable alternative for engaging people with local product and services, however come at a cost of maintenance of content and restrictions in personalization. Also, interactive public displays might not be practical in some remote locations (e.g., mountain maps where it would be very expensive to bring electricity and where the weather could damage the display). Interactive public displays can also be combined with mobile phone interaction to address needs of different users groups [2] and mitigate challenges with noticing the interactivity of printed posters [15].
To conclude, the main contribution of this work was to understand better the strengths and weaknesses of ML interaction with maps and compare them with static peephole interaction given contemporary sensing

Elsevier Science 20
technologies on small screen handheld devices. Today, ML interaction can add value over SP interaction for goal-oriented information browsing tasks on maps under specific circumstances (middle and large map sizes). If these conditions are not met designers of touristic applications should consider other factors to increase the user experience with ML interaction or consider alternative interfaces like interactive public screens to overcome the limitations of digital maps on small screens and the static nature of printed maps.
Acknowledgments
This work was supported by the EU FP7 project EXPERIMEDIA under the grant number ICT-FP7-287966.
References
[1] Akpan, I., Marshall, P., Bird, J., & Harrison, D.. Exploring the effects of space and place on engagement with an interactive installation. In Proceedings of the SIGCHI Conference on Human Factors in Computing Systems. ACM. (2013), pp. 2213-2222.
[2] Alt, F., Shirazi, A. S., Kubitza, T., & Schmidt, A.. Interaction techniques for creating and exchanging content with public displays. In Proceedings of the SIGCHI Conference on Human Factors in Computing Systems. ACM (2013), pp. 1709-1718.
[3] Baldauf, M., Fröhlich, P., Buchta, J., & Stürmer, T.. From Touchpad to Smart Lens: A Comparative Study on Smartphone Interaction with Public Displays. In International Journal of Mobile Human Computer Interaction, 5(2), Taylor & Francis (2013), pp. 1-20.
[4] Baldauf, M., Lasinger, K., & Fröhlich, P.. Private public screens: detached multi-user interaction with large displays through mobile augmented reality. In Proceedings of the 11th International Conference on Mobile and Ubiquitous Multimedia. ACM (2012), pp .27-
[5] Boring, S., Baur, D., Butz, A., Gustafson, S., & Baudisch, P.. Touch projector: mobile interaction through video. In Proceedings of the SIGCHI conference on Human factors in computing system. ACM (2010), pp. 2287-2296.
[6] Boring, S., Gehring, S., Wiethoff, A., Blöckner, A. M., Schöning, J., & Butz, A.. Multi-user interaction on media facades through live video on mobile devices. In Proceedings of the SIGCHI Conference on Human Factors in Computing Systems. ACM (2011), pp. 2721-2724.
[7] Brown, B., Reeves, S., & Sherwood, S.. Into the wild: challenges and opportunities for field trial methods. In Proceedings of the SIGCHI Conference on Human Factors in Computing Systems, ACM (2011) pp. 1657-1666.
[8] Brown, L. D., & Hua, H.. Magic lenses for augmented virtual environments. In Computer Graphics and Applications26 (4), IEEE (2006), pp. 64-73.
[9] Cao, X., Li, J. J., & Balakrishnan, R.. Peephole pointing: modeling acquisition of dynamically revealed targets. In Proceedings of the SIGCHI Conference on Human Factors in Computing Systems. ACM (2008), pp. 1699-1708.
[10] Dachselt, R., Häkkilä, J., Jones, M., Löchtefeld, M., Rohs, M., & Rukzio, E.. Pico projectors: firefly or bright future?. In Iinteractions, 19(2), ACM (2012), pp. 24-29.
[11] Darroch, I., Goodman, J., Brewster, S., & Gray, P.. The effect of age and font size on reading text on handheld computers. In Human-Computer Interaction-INTERACT 2005. Springer Berlin Heidelberg, (2005), pp. 253-266.
[12] Fitzmaurice, G. W.. Situated information spaces and spatially aware palmtop computers. In Communications of the ACM, 36(7). ACM (1993), pp. 39-49.
Elsevier Science 21
[13] Goh, D. H. L., Lee, C. S., & Razikin, K.. Comparative evaluation of interfaces for presenting location-based information on mobile devices. In Digital Libraries: For Cultural Heritage, Knowledge Dissemination, and Future Creation. Springer Berlin Heidelberg (2011), pp. 237-246.
[14] Grasset, R., Langlotz, T., Kalkofen, D., Tatzgern, M., & Schmalstieg, D.. Image-driven view management for augmented reality browsers. In International Symposium on Mixed and Augmented Reality 2012. IEEE (2012), pp. 177-186.
[15] Grubert, J., Grasset, R., & Reitmayr, G.. Exploring the design of hybrid interfaces for augmented posters in public spaces. In Proceedings of the 7th Nordic Conference on Human-Computer Interaction: Making Sense Through Design. ACM (2012), pp. 238-246.
[16] Grubert, J., Langlotz, T., & Grasset, R.. Augmented reality browser survey. Technical report, Institute for Computer Graphics and Vision, Graz University of Technology, Austria, 2011.
[17] Grubert, J., Morrison, A., Munz, H., & Reitmayr, G.. Playing it real: magic lens and static peephole interfaces for games in a public space. In Proceedings of the 14th international conference on Human-computer interaction with mobile devices and services. ACM (2012), pp. 231-240.
[18] Grubert, J., & Schmalstieg, D.. Playing it real again: a repeated evaluation of magic lens and static peephole interfaces in public space. In Proceedings of the 15th international conference on Human-computer interaction with mobile devices and services. ACM (2012), pp. 99-102.
[19] Hall, E. The Hidden Dimension. Anchor Books (1966) ISBN 0-385-08476-5.
[20] Hassenzahl, M., Burmester, M., & Koller, F.,. AttrakDiff: Ein Fragebogen zur Messung wahrgenommener hedonischer und pragmatischer Qualität. In Mensch & Computer. Vieweg+ Teubner (2003), pp. 187-196.
[21] Kirsten, R. G.. Methods for understanding the mobile user experience. In observing the mobile user experience, Proceedings of the 1st International Workshop. Held in Conjunction with NordiCHI. ACM (2010), pp. 1-4.
[22] Langlotz, T., Grubert, J., & Grasset, R.. Augmented reality browsers: essential products or only gadgets?. In Communications of the ACM, 56(11), ACM (2013), pp. 34-36.
[23] Lee, S., & Zhai, S.. The performance of touch screen soft buttons. In Proceedings of the SIGCHI Conference on Human Factors in Computing Systems. ACM (2009), 309-318.
[24] Li, F. C. Y., Dearman, D., & Truong, K. N.. Virtual shelves: interactions with orientation aware devices. In Proceedings of the 22nd annual ACM symposium on User interface software and technology. ACM (2009), pp. 125-128.
[25] Mackay, W. E., Pothier, G., Letondal, C., Bøegh, K., & Sørensen, H. E.. The missing link: augmenting biology laboratory notebooks. In Proceedings of the 15th annual ACM symposium on User interface software and technology. ACM (2002), pp. 41-50.
[26] McAuley, E., Duncan, T., & Tammen, V. V.. Psychometric properties of the Intrinsic Motivation Inventory in a competitive sport setting: A confirmatory factor analysis. In Research quarterly for exercise and sport, 60(1), (1989), pp. 48-58.
[27] Mehra, S., Werkhoven, H. and Worring, M.. Navigating on handheld displays: Dynamic versus static peephole navigation. In ACM Transactions on. Computer - Human Interaction., 13(4), ACM (2007), pp. 448-457.
[28] Mulloni, A., Grubert, J., Seichter, H., Langlotz, T., Grasset, R., Reitmayr, G., & Schmalstieg, D. Experiences with the Impact of Tracking Technology in Mobile Augmented Reality Evaluations. In MobileHCI 2012 Workshop MobiVis, ACM (2012).
[29] Morrison, A., Mulloni, A., Lemmelä, S., Oulasvirta, A., Jacucci, G., Peltonen, P., Schmalstieg, D., and Regenbrecht, H. Mobile Augmented Reality: Collaborative use of mobile Augmented Reality with paper maps. In Computer Graphics 35, (2011) pp. 789–799.

Elsevier Science 22
[30] Morrison, A., Oulasvirta, A., Peltonen, P., Lemmela, S., Jacucci, G., Reitmayr, G., & Juustila, A.. Like bees around the hive: a comparative study of a mobile augmented reality map. In Proceedings of the SIGCHI Conference on Human Factors in Computing Systems. ACM (2009), 1889-1898.
[31] Noma, H., Miyasato, T., & Kishino, F.. A palmtop display for dextrous manipulation with haptic sensation. In Proceedings of the SIGCHI Conference on Human Factors in Computing Systems. ACM (1996), 126-133.
[32] Pahud, M., Hinckley, K., Iqbal, S., Sellen, A., & Buxton, B.. Toward compound navigation tasks on mobiles via spatial manipulation. In Proceedings of the 15th international conference on Human-computer interaction with mobile devices and services, ACM (2013) pp.113-122.
[33] Olsson, T., Salo, M. Narratives of Satisfying and Unsatisfying Experiences of Current Mobile Augmented Reality Applications, In Proceedings of the SIGCHI Conference on Human Factors in Computing Systems,ACM (2012), pp. 2779-2788.
[34] Reichenbacher, T.. Adaptive concepts for a mobile cartography. In Journal of Geographical Sciences, 11(1), (2001) pp. 43-53.
[35] Reilly, D., Welsman-Dinelle, M., Bate, C., & Inkpen, K.. Just point and click?: using handhelds to interact with paper maps. In Proceedings of the 7th international conference on Human computer interaction with mobile devices & services. ACM (2005), pp. 239-242.
[36] Rohs, M., & Oulasvirta, A.. Target acquisition with camera phones when used as magic lenses. In Proceedings of the SIGCHI Conference on Human Factors in Computing Systems. ACM (2008), pp. 1409-1418.
[37] Rohs, M., Oulasvirta, A., & Suomalainen, T.. Interaction with magic lenses: real-world validation of a Fitts' Law model. In Proceedings of the SIGCHI Conference on Human Factors in Computing Systems, ACM (2011), pp. 2725-2728.
[38] Rohs, M., Schleicher, R., Schöning, J., Essl, G., Naumann, A., & Krüger, A.. Impact of item density on the utility of visual context in magic lens interactions. Personal and Ubiquitous Computing, 13(8) (2009), pp. 633-646.
[39] Rohs, M., Schöning, J., Raubal, M., Essl, G., and Krüger, A.. Map navigation with mobile devices: virtual versus physical movement with and without visual context. In Proceedings of the 9th international conference on Multimodal interfaces. ACM (2007), pp. 146-153.
[40] Scarr, J., Cockburn, A., & Gutwin, C. (2012). Supporting and Exploiting Spatial Memory in User Interfaces. Interaction, 6(1), 1-84.
[41] Schöning, J., Krüger, A., & Müller, H. J.. Interaction of mobile camera devices with physical maps. In Adjunct Proceeding of the Fourth International Conference on Pervasive Computing, (2006), pp. 121-124.
[42] Thomas, B. H.. A survey of visual, mixed, and augmented reality gaming. Computers in Entertainment (CIE), 10(3), 3, 2012.
[43] Ullmer, B., & Ishii, H. The metaDESK: models and prototypes for tangible user interfaces. In Proceedings of the 10th annual ACM symposium on User interface software and technology. ACM (1997), pp. 223-232.
[44] Yee, K. P.. Peephole displays: pen interaction on spatially aware handheld computers. In Proceedings of the SIGCHI conference on Human factors in computing systems. ACM (2003), pp. 1-8.


![Dual Camera Magic Lens for Handheld AR ... - WordPress.comQUIS scores [1-9]. (c) Preference ranking results (smaller is better); (d) Task time in minutes; 5 Discussion and Conclusion](https://img.pdfslide.us/doc/110x75/5f49d5e6b3f0c421e11c761a/dual-camera-magic-lens-for-handheld-ar-quis-scores-1-9-c-preference-ranking.jpg)