Embed Size (px)
Citation preview
The Use of Triangulation Methods inQualitative Educational Research
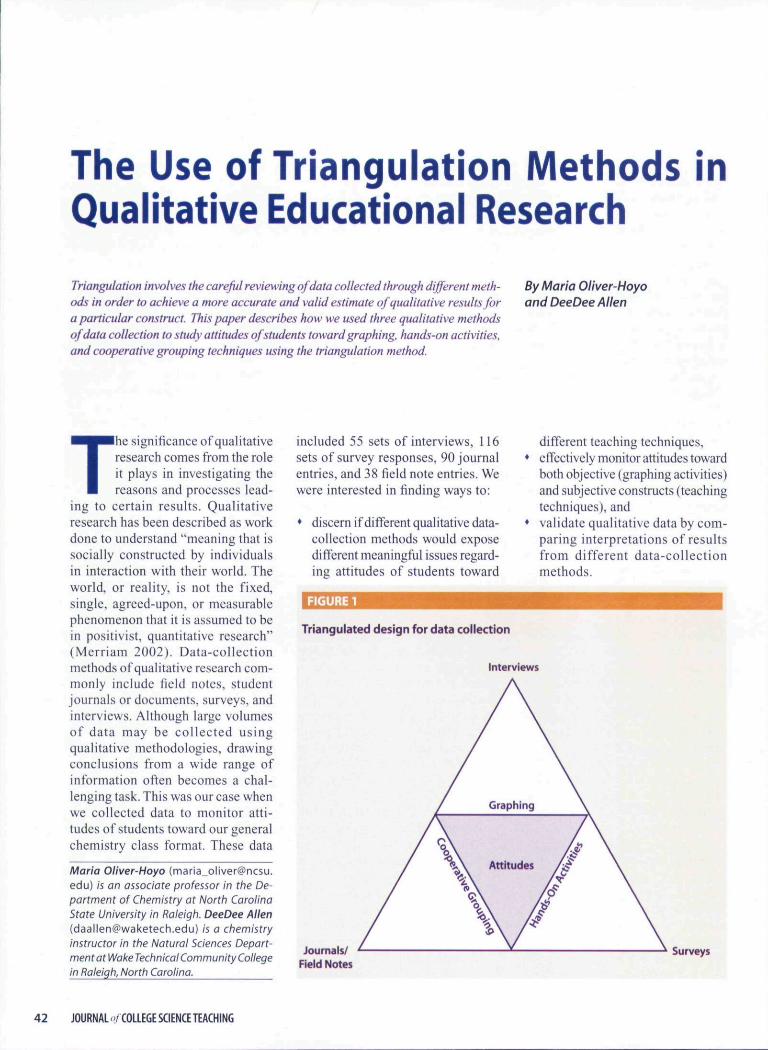
Triangulation involves the carejit! reviewing of data collected through different meth-ods in order to achieve a more accurate and valid estimate of qualitative results fora particular construct. This paper describes how we used three qualitative methodsof data collection to study attitudes of students toward graphing, hands-on activities,and cooperative grouping techniques using the triangulation method.
By Maria Oliver-Hoyoand DeeDee Allen
The significance of qualitativeresearch comes from the roleit plays in investigating thereasons and processes lead-
ing to certain results. Qualitativeresearch has been described as workdone to understand "meaning that issocially constructed by individualsin interaction with their world. Theworld, or reality, is not the fixed,single, agreed-upon. or measurablephenomenon that it is assumed to bein positivist, quantitative research"(Merriam 2002). Data-collectionmethods of qualitative research com-monly include field notes, studentjournals or documents, surveys, andinterviews. Although large volumesof data may be collected usingqualitative methodologies, drawingconclusions from a wide range ofinformation often becomes a chal-lenging task. This was our case whenwe collected data to monitor atti-tudes of students toward our generalchemistry class format. These data
Oliver-Hoyo ([email protected]) is an associate professor in the De-partment of Chemistry at North CarolinaState University in Raleigh. DeeDee Ailen([email protected]) is a chemistryinstructor in the Natural Sciences Depart-ment atWakeTechnical Community Collegein Raieigh, North Carolina.
included 55 sets of interviews, 116sets of survey responses, 90 journalentries, and 38 field note entries. Wewere interested in finding ways to:
• discern if difFerent qualitative data-collection methods would exposedifferent meaningful issues regard-ing attitudes of students toward
FIGURE 1
Triangulated design for data collection
different teaching techniques,• effectively monitor attitudes toward
both objective (graphing activities)and subjective constructs (teachingtechniques), and
• validate qualitative data by com-paring interpretations of resultsfrom different data-collectionmethods.
Interviews
Journals/Field Notes
Surveys
4 2 JOURNAL o/COLLEGESCIENCETEACHING
Our investigative interests in as-sessment methods led us to the useof triangulation methods. Trian-gulation compares information todetermine corroboration; in otherwords, it is a process of qualitativecross-validation (Wiersma 2000).Preferably, each method wouldmeasure the same construct whilehaving a different error type inher-ent in that method. The deficienciesof each method would then averageout. leaving a true estimate of asingle result (Brinberg and Kidder1982). Therefore, triangulationyields a more accurate and valid es-timate of a result when each methodof measurement actually convergeson the same answer (Mark andShotland 1987). However, completeconvergence may not always oc-cur in qualitative data. The resultthen becomes a range of possibleestimates that includes the actualanswer. The defining ofthe rangeis known as bracketing (Mark andShotland 1987).
This article presents how weused the triangulation methodto monitor change in attitudesof students toward cooperativegrouping, hands-on activities, andgraphing activities over the courseof a semester. The triangulationscheme used data collected viathree different qualitative researchmethods {interviews, surveys, andreflective journals or field notes).A schematic representation of ourtriangulation design is shown inFigure 1. Each vertex ofthe triangleproduces results that are comparedand weighed against the results ofthe other methods.
Instructional settingData were collected during a sec-ond semester general chemistrycourse taught in a format designedto foster cooperative groupingand hands-on activities known ascAcL2, or concept Advancementthrough chemistry Lab-Lecture,which is a dissemination projectof SCALE-UP. Student-CenteredActivities for Large Enrollment
Undergraduate Programs (Beich-ner et al. 2005; Oliver-Hoyo andAllen 2004, 2005; Handelsman etal. 2004). This format is ideal forthe collection of these data becauseit emphasizes the teaching andlearning techniques representedin our triangulation scheme. Forexample, students worked in groupsof three that were formed accord-ing to cooperative grouping guide-lines (Felder and Brent 1994) andclass time was driven by hands-onactivities with mini-lectures of15-20 minutes interjected into thesequence of activities. Graphingwas introduced when laptops wereused to collect data using probes.The data were then used to con-struct graphs and interpret results.Even though we did not focus onthe individual assessment of theseteaching techniques, it is importantto note that the attitudinal data werecollected from a setting that pro-moted these techniques, thereforeproviding valuable data to be usedin our triangulation method.
Data collectionFor the interview process, a randomstratified sampling procedure wasused to assign every student to oneof three one-on-one interviews con-ducted during the semester. Approxi-mately 18 students were assigned toeach interview. In order to achievesamples that were representative ofthe class, the samples were stratifiedbased on major, gender, and ethnicity.For instance, the student population inthis course consisted of 51% physi-cal science and engineering majors.therefore, 8 to 10 students out ofthe18 randomly chosen to participate in aparticular interview had to be physicalscience majors. The selections werethen evaluated based on gender andethnicity requirements for the sample,making the three interview samples assimilar as possible. Students were re-quired to attend these interviews andreceived three extra-credit points onan exam grade in return for their par-ticipation. A total of 40 people out ofthe final enrollment of 45 participated
in an interview and 15 of those stu-dents participated in two interviews.The same interviewer conductedall interviews. In addition to theseone-on-one interviews (interviews2. 3, and 4), all students participatedin a general interview (interview 1)conducted during class where stu-dents answered questions and threeinstructors walked around tables toanswer questions and guide the inter-view process. These interviews wereconducted during the second week ofclasses (interview 1). second and thirdmonth into the semester (interviews2 and 3. respectively), and during thefinal two weeks of classes (interview4). Therefore, we were able to monitorchanges as the semester progressed.
Survey data included a standarddepartmental end-of-semester surveyin addition to pre- and postsurveysdeveloped specifically for the course.Students also made entries into re-fiective journals on a regular basis,responding to a wide variety of ques-tions. The journal entries relevant tothe triangulation study were obtainedapproximately halfway through thesemester. Graphical data came fromhomework, survey questions, and theinterview process. Data on attitudestoward cooperative grouping andhands-on activities were collectedvia interviews, journals, and surveys.For the attitudes towards graphicalskills, field notes were used instead ofjournal entries. The field notes werecollected while observing studentbehavior as they graphed certain dataduring segments of interviews 3 and4. Behavioral patterns were identifiedand occurrences of these patternstabulated.
ResultsResults are grouped by the constructbeing measured and tabulated bymethod of data collection.
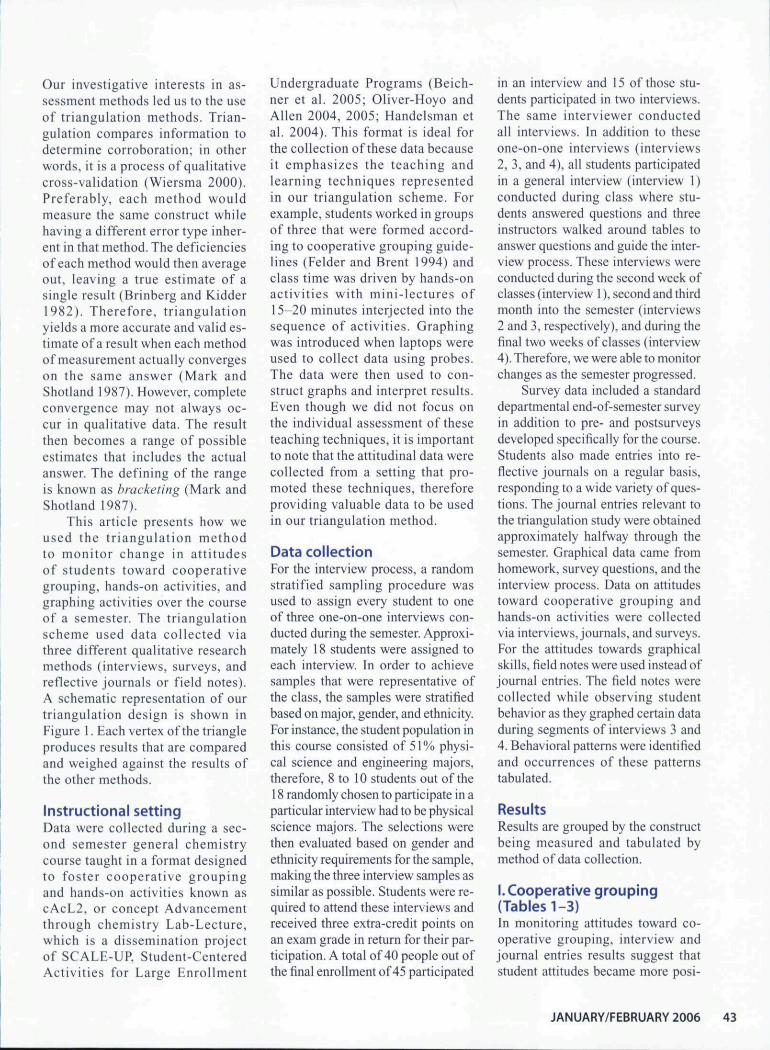
I. Cooperative grouping(Tables 1-3)In monitoring attitudes toward co-operative grouping, interview andjournal entries results suggest thatstudent attitudes became more posi-
JANUARY/FEBRUARY 2006 43
tive over the course of the semester.However, no conclusions can bedrawn from the survey data on coop-erative grouping.
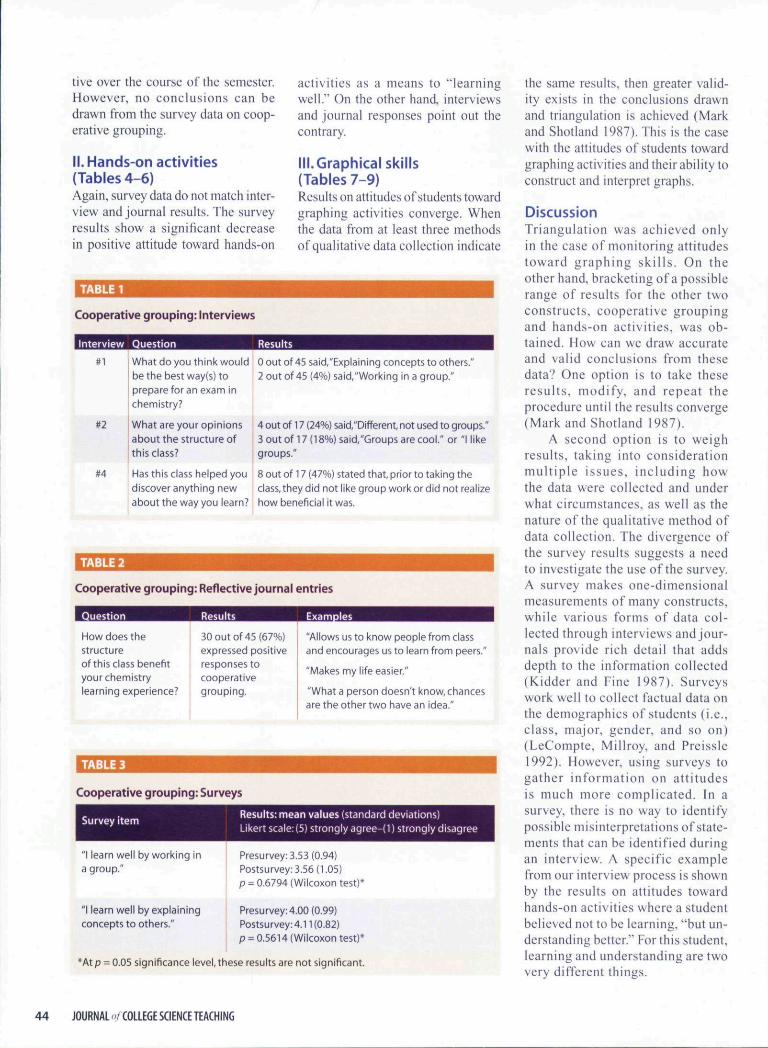
II. Hands on activities(Tables 4-6)Again, survey data do not match inter-view and journal results. The surveyresults show a significant decreasein positive attitude toward hands-on
TABLE 1
Cooperative grouping: Interviews
activities as a means to "learningwell." On the other hand, interviewsand journal responses point out thecontrary.
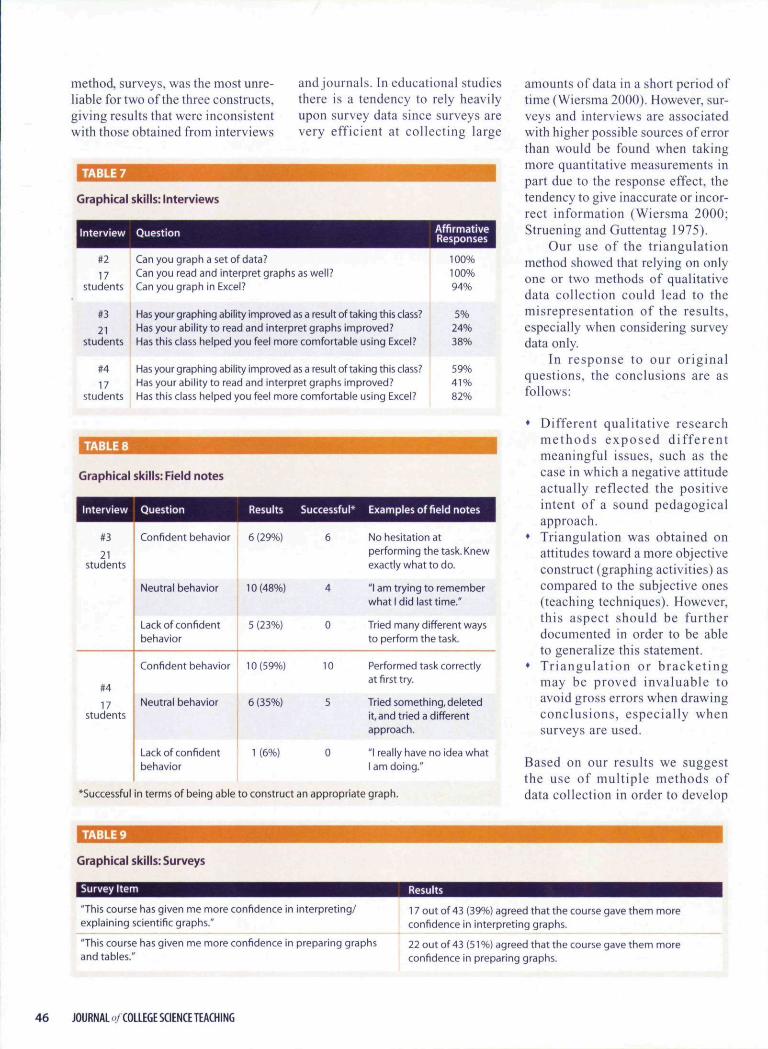
ill.Graphical skills(Tables 7-9)Results on attitudes of students towardgraphing activities converge. Whenthe data from at least three methodsof qualitative data collection indicate
Interview Question
#1
#2
#4
What do you think wouldbe the best way(s) toprepare for an exam inchemistry?
What are your opinionsabout the structure ofthis class?
Has this class helped youdiscover anything newabout the way you learn?
0 out of 45 said/'Explaining concepts to others.'2 out of 45 (4%) said,"Working in a group."
4 out of 17 (24%) said,"Different, not used to groups."3 out of 17(18%) said,"Groups are cool." or "I likegroups."
8 out of 17 (47%) stated that, prior to taking theclass, they did not like group work or did not realizehow beneficial it was.
TABLE 2
Cooperative grouping: Reflective journal entries
How does thestructureof this class benefityour chemistrylearning experience?
TABLE 3
30 out of 45 (67%)expressed positiveresponses tocooperativegrouping.
ExarriDles
"Allows us to know people from classand encourages us to learn from peers."
"Makes my life easier."
"What a person doesn't know, chancesare the other two have an idea."
Cooperative grouping: Surveys
Survey item
"I learn well by working ina group."
"I learn well by explainingconcepts to others."
Results: mean values (standard deviations)Likert scale: (5) strongly agree-(l) strongly disagree
Presurvey: 3.53 (0.94)Postsurvey: 3.56(1.05)p = 0.6794 (Wilcoxon test)*
Presurvey; 4.00 (0.99)Postsurvey:4.n(0.82)p = 0.5614 (Wilcoxon test)*
"At p-0.05 significance level, these results are not significant.
the same results, then greater valid-ity exists in the conclusions drawnand triangulation is achieved (Markand Shotland 1987). This is the casewith the attitudes of students towardgraphing activities and their ability toconstruct and interpret graphs.
DiscussionTriangulation was achieved onlyin the case of monitoring attitudestoward graphing skills. On theother hand, bracketing of a possiblerange of results for the other twoconstructs, cooperative groupingand hands-on activities, was ob-tained. How can we draw accurateand valid conclusions from thesedata? One option is to take theseresults, modify, and repeat theprocedure until the results converge(Mark and Shotland 1987).
A second option is to weighresults, taking into considerationmultiple issues, including howthe data were collected and underwhat circumstances, as well as thenature ofthe qualitative method ofdata collection. The divergence ofthe survey results suggests a needto investigate the use ofthe survey.A survey makes one-dimensionalmeasurements of many constructs,while various forms of data col-lected through interviews and jour-nals provide rich detail that addsdepth to the information collected(Kidder and Fine 1987). Surveyswork well to collect factual data onthe demographics of students (i.e..class, major, gender, and so on)(LeCompte, Millroy. and Preissle1992). However, using surveys togather information on attitudesis much more complicated. In asurvey, there is no way to identifypossible misinterpretations of state-ments that can be identified duringan interview. A specific examplefrom our interview process is shownby the results on attitudes towardhands-on activities where a studentbelieved not to be learning, "but un-derstanding better." For this student,learning and understanding are twovery different things.
4 4 JOURNAL <>! COLLEGE SCIENCE TEACHING
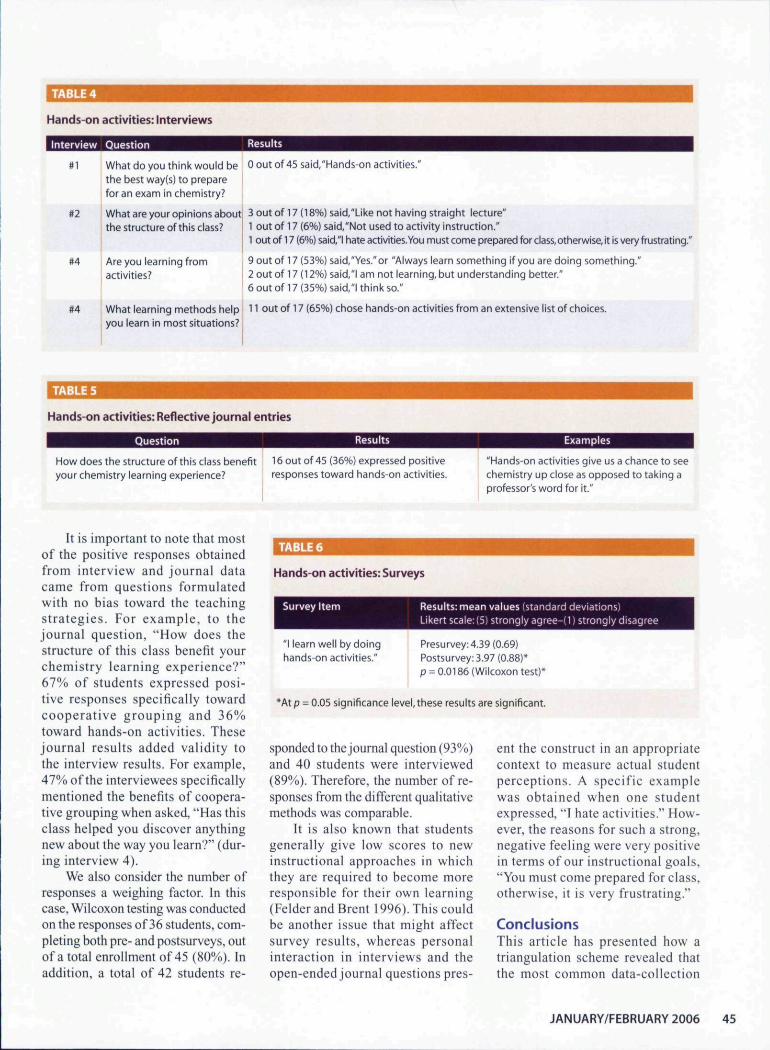
TABLE 4
Hands-on activities: Interviews
Interview Question
#1 What do you think would be 0 out of 45 said,"Hands-on activities."
#2
#4
#4
the best way(s) to preparefor an exam in chemistry?
What are your opinions aboutthe structure of this class?
Are you learning fromactivities?
3 out of 17 (18%) said,"Like not having straight lecture"1 out of 17 (6%) said/'Not used to activity instruction."1 out of 17 (6%) said,"l hate activities.You must come prepared for class, otherwise, it is very frustrating.'
9 out of 17 (53%)said."Yes."or "Always learn something if you are doing something."2 out of 17 (12%) said,"l am not learning, but understanding better."6 out of 17 (35%) said,"l think so."
What learning methods help 11 out of 17 (65%) chose hands-on activities from an extensive list of choices.you learn in most situations?
TABLE 5
Hands-on activities: Reflective journal entries
Question
How does the structure of this class benefityour chemistry learning experience?
16 out of 45 (36%) expressed positiveresponses toward hands-on activities.
Examples
"Hands-on activities give us a chance to seechemistry up close as opposed to taking aprofessor's word for it."
It is important to note that mostof the positive responses obtainedfrom interview and journal datacame from questions formulatedwith no bias toward the teachingstrategies. For example, to thejournal question, "How does thestructure of this class benefit yourchemistry learning experience?"67% of students expressed posi-tive responses specifically towardcooperative grouping and 36%toward hands-on activities. Thesejournal results added validity tothe interview results. For example,47% ofthe interviewees specificallymentioned the benefits of coopera-tive grouping when asked, "Has thisclass helped you discover anythingnew about the way you learn?" (dur-ing interview 4).
We also consider the number ofresponses a weighing factor. In thiscase, Wilcoxon testing was conductedon the responses of 36 students, com-pleting both pre- and postsurveys, outof a total enrollment of 45 (80%). inaddition, a total of 42 students re-
TABLE 6
Hands-on activities: Surveys
Survey Item
"I learn well by doinghands-on activities."
Results: mean values (standard deviations)Likert scale:(5i strongly agree-(l) strongly disagree
Presurvey: 4.39 (0.69)Postsurvey: 3.97 (0.88)*p = 0.0186 (Wilcoxon test)*
*At p = 0.05 significance level, these results are significant.
sponded to the journal question (93%)and 40 students were interviewed(89%). Therefore, the number of re-sponses from the different qualitativemethods was comparable.
It is also known that studentsgenerally give low scores to newinstructional approaches in whichthey are required to become moreresponsible for their own learning(Felder and Brent 1996). This couldbe another issue that might affectsurvey results, whereas personalinteraction in interviews and theopen-ended journal questions pres-
ent the construct in an appropriatecontext to measure actual studentperceptions. A specific examplewas obtained when one studentexpressed, "I hate activities " How-ever, the reasons for such a strong,negative feeling were very positivein terms of our instructional goals,"You must come prepared for class,otherwise, it is very frustrating."
ConclusionsThis article has presented how atriangulation scheme revealed thatthe most common data-collection
JANUARY/FEBRUARY 2006 45
method, surveys, was the most unre-liable for two ofthe three constructs,giving results that were inconsistentwith those obtained from interviews
TABLE 7
Graphical skills: Interviews
Interview Question
and journals. In educational studiesthere is a tendency to rely heavilyupon survey data since surveys arevery efficient at collecting large
#2
17students
#3
21students
#4
17Students
TABLE 8
Can you graph a set of data?Can you read and interpret graphs as well?Can you graph in Excel?
Has your graphing ability improved as a result of taking this class?Has your ability to read and interpret graphs improved?Has this class helped you feel more comfortable using Excel?
Has your graphing ability improved as a result of taking this class?Has your ability to read and interpret graphs improved?Has this class helped you feel more comfortable using Excel?
AffirmativeResponses
100%100%94%
5%24%38%
59%41%82%
Graphical skills: Field notes
Interview
#3
21Students
#4
17Students
Question
Confident behavior
Neutral behavior
Lack ofconfidentbehavior
Confident behavior
Neutral behavior
Lack of confidentbehavior
Results
6 (29%)
10(48%)
5 (23%)
10(59%)
6 (35%)
1 (6%)
Successful*
6
4
0
10
5
0
Examples of field notes 1
No hesitation atperforming the task. Knewexactly what to do.
"1 am trying to rememberwhat 1 did last time."
Tried many different waysto perform the task.
Performed task correctlyat first try. I
Tried something, deletedit, and tried a differentapproach.
"1 really have no idea what1 am doing."
'Successful in terms of being able to construct an appropriate graph.
amounts of data in a short period oftime (Wiersma 2000). However, sur-veys and interviews are associatedwith higher possible sources of errorthan would be found when takingmore quantitative measurements inpart due to the response effect, thetendency to give inaccurate or incor-rect information (Wiersma 2000;Struening and Guttentag 1975).
Our use of the triangulationmethod showed that relying on onlyone or two methods of qualitativedata collection could lead to themisrepresentation of the results,especially when considering surveydata only.
In response to our originalquestions, the conclusions are asfollows:
• Different qualitative researchmethods exposed differentmeaningful issues, such as thecase in which a negative attitudeactually reflected the positiveintent of a sound pedagogicalapproach.
• Triangulation was obtained onattitudes toward a more objectiveconstruct (graphing activities) ascompared to the subjective ones(teaching techniques). However,this aspect should be furtherdocumented in order to be ableto generalize this statement.
• Triangulation or bracketingmay be proved invaluable toavoid gross errors when drawingconclusions, especially whensurveys are used.
Based on our results we suggestthe use of multiple methods ofdata collection in order to develop
TABLE 9
Graphical skills: Surveys
Survey Item
"This course has given me more confidence in interpreting/explaining scientific graphs."
"This course has given me more confidence in preparing graphsand tables."
17 out of 43 (39%)agreed that the course gave them moreconfidence in interpreting graphs.
22 out of 43 (51%) agreed that the course gave them moreconfidence in preparing graphs.
4 6 JOURNAL ('/COLLEGE SCIENCE TEACHING
a full picture ofthe situation. Thedevelopment of more integratedassessment strategies can create asystem of checks and balances toensure the validity of results. •
References
Beichner. R.,1., and J.M. Saul. 2005.Introduction to SCALE-UP (Stu-dent-Centered Activities for LargeEnrollment-Undergraduate Pro-grams) Project. In Invention andimpact: Building excellence inundergraduate science, technol-ogy, engineering and mathematics(STEM) education, 61-66. Wash-ington. DC: American Associationfor the Advancement of Science.
Brinberg. D., and L.H. Kidder. 1982.New directions for methodologyof social and behavioral science.In Forms of validity in research,12 (Chapter 5). San Francisco:Jossey-Bass.
Felder, R.M., and R. Brent. 1994.Cooperative learning in technical
courses: Procedures, pitfalls, andpayoffs. (ERIC Document Repro-duction no. ED 377 038)
Felder, R.M., and R. Brent. 1996.Navigating the bumpy road to stu-dent-centered instruction. CollegeTeaching 44(2): 4^-41.
Handelsman, J., D. Ebert-May, R.Beichner, P. Bruns, A. Chang, R.DeHaan, J. Gentile, S. Lauffer, J.Stewart, S.M. Tilghman, and W.B.Wood. 2004. Scientific teaching.Science 304 (14): 521-22.
Kidder, L.H., and M. Fine. 1987. Newdirections for program evaluation.In Multiple methods in programevaluation, eds. M.M. Mark andR.L. Shotland, 57-75. San Fran-cisco: Jossey-Bass.
LeCompte, M.D., W.L. Millroy,and J. Preissle, eds. 1992. Thehandbook of qualitative researchin education. San Diego: Aca-demic Press.
Mark, M.M., and R.L. Shotland.1987. New directions for pro-
gram evaluation. In Multiplemethods in program evaluation,eds. M.M. Mark and R.L. Shot-land, 35 (chapters 2, 4, 6). SanFrancisco: Jossey-Bass.
Merriam, S.B. 2002. Qualitativeresearch in practice: Examplesfor discussion and analysis. SanFrancisco: Jossey-Bass.
Oliver-Hoyo, M., and D, Allen.2004. Effects of an active envi-ronment: Teaching innovationsat a research I institution. Jour-nal of Chemical Education 81(3): 441-48.
Oliver-Hoyo, M., and D. Allen. 2005.Attitudinal effects of a student-cen-tered active learning environment.Journal of Chemical Education 82(6): 944^9.
Struening, E.L., and M. Guttentag,eds. 1975. Handbook of evaluationresearch. Beverly Hills: Sage.
Wiersma, W. 2000. Research methodsin education: An introduction. 7thed. Boston: Allyn & Bacon.
\ SEARCHNEW TREASURER POST OPENThe National Science Teachers Association announces the openingof the NSTA Treasurer position. Responsibilities include oversightof the association's financial and hudfjetary matters. The Treasurer 'shall he appointed hy the Board of Directors for a three-year term of joffice, which may he renewed for another three-year term.Appointees will be expected to devote 10-12 days of service a year ^for this nonstaff position.
An honorarium will he provided as well as reimhursements forrequired meeting attendance (travel and per diem).
Application Deadline: January 15, 2006
Interested individuals are invited ro submit their resume alongwith a cover lerter that specifies interest in being considered forappointment to:
NSTA Executive Director,1840 Wilson Blvd. Arlington. VA 22201-3092. 1
o
FOR ADDITIONAL
INFORMATION ABOUT
THE POSITION'S
RESPONSIBILITIES, VISIT
HTTP://CAREERS.NSTA.ORG.
JANUARY/FEBRUARY 2006 47