Embed Size (px)
Citation preview
[
THE USE OF THREE STANDARDIZED DEVELOPMENTAL
SCREENING TESTS WITH CROW HEAD START CHILDREN
by
Maureen Margaret Malone
A thesis submitted in partial fulfillment of the requirements for the degree
of
Master of Nursing
MONTANA STATE UNIVERSITY Bozeman, Montana
May 1993
'p

Wz 5.
ii
APPROVAL
of a thesis submitted by
Maureen Margaret Malone
This thesis has been read by each member of the graduate committee and has been found to be satisfactory regarding content, English usage, format, citations, bibliographic style, and consistency, and is ready for submission to the College of Graduate Studies.
Date
Approved for the Major Department
Date
Approved for the College of Graduate Studies
Date 7 Graduate Dean

r 'rn "1[[' $"1 'iy, z
iii
STATEMENT OF PERMISSION TO USE
In presenting this thesis in partial fulfillment of
the requirements for a master's degree at Montana State
University, I agree that the Library shall make it
available to borrowers under rules of the Library.
If I have indicated my intention to copyright this
thesis by including a copyright notice page, copying is
allowable only for scholarly purposes, consistent with
"fair use" as prescribed in the u.S. Copyright Law.
Requests for permission for extended quotation from or
reproduction of this thesis in whole or in parts may be
granted only by the copyright holder.
Signature
Date 5-3--1'3

"pm
iv
This work is dedicated to my parents, Ed and Jean Malone, and to my daughters, Chelsea and Wendy.
aM;:;

5 "ere! " rnmvrmm
v
ACKNOWLEDGEMENTS
I wish to express my gratitude to the members of my
thesis committee, Dr. Sharon Leder and Lucretia smith, for
their guidance and suggestions throughout this project. I
am especially grateful to Dr. Jean N. Gullicks, my thesis
chair, for sharing her expertise in both the disciplines of
nursing and child development and for inviting me to work
with her on the block grant. Her endless hours of help,
encouragement, and patience were of great value to me. I
also acknowledge Dr. Clarann Weinert for her help with data
analysis and for the privilege of having her for the
nursing research courses.
I wish to thank Mary Snepenger for running the data
analysis and being available for phone consults. Credit is
due to Renae Helzer and Wanda Myers for help with typing
and editing.
I wish to extend sincere gratitude to Nora Bird, Crow
Head Start Director, the Crow Head start staff, children,
and parents for giving me permission and assistance to do
the development screening tests. Finally, I thank Luana
Auker, Public Health Nursing Supervisor at the Crow Service
unit, and Tennyson Doney, Crow Service unit Director, for
their support throughout my graduate studies.

5- "prY 'II ''-EYE t'• E ¥
vi
TABLE OF CONTENTS
LIST OF TABLES
LIST OF FIGURES •
ABSTRACT
1. INTRODUCTION
Problem Statement . Purpose . . . . .
Hypotheses • . • . Operational Definitions . Assumptions . . • .
2. REVIEW OF LITERATURE
Theoretical Background Cause-Effect Models . Group Comparison Models . Developmental Change Model . . . . . . . Contextualist Models Cultural Disorganization . . . • . Summary of Theoretical Models ....
Implications for Developmental Testing General Implications . . . . . • • Implications for Native American
Children • . . . . . . . . . . • Perspectives in Developmental Screening •
Efforts to Reduce Test Bias • . . . . Examples of Specific Cross-Cultural
Studies . . . . . . . Summary of Perspectives in
Developmental Testing . . Conceptual Framework
Page
viii
ix
x
1
1 5 5 7
10
11
12 12 14 15 17 21 23 24 24
28 35 35
39
41 44

E T
vii
TABLE OF CONTENTS--Continued
3. METHODS
Design . . . . . . • . Sample . . . . . . . . . . Data Producing Instruments
Peabody Picture Vocabulary Test-Revised (PPVT-R) . . .
McCarthy Scales of Children's Abilities (MSCA) . . . .
Early Screening Inventory (ESI) Data Collection ......•.•. Data Analysis • . . . . Human Subjects
4. RESULTS.
5. DISCUSSION
, pn z' "'mrmWfrrrm
Page
48
48 49 50
51
53 56 59 61 62
64
73
PPVT-R . . . . . 73 MSCA . . • . 74 ESI . . . . . . . . • . 75 Score Distributions . . . . •. .•• 77 Correlation . . • . . . . . .. ..• 78 Monolingual and Bilingual Performance • • .. 80 Interpersonal and Extraneous Influences • .. 80 Conclusion . . . . . . . . . . . . . . • 82 Implications for Future Research 85
REFERENCES 89
APPENDICES 98
Appendix A--Data Collection Instruments 99 Appendix B--Permission to Collect Data • 130 Appendix c--Distribution of Head Start Scores .. 144

'·5 WP';:
Table
1.
2.
3.
4.
5.
6.
? 5r if
viii
LIST OF TABLES
Head Start Sample Assignment into Test Groups . . . . . • • • . . . .
Head Start Group Configuration for Instruments . • • . . . . . . .
Comparison of Head Start Sample and Normed Sample for the PPVT-R
Comparison of Head Start Sample and Normed Sample for the ESI • . .
Comparison of Head Start Sample and the Standardization Sample for the MSCA
Summary of Lilliefors Scores for Head Start MSCA Scale Indexes . . . . .
7. Correlations Between Pairs of Test
8.
Scores
comparison of Head Start Sample Monolingual and Bilingual Test Performance (Mean Scores)
Page
65
65
66
67
69
70
70
71

Figure
1.
2.
3.
4.
5.
6.
7.
8.
S7 73 yr· 7?mnrnmr
ix
LIST OF FIGURES
Factors Influencing the Observed Developmental Abilities of a Child During Developmental Screening Testing . . .
Frequency Distribution of Head Start PPVT-R Scores . . . . . . . • . . . .
Frequency Distribution of Head Start Verbal Scale Scores (MSCA) . . . . . Frequency Distribution of Head Start Perceptual Scale Scores (MSCA) . . . Frequency Distribution of Head Start Quantitative Scale Scores (MSCA)
Frequency Distribution of Head Start General Cognitive Scale Scores (MSCA)
Frequency Distribution of Head Start Memory Scale Scores (MSCA) ...•.
Frequency Distribution of Head Start Motor Scale Scores (MSCA) . • . . • .
· ·
· ·
· ·
· ·
· ·
· ·
· ·
· ·
Page
45
145
146
147
148
149
150
151

5 q • r nnrrwrrzzm' '!it' t'
x
ABSTRACT
The use of standardized developmental screening tests with Crow Native American preschool children represents cross cultural testing. This is likely to produce invalid results. Potential sources of error in testing include language differences and differences in experiential backgrounds of Crow children and children for whom the tests were developed (Brescia & Fortune, 1989; Dana, 1984; Fradd & Hallman, 1983).
This was a comparative study of the performance of 60 Crow Head Start children on three standardized developmental screening tests with the performance of the normed population for each test. The tests that were used were the Peabody Picture Vocabulary Test-Revised (PPVT-R) (Dunn & Dunn, 1981), the McCarthy Scales of Children's Abilities (MSCA) (McCarthy" 1972), and the Early Screening Inventory (ESI) (Meisels & Wiske, 1988). Children were placed into one of three groups (n = 20 per group) with each group taking two of the three tests. The test performance of the monolingual and bilingual children within the Head start sample were compared. Correlations were run between the General Cognitive Index (GCI) of the MSCA and the PPVT-R, the PPVT-R and the ESI, and the GCI and the ESI.
The Head start sample obtained significantly lower scores on the PPVT-R than the normed population. Head start scores were significantly higher than the norm on the MSCA for all scales but the verbal. There were no significant differences between the Head start scores and the normed scores on the ESI. There were no significant differences in test performances between monolingual and bilingual Head start children. The GCI correlated significantly with both the PPVT-R and the ESI. The ESI did not significantly correlate with the PPVT-R.
Results indicated that, in this group of Crow children, the PPVT-R may be less able to distinguish delays due to cultural and language differences from delays due to a potential disability in receptive vocabulary. It is recommended that these tests be used, along with other information about a child, for making diagnostic decisions or planning developmental stimUlation. Further research is required before these tests can be used to make inferences about a child's aptitude or potential.

"".~:x ?Eli? 1 *" '-i5i '-rf
1
CHAPTER 1
INTRODUCTION
Problem statement
Health care professionals, educators, and Native
American tribal leaders are increasingly aware of the
necessity of supporting and encouraging achievement of
children's developmental abilities through early
identification, intervention, and prevention of potential
problems (Berlin, 1982). Native American children are a
population at risk for developmental delays due to the
social conditions of poverty and alcoholism which are
highly prevalent in their societies (Berlin, 1982; May,
1988, VanBreda, 1989). In many Native American
communities, there is a high incidence of health problems
such as fetal alcohol syndrome, otitis media, abuse and
neglect, gastroenteritis, and accidents which can further
influence a child's course of development (DiNicola, 1986;
McShane, 1988; VanBreda, 1989). The majority of
information on abilities of Native American children
consists of intellectual assessment patterns of school-aged
children through young adults. Little information can be
found on the developmental abilities of the preschool

F an,,' 7:ltIfW rrrcr ... " eta
2
Native American child, a critical age for identification
and early intervention.
A primary method employed by health care providers to
assess the developmental status of a child is the use of
standardized developmental tests or screening tests such as
the McCarthy Scales of Children's Abilities (McCarthy,
1972), the Peabody Picture Vocabulary Test (Dunn & Dunn,
1981), and the Early Screening Inventory (Meisels & Wiske,
1988). Based upon the results obtained from one of these
tests, a child may be found to be above, below, or within a
normal range of development as determined by norms
established from previous administration of the test with
various population groups. This information along with
other data about the child is used by health care providers
in their decisions to either monitor future growth and
development of the child in a regular clinic setting, or to
recommend that the child be referred for a comprehensive
evaluation (Visscher, 1989). At times information obtained
from developmental screening tests is used as evidence in
courts of law for child protection cases. In addition,
parents may gauge their success at parenting by how well
they perceive their child performs on a developmental test.
Native American children are not typically represented
in the population samples of standardized developmental
screening tests. If they are represented, they are usually
included in an ethnic group sample entitled "Other" which

r 7 • %1 n 'rmrrr'zmm1t!', ,'I
3
also represents Chinese, Filipino, Japanese and all races
not classified as black, white, or Hispanic. It is also
rarely specified in discussions on validity and reliability
of the tests as to whether the testers are of the same
ethnic group as the subject. There have been several
reports in the literature that developmental screening
tests and other standardized tests of ability may not
appropriately identify Native American children at risk
(Brescia & Fortune, 1989; Burke, Baumgart, Sayers & Wray,
1985; Dana, 1984). Yet, the developmental abilities of
Native American children are still identified with
standardized tests because they have widespread public and
professional acceptance, are relatively cost-efficient, and
in many cases have developed into a major commercial
enterprise (Miller-Jones, 1989).
A major criticism of standardized tests is that the
content sampled by the test items may favor one socio
cultural experience over another or may not reflect the
kind of subject matter likely to be encountered by the
child (Armour-Thomas, 1992; Dana, 1984; Fradd & Hallman,
1983; Miller-Jones, 1989). Another important criticism is
that the low performance of certain tasks during a testing
situation may result from interpersonal aspects of the
testing situation rather than from lack of competence in
that task (Miller-Jones, 1989). Testing settings which
elicit defensive behavior on the part of the child or which

; ! 05 7 TE'Sm.. II,.!
4
are incompatible with the child's accustomed interpersonal
interaction patterns may impact negatively on the child's
test performance. This may result in erroneous judgments
of the abilities of children from culturally diverse
backgrounds (Armour-Thomas, 1992).
Various modifications have been developed to try to
improve testing procedures. Tests have been translated
into other languages and interpreters have been used in the
testing situations (DeBlassie & Franco, 1983). Not only
are these solutions often unrealistic and costly but they
do not solve the problem of culture specific content and
there may be little standardization in the content of the
translated version (Fradd & Hallman, 1983). Another method
that has been greatly criticized is that of adding bonus
points to test scores based on minority status (Dana,
1984). Renorming the test on the culturally different
population may show some promise by providing a basis for
looking at test results in comparison with scores of the
local peer group (Visscher, 1989).
For decisions about a child's development, multiple
sources of information need to be assessed including
information about the child's environment, medical history,
family and childrearing patterns (Meisels, 1991). The
developmental screening test when used consistently and
comprehensively still remains an important method to
accurately identify and refer children with developmental

5
delays. The problem of assessing children from culturally
different backgrounds is far from solved. It is a
professional and ethical responsibility to cautiously use
conventional assessment or screening measures and to
continue to search for methods that will accommodate the
needs of culturally diverse populations (Visscher, 1989).
Purpose
The primary goal of this study is to determine the
accuracy of three standardized developmental tests in
identifying the presence or absence of developmental delays
in a group of Native American Head start children. The
three standardized developmental tests used for the study
are the Peabody Picture Vocabulary Test-Revised (PPVT-R)
(Dunn & Dunn, 1981), the McCarthy Scales of Children's
Abilities (MSCA) (McCarthy, 1972), and the Early Screening
Inventory (ESI) (Meisels & Wiske, 1988). The information
gained from this study will provide data to facilitate more
appropriate developmental screening and intervention with
Native American children.
Hypotheses
To sharpen the focus and to further clarify the study,
the following null hypotheses were formulated:

E t TT ' WW 7·'·' f1crrw'tmt! '1' r
6
1. The performance on the PPVT-R for the Head start
sample will be no different from the performance on the
PPVT-R reported for the normed population.
2. The distribution of PPVT-R standard equivalent
scores for the Head start sample will be no different from
a normal distribution.
3. There will be no difference in the performance on
the ESI in the critical age ranges for the Head start
sample and in the performance in the corresponding age
ranges reported for the ESI normed population.
4. The verbal, perceptual, quantitative, general
cognitive, motor and memory performance on the MSCA for the
Head start sample will be no different than the performance
reported in these areas on the MSCA for the normed
population.
5. The distribution of each of the six MSCA scale
index scores for the Head start sample will be no different
from a normal distribution.
6. The standard score equivalents for the PPVT-R, the
General Cognitive Index scale score for the MSCA, and the
total screening score for the ESI (all ages) will not vary
significantly with each other.
7. In the Head start sample, the children who are
monolingual and the children who are bilingual will have no
significant differences in their standard equivalent score
IT 5
7
on the PPVT-R, in any of their six scale index scores on
the MSCA, or in their total screening ESI score.
operational Definitions
The variables of interest were operationalized as
follows:
1. Head start is a federally funded preschool program
for 3-5 year-old children from low socio-economic
backgrounds.
2. Crow Indian Reservation is the area of land in
south-central Montana, bordering the state of Wyoming,
located mainly in Big Horn County and belonging to and
governed by the Crow Indian Tribe. Enrollment into the
Crow Indian Tribe must be approved by the Crow Tribal
council. A current enrollment requirement is a blood
quantum of one quarter (Moran, 1989).
3. A Native American is a member of anyone of the
tribes of North American Indians.
4. Standardized test is an instrument composed of
empirically selected items that has definite instructions
for use, adequately determined norms, and data on
reliability and validity (NAEYC, 1988). For this study,
standardized tests refer to the Peabody Picture Vocabulary
Test-Revised (PPVT-R) (Dunn & Dunn, 1981), the McCarthy
Scales of Children's Abilities (MSCA) (McCarthy, 1972), and

'5W
; 1 I rCMWn "'7" ;f''-~~
8
the Early screening Inventory (ESI) (Meisels & Wiske,
1988).
5. Developmental screening test refers to tests used
to identify children who may be in need of special
services, as a first step in identifying children in need
of further diagnosis. The test focuses on the child's
ability to acquire skills (NAEYC, 1988). In this study,
the MSCA, ESI, and the PPVT-R are developmental screening
tests.
6. Accuracy refers to how well a screening test
identifies children who are developmentally delayed and in
need of special services regardless of their cultural and
linguistic background (Visscher, 1989). This is further
defined by assessing the percentage of children who would
be referred as a result of their score on the test. This
will consist of those Head Start children scoring 1.5
standard deviations below the mean score reported for the
standardized population for each developmental test. The
percentage of Crow Head Start children in the referral
group for each developmental test of this study should
correspond to the national prevalence rate in the general
population for the developmentally delayed children which
is about 12% of the population (Haring & McCormick, 1986).
The percentage of Crow Head Start children scoring in the
referral range on each test should also correspond to the
11% rate reported for the MSCA and the PPVT-R and the

! BY r 7
9
5% rate reported for the ESI. A further indication of
accuracy is the correlation of scores between the
developmental screening tests. The results of the team
evaluations that would follow referral of a child and
determine his/her eligibility for special services would
also indicate accuracy but this is beyond the scope of this
study.
7. Normal distribution refers to a form of description
in which the values of a variable are arranged in a pattern
that is bell-shaped, symmetrical, unimodal, and not too
peaked. Half of the observations lie above the mean and
half below it (Freedman, Pisani, & Purves, 1980).
8. Testing refers to the administration, scoring, and
interpretation of scores on a standardized test (NAEYC,
1988).
9. Identify refers to the testing process whereby
certain children are found to be in need of more testing
and evaluation for further diagnosis and/or special
services. This is determined by how many months they are
delayed in certain areas of sensorimotor performance in
comparison to their peers (Visscher, 1989).
10. Developmental delay is identified in those
children scoring in the "refer" range on a developmental
test which are usually those children scoring two standard
deviations below the standardized mean score for the test.
I' -. tTi,
WE
10
11. Developmental ability is the chronological age
equivalent at which children successfully perform a group
of sensorimotor tasks in comparison to the mean age of
successful performance of their peers (McCarthy, 1972).
12. Standardized or normed population is the specified
group of test takers whose performance on a test is used as
the statistical basis for comparing and interpreting the
scores of other individuals or groups who take the same
test after them (Omark & Watson, 1983).
13. Tester is the person(s) who administer the
developmental screening test to the child.
14. Monolingual refers to those children understanding
and speaking only the English language.
15. Bilingual refers to those children who are able to
either speak the Crow language and/or fluently understand
the Crow language.
Assumptions
It is assumed that since the General Cognitive Index
has correlated with both the PPVT-R (Oakes & Faust, 1990)
and the ESI (Meisels & Wiske, 1988) that the ESI and the
PPVT-R will also correlate.
11 , t,

w PXX
11
CHAPTER 2
REVIEW OF LITERATURE
There is long-standing controversy regarding
assessment of children from culturally and linguistically
different backgrounds. Researchers have sought to solve
testing problems encountered with culturally diverse
populations by focusing on such assessment aspects as
cultural bias, differences in perceptual and cognitive
styles, and influence of culture on learning and assessment
(Fradd & Hallman, 1983). A growing body of information has
been amassed related to the school-aged child, but there
are still gaps in the literature pertaining to
developmental screening of preschool children. Published
material related to assessment of Native American preschool
children is even more limited. The purpose of this
literature review is to: (a) review the extant theories
and research on the developmental abilities of children
from culturally different backgrounds, (b) discuss the
implications of developmental testing of culturally
different children, (c) give perspectives for developmental
testing and screening for preschool children from
culturally diverse backgrounds, and (d) develop a
conceptual framework.

12
Theoretical Background
Y' ny! 'ffi'FPZ'E?n=mml 'p.,,'.,'"'j
In an attempt to explain the unique patterns of
ability and achievement in Native American children several
theoretical models have been proposed. Among the models
that will be discussed are cause-effect models, group
comparison models, developmental change models,
contextualist models, and cultural disorganization.
Cause-Effect Models
Cause-effect models have their roots in perspectives
developed from statements of an eighteenth century pioneer
in child psychology, John Locke (Omark & Watson, 1983).
Locke (1690) argued that at birth the mind is like a white
paper void of all characteristics and that whatever the
child becomes as an adult is almost completely the result
of experiences and learning. This view proposes that if
one performs a series of actions before a child, this will
cause within the child the effect of learning something.
In applying the cause-effect model, researchers may
question whether outside causal factors such as language,
race, poverty, or single-parent families cause
interruptions in achievement of developmental abilities in
children (Omark & Watson, 1983). This concept is further
explained by three overlapping concepts: disadvantage,
deficit, and deprivation (McShane, 1983). The disadvantage
hypothesis suggests that Native American children

5
13
experience detrimental environmental conditions that place
them at greater disadvantage and risk in relation to more
fortunate groups of children. Economic poverty, poor
housing, poor health care, crowded living space, and access
to lower quality educational programs and experiences are
factors not supportive of, and may impede development
(McShane, 1983; May, 1988).
Conditions of disadvantage along with other factors
may lead to specific deficits such as epidemic prevalence
of middle-ear disease resulting in hearing loss and
possible language deficiencies (McShane & Plas, 1982;
McShane, 1988). High prevalence of untreated alcoholism in
some tribal communities increases the number of Fetal
Alcohol Effect infants who may exhibit moderate to severe
cognitive delays (McShane, 1983). Native American children
experience higher rates of morbidity from accidents,
meningitis, pneumonia, and gastrointestinal illness, all of
which can cause developmental deficits in motor, cognitive,
and verbal abilities (Berlin, 1982; May, 1988).
A combination of disadvantage and deficit merges into
deprivation (McShane, 1983). Poverty and substandard
crowded living conditions lead to more illnesses which can
cause disruptions in parent-infant bonding and less
opportunities for infants to be developmentally stimulated.
Economic pressures may lead to high mobility of families
and children between households and communities causing a
m •
MET ""
14
loss of stability and continuity in child rearing and
probable deprivation of essential social and cognitive
experiences. In short, the disadvantage/deficit/deprivation
model proposes a multitude of negative factors that are
severely detrimental to the Native American child's ability
to develop mentally, emotionally, spiritually, and
physically thus placing him/her at high risk for
developmental delays and future academic failure (McShane,
1983).
Group Comparison Models
A concept related to cause-effect relationships is
group responses to test situations (Omark & Watson, 1983).
To see whether a particular cause had some effect,
statistical models were developed to "prove" a cause-effect
relationship. Spearman (1927) laid the foundations for
statistical group comparison models by using general
mathematical laws derived from correlations. He noted that
all tests of ability are positively correlated. Spearman
(1927) deduced that this is possible because there is a
fundamental energy factor "g" at work in all tests of
mental ability. This mental energy and a sense of an
individual's overall ability can then be captured
mathematically in terms of the individual's test score's
relative distance from a group mean. Hence, the birth of
standardized testing and comparison of individual or group

ZiE
15
scores with standard scores. virtually all statistical
models depend on group comparisons (Omark & watson, 1983).
It then follows that a primary purpose of most standardized
tests of developmental ability is to ascertain individual
and group differences in performance (Armour-Thomas, 1992).
Developmental Change Model
Adequate description of human phenomena cannot be
achieved by entirely relying upon the measurement and
comparison of individual or group performance to a
standardized norm. Piaget's model of human abilities
represents children as proactive rather than just reactive
to their environment (Crain, 1985). Piaget (1936) did not
believe that children's thinking is shaped by adult
teachings or other environmental influences. Piaget
recognized that children pass through general stages of
development and that these stages do not genetically unfold
but represent increasingly comprehensive ways of thinking.
Children must interact with the environment to develop; it
is they, not the external environment who build more
elaborate cognitive structures to deal with their
environment (crain, 1985). Piaget's findings suggested
that children's minds cannot be filled at will. Children,
in a large part, determine what stimuli will be attended to
and how these stimuli will be incorporated into their world
view (Dulay & Burt, 1980).
n7:W'
'teeE ' 0= hi' if
16
Rather than cause-effect, the aim of experiments using
the Piagetian cognitive tasks is to define progressions in
the use of thought for making sense out of the environment
(Irvine & Berry, 1988). In other words, the dependent
variable is the age in months when success in an item type
(such as conservation of liquid) that defines a mental
stage (such as "concrete operations") is registered. In
Piagetian thought there is no mean by which to fix a
deviation: rough age limits for the progression of the
thought system are offered, but there is not much concern
about precocity or lag. Even though Piagetian research
focuses on individual assessment it still resembles group
tests by conforming to a standard procedure of task
administration in order to meet the requirement for
homogeneity in the method. This is a necessary constraint
of any empirical observation (Irvine & Berry, 1988).
Clarizio (1982) stated that Piagetian tasks offered
promise for understanding the intellectual functioning of
Native American children. Dana (1984) stated that
Piagetian tasks measure fluid intelligence and use theory
based attempts to define developmental benchmarks in
logical reasoning. He stated that these tests presuppose
no interest in individual differences or comparisons with
age and grade norms and are more likely to be culture-fair,
child-relevant, and essentially descriptive of current
developmental status. Glick (1985) proposed that Piaget's
HI we"

17
theory is inherently acultural in the sense that structures
of knowledge may be constrained by cultural experiences but
are not determined by it. Research in several cultures on
the attainment of Piagetian logical structures has provided
only partial support for this position. Most cultures
display cognitive operations characteristic of Piaget's
early stages, that of preoperational and early concrete
operational thinking. Yet, great variation has been found
in the age or rate of attainment and many people in
specific cultures never demonstrate reasoning associated
with the later stages of late concrete and formal logical
operations (Dansen, 1984; Dansen & Heron, 1981). Both the
forms of reasoning in these latter stages and the measures
used to assess them appear to be highly specific to and
sensitive to cultural experience (Glick, 1985).
contextualist Models
Based on the contextualist perspective (Miller-Jones,
1989; Vygotsky, 1978) it can be inferred that attempts to
interpret a task's meaning in a testing situation, are
related to a person's prior culturally contexted social
experiences and activities. certain socio-cultural
experiences may stress sets of competencies and cognitive
organizations that are different from those expected in
assessment situations. In other words children may have
many culturally determined problem-solving and

18
information-organizing strategies or modes available to
them which mayor may not be activated or elicited by a
test format (Miller-Jones, 1989).
Appropriate testing of developmental abilities
involves a determination of how well any particular testing
situation matches the function-specific practices
individuals experience as part of their social-cultural
context (sternberg, 1988). Children's social-cultural
ecologies pose problems and tasks that function to organize
their intellectual processes. Thus, the meaning taken in a
task situation will reflect cultural values for
interpreting the situation which the child has acquired
from his/her social interactions (Miller-Jones, 1989).
The assertion that culture provides a background
against which information is organized has been reported in
the literature dating back to 1969. Two specific ways of
organizing information are analytical and relational
thinking (Cohen, 1969). For example, grouping chairs and
tables together because they all have four legs is an
example of analytical thinking whereby objects are
associated by shape. Grouping objects because of their
related utility is an example of relational thinking
whereby objects are associated by their utilitarian value
(Fradd & Hallman, 1983).
Cohen (1969, 1971) reported that relational conceptual
styles as opposed to analytic styles are associated with

=
19
families that have flexible interchangeable functional
roles (e.g., who does child-care, who cooks). He also
reported that analytical thinking is found more frequently
in highly industrialized societies whereas relational
thinking is more common in minority and rural cultures.
Segel (1970) stated the lack of parental practices that
provide the opportunity for differentiation and abstraction
is also related to the use of more relational categories in
classification sorting tasks. Berry (1971) found that
individuals from societies that depended on hunting and
fishing for their food tend to be superior on spatial
ability tests and measures of cognitive differentiation
than individuals from societies where food is readily
available. All children have the capacity for various
kinds of intellectual operations but some operations and
organizations occupy higher levels of probability of
occurrence than others within a child's repertoire of
problem solving methods (Miller-Jones, 1989).
The contextualist interpretation suggests that
different cultures tend to develop different cognitive
skills among their members that differ than from the
cognitive skills of members from other cultures (Armour
Thomas, 1992; Fradd & Hillman, 1983; Miller-Jones, 1989).
Due to these differences one can see the pitfalls of
transporting an ability test from one culture to another
with translation into their language being the only

20
distinguishing change. The measures or criteria for an
assessment test of abilities may reflect the professional
and societal goals of one culture and may not be an
indicator of intrinsic abilities. An experimental or
testing situation sets up an artificial context and the gap
between the natural or learned context is potentially
larger for those cultures which differ the most from that
of the tester's culture. Yet, test scores take little or
no account of the differential gap for different groups of
people. To understand a set of abilities within a given
culture, one must understand it in terms of the adaptive
requirements of that culture. Such understanding requires
a grasp of how thought is linked to behavior in that
particular environment (Sternberg, 1988).
Sternberg (1988) stated that the components of mental
processes such as encoding stimuli from the environment,
inferring relations between stimuli, mapping higher order
relations between relations and applying relations are
universal and probably do not differ from one culture to
another. However, the components of intelligence cannot be
measured independently of some context. Competency can
only be assessed through observation of performance which
is influenced by cultural and linguistic variables.
Sternberg stated that the situation is bleak if the goal is
to be able to compare the abilities of people across
cultures according to some universal standard. He stated

21
that it is possible to specify just what aspects of
intelligence or ability are specific to a given culture in
terms of contextual requirements and what aspects are
shared with at least one other culture. Therefore, a more
realistic goal would be to fully understand the ability and
intellectual functioning within culture and to compare only
those particular aspects of ability or intelligence that do
intersect between pairs of cultures.
Cultural Disorganization
since culture provides a background for organizing
information, a problem occurs when an individual for some
reason (sociological, geopolitical, economical) becomes
culturally deprived or alienated from his/her culture.
Children who are enmeshed in relations between two
conflicting cultures are caught up in a complex and
bewildering set of forces. They are simultaneously
pressured to assimilate (relinquish cultural identity and
take on the larger society identity), to integrate
(maintain cultural integrity while becoming a part of a
larger society), to reject (by withdrawing from contact or
influence of the larger society), and to experience
marginality (a combination of cultural loss, deculturation,
and exclusion from participation in the dominant society)
(McShane, 1983).

22
Feurstein (1979) stated that cultural disorganization
results in disruption of intergenerational transmission of
cultural identity and uniqueness. He hypothesized that the
individual who has learned to function within his or her
own culture has learned to adapt and has established the
prerequisites for learning and continued adaptability.
cultural deprivation may strongly affect the adaptive
capacities of the child since he or she becomes devoid of
the learning skills and habits that are produced by the
transmission process.
Essentially, the cultural disorganization/disruption
model proposes that the Native American child, depending on
how much his/her culture in conflict with the dominate
society, may be divested of some of the opportunities to
acquire adaptive capabilities to learn because of the
interruption, disruption, and disorganization of the normal
enculturating and socialization process (McShane, 1983).
McShane also stated that a perceived consequence of the
combined impact of the cultural disorganization and the
disadvantage models is an over-reliance upon the support
structures within the larger society. As welfare becomes
an integral part of economic, family, and individual
systems, incentives to learn, to progress and to improve
are lost. Dependence versus self-reliance, independence,
and self-determination then may become a developmental

23
issue as it may influence parenting and quality of learning
experiences provided to children.
Summary of Theoretical Models
The theoretical basis underlying the unique patterns
of ability and achievement of culturally different
children, specifically Native American children, is broad
and encompasses several different perspectives. The issues
raised by the theoretical literature raise serious
questions about the assumptions or premises of standardized
developmental tests for Native American children. From a
cultural perspective, it would appear that the
manifestation of developmental abilities are interwoven
within one's cultural experiences and that it is imperative
that cultural influences on test performance be understood.
From a group comparison perspective, it is apparent that
testing procedures are standardized for purposes of
reliability and cannot readily adjust for every different
cultural background. Yet, from disadvantage and
disorganization concepts, it is clear that Native American
children are at risk for developmental delays and it is
even more crucial that developmental screening tests be
appropriately used in order not to over or under identify
children in need of services.

'" r 17iJT5ZF j * g if
24
Implications for Developmental Testing
General Implications
The practice of administering standardized tests to
young children has increased dramatically in recent years.
PL 99-457, Part H has thrust early identification and
intervention into the forefront of the nation's social
policy for children (Shonkoff & Meisels, 1990). Most
states have designated departments of Public Health as the
lead agency for PL 99-457 which underscores the critical
role of pediatricians and other health care workers in the
early identification of young handicapped children as they
are often the first and only professionals in contact with
young children and their families (Glascoe, Martin &
Humphrey, 1990). In their expanded role of early
identification of delayed children, health care providers
may be expected to not only detect developmental delays but
also to determine program eligibility by percentage of
delay relative to chronologic age, age equivalents, or
cutoffs reflecting standard deviations from the mean. In
this respect, the use of developmental screening tests by
health care workers will remain at the heart of PL 99-457
(Glascoe, Martin, & Humphrey, 1990).
Many school systems now routinely administer some form
of standardized developmental screening test for admittance
to kindergarten. As a result, more five-year-olds are
;=m

25
denied admission or are recommended to some form of
developmental kindergarten. such practices disregard the
potential, documented long-term negative effects of
retention on children's self-esteem and the fact that a
disproportionate number of low-income and minority children
are among this group (Smith & Shepard, 1987).
Because of the wide spread use of standardized testing
of young children ages three through eight years of age,
the National Association for Education of Young Children
(NAEYC) issued a position statement on standardized testing
which includes definitions and guidelines on their use
(NAEYC, 1988). Among their recommendations are: (a) all
standardized testing used in early childhood must be
reliable and valid, (b) any decision about the child should
not ever be based upon a single test score, and (c) testing
of young children must recognize and be sensitive to
individual diversity (NAEYC).
The NAEYC (1988) expressed concern that test
developers frequently ignore cultural variations and
variations in the quality of experiences provided for
different children. It is easier to mass produce tests if
one assumes that cultural differences are minimal or
meaningless. These assumptions permit attributing all
variances or differences in test scores to differences in
individual children's capacities. However, these
assumptions are false and standardized tests should not be

FE r
26
used in multicultural/multilingual communities if they are
not sensitive to the effects of cultural diversity or
bilingualism.
The NAEYC (1988) further recommended that the burden
of proof for the validity and reliability of tests is on
test developers and those advocating their use. Rather
than using a test of doubtful validity, it is better not to
test. The potential for mislabeling is particularly great
with young children where there is wide variation in what
may be considered normal behavior. Responsibility for
choosing, administering, scoring, and interpreting a score
from a standardized test' rests with the professional and
demands that the professional ensure that the test meets
scientific standards and reflects current scientific
knowledge.
However, as programs of early identification become
more context-oriented, the search for tests and measures
becomes more elusive. Meisels (1991) stated that tests
normed on one group of children cannot be considered valid
for another significantly different group without explicit
standardization for that group. He also noted that there
are numerous problems with defining a delay in terms of
standard deviations, a practice 25% of states use to
determine eligibility for developmental delay programs.
Descriptively, a standard deviation represents a spread of
specific scores or performances around a mean. This is

m
27
based on the concept that these measurements are bell
shaped or symmetric. Meisels's position is that even when
mean abilities are equal, distributions of these abilities
may vary. This is often the case when two separate groups
are administered the same test or when tests are used that
have different standardization samples.
standard deviations may have a place in establishing
population norms in screening tests that (a) have been
validated against widely used outcome measures of
development, and (b) are used in combination with other
sources of data about the child. In reality one single
test cannot accomplish the task for early identification.
A process containing multiple levels and multiple sources
of information obtained on multiple occasions must be
devised (Meisels, 1991).
The NAEYC (1988) also raised a content validity issue
for any standardized test in early childhood. Tests
address the more easily measured aspects of development and
omit content areas of creativity, social competence, self
esteem, and disposition toward learning which are harder to
measure but not less important aspects of development.
Garcia ColI (1990) noted that investigators have used
sensorimotor tasks as their main outcome measures,
neglecting the inclusion of other domains of development
such as socio-emotional or subtle aspects of cognitive
functioning. This may be especially important in testing
EZ 55
28
of minority children since socio-economic background is
often confounded with ethnicity. Multiple-risk indexes
such as mental health, anxiety, minority status, family
support, and life events have predicted substantially more
variance in verbal IQ scores at 4 years of age than did
socio-economic status (Sameroff, Seifer, Borocas, Zax, &
Greenspan, 1987).
Implications for Native American Children
Brescia and Fortune (1989) proposed that testing
Native American children using tests developed for the
majority American society represents a case of cross
cultural testing which is likely to produce invalid
results, usually in the form of underestimation of the
children's performance. In test based decisions concerning
the Native American child, this can have grave
consequences. The child could be placed in programs that
are too easy or boring, be denied advanced placement, and
have self-esteem and confidence problems.
There are several potential sources of error in
testing Native American children which stem from cultural
difference. These include: lack of compatibility of the
languages, differences in the experiential backgrounds of
the children being tested and the children for whom the
test was developed, and differences in affective
dispositions toward handling testing environments between

$'
29
the two groups of children (Brescia & Fortune, 1989).
These are further explained as follows.
Dana (1984) reported that Native American children are
uncomfortable with aspects of the testing situation such as
establishing eye contact, verbal interaction, and being
assertive in performing gross motor activities in front of
a stranger. He also reported that language difference may
raise seemingly impenetrable barriers to effective
communication between the participants in a testing
situation. Behavioral differences and interpretation of
behavior between Native American children and the
non-Native American tester can result in nonverbal
miscommunication which could alter testing results.
Native American tribes have a wide range of
differences with regard to culture. Native Americans
should not be treated as a collective group regardless of
their tribal membership. This is the same error of
consideration that is made in testing Native American
students with standardized tests that have less than three
percent Native American students in the norming sample.
However, uniform research on the study of testing results
within the context of tribal culture is nonexistent. Bias
found in the study of one tribe is likely to exist for
several other tribes. A source of underestimation
documented for one tribe should be considered as a
potential source of underestimation for other tribes until

II 55 '[
30
research indicates the contrary for a given tribe (Brescia
& Fortune, 1989).
Underestimation may occur in the standardized testing
of Native American children because the child may not have
the assumed experience to respond to certain test items.
The isolated, rural environment of many reservations, the
restricted poverty of many families, and cultural ties may
provide little opportunity for Native American children to
practice key behaviors required by developmental screening
tests (Brescia & Fortune, 1989). Many Native American
children are frequently in settings where there are few
books, puzzles, blocks and other similar toys. These items
may be prioritized by their adult caregivers as less
important compared to other family necessities or
activities. Differences in test behavior of the Native
American child may then reflect cultural and environmental
differences rather than lack of knowledge of what is being
tested (Neely & Shaughnessy, 1984). If children presented
only one unsuccessful test taking behavior in a given
testing situation then a methodology could be developed to
correct the problem of bias. But, behaviors are confounded
in that they sometimes occur jointly and at different times
during the test taking process (Neely & Shaughnessy, 1984).
Many Native American children possess other individual
characteristics which may present testing problems such as,
low parental education, low test motivation, broken homes
55 wc
31
and non-standard English-speaking backgrounds (Neely &
Shaughnessy, 1984). other factors associated with
unsuccessful test taking in Native American groups are
cultural beliefs regarding competitive behaviors in which
it is unacceptable for individuals to become the center of
attention (Horejsi, 1987). In a study of Native American
adults' performance on a national normed test, Hoffman
(1985) suggested that acculturation and test motivation are
associated. This meant that adults who had more exposure
to dominate society values performed more competitively on
the tests. Deyhle's (1986) study showed that Navaho
students had a different perception of the purpose and
significance of tests than Anglo students. Students may
underestimate the seriousness of the test or may fail to
adopt successful response strategies.
Language factors are a leading cause for
underestimation of a Native American child's test
performance (Brescia & Fortune, 1989). Tests which avoid
language use are not subject to underestimation as much as
those that depend on verbal instructions or reading (Shutt,
1962). However, Cohen (1969) reported that pictorial
representations were found to produce more culturally
biased assessment than tests which relied on language
because there are less specific rules for interpreting
pictorial items than for verbal items.

=
32
Further confounding the language issue is the decline
in use of an ancestral language amongst many tribal groups.
Anderson and Anderson (1983) reported that fluency in the
native language is highly correlated with fluency in
English. However, many tribal languages are rapidly losing
their vocabulary and undergoing simplification of syntax.
They also identified that the stops, the intonation and use
of syntax in Indian English closely resembled the native
languages of several tribes. This points to a prominence
of native language entrants into Indian English dialects.
Anderson and Anderson alerted educational service providers
that there needs to be a realization of the important role
played by the dialect of Indian English. There needs to be
the realization that dialect production does not represent
a lack of understanding of Standard English but a
culturally dictated mode of interaction. Thus, not only
bilingual Native American children, but those speaking only
English may still perform differently on a test requiring
language use.
Cummins and Swain (1986) stated that in societal
situations where there is likely to be serious erosion of
the native or first language, it is crucial that programs
aim toward its development and maintenance. They proposed
that there is a threshold level of linguistic competence
which bilingual children must attain in both their first
and second languages in order to avoid cognitive

33
disadvantages. These authors stated that the quality of
parent-child communication in the home is crucial to the
child's future academic success. They suggested that
minority language parents expose their children to the
minority language as much as possible in the preschool
years and that parental use of broken English or a mixture
of the minority language and English may cause the parent
to spend less time communicating with their child. This
could have potentially disastrous effects by preventing a
solid foundation for the acquisition of English language
skills.
Most of the studies in the literature addressing
standardized testing of Native Americans are limited to
school-aged children, college students, and adults and
consist mostly of intellectual assessment (McShane & Plas,
1982; Dana, 1984). There are few studies specifically
addressing developmental screening of Native American
preschool children. In spite of problems in test bias,
there is some knowledge of unique patterns of performance
exhibited in the intellectual assessment of several Native
American groups. Most of these patterns have been observed
in older Native American children but are pertinent to
preschool developmental screening.
Traditional Native American cultures foster the
development of performance abilities and minimize
opportunities for processing information in abstract verbal

?5i'
34
terms (McShane & Plas, 1982b). High visual-spatial
abilities have been reportedly consistent across tribes.
Spatial abilities were more well-developed than sequencing
skills and there was greater strength in relational,
holistic, and right hemisphere information processing
(Dana, 1984; Diessner & Walker, 1986; McShane & Plas,
1982b). Historically, adaptation to Native American
lifestyles required superior perceptual-motor skills,
emphasis upon concrete reality, and individuality of
objects at the expense of generalizations (Dana, 1984).
The extent to which verbal skills are developed among
Native Americans is a function of acculturation to middle
class, white society (Dana, 1984). English conceptual
abilities may be lower because traditional Native American
children in some tribes do not analyze experience in verbal
terms. An acculturated parent and/or early experience with
a white peer group are necessary for development of an
approach to learning that fosters the use of concepts and
generalizations across contexts (Dana, 1984).
McShane and Plas (1984) concluded after a review of 35
studies of intellectual performance of Native American
children that even though the current research base
suggests the pattern of performance mentioned above, it is
not adequate enough for a comprehensive interpretation of
their performance. Yet, many Native American children may

t e '$
35
be labeled developmentally delayed due to cultural
differences rather than true delays.
Perspectives in Developmental Screening
This section reviews current efforts in reducing bias
in standardized developmental screening tests. Examples of
studies where specific tests have been used are discussed.
A practical view on standardized developmental screening is
presented.
Efforts to Reduce Test Bias
In testing culturally different youth, the most viable
approach is somewhat eclectic and tends to focus on three
variables: the tester, the testee, and the test (Visscher,
1989). Ideally, the tester should be fluent in the
language of the child and understand the culture of the
child (Dana, 1984). Some researchers questioned if this
assumption has been backed by good empirical research
(Anastasi, 1976; DeBlassie & Franco, 1983). Testers should
be skilled at assessment (Nuttall, 1987) and should
communicate with the family about the testing situation
(Lidz, 1982). The training of testers must include
explicit monitoring of the extant literature as it applies
to practice and culturally-relevant professional
experiences (Dana, 1981, 1984). In cases where a
non-professional interpreter is used to translate, the

= 1£ ns
36
results will be suspect (DeBlassie & Franco, 1983; Lidz,
1982) .
The assessment of preschool children has its
challenges because of the unique nature of the testee
(Visscher, 1989). Preschool children may not have the
ability to sit still for long periods of time or to
verbalize clearly (Lidz, 1982). The child's level of
English proficiency and behavior during the test will
affect his/her performance and the tester's perception of
it (Nuttall, 1987). The tester must be flexible and
sensitive to the cognitive, social, and perceptual styles
of the child. Also the more relevant or familiar the tasks
and setting are to the child, the more likely it is that
the results of the screening will be valid (Meisels, 1991).
The NAEYC (1987) strongly stated that the most important
consideration in evaluation and using standardized tests is
to improve services for children and ensure that children
benefit as a result of their use.
The majority of effort in nondiscriminatory testing
has been aimed at reducing bias in the test itself.
Several approaches have been tried and all have advantages
and disadvantages. Translation of existing nationally
normed tests into the language of the test is frequently
Used (Dunn & Dunn, 1981; McCarthy, 1972; williams &
Williams, 1987). Fradd and Hallman (1983) reported that
problems with this approach occur because translations skew

37
the testing process in both the content and the context of
the language used. They reported that alert testers may
use information gained from this type of testing to plan
programs but not for comprehensive evaluations.
The establishment of regional or ethnic norms for each
test is used by some researchers to reduce test bias.
Sidles and Macavoy (1987) made Navaho local norms for the
Ravens, a visuo-spatial intelligence test. Visscher (1989)
normed the Batelle Developmental Screening Test for Crow
preschoolers and found that she obtained referral rates
closer to the national incidence for handicapping
conditions. Whereas, before the local norms were
established there was an over referral rate. This practice
has been criticized as having the potential of leading to
lower expectations for minorities which in turn, may lower
children's aspirations to succeed. Local norming does not
necessarily take into account the complex reasons why
minority children, on the average, score lower than white
middle-class children and may invite unjust comparisons
between racial groups (DeBlassie & Franco, 1983).
Researchers have used Piagetian tasks to evaluate
developmental abilities because they concentrate on non
verbal performance, define developmental benchmarks, and
use qualitative scoring that presuppose no interest in
individual differences or comparisons with age norms
(Clarizio, 1982). Results obtained when using this test

-J 2 tor' Sf t e i df? - tar
38
have shown great cultural variation in the age or rate of
attainment of Piaget's preoperational and concrete stages
(Cummins, 1984; Glick, 1985). Many people in specific
cultures never demonstrate reasoning associated with
Piagetian stages of late concrete and formal operations.
This appears highly sensitive to cultural experience
(Glick, 1985).
An alternative to tests has been the use of various
behavioral rating scales and a trend toward identification
of young children's strengths rather than their deficits.
These scales have included scales on motivation,
creativity, and leadership characteristics. Torrance
(1982) developed a list of strengths and positive
characteristics of culturally different children. These
characteristics could be observed and could possibly be
quantified. They include such items as expression of
emotions, ability to improvise, enjoyment of visual arts,
originality in problem solving, fluency in figural media,
articulateness in socio-drama, and humor.
Through project spectrum, Krechevsky (1991), has
studied an alternative assessment approach of preschool
children based upon Gardner's (1983) theory of multiple
intelligences and Feldman's (1980) theory of development in
non-universal domains. Assessment of the child involves
observation of the child's activities in several domains
throughout the school year. There is blurring between

'sf j, m 1ii
39
assessment and the classroom curriculum so that it takes
place in the child's natural environment and is embedded in
meaningful, real-world activities. Project spectrum
emphasized children's strengths and domains of competence.
Obviously, this type of developmental assessment is time
consuming and not practical in most health care settings.
However, it may be particularly suited for assessment of
diverse populations since it takes individual differences
seriously (Krechevsky, 1991).
Examples of specific Cross-Cultural Studies
studies using standardized developmental screening
tests with culturally different populations report mixed
results concerning the validity and usefulness of the test
or instrument chosen. The following examples focus on the
use of three specific tests: the Peabody Picture
Vocabulary Test-Revised (PPVT-R) (Dunn & Dunn, 1981), the
Early Screening Inventory (ESI) (Meisels & Wiske, 1988) and
the McCarthy Scales of Children's Abilities (MSCA)
(McCarthy, 1972). Each test has been standardized for
direct assessment of developmental abilities of children,
is widely used, and has been tested for reliability and
validity.
sattler and Altes (1984) evaluated the receptive
Vocabulary ability and nonverbal cognitive ability of
monolingual (Spanish-speaking) and bilingual

T
40
(spanish/English-speaking) Mexican-American preschool
children, ages 45 to 65 months. The children obtained
significantly lower scores on the PPVT-R than on the
Perceptual Performance scale of the MSCA. The monolingual
group's PPVT-R Spanish scores were significantly lower than
the PPVT-R norm group. Their MSCA Perceptual Performance
Scale scores were also significantly lower than those of
the McCarthy standardization group. The bilingual group
obtained significantly lower spanish PPVT-R scores than
those in the PPVT-R norms. However, the MSCA perceptual
Performance Scale scores were not significantly different
from those of the norm group. Sattler and Altes (1984)
concluded that the PPVT-R whether in English or Spanish
should not be used to assess intellectual capacities of
Hispanic children. However, the MSCA Perceptual
Performance Scale (which had been translated into spanish)
appears to be useful instrument for assessing the cognitive
abilities of both monolingual and bilingual Hispanic
preschool children.
Sharpley and Stone (1985) administered the PPVT-R to
Australian children to determine if significant cultural
differences were apparent. They reported no significant
differences between means of raw scores for their sample
and the norm sample. Teuber and Furlong (1985)
administered the English versions of the PPVT-R and the
Expressive One-Word Picture Vocabulary Test (EOWPVT) to

55 'Pm z'W"Zm::r '" ~
41
50 Mexican-American children. Results reported for both
tests were two standard deviations below the norm mean
score.
Valencia and Rankin (1985) reported that mean scores
on the General Cognitive Scale for 31 English-speaking
Mexican-American children and for 43 Spanish-speaking
Mexican-American children were extremely close to the norm
mean score of 100. These mean scores were 100.6 (SD=12.7)
and 92.1 (SD=9.5) respectively. The English-speaking group
used a carefully translated Spanish version. Valencia
(1988) reported that the MSCA has promise as a
psychoeducational assessment tool for English-speaking
Puerto Rican and Mexican American children. For Spanish-
speaking children interpretation of test performance must
be made with caution. Similarly favorable results were
found with the ESI. Weloe-Crow (1990) reported that the
ESI identified Spanish-speaking children's abilities to
acquire new skills in the Visual/Motor, Language and
Cognition, and Gross Motor/Body Awareness domains.
Summary of Perspectives in Developmental Testing
The problem of nonbiased developmental screening and
testing continues despite extensive research. Native
American children represent an understudied and very much
at-risk population for misinterpretation of developmental
screening tests or other standardized tests of ability.

'5' 7 5;
42
They are also a population at risk for developmental delays
because of adverse living conditions and health problems.
The practice of developmental screening of Native American
preschool children warrants investigation because
standardized screening tests are the main tool used to
determine whether a child has delays requiring more
extensive evaluation (Visscher, 1989).
DeBlassie and Franco (1983) stated that standardized
tests, even though most are culturally biased and favor the
middle-class mainstream, still can serve as very effective
diagnostic indicators. They further stated that
standardized tests are unfavorable to culturally different
youth if they are used for the purposes of predicting
success in academic and employment settings. Even then,
this is not the fault of the tests but the manner in which
tests are used and interpreted (DeBlassie & Franco, 1983).
To the alert tester, standardized developmental screening
tests can indicate a child's development in terms of
abilities and limitations (DeBlassie & Franco, 1983; Fradd
& Hallman, 1983; NAEYC, 1988). Using both test and nontest
data (such as information about the family), the tester can
proceed to describe a plan to enhance each individual's
potential. DeBlassie and Franco stated that the predictive
validity of most standardized test scores are poor but the
diagnostic validity is excellent if tests are used in
conjunction with nontest data and demographic information.

75 ' ; 737 '"'$.' f ' ... _
43
They advised that test users not declare a moratorium on
the use of standardized tests with culturally different
youth. Instead testers should use caution in interpreting
results and apply results in the best interest of the
child.
The literature supports the use of standardized
developmental screening tests that have established
reliability and validity when they are used for diagnostic
purposes and to make informed decisions that enhance the
development and education of culturally different youth
(DeBlassie & Franco, 1983; Meisels, 1991; NAEYC, 1988).
The literature also supports obtaining baseline or standard
information on the group of children in question for a test
that has been normed on a significantly different group of
children (Meisels, 1991; NAEYC, 1988; Visscher, 1989). An
analysis of the comparison of referral rates, distribution
of scores, and mean scores between a group of children
tested and the standardized or norm population will give
valuable information about the tests' usefulness in
accurately identifying developmentally delayed children in
need of more comprehensive evaluation.
Increasing knowledge about the performance of certain
developmental screen tests in culturally different children
such as Native American Head start children, will help
prevent erroneous judgments about their performance
abilities and will increase efforts to provide the services

tt 'cn . ~~-l~ ltZ,-,r ,':;:
44
of early identification of delays and appropriate
intervention. Through such efforts, there will be more
information available to promote decisions that will allow
culturally different children to develop their full
intellectual, social, physical, emotional, and spiritual
potential.
conceptual Framework
To integrate the various developmental theories and
issues involving the test, the tester, the child, cultural
influences and language that have been previously
discussed, a conceptual model (Figure 1) has been developed
based on the work of McShane (1983). This model explains
the factors influencing the unique patterns of ability and
achievement of Native American children observed in a
developmental screening test setting. As illustrated in
Figure 1, the observed developmental abilities consist of,
but are not limited to, a group of sensorimotor tasks that
a child performs at a given point in time. Three levels of
factors (family, child, tester) directly or indirectly
influence the observed developmental abilities of the
child. Three environmental components (socio-economic,
transcultural contact/conflict, and peer norms) influence
the nature of the developmental screening testing
situations.

Sensorimotor Tasks
Observed Developmental Abilities
Performance *Verbal *Perceptual *Motor *Cognitive
Transcultural contact/ Conflict
Socio-Economic
Peer Norms
Figure 1.
E N V I R 0 N M E N T
->
->
->
1. Tester ->
I 2. Child ->
3. Family/ I => Community
*Quantitative *Adaptive
Expectations,
*Memory
Knowledge Screening Tool Used
Ability <-> Motivation <-> Behavioral <-> Emotional <-> Testing Verbal/ Orientation Style & Physical Experience
Nonverbal r Health
~ral/ i 1 Health, Support, Language
Orientation Stability of Family/Community
Factors Influencing the Observed Developmental Abilities of a Child During Developmental Screening Testing. Based on McShane's (1983) Transcultural and Developmental Model explaining achievement patterns of American Indian children.
.Po U1

.. 5:00-· .. IT";
46
The first or primary level of influence upon the
observed developmental abilities of a child in a
developmental screening test situation lies within the
tester. The tester functions in his or her role as the
actor with the greatest amount of formalized control in the
testing situation (Mcshane, 1983). The tester's language,
cultural perceptions, knowledge about testing, experience
with testing instruments, choice of testing instruments,
expectations, and behavior (as controller or gatekeeper)
either enables or disables secondary influences.
Secondary influences (filtered through the tester)
involve five major child dimensions interacting with one
another (McShane, 1983). Verbal-nonverbal abilities,
motivation orientation (intrinsic vs. extrinsic),
behavioral style (indirect vs. cooperative), emotional and
physical health (transient situational disorders,
depression, acute or chronic condition), and previous
experience with testing, characterize unique aspects that
the Native American child brings to the testing situation.
Tertiary level influences, primarily flowing from
family and community contexts, provide the basis for
understanding the configuration of child characteristics.
The contextualist models (Miller-Jones, 1989; Vygotsky,
1978) suggest that language and unique English language
experience contributes to unique developmental ability
configurations. It also suggests that culturally contexted

·;iii -G7EE77 ' SW- e $ * s£
47
life experiences contribute to these unique developmental
abilities, as well as to motivation orientations and
behavioral styles that vary significantly from that of
majority culture children (Brescia & Fortune, 1988:
McShane, 1983). The cultural disruption/disorganization
model suggests that as the health and stability of the
family and community are fragmented by transcultural
contact and conflict, the primary support for emotional
health of the child is undermined which will further impact
on the child's test performance and observed developmental
abilities (McShane, 1983).
Environmental influences include peer established
testing norms both local and national which according to
the group comparison model form a criteria from which
testing performance is evaluated (Omark & Watson, 1983).
Environmental influences such as economic poverty, poor
housing, crowded living space, access to quality health and
education all exert influence on the tester, child, and
family in various degrees (McShane, 1983). Transcultural
environmental influences such as exposure to dominate
societal attitudes, values and climate also influence all
participant levels during the developmental screening test
experience.

# iii .-TIJ5i33-~ - -- iN·;
48
CHAPTER 3
METHODS
Design
This study compared the test performance of a sample
of Native American Head start children to that of the
normed population of children for each test. Specifically,
mean test scores, referral rates, and distribution of
scores were compared. Because Native American children
comprised less than 1% of the normed population of children
for each test, the Native American sample of children can
be distinguished from the normed population by independent
variables related to cultural factors such as language.
The children's test scores which represented their
responses to the developmental items of ability provided in
each of the screening tests were treated as the dependent
or outcome variable. This study was ex post facto in
design since the research was conducted after the
variability in the independent variable had occurred (Woods
& Mitchell, 1988). This study was part of a larger study
funded by Montana state University College of Nursing block
grant.

- -77ZT777i f iiifTit 55
49
Sample
Subjects were 60 Native American children who attended
Head start on the Crow Reservation during the November 1991
to April 1992 time period. Head Start is a federally
funded preschool program for 3 to 5 year-old children from
low socio-economic backgrounds. There was a total
enrollment of 284 children for the 1991-1992 school year.
There are five different Head Start centers located
throughout the reservation. The majority of the sample for
the study attended the largest center, Crow Center Head
Start. All of the children were from families that met
federal guidelines for low-income with the average annual
household income at $10,745 (Head Start, 1992).
For the 1991-1992 school year, Head Start reported
that 32% of the enrolled children were from single parent
families; 62% from two parent families; and 6% were cared
for by a relative or foster parent. The average education
level for the head of the household was eleventh grade.
The unemployment level for the head of the household was
48%. Twenty-two percent of the children were fully
bilingual while another 30% did not speak their native
language but understood it fluently. Ten percent of the
children enrolled were receiving services for various
problems: the majority of these were speech delays or
50
articulation problems, and behavioral problems involving
hyperactivity and discipline (Head start, 1992).
The sample size of 60 was determined to be adequate
since this group of children is homogeneous in terms of
residence, household size, education level of parents,
cultural context, and exposure to preschool activities.
There were 33 girls and 27 boys included in the study. Age
range was from 3 years to 6 years. Criteria for inclusion
in the sample were: (a) Native American child with one
parent or grandparent enrolled in the Crow tribe,
(b) residence in Big Horn County, (c) child's age between
3 years 5 months to 5 years 9 months, (d) attendance in
Head start since October 1991, and (e) no previous
diagnosis of mental retardation.
Data Producing Instruments
Three instruments were used for data collection in
this study (see Appendix A). These instruments were chosen
because they have been standardized for direct assessment
of developmental abilities of preschool children and they
are currently used by local care providers and educators.
The Peabody Picture Vocabulary Test-Revised was chosen
because it is used locally for assessing receptive
vocabulary and because vocabulary is an important measure
of child development. Oral language is widely recognized
as a prerequisite to success in work and higher education

51
(Dunn & Dunn, 1981). The MCCarthy Scales of Children's
Abilities was chosen because it is a more comprehensive
developmental test and specific for children ages 2 through
6. It is locally used on a more limited basis since it is
more time consuming to administer. The Early Screening
Inventory was chosen since it is a specific developmental
test for children 4 to 6- years-old, is often used to test
for school readiness, and is easily administered. Each
instrument has been widely used and tested for reliability
and validity. Each instrument has published norm
referenced means and standard deviations. Instructions for
testing and scoring are clear and guidelines for referral
are given. Permission to use the instruments were granted
by the publishers for each instrument. Information
specific to each instrument follows.
Peabody Picture Vocabulary Test-Revised (PPVT-R)
The PPVT-R (Dunn & Dunn, 1981) was designed primarily
to measure receptive (hearing) vocabulary for Standard
American English. Regression analyses have indicated that
while verbal comprehension abilities may contribute most to
successful performance on the PPVT-R, perceptual
organization abilities also play a significant role in the
child's performance on the PPVT-R (Hollinger & Sarvis,
1984). This test can be classified as a developmental test
because it is an age-related norm-referenced assessment of

'e ", § ii'S 5,; ,i5;
52
a set of skills that have been acquired by children (NAEYC,
1988).
In scoring the PPVT-R, a total raw score is given for
the number of correct responses over a critical range.
This score is then converted to a score derived from the
standardized or norm-referenced score which allows
comparison of the individual performance to the
standardized population. Three deviation-type age norms
are reported: standard score equivalents, percentile
ranks, and stanines. The median standard score equivalent
is 100 with a standard deviation of 15. The median
standard error of measurement for standard score
equivalents is 7 points for all ages (Dunn & Dunn, 1981).
The standardization sample consisted of 4200 children
and was stratified to represent population data from the
1970 U.S. Census. Approximately 15% of the sample were
nonwhite children with the majority of this group being
Black and Hispanic. The age range of the children was from
2 years 6 months to 18 years 11 months (Dunn & Dunn, 1981).
Dunn and Dunn (1981) reported PPVT-R test reliability
as follows. Split-half reliability coefficients for the
PPVT-R ranged from .67 to .88 (a median .81) for children
and youth. Immediate retest reliability coefficients for
raw scores ranged from .73 to .91, with a median of .82.
Delayed retest reliability coefficients ranged from .52 to
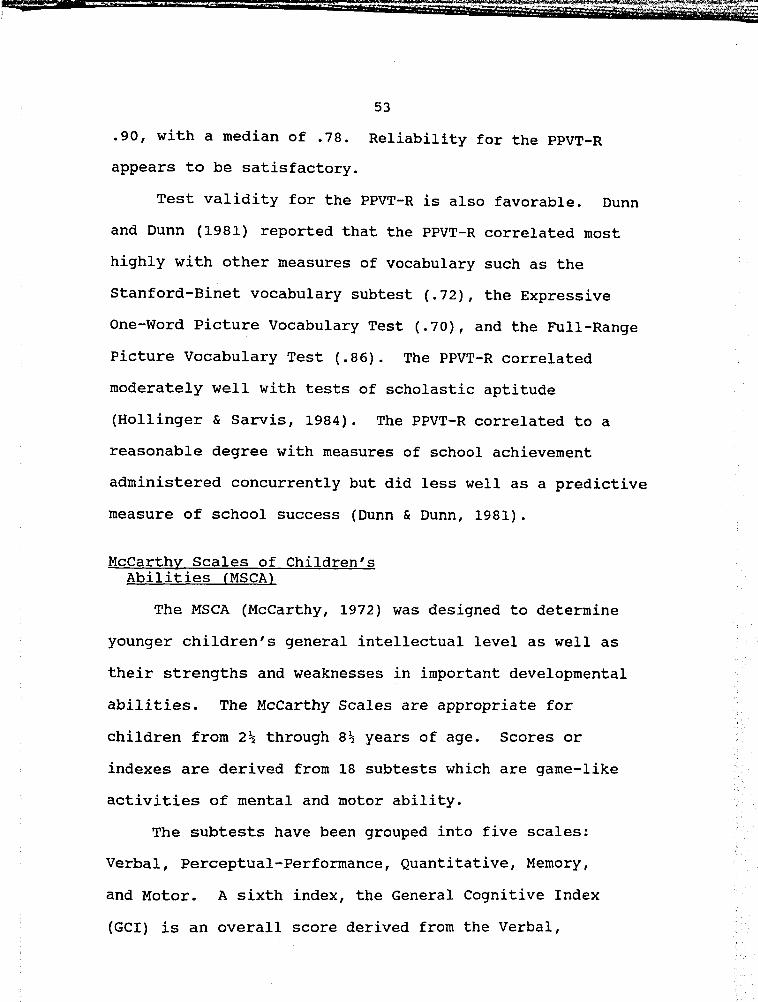
~!frlll:Z 7 "; 99 § .t ., -. r ;"!;
53
.90, with a median of .78. Reliability for the PPVT-R
appears to be satisfactory.
Test validity for the PPVT-R is also favorable. Dunn
and Dunn (1981) reported that the PPVT-R correlated most
highly with other measures of vocabulary such as the
Stanford-Binet vocabulary sUbtest (.72), the Expressive
One-Word Picture Vocabulary Test (.70), and the Full-Range
Picture Vocabulary Test (.86). The PPVT-R correlated
moderately well with tests of scholastic aptitude
(Hollinger & Sarvis, 1984). The PPVT-R correlated to a
reasonable degree with measures of school achievement
administered concurrently but did less well as a predictive
measure of school success (Dunn & Dunn, 1981).
McCarthy Scales of Children's Abilities (MSCA)
The MSCA (McCarthy, 1972) was designed to determine
younger children's general intellectual level as well as
their strengths and weaknesses in important developmental
abilities. The Mccarthy Scales are appropriate for
children from 2~ through 8~ years of age. Scores or
indexes are derived from 18 subtests which are game-like
activities of mental and motor ability.
The subtests have been grouped into five scales:
Verbal, Perceptual-Performance, Quantitative, Memory,
and Motor. A sixth index, the General cognitive Index
(GCl) is an overall score derived from the Verbal,

W 't7 iiu
54
Perceptual-Performance, and Quantitative Scale. The Memory
Scale consists of four tests, each of which is also
included on the Verbal, Perceptual-Performance, and
Quantitative Scale. Three of the five tests on the Motor
Scale belong exclusively to the Motor Scale and thus are
not included on the General Cognitive Scale. The remaining
two tests of the Motor Scale are included on the
Perceptual-Performance Scale, and therefore the General
cognitive Scale (McCarthy, 1972).
For each of the six Scales, the child's raw score is
converted to a scaled score, called an Index, according to
his/her chronological age. The General cognitive Index
(GCI) has a mean which has been set at 100, and a standard
deviation of 16. The scores for each of the remaining five
Scales have a mean of 50 and standard deviation of 10
(McCarthy, 1972).
The standardization of the McCarthy Scales was based
on a nationwide sample that was stratified on several major
variables in accordance with the latest estimates available
from the u.s. Bureau of the Census. The sample population
consisted of 1032 children, 170 were nonwhite with 154
being Black. The remaining 16 children were American
Indian, Oriental, Filipino, Chicano, and Puerto Rican
(McCarthy, 1972).
Reliability studies done on the MSCA are reported by
McCarthy (1972) as follows. Internal consistency was
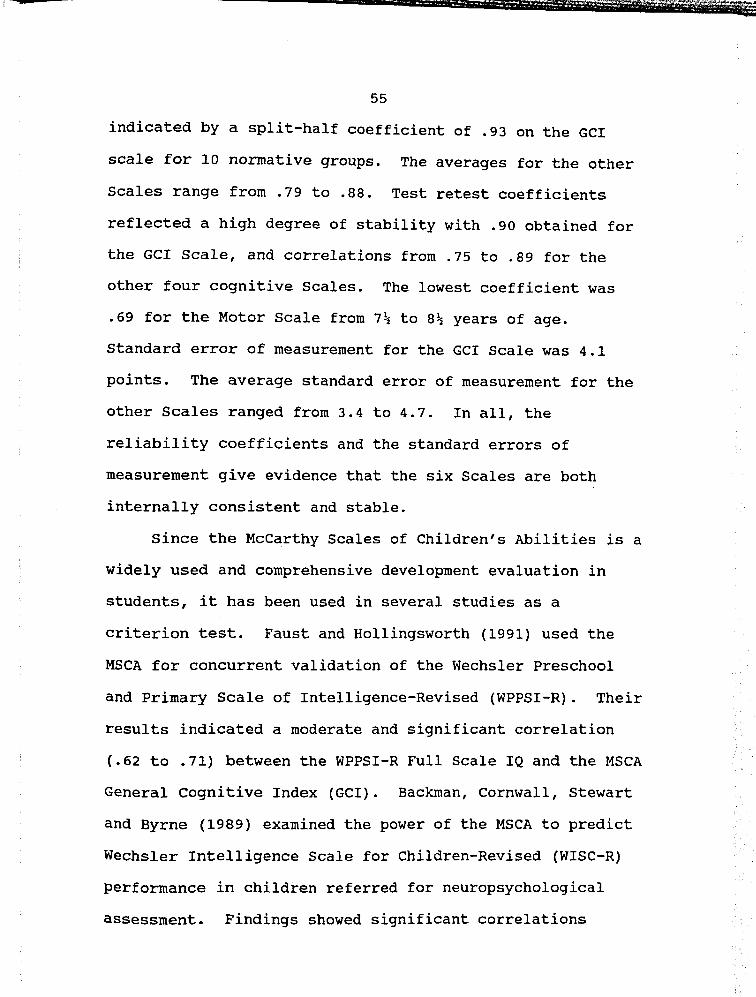
- T
55
indicated by a split-half coefficient of .93 on the GCI
scale for 10 normative groups. The averages for the other
Scales range from .79 to .88. Test retest coefficients
reflected a high degree of stability with .90 obtained for
the GCI Scale, and correlations from .75 to .89 for the
other four cognitive Scales. The lowest coefficient was
.69 for the Motor Scale from 7~ to 8~ years of age.
Standard error of measurement for the GCI Scale was 4.1
points. The average standard error of measurement for the
other Scales ranged from 3.4 to 4.7. In all, the
reliability coefficients and the standard errors of
measurement give evidence that the six Scales are both
internally consistent and stable.
Since the McCarthy Scales of Children's Abilities is a
widely used and comprehensive development evaluation in
students, it has been used in several studies as a
criterion test. Faust and Hollingsworth (1991) used the
MSCA for concurrent validation of the Wechsler Preschool
and Primary Scale of Intelligence-Revised (WPPSI-R). Their
results indicated a moderate and significant correlation
(.62 to .71) between the WPPSl-R Full Scale lQ and the MSCA
General cognitive Index (GCl). Backman, Cornwall, Stewart
and Byrne (1989) examined the power of the MSCA to predict
Wechsler Intelligence Scale for Children-Revised (WlSC-R)
performance in children referred for neuropsychological
assessment. Findings showed significant correlations

51 :;
56
between the GCI and WISC-R Full Scale IQ, the Perceptual
Performance Scale and the WISC-R Performance IQ, and the
Verbal Scale and the WlSC-R Verbal IQ. However the MSCA
Verbal Scale did not appear to be as good a predictor of
later ability as the WISC-R Verbal IQ. In a study of
performance among "at-risk" and normal preschoolers the
McCarthy GCl seemed to provide an accurate estimate of the
"at-risk" child's typical classroom performance and
corresponded significantly with the Kaufman Assessment
Battery for Children (Zucker & Copeland, 1988).
Early screening Inventory (ESI)
The ESI (Meisels & Wiske, 1988) is a brief
developmental screening instrument that is individually
administered to children 4 to 6 years of age. It was
designed to identify children who may need special
educational services in order to perform adequately in
school. The ESl samples performance in several areas of
development: speech, language, cognition, perception, and
gross and fine motor coordination. The ESI is intended to
survey a child's ability to acquire skills rather than the
child's level of skill achievement (Meisels, 1985).
The ESl is divided into three main sections: Visual
Motor/Adaptive, Language and Cognition, and Gross
Motor/Body Awareness. The Visual-Motor/Adaptive section
examines fine motor control, eye-hand coordination, the

2m r:
57
ability to remember visual sequences, the ability to draw
visual forms (two-dimensional), and the ability to
reproduce visual structures (three-dimensional). The
Language and cognition items focus on language
comprehension and verbal expression, the ability to reason
and count, and the ability to remember auditory sequences.
The Gross Motor/Body Awareness section examines balance,
large motor coordination, and the ability to imitate body
positions from visual cues. In addition to these sections,
the ESI includes two other items: the Draw A Person test
(DAP) and letter writing (Meisels & Wiske, 1988).
Three recommendations may be made on the basis of the
total ESI score: OK, rescreen, or refer. Based on the
standardized reference population which consisted primarily
of Caucasian children drawn from low to lower-middle socio
economic status urban families, the refer range includes
scores lower than two standard deviations below the mean
score for each age range; the rescreen range is between one
and two standard deviations below the mean; the OK range
includes scores higher than one standard deviation below
the mean. The mean score for the norm reference population
ranged from 21.3 for the youngest age group to 27.2 for the
older children (Meisels & Wiske, 1988).
Reliability for the ESI was reported by Meisels and
Wiske (1988) as follows. An item analysis showed that ESI
items clearly discriminated between OK and refer groups

'Z iF
58
with at least 75% of the children passing the items in the
OK groups and 60% of the children in the refer group
failing each item. lnterscorer reliability percentages
were higher than .80 with a total score correlation of .91.
Test-retest reliability showed a .82 percent agreement for
the total score on the ESl (Meisels & wiske, 1976).
Concurrent validity for the ESl was demonstrated by
using the McCarthy Scales of Children's Abilities as the
criterion measure (Meisels, 1984). A correlation
coefficient of .73 (R < .001) was obtained from comparison
of the ESl total screening score with the GCl of the MSCA.
The correlation remained unchanged by the effects on the
sample of age, gender, or socio-economic status. From the
data of this study it can be inferred that the ESl
generally measures the same domain of skills, knowledge,
and abilities that are measured by the GCl of the MSCA
(Meisels & Wiske, 1988).
Meisels and Wiske (1976, 1988) demonstrated short-term
predictive validity of the ESl by comparing the ESl scores
obtained on children prior to or in the first 2 months of
the kindergarten year with a readiness test given at the
end of kindergarten. The Metropolitan Readiness Test (MRT)
was used as the criterion of measure. Results reported
showed an 83% agreement between the two tests indicating
that ESI results are a predictor of reading readiness at
the end of kindergarten. Meisels and Wiske (1988) reported

59
that sensitivity and specificity rates of the ESI are
moderate to high in kindergarten but become less stable
thereafter.
Data Collection
Parents and guardians of the children were contacted
by the researcher during a health screening session held at
the Crow Head start in October, 1991. The project was
described to the parents/guardians which included the
purpose, protection of confidentiality, possible risks and
benefits, and their right to refuse participation without
any repercussion. Parents who were not at the health
screening were contacted later and given the same
information. A total of 87 parents/guardians signed the
consent for their child to participate in the study. After
the consent was signed, selection criteria information was
reviewed and it was determined that 67 children met the
criteria. These names were then put in a hat and 60 names
were randomly drawn out and placed into three groups.
Group One was given the Peabody Picture Vocabulary Test
Revised (Form L) and the McCarthy Scales of Children's
Abilities. Group Two was given the Peabody Picture
Vocabulary Test-Revised (From L) and the Early Screening
Inventory. One child was inadvertently given all three
tests which gave Group One an n of 21. Groups 2 and 3 each
had an n of 20. Group Three was given the Mccarthy Scales

!.
60
of Children's Abilities and the Early Screening Inventory.
By placing the Head Start sample into these three groups,
it was possible to correlate sample means between two tests
because the same child took both tests. This gave an n of
20 for each of the correlations between test groups. This
group configuration also made it possible to have an n of
40 by which to compare the Head Start sample mean scores
for each developmental test to the corresponding
standardized population for the test.
Children were given the tests at the Head Start Center
in a private office. The researcher spent the first 5
minutes of each session establishing rapport with the
child. There were two children who refused to participate
and their names were replaced by drawing from the remaining
seven names in the hat. To avoid test fatigue, most of the
tests were administered in the mornings on separate days
from one to three days apart. On the average, children
took 15 minutes to complete the PPVT-R; 20 minutes for the
ESI; and 50 to 60 minutes for the MSCA. Children in Group
Two were able to complete the ESI and the PPVT-R in one
session. The researcher administered and scored all the
tests except for five PPVT-Rs and five ESIs which were
administered by the researcher's thesis chair. The tests
were administered according to the standard instructions
provided by the corresponding test manual. Each test

61
received a code number; no child's name was placed on a
test.
Data Analysis
Upon completion of data collection, the test responses
were scored according to the individual test directions.
These results were entered into the SPSS data analysis
program (Nie, Hull, Jenkins, Steinbrenner, & Best, 1983).
Descriptive statistics were used to compute means, standard
deviations, distributions, and referral rates. Histograms
and tables were used to further explain the data. Although
the numbers for the Head Start sample were small,
statistical comparisons were possible, and the t test was
used to evaluate the difference between the means of the
sample data and that of the reference population for each
test. The t test was used to compare differences in mean
scores on each test for bilingual and monolingual Head
start children. A correlation was run on the following
pairs of mean scores for the Head start sample: (a) the
scale index mean for the GCl of the MSCA and the standard
scale equivalent mean for the PPVT-R, (b) the scale index
mean for the GCl of the MSCA and the mean total screening
score of the ESl, and (c) the standard scale equivalent
mean for the PPVT-R and the mean total screening score of
the ESI. The Lilliefors test was used to determine if the
distribution of Head Start Sample scores for each test was

62
normal. For purposes of this study, the significance level
was established at ~ ~ .05.
Human Subjects
Prior to initiation of the study, the Montana State
University Human Subjects committee reviewed the project
proposal and concluded that the rights of the participants
were adequately protected and confidentiality assured.
Permission was obtained from Dr. Jean N. Gullicks,
principle researcher, to use the data from the Montana
State University College of Nursing block grant (see
Appendix B). In addition, the proposal was also reviewed
and approved by the Crow Tribal Madam Chairman. Permission
was also obtained by the Crow Indian Health Service unit
Director and the Director of the Crow Head Start Program.
Before testing, informed written consent was obtained from
all of the participants' parents or guardians. Verbal
consent was obtained from each child who was free to choose
to participate or stop at any time during the test
administration.
There were no physical risks to the children who
participated. Some children might experience minor
frustration at not being able to complete a task, but a
wide range of behavior is sampled so that the children have
the opportunity to try a variety of activities. Some
children might be shy or fearful at being alone with the

63
researcher but particular effort was made to establish
rapport and approach the child with an air of confidence
and give a positive introduction to test surroundings and
materials.
Children were free to stop the testing at any time.
All data was accessed only by the researcher and the
researcher's thesis chair who assisted with data
collection. No names or other personal identifying
information were contained in printed or reported data.
There were no direct benefits for the participants.
Benefits to children will be derived from learning more
about the use of standardized developmental tests with
Native American children and how they can best be
interpreted for the benefit of children. Risks are minimal
in relationship to the potential benefits of knowledge
gained about the use of standardized developmental tests
with Native American children.

64
CHAPTER 4
RESULTS
The purpose of this study was to determine the
accuracy of three standardized developmental tests in
identifying the presence or absence of developmental delays
in a group of Native American Head Start children living on
or adjacent to the Crow Indian Reservation. The three
standardized developmental tests used for the study are the
Peabody Picture Vocabulary Test-Revised (PPVT-R) (Dunn &
Dunn, 1981), the Mccarthy Scales of Children's Abilities
(MSCA) (McCarthy, 1972), and the Early Screening Inventory
(ESI) (Meisels & Wiske, 1988). Results are discussed as
follows.
There were 60 Head Start children who participated in
the study. These children were randomly assigned into one
of three standardized test groups, each with an n of 20.
Since one child was inadvertently given all three tests,
Group 1 had an n of 21. The three test groups were found
to be fairly evenly distributed as far as number of boys
and girls, mean age and age range, and number who were
bilingual and monolingual (see Table 1).

7
65
Table 1. Head start Sample Assignment into Test Groups.
Bilingual/ Mean Group Instruments n M/F Monolingual Age Age Range
1 PPVT-R/MSCA 21 8/13 13/8 4y5m 3y5m-5y3m
2 PPVT-R/ESI 20 9/11 8/12 4y10m 4y1m-5y5rn
3 MSCA/ESI 20 10/10 8/12 4y2m 4y2rn-5y7rn
To determine the number of children who took each
separate test, the number of children in each test group
was added. For example, the 21 children in Group 1 who
took the PPVT-R were added to the 20 children in Group 2
who took the PPVT-R to give a total n of 41. Again, the
group configuration for each separate standardized
developmental screening test was fairly evenly distributed
for gender, age, age range, and number of children
bilingual and monolingual (see Table 2).
Table 2. Head start Group configuration for Instruments.
Bilingual/ Mean Instrument n (M/F) Monolingual Age Age Range
PPVT-R 41 17/24 21/20 4y7rn 3y5rn-5y5m
MSCA 40 18/22 21/19 4y7m 3y5m-5y7m
ESI 40 19/21 16/24 4y10m 4y1m-5y7m

66
The first null hypothesis, there will be no difference
in performance on the PPVT-R for the Head start sample and
the normed population, was rejected based on the t test.
The Head start sample standard equivalent score (mean =
77.4) was significantly lower than the standard equivalent
score (mean = 100) reported for the normed population. In
addition, 56% of the Head start sample PPVT-R scores were
in the moderately low to extremely low range compared to
11% for the normed population. Over half of the Head start
sample scored 1.5 standard deviations below the normed
mean. This is a 56% referral rate for possible delays in
receptive vocabulary for the Head start sample (see
Table 3).
Table 3. Comparison of Head start Sample and Normed Sample for the PPVT-R.
Test n Mean SD t df Ref. Rate
Head start PPVT-R 41 77.4 11.84 -12.20*** 40 56.1%
Normed PPVT-Rs 700 100.0 15.00 11.0%
* R ~ .05 ** 2 ~ .01 *** R $ .001 s = standardization (normed) sample data (Dunn & Dunn,
1981).
The second null hypothesis, the distribution of PPVT-R
standard equivalent scores for the Head start sample will

67
be no different than a normal distribution was retained.
The Lilliefors statistical test for normal distribution of
scores indicated no significant difference from normality L
(41, n = 41) = .0703, R > .200. The histogram Figure 2
(see Appendix C) shows the distributions of PPVT-R standard
equivalent scores for the Head start sample.
Null hypothesis three, there will be no difference in
the performance on the ESI in the critical age ranges for
the Head start sample and the performance on the ESI in the
corresponding age ranges reported for the ESI normed
population, was retained. Based on the ~ test, for each of
the four age ranges tested, there was no significant
difference between the mean scores for the Head Start
sample and the ESI normed population (see Table 4).
Table 4. Comparison of Head Start Sample and Normed Sample for the ESI.
Age (mo. ) n Mean SO t df Ref. Rate
48 - 53 8 18.38 5.15 1. 61 7 0.0% 48 - 53 50 21.3 5.4 5.2%
5
54 - 59 20 22.30 4.75 .85 19 5.0% 54 - 59 227 23.2 5.3 5.2%
5
60 - 65 9 25.0 3.87 .70 8 0.0% 60 - 65 175 25.9 5.4 5.2%
5
66 - 71 3 25.0 1.00 3.83 2 0.0% 66 - 715 27.2 5.4 5.2%
* P ~ .05 s = standardization sample data
..

T m - d 'T
68
The percentage of the Head start sample who scored in
referral range on the ESI (two standard deviations below
the normed mean for each age range) was equivalent to
norrned population only for the 54 months to 59 months age
group. This age group had a referral rate of 5% which
compared to the 5.2% referral rate for the ESI normed
group. For the Head start sample, the age groups 48 months
to 53 months, 60 months to 65 months, and 66 months to
71 months, had no children scoring in the referral range.
Null hypothesis four, the verbal, perceptual,
quantitative, general cognitive, motor and memory
performance on the MSCA for the Head start sample will be
no different than the performance reported in these areas
on the MSCA for the MSCA normed population, was rejected
for all areas of performance except the verbal. The Head
Start group scored significantly higher than the MSCA
normed population for perceptual performance (£ ~ .05),
and for the general cognitive, quantitative, memory, and
motor performances (Q ~ .001). Head Start sample referral
rates for delays compared favorably to the normed MSCA
population in the verbal performance area only (see
Table 5).

69
Table 5. Comparison of Head Start Sample and the Standardization Sample for the MSCA.
Scale n Mean SD t df Ref. Rate
Verbal 40 51.53 10.40 .90 39 10.0% Verbals 512 50 10 11. 0%
Percep 40 53.95 9.77 2.56* 39 7.5% Perceps 512 50 10 11. 0%
Quant 40 61.25 10.64 6.69*** 39 2.5% Quants 512 50 10 11.0%
GCl 40 109.03 15.11 3.78*** 39 2.5% GCls 512 100 16 11.0%
Mem 39 62.67 10.61 7.45*** 38 2.6% Mems 512 50 10 11.0%
Motor 39 59.51 6.91 8.60*** 38 0.0% Motors 512 50 10 11.0%
*R .$. .05 **R .$. .01 ***R < .001 s = standardization sample data (McCarthy, 1972)
Null hypothesis five, the distribution of each of the
six MSCA scale index scores for the Head Start sample will
be no different from a normal distribution, was retained.
Lilliefors tests for all scales had significance greater
than .200 indicating a normal distribution (see Table 6).
The histograms Figures 3 through 8 (see Appendix C) show
the distributions of MSCA scale index scores for the Head
start sample.

70
Table 6. Summary of Lilliefors Scores for Head start MSCA Scale Indexes.
Scale Index Lilliefors df Significance
Verbal .0661 40 > .2000
Perceptual .0523 40 > .2000
Quantitative .0784 40 > .2000
GCl .0631 40 > .2000
Memory .0743 40 > .2000
Motor .0707 40 > .2000
Hypothesis six, the standard score equivalents for the
PPVT-R, the scale index score for the GCl of the MSCA, and
the ESI total screening scores will not vary significantly
with each other, was partially rejected. Pearson product
correlations between the Head start test groups showed that
the GCl correlated significantly with the PPVT-R. The GCl
correlated significantly with the ESl total screening
score. The PPVT-R did not correlate significantly with the
ESI (see Table 7).
Table 7. Correlations Between Pairs of Test Scores.
GCI
PPVT-R
*12 .5 .05
GCl
**12 5 • 01
PPVT-R ESl
.57** .76***
.28
***R < .001

71
Hypothesis seven, the Head start sample of children
who are bilingual and who are monolingual will have no
significant differences in their standard equivalent scores
on the PPVT-R, no significant differences in any of their
six scale index scores on the MSCA, and no differences in
their total screening score on the ES1, was retained. The
t test compared the monolingual Head Start children and the
bilingual Head Start children's test performance for each
test. Monolingual and bilingual children did not differ
significantly (see Table 8).
Table 8. Comparison of Head Start Sample Monolingual and Bilingual Test Performance (Mean Scores) .
Mean Mean Test (Monolingual) SD (Bilingual) SD t
PPVT-R 76.0 10.8 79.3 13.0 -.87
ESI 21. 3 5.7 23.8 3.3 -1.56
Verbal (MSCA) 50.8 10.2 52.3 10.8 -.44
Percep. (MSCA) 54.6 11.0 53.4 8.6 .38
Quant. (MSCA) 60.7 8.0 61.8 12.9 -.32
GCl (MSCA) 107.4 13.4 110.78 16.8 -.68
Memory (MSCA) 61. 3 8.5 64.1 12.5 -.82
Motor (MSCA) 58.3 8.1 60.8 5.3 -1.13
*R .$. .05
72
In summary, four of the null hypotheses were retained.
There were normal distributions of scores for the Head
start sample for both the MSCA and the PPVT-R (hypotheses 2
and 4). Head start ESI performance did not significantly
differ from the normed ESI population (hypothesis 3).
Bilingual and monolingual Head start children had no
significant differences in their test performances
(hypothesis 7).
Two null hypotheses were partially retained. The GCI
correlated with the ESI and the PPVT-R (retained), but the
ESI did not correlate with the PPVT-R (hypothesis 6). For
hypothesis 4, only Head start verbal MSCA performance was
retained as having no difference with the normed MSCA
population. Head start performance on the other five MSCA
scales did significantly differ from the normed
performance. Hypothesis 1 was rejected as Head start
PPVT-R performance significantly differed from normed
PPVT-R performance.

73
CHAPTER 5
DISCUSSION
A brief summary of results for each standardized
developmental screening test will be discussed. This will
be followed by discussion of the distribution of score
results, the correlation of test results, test performance
of bilingual/monolingual children, and extraneous/
interpersonal factors that may have influenced results.
Finally, conclusions based upon this study and implications
for future research will be presented.
PPVT-R
A summary of data results indicated that the Head
start children scored significantly lower on the PPVT-R
than the standardized PPVT-R population. Fifty-six percent
of the receptive vocabulary scores for the Head start
sample were at or below the sixth percentile. When
interpreting this result, the tester needs to be aware that
development of the PPVT-R was based on the English
vocabulary skills of primarily middle-class Caucasian
children and is reflective of their cultural/linguistic
experiences. Since a large percentage of the Head start
group tested at a low level of receptive English vocabulary
----------------------------
74
acquisition, this is indicative that the Head start group
does have cultural and linguistic experiences different
from the normed population and the tester. Possibly words
used in the PPVT-R are used with less frequency in the day
to-day experiences of the Head start group than they were
used by the normed group. The PPVT-R results for the Head
start group indicated that this group has of yet
inadequately developed English language receptive
vocabulary acquisition. No inferences can be made about
the verbal abilities, aptitudes, or potential based upon
these PPVT-R test results.
PPVT-R results contrasted sharply with the children's
performance on the MSCA. The Head start sample scored
significantly higher than the standardization sample in
perceptual, quantitative, general cognitive, memory, and
motor abilities. Verbal ability scores for the Head Start
children approximately equaled the standardization sample
scores. Referral rates for the Head start sample on the
MSCA (percentage of children with scores 1.5 standard
deviations below the mean) were lower than the 11% referral
rate reported for the standardization sample. Referral
rates for delays ranged from 0.0% for the Motor scale to
10% for the Verbal Scale.
75
Higher Head start sample scores on the MSCA compared
to the PPVT-R are consistent with performance by culturally
different populations as reported in studies where language
tests and general performance tests were compared (Sattler
& Altes, 1984; Teuber & Furlong, 1985: Valencia, 1985).
Interpretation of Head Start MSCA results may indicate that
the MSCA items are less culturally diverse than PPVT-R
items. MSCA test items may be more familiar and more
frequently encountered by the Head start group on a day-to
day basis. The higher MSCA scores by the Head start group
are consistent with reports in the literature that Native
American cultures foster development of visual-spatial and
perceptual motor skills (Dana, 1989; McShane & Plas, 1982).
This researcher has noted that the Crow tradition of
storytelling to children may foster verbal and numerical
memory skills. The Head start sample scored in the above
average range in verbal and numerical memory skills. Since
referral rates on the MSCA for the Head Start sample are
well below the 11% national normed rate, more testing with
a larger sample is recommended to ensure that the MSCA is
sensitive and will discern children with developmental
delays in this Native American group of children.
Results for the ESI were reported by age group because
the ESI does not convert raw scores into equivalent or

76
scaled scores. Thus, three of the Head start ESI age
groups had very small numbers (n = 3, n = 8, n =9). Head
start children's performance on the ESI for 54 to 59 months
age group (n = 20) did not vary significantly from the ESI
standardization sample. Referral rates for delays for this
age group on the ESI approximately equaled the
standardization sample rate. The Head start sample results
for the other three age groups for the ESI are suspect
since the group numbers were too small to be meaningful.
ESI results for the Head start sample are difficult to
interpret due to the uneven and low numbers in each of the
four age groups. However, since referral rates for the 54
to 59 months age group (n = 20) were close to the
standardization referral rate, the ESI might be a test that
is both sensitive and specific (does not over or under
identify delays) with this group of Native American
children. The ESI has more verbal expressive items rather
than verbal receptive. These items (block, button, ball,
car) were all familiar to the children. The children who
took both the ESI and the MSCA were challenged by the ESI
block building test which required them to copy a structure
that they had not been shown how to build. The ESI score
is based on the total score for all items. There were no
cut off scores for separate performance areas (i.e.,
visual-motor/adaptive, language) so only the total
performance was compared to the standardization sample.

77
Score Distributions
The distribution of the Head Start PPVT-R scores was a
normal distribution, as was the distribution of the scores
for all six scales of the MSCA. The distribution of the
ESI scores was not analyzed and compared to a normal
distribution since the numbers in each age group were
small. When the distribution resembles a normal curve, the
standard deviation is a useful statistic for summarizing
the average deviation about the mean and discerning the
degree to which individual performances differ from one
another (Meisels, 1991). In addition, the standard
deviation is useful when interpreting the scores of an
individual within the distribution. A Head start child's
score of 139 on the General Cognitive Index (Gel) indicates
that he/she scored approximately 2 SO above the average GCl
score for the Head Start distribution of scores and about
2.5 SD above the average GCI score for the standardization
sample. In contrast, a Head Start child's receptive
vocabulary score (PPVT-R) of 100 is about 2 SD above the
average score for the Head Start sample and exactly the
mean or average score when compared with the
standardization population.
Knowing a distribution resembles a normal curve is
useful in interpreting how extreme or typical a given score
might be. With normal distributions, 99.7% of the

78
observations will fall within 3 SO of the mean, 95% of
cases within 2 SD of the mean, and 68% of the cases within
1 SD of the mean (Woods & Mitchell, 1988). Knowing that
the PPVT-R and the MSCA have normal distributions within
the Head start sample, suggests that these tests can
discern individual variability within the Head start
sample. However, since the Head Start sample mean and the
standardization population mean differed significantly for
both of these tests any interpretation of individual
performance would have to be made with caution.
Correlation
Results indicated that the General cognitive Index of
the MSCA correlated significantly with the PPVT-R. This
was consistent with information on the PPVT-R and the
Wechsler Preschool and Primary Scale of Intelligence
(WPPSI) where there was a mean correlation of .58 (Dunn &
Dunn, 1981). Dunn and Dunn also reported that mean PPVT-R
scores were 13.2 points lower than the mean WPPSI IQ
scores. This difference was attributed to the greater
nUmber of perceptual-motor tasks included at the lower
levels of the WPPSI. Sattler's and Altes (1984) reported
that the correlation between the Spanish PPVT-R scores and
the Perceptual-Performance Scale scores was not significant
in their study on the performance of bilingual and
monolingual Hispanic preschool children on the PPVT-R and

79
the Perceptual-Performance Scale of the MSCA. They also
reported that the bilingual children scored almost 2 SO
below (mean = 72.9) the norm score on the PPVT-R but had a
mean score of 54 (no significant difference with the norm
population mean) on the Perceptual-Performance Scale of the
MSCA. This was similar to the Head Start sample whose mean
score on the PPVT-R was somewhat higher at mean = 77 but
still almost 2 SO below the standardization sample and
whose mean score on the Perceptual-Performance Scale of the
MSCA was 54.
The Head start sample General Cognitive Index also
correlated highly significantly with the total screening
score of the ESI (~ = .76, R ~ .001). This was consistent
with the concurrent validity study of Meisels's and Wiske's
(1988) where a correlation coefficient of .73 (R < .001)
was obtained between the two test scores. Meisels and
Wiske inferred from these data that the ESI generally
measures the same domain of skill, knowledge, and abilities
that are measured by the GCI of the MSCA. In The Head
Start sample, ESI total screening scores did not correlate
significantly with the PPVT-R scores. This could be a
result of different standardization samples used with the
two tests or because the tests do not measure the same
domains.

80
Monolingual and Bilingual Performance
The bilingual Head start children in the sample did
not differ significantly from the monolingual children in
any of their test performances. The bilingual children had
slightly higher (1-3 points) mean scores than the
monolingual children on all tests but this difference was
not significant. One explanation for this is the limited
sample size. Another possible explanation is that language
dominance was determined by subjective report of Head start
teachers and parents. Language dominance tests were not
done on the sample to measure true language dominance.
still, another explanation is the possible prominence of
native language entrants into Indian English (Anderson &
Anderson, 1983).
Interpersonal and Extraneous Influences
other possible influences on the accuracy of the three
developmental tests will be discussed from the standpoint
of interpersonal and extraneous aspects of the testing
experience and possible cultural factors influencing the
test. The tester was Caucasian and spoke only English to
the testee. Because the overall testing took approximately
six months to complete, the Head Start children became very
accustomed to seeing the tester and much less hesitant to
go with the tester. Half of the PPVT-R testing was given

81
in the first three months of the Head start testing period,
however, half of the MSCA testing and half of the ESI
testing were also given during the same time period.
The Crow Head start program has noted that referral
rates for delays decrease from Fall to spring possibly due
to the Head start services provided to the children
(Visscher, 1989). Children who took the tests in the
latter half of the six month interval may have had some
advantage over those taking the tests earlier. Another
environmental factor that may have influenced results is
that testing often took place in the speech room where
there were pictures of various animals on the wall. This
may have influenced a verbal fluency item on the MSCA in
which children were asked to think of as many animals as
they could within a 20 second time period.
The most common affect of the children, the testees,
was shyness. Most of the children were quiet and waited
for task items to be explained to them. Children often
sought some type of evaluative feedback on how they were
doing. Sometimes this occurred by checking the facial
expression of the tester or by inquiring about the tester's
behavior. Rarely, with the exception of motor ability
items, did children provide their own evaluative feedback
by saying "I'm good at this!" or by showing a satisfied
facial expression. Children often used local or familiar
items on their verbal fluency items, such as "deer", "elk",

82
" t' l' "( , moun a1n 10n an1mals), "elk tooth dress", "moccasins"
(things to wear), "horse", "bull" (things to ride).
An analysis of the frequency of missed test items was
not conducted for this study. A general overview of some
items that appeared to be missed most often were "What is a
factory?" on the MSCA, and the following words on the
PPVT-R: helicopter, sail, net, cage, envelope, penguin,
pasting, and parachute. All of these items are examples of
objects that the children in this rural setting may have
less opportunity to have encountered in their daily
experiences.
Conclusion
The results provided by this study do not allow a
decision to be made about whether or not the PPVT-R, the
MSCA, or the ESI are accurate measures of Crow Head start
children's receptive vocabulary and developmental
abilities. Results do not clearly indicate how accurate
these tests are in detecting developmental delays for this
group of Native American children. Results do give base
line information about the performance of these tests in a
small group of Crow Head start children. Specifically,
results indicated the mean test scores, the distribution of
scores, and the present referral rate for delays for each
test. caution must be used in interpreting individual
developmental abilities based upon the test performances.

83
Since these tests have been established as reliable
and valid instruments, they can be used to make informed
decisions to enhance the development of this group of
Native American children (DeBlassie & Franco, 1983;
Meisels, 1991; NAEYC, 1988). An important concern
generated by this study was the large number of children
within the sample that, at this point in time, tested low
in receptive English language vocabulary acquisition. This
result was found to be independent of whether the children
were bilingual or only English speakers. The Head start
sample also demonstrated average to above average abilities
in other areas of development (i.e., perceptual, memory,
quantitative). These areas need to be supported,
especially since it has been noted in the literature that
declines in Native American children's school performance
are not noted until second grade and then progressively
worsen (McShane, 1988; McShane & Plas, 1984).
DUnn and Dunn (1981) stated that since oral language
is highly stressed in schools, facility in using standard
English is widely recognized as a prerequisite to success
in school, work, business and higher education. Several
sources have suggested that development of children's
ability to control their own cognitive processes is
contingent upon mastery of their primary language (Anderson
& Anderson, 1983: Cummins & swain, 1986: Vygotsky, 1978).
Based upon these sources and the test results, there are

84
several suggestions for intervention in this Native
American community in order to promote acquisition of
primary language skills, whether this be Crow or English.
Nurses and physicians are often the first and only
professionals in contact with young Native American
children and their families (Glascoe et al., 1990). They
can use this opportunity to establish baseline
developmental patterns of the children with standardized
developmental testing and information from parents.
Deviations from normal might include a pattern with low
performance in perceptual, gross motor, quantitative, and
memory areas. Rather than a low verbal score, deviations
in verbal areas may be noted by stuttering, incomplete
utterances, prolonged delays in response times, poor topic
maintenance, and the need for frequent clarification and
repetition (Fradd & Hallman, 1983). If these behaviors are
noted by the parent during day-to-day interactions with
their child, this would give further indications to
evaluate for a verbal delay.
During routine well child exams, health care providers
can emphasize the importance of parent-child verbal
interaction in the language the parent is most comfortable
speaking. Parents can be encouraged to read aloud, sing
and play with their children. Bilingual parents can be
reassured that their children will be able to make the

85
home-to-school language switch without causing academic
problems (Cummins & Swain, 1986).
Nurses can work with tribal community leaders to
support efforts to promote building of language skills and
preliteracy in children. This may include promotion of
programs such as Head Start and Even Start. Parenting
classes that emphasize bringing back storytelling
traditions, singing of traditional lullabies, awareness of
the importance of positive verbalizations to children, and
how to reinforce vocalization and verbalization in infants
and children need to be supported.
Health care providers can also support tribal leaders
in their efforts to provide more stable environments for
children. Health care providers can keep tribal leaders
informed of ongoing developmental trends in children and
the incidence of problems that impact on development such
as fetal alcohol syndrome and otitis media. This can give
them objective data to provide to Congress for funding of
programs to address problems or support ongoing successful
programs.
Implications for Future Research
Since the study population was a small and specific
group of Crow Head Start children, results are not
generalizable to all Crow children or to other Native
American children populations. It is recommended that this

86
study be replicated with a larger more representative
sample, that testing be done either in the fall or in the
spring, that a language dominance test be administered to
more systematically clarify the terms monolingual and
bilingual, and that an analysis of individual test items be
compared for cross-cultural differences. The use of a
trained bilingual tester may also increase information
about the usefulness of these tests with Native American
preschool children.
Because of this study, many ideas for further research
were identified. A longitudinal study of a cohort of
children would further verify the accuracy of these tests
in identifying varying degrees of ability. A comparison of
the results of these tests with the results of other
developmental tests used in this population of children,
such as the Batel1e, would provide another source of
concurrent validity. A study of the performance of the
short form of the MSCA, the Kaufman version, with Native
American preschool children may be helpful since health
care providers are in need of tools that are valid and
reliable and can be administered in a relatively short
period of time.
Meisels (1991) stated that tests and measures
represent only a portion of the factors that need to be
considered when identifying children at risk for
developmental delays. Attention must be given to the

87
environmental context of caregiving and the family's
internal and external resources and stresses. Parenthood
is a developmental and adaptive process and parental
figures mediate the social and cultural influences on the
child that playa unique role in the child's development
(Meisels, 1991). It is only through an examination of the
context of caregiving that a complete picture of a child's
risk status will begin to emerge (Werner, 1986). Studies
of teenage mother-child dyads have indicated that deficits
in mother-child interaction, particularly in communicating
with their children, directly lead to deficits in cognitive
abilities in the children over time (McAnarney & Lawrence,
1993). Thus, a study of the influence on development of
such factors as the quality of the home environment,
parents' perceptions or knowledge of their child's
development, and childrearing practices may be particularly
useful in further understanding Native American children's
developmental abilities.
Health care providers, educators, parents of Native
American children, and Native American children would
benefit from new knowledge regarding the use of
standardized developmental screening tests with Native
American children. More knowledge about the use of such
tests in this population will help to distinguish true
delays due to problems in development from those that are
due to sociolinguistic incompatibility between the tester,

I
L
88
test and the testee. Finally, more knowledge about
developmental testing in Native American populations will
help ascertain not only the presence or absence of
developmental competencies but will also help ascertain a
Native American child's potential competencies and predict
which interventions would most likely lead to the
development and nurturance of such competencies over time.
Providing culturally appropriate developmental screening,
assessment and interventions will foster optimal
development of the child's full range of abilities
regardless of cultural background.

89
REFERENCES
l

90
Anastasi, A. (1976). Psychological Testing. New York: Macmillan.
Anderson, G., & Anderson, S. (1983). The exceptional Native American. In D.R. Omark & J.G. Erickson (Eds.), The Bilingual Exceptional Child (pp. 163-179). San Diego, CA: College Hill Press.
Armour-Thomas, E. (1992). Intellectual assessment of children from culturally different backgrounds. School Psychology Review, 21 (4), 552-565.
Backman, J., Cornwall, A., stewart, M., & Byrne, J. (1989). Stability of children's neuropsychological profiles: comparison of McCarthy Scales and WISC-R. Clinical-Neuropsychologist, ~ (2), 157-161.
Berlin, I.N. (1982). Prevention of emotional problems among Native American children: Overview of developmental issues. Journal of Preventive Psychiatry, 1 (3), 319-330.
Berry, J. (1971). Ecological and cultural factors in spatial perceptual development. Canadian Journal of Behavioral Science, 3, 324-336.
Brescia, W., & Fortune, J. (1989). Standardized testing of American Indian Students. college-Student Journal, 23 (2), 98-104.
Burke, S.D., Baumgart, A., Sayers, A., & Wray, J.G. (1985). Pitfalls in cross-cultural use of the Denver Developmental Screening Test: Cree Indian children. Canadian Journal of Public Health, 76, 303-307.
Clarizio, H. (1982). Piagetian assessment measures revisited: Issues and applications. Psychology in the Schools 19, 52-58.
Cohen, R. (1969). conceptual styles, culture conflict, and nonverbal tests of intelligence. American Anthropologist, 71 (5), 828-856.
Cohen, R. (1971). The influence of conceptual rule-sets on measures of learning ability. In C.L. Brace, G.R. Gamble, & J.T. Bond (Eds.), Race and intelligence (pp. 41-57). Washington, D.C.: American Anthropological Association.
Crain, W. (1985). Theories of development (2nd ed.). New Jersey: Prentice Hall.

J
91
Cummins, J •. (1984). Bilingualism and special education: I~sues In assessment and pedagogy. San Diego: College HIll Press.
Cummins, J. & Swain, M. (1986). Bilingualism in education: Aspects of theory, research and practice. New York: Longman.
Dana, R. (Ed.). (1981). Human services for cultural minorities. Baltimore: University Park Press.
Dana, R. (1984). Intelligence testing of American Indian children: Sidesteps in the quest of ethical practice. White Cloud Journal, ~, (3), 35-43.
Dansen, P. (1984). The cross-cultural study of intelligence: Piaget and the Baoule. International Journal of Psychology, 19, 107-134.
Dansen, P., & Heron, A. (1981). Cross-cultural tests of Piaget's theory. In H.C. Triandis & A. Heron (Eds.), Handbook of cross-cultural psychology (Vol. 4, Chap. 7). Boston: Allyn & Bacon.
Deyhle, D. (1986). Success ethnographic comparison perceptions of testing. 365-389.
and failure: A micro-of Navaho and Anglo students'
Curriculum Inquiry, 16, (4),
DeBlassie, R., & Franco, J. (1983). Psychological and educational assessment of bilingual children. In D.R. Omark & J.G. Erickson (Eds.), The bilingual exceptional child (pp. 163-179). San Diego, CA: College Hill Press.
Diessner, R., & Walker, J. (1986). A cognitive pattern of the Yakima Indian students. Journal of American Indian Education, 25 (2), 39-43.
DiNicola, A. (1986). The neglected and abused children on Indian reservations: A low priority, nonvocal group with few vocal advocates. American Journal of Diseases in Children, 140, 89.
Dulay, H., & Burt, M. (1980). Second language acquisition. In H. Dulay & M. Burt (Eds.), Testing and teaching communicatively handicapped Hispanic children: state of the art in 1980. Sacramento, CA: State Department of Education.
'7

92
Dunn, L., & Dunn, L. (1981). Peabody Picture Vocabulary Test-Revised. Circle Pines, Minnesota: American Guidance Service.
Faust, D., & Hollingsworth, J. (1991). Concurrent validation of the Wechsler Preschool and Primary Scale of Intelligence-Revised (WPPSI-R) with two criteria of cognitive abilities. Journal of Psychoeducational Assessment, 2 (3), 224-229.
Feldman, D. (1980). Beyond universals in cognitive development. Norwood, NJ: Ablex.
Feurstein, R. (1979). The dynamic assessment of retarded performers: The learning potential assessment device. theory, instruments and techniques. Baltimore, MD: University Park Press.
Fradd, S., & Hallman, C. (1983). psychological and educational and instruction of culturally different students. Learning 468-478.
Implications of research for assessment and linguistically Disability Quarterly &,
Freedman, D., pisani, R., & Purves, R. (1980). statistics. New York: W.W. Norton & Co.
Garcia ColI, C. (1990). Developmental outcome of minority infants: A process-oriented look into our beginnings. Child Development, 61, 270-289.
Gardner, H. (1983). Frames of mind: The theory of multiple intelligences. New York: Basic Books.
Glascoe, F., Martin, D., & Humphrey, S. (1990). A comparative review of developmental screening tests. Pediatrics, 86 (4), 547-554.
Glick, J. (1985). Culture and cognition revisited. In E.D. Neimark & R. DeLisi (Eds.), Moderators of competence (pp. 99-144). Hillsdale, NJ: Erlbaum.
Halpin, G., Simpson, R., & Martin, S. (1990). An investigation of racial bias in the PPVT-H. Educational and Psychological Measurement, 50 (1), 183-189.
Haring, N., & McCormick, L. and youth. (4th ed.).
(1986). Exceptional children Columbus, OH: Merrill.
93
Head start. (1992). Family profile and health and social service report. (Available from Crow Head start Program, Crow Agency, MT).
Hoffman, T. (1985). Measured acculturation and MMPI-168 performance of National American adults. Journal of Cross-Cultural Psychology, 16 (2), 243-256.
Hollinger, C., & Sarvis, P. (1984). Interpretation of the PPVT-R: A pure measure of verbal comprehension? Psychology in the Schools, 21, 34-41.
Horejsi, D. (1987). Traditional Native American culture and contemporary U.S. society: A comparison. Portland, Oregon: Northwest Indian Child Welfare Association.
Irvine, S. & Berry, J. (1988). The abilities of mankind: A revaluation. In S.H. Irvine & J. W. Berry (Eds.), Human abilities in cultural context. New York: Cambridge University Press.
Krechevsky, M. (1991). project Spectrum: An innovative assessment alternative. Educational Leadership, 121, 43-48.
Lidz, C. (1982, April). Psychological assessment of the preschool disadvantaged child. Paper presented at the Annual International Convention of the Council of Exceptional Children, Houston, TX.
Locke, J. (1690). Essays concerning human understanding. (Vol. 1, J.W. Yolton Ed.). London: J.M. Dent & Sons Ltd. 1961.
May, P. (1988). The health status of Indian children: Problems and prevention in early life. American Indian and Alaskan Native Mental Health Research, Monograph No.1, 244-289.
McAnarney, E. & Lawrence, R. (1993). Day care and teenage mothers: Nurturing the mother-child dyad. Pediatrics, 91 (1), 202-205.
McCarthy, D. (1972). McCarthy Scales of Children's Abilities. San Antonio, TX: The Psychological Corporation.

· F .":m:: 1m Y7n757_
94
McShane, D. (1983). Explaining achievement patterns of American Indian children: A transcultural developmental model. Peabody Journal of Education, 61 (1), 34-48.
McShane, D. (1988). Analysis of mental health research with American Indian youth. Journal of Adolescence, 11, 87-116.
McShane, D., & Plas, J. (1982a). otitis media and psychoeducational difficulties and American Indians: A review and a suggestion. Psychiatric Prevention, 1 (3), 277-291.
McShane, D., & Plas, J. (1982b). Wechsler Scale performance patterns of American Indian children. Psychology in the Schools, 19 (1), 8-17.
McShane, D., & Plas, J. (1984). The cognitive functioning of American Indian children: Moving from the WISC to the WISC-R. School Psychology Review, ld (1), 61-73.
Meisels, S. (1984). predicting school performance with ESI. Psychology-in-the-Schools, 21, 25-33.
Meisels, S. (1985). Developmental screening in early childhood: A guide (2nd ed.). Washington D.C.: National Association for the Education of Young Children.
Meisels, S. (1991). Dimensions of early identification. Journal of Early Intervention, 15 (1), 26-35.
Meisels, S., & Wiske, M. Screening Inventory.
Meisels, S., & Wiske, M. Inventory (2nd Ed.). Press.
(1976). The Elliot-Pearson Medford, MA: Tufts Univ.
(1988). Early screening New York: Teachers College
Mercer, J. (1973). The pluralistic assessment project: Sociocultural effects in clinical assessment. School Psychology Digest, ~ (4), 10-17.
Mercer, J. (1979). SOMPA System of Multicultural Pluralistic Assessment. New York: Psychological Corporation.
Miller-Jones, D. (1989). Culture and testing. American Psychology, 44 (2), 360-366.

T T 'WE SW7"
95
Moran, E. (1989). Crow Tribe: Bureau of Indian Affairs Tribal Report. (Available from BIA, Crow Agency, MT 59022).
NAEYC, (1988). NAEYC Position statement on standardized testing of young children 3 through 8 years of age. Journal of Young Children, 43 (3), 42-47.
Neely, R., & Shaughnessy, M. (1984). Assessments and the Native American. New Mexico. ED 273889.
Nie, N., Hull, C., Jenkins, J., steinbrenner, K., & Best, D. (1983). SPSS users' guide. New York: McGrawHill.
Nuttall, E. (1987). Survey of current practices in the psychological assessment of limited proficiency handicapped children. Journal of School Psychology, D, 53-61.
Oakes, J. & Faust, D. (1990). Concurrent validation of the Wechsler Preschool and Primary Scale of Intelligence-Revised (WPPSI-R) with the McCarthy Scales of Children's Abilities, and the Peabody Picture Vocabulary Test-Revised. Paper presented at the annual meeting of the American Psychological Association, Boston, MA.
Hm'
Oroark, D., & Watson, D. (1983). Psychological testing and bilingual education: The need for reconceptualization. In D.R. Omark & J.G. Erickson (eds.), The bilingual exceptional child (pp. 23-53). San Diego, CA: College Hill Press
Piaget, J. (1936). The orlalns of intelligence in children. (M. Cook, 1974 trans.). New York: International Universities Press.
Sameroff, A., Seifer, R., Borocas, R., Zax, M' I & Greenspan, S. (1987). Intelligen<;=e quotient 7cores of 4-year-old children: Social envlronmental rlsk factors. Pediatrics, 79, 343-350.
Sattler, J., & Altes, L. (1984). Performance of bilingual and monolingual Hispanic children on the Peabody Picture Vocabulary Test-Revised and the Mccarthy Perceptual Performance Scale. Psychology in the Schools, 21, 313-316.

96
Segel, I. (1~70). The distancing hypothesis: A causal hypothesls for the acquisition of representational thou~ht: In M.R. J~nes (Ed.), Miami symposium on the predl~tlon of behavl0r, 1986: Effects of early expe:le~ce (pp. 73-86). Coral Gables, FL: University of Mlam1 Press.
Sharp~ey, C:' &,Stone, J. (1985). An exploratory lnvestlgatl0n to detect cross-cultural differences on the PPVT-R. Psychology in the Schools, 22, 383-386.
Shonkoff, J. & Meisels, S. (1990). Early childhood in~ervention: The evolution of a concept. In S.J. Melsels & J.P. Shonkoff (Eds.), Handbook of early childhood intervention (pp. 3-32). New York: Cambridge University Press.
Shutt, D. (1972). Family participation in the psychological evaluation of minority children. Paper presented to Southwestern Orthopsychological Association Meeting, Galveston, TX.
Sidles, C., & MacAvoy, J. (1987). Navaho adolescents scores on a primary language questionnaire, the Raven Progressive Matrices and the Comprehensive Test of Basis Skills: A correlational study. Educational and Psychological Measurement, 47, 705-707.
Smith, M., & Shepard, L. (1987). What doesn't work: Explaining policies of retention in the early grades. Educational Leadership, 45 (2), 129-134.
Spearman, C. (1927). The abilities of man. London: Macmillan.
sternberg, R. (1988). A triarchic view of intelligence. In S.H. Irvine & J.W. Berry (Eds.), Human abilities in cultural context. New York: Cambridge.
Teuber, J., & Furlong, M. (1985). The concurrent validity of the Expressive One-Word picture Vocabulary Test for Mexican-American children. Psychology in the Schools, 22 (3), 269-273.
Thomas M. (1985). comparing theories of child d~velopment. Belmont, CA: Wadsworth Publishing Co.
Torrance, E. (1982). Identifying and capitalizing on the strengths of culturally different children. In C.R. Reynolds & T. B. Gutkin (Eds.), The handbook of school psychology. New York: wiley.

97
Valencia, R. (1988). The McCarthy Scales and Hispanic children: A review of psychometric research. Hispanic Journal of Behavioral Sciences, 10 (2), 81-104.
Valencia, R., & Rankin, R. (1985). Evidence of content bias on the McCarthy Scales with Mexican American children: Implications for test translation and nonbiased assessment. Journal of Educational Psychology, 77 (2) 197-207.
VanBreda, A. (1989). Health issues facing Native American children. Pediatric Nursing, 15 (6), 575-577.
Visscher, T. (1989). The use of cultural adaptations and local norms in the screening of Crow Head Start children. Unpublished master's thesis. Billings, Montana: Eastern Montana College.
Vygotsky, L. (1978). Mind in society: The development of higher psychological processes. Cambridge, MA: Harvard University Press.
Weloe-Crow, P. (1990). Early screening inventory. Diagnostique, 15 (4), 63-74.
Werner, E. (1986). A longitudinal study of perinatal risk. In D.C. Feran & J.D. McKinney (Eds.), Risk in intellectual and psychological development (pp. 3-28). Orlando, FL: Academic Press.
Williams, P., & Williams, A. (1987). Denver Developmental Screening Test norms: A cross-cultural comparison. Journal of Pediatric Psychology, 12 (1), 39-59.
Woods, N. & Mitchell, P. (1988). Designing studies to explore association and difference. In N.F. Woods & M. Catanzaro (Eds.), Nursing research: Theory and practice (pp. 150-165). st. Louis: C.V. Mosby Co.
Zucker, S., & Copeland, E. (1988). K-ABC and McCarthy Scale performance among "at-risk" and normal preschoolers. Psychology-in-the-Schools, 27 (2), 111-115.
OQ

! I
L
98
APPENDICES

99
APPENDIX A
DATA COLLECTION INSTRUMENTS
L

100
Peabody Picture Vocabulary Test-Revised
INDMDUAL TEST RECORD by UOYO M. DUNN & LEOTA M. DUNN
NAME __ _ -, HOME ADDRESS _________ __
TEACHER _____ ~-----.- .. -.
LANGUAGE
~ .. -.---.-., l!ORM L I -----. - -_" ___ ·• ____ "4
_ ..... SEX: M F
HOME ... PHONE
GRADE _ PLACEMENT....
EXAMINER.
OF THE HOME: 0 Standard Eogfish; 0 Other . __ . "_ . r_ ... 00!1"~ ........ ("9""',."'""_
Date & Age Data -. Dale of lesting ........ __ _
Oaleof birtl"l ••....•.. __ _
Chronological age ....•..... ---
""Ihe number of Clays exceeds 15, add a monIh 10 the age (see Part I of the Manual).
•
Notice 10 Users The PPVT -R" not inl~ lOt u~ ., $rtuattons where Irvlll·",,· testJnQ If>9osi.J!1()n s!>pu!a!es thai copies of test '!ems and OO"t'CI responses be d,Slrobv!e<310 SUbj(IC1s.pa'enls,or~ oenefal pub. Joe Such ()sclosure, may rna"_ the nonns meantt>glen ., future iest'nQ
Reason for Testing (may include relerral SOOfce and pefson aulhonllnQ tUI,ngl
------------------ - ... --.... - ...
--------_._----- _._ ........ _ ... --_.
-----------_. __ ._-_ .. ----------_._. __ . __ .......
CopyTI\jhII981 by lloyd'" Dum and lllOla '" Dunn ft .. .,._sf ..... C<lIl1'''1'' la_ '" , .. ",0<1,,<0 ..... r~ by tom\lU1<If, ollie. machone. Of.",.,."... mean. P~ntod on *
A. ras I It PUBLISHED BY AMERICAN GUtOANCt SERVlC£ Aocyc:led PC* .t1..\.7i CIRClE PINES. MlNNESOTA55014-1196 A 0 II , 7

-"""'~---"--'---------'
Obtained Test Scores
Rawacore ....... . (!rampage.)
Standard score
Mark the obtained standard score eqUIvalent on the top scale. Then draw. heavy. 5lf8lght. vertICal hne through It, and ecfOS'l the throe scale, This line WI" extend through the Ihree obtained deYlIUon-lype test SCOf8S Depending upon lhe obtained ,'.ndard 6COf8. shade In • bind on both sides 01 the vertical hne, USing the SChed~.lo the right An •• ample,S given In Figur. 1 4 01 the Manual.
- --- --- ---_._---
1M'lI""td ARU TO SHAD( l:*,..,td
.::~~--'--.J~. :'e:::. ~:'" Relow 85-6!)·74 7~·84 8~·8V
90118
,. 1'00"00 12 tHH'" 10 115-124
II 125-134 7 '35 & above
"'''f.AlOs..AOf
Jt!. =~ 7 7
• • '0 • '2 2 ,. 0
ThiS thaded ar •• prOVideS. confidence band the ,ange ot SCores wlth,n which the subl8Cl'. true scores Can be expected to lall681lfnes In 100 (The~e band wldlh values.,. based on. median siandard error 01 measuremttnl (SEM) of + 7. Wllhthe bandW'ld1hs made M'IC,aaslI'\Q'Y asymmeMlCal loward the extremes 10 allow 'orf-oresslOn to the mean) s..lJ'ar11 0' the Manual and the TKhnlcal Supplemenl lor mor. precise values and a dISCUSSIOn 01 SEM con'ldence bande, AIIIO". the Manual tor a dlscusstOn 01 how to Calculate rhe true &COfe conftdeoce band 'or lhe age flQUlv.len,
-----.. -~---..
equivalent ....... . (from Table 1. Appendix Al
o D D o
~'" '.k,'" 'th'" ,t" ,t" '~'" '~'" ,}{...-rr~'" '~'" 'k'" 'Jo'" ',~" \Ii;" ',10" ',\.;" it";S" ',£" ',),5" lJo"';l5" ',l.;" \~., ',In Pen:enth rank .... (from Table 3. Appendix Al
Stanlne ........ .. (lromTable 3 .... ppend, .... )
Age equivalent .... 0 (hom Table 4. Appendl. A)
I Data from Other Tests -- ---
T •• , 0 ...
PPVT-A FOAM M
EXTREMELY LOW SCORE
R.euha
, '~'" 'lb"'~~"2\)"~"~":15,~,~"tt~"~"~"*"~."~",~,, I '~' I gg
1- --I --.----- --..-- .----
MODI "ATELY LOW SCORE
4 5 8
LOW I HIGH AVERAGE SCORE
MODERATELY HIGH SCORE
EXTREMELY HIGH SCORE
Performance Evaluation---------ThiS .standardized lesl provides an estimate only of this Individual's hearing vocabulary in Slandard E"9ksh. as compared wrth a cross-sect'on 01 U.S'" persons 01 lhe same age. Do you believe "'" perfor~ance of thiS sub)8Ct represents fair1y her or his IN.e abi.lity In thiS area? . Yes No If nOl. cite reasons such as rappo" problems, poor testing SituatiOn, heanng or VISIOn loSS. VISUalperceptual d,sorder. test 100 easy or 100 hard (automallC basal or ce,""9 used). etc.
-_._-------Recommendations
Observations
I BneHy oescrtbe the subtOCfs lesl behavtOf', such as IntereSlln task. qUICkness 01 response, stgns of pernlverallOO. won. habolS. olc
- - - -- -_. --
-.---- ------------ --.----- _._-_.
l __________ ~ __ _ IE ...............
I-' o I-'

r""'"WW
r ---ill TEST ITEMS AND I FORM ~ ABBREVIATED INSTRUCnONS
Administering the TRAINING ITEMS For moat 1UbJ.ct1 under. 8: Use Plates A, e, and C. Administer as many training item series es necessary to secure three consecutive correct responses. For moat IUbjecta. 8 and over: Use Plates 0 and E. Administer as many fraining Item series as necessary to ,secure two consecutlve correct responses.
NTlAI. PtW:l1CE
ADDITIONAl. PRACTICE WOAOS. KIYS
:t::" =. KEYS ;:::x· ""~ ......... So_V _.l A doU(4) fork (I) table (2) car (3) e man (2) comb (3) sock (4) mouth (I)
C swinging (3) drinking (4) walking (1) climbing (2)
o wheel (4) zipper(2) rope (1) rake (3)
E gianl(l) bride (3) witch (4) royal(2)
(Comple,. Oi/ee,ions ./e given In Pall' 01 ,he Manual)
Administering the TEST ITEMS BaNI: Highest 8 consecutive correct responses CeIling: Lowest 8 consecutive responses containing 6 errors Starting Point: For a subject assumed 10 be of average ability, find Ihe person's age cirt:led in the margin, and begin the test with that item. Otherwise consult Part I of the Manual for further inslructions. ReconIlng Rnpon_ end Erronl: Record the subject's response (1,2,3, or4) tOf each ilem administered. For each error, draw an oblique line either through the plate number of the ~em missed, or through the geometric figure, as iIIuslrated below:
M envelope .... (2) ~n or 32 envelope .... (2)!!:..Jr Every eighth figure is identical to help determine the basal and ceiling.
NOTE: Agee in cifdes r.fer \0 Ihelowest age in 8 6- or 12-month Interval. For •• ample. Item 1 iathe Sl8I1ing item for 8geS 2-6 through 3-5, and lIem 30 for ages 5-0 through $-5. Use hem 1 10 lor ages 16-0 and over.
page ..
--- ... --•• 1
2 3 4
5 6 7 8
9
bus .........• (4) -- 0 hand ......... (1) __ 0 bed ....•...•. (3) __ 6. tractor ......•. (2) __ n closet ........ (1) __ ~
snake ........ (4) __ -tl boat. ......... (2) __ <> Iire ........... (3) -- 0 cow .......... (1) __ 0
--- ... --.10
11
12
13 14
.15 16
17 18 19
.20 21 22 23 24 25 26 27 28 29
.30 31 32 33
34
.35 36 37
38 39
.40 41
42 43
lamp •........ (4) __ 6. drum •..•...•. (3) __ n knee ••.•.•.•. (4) __ ~ helicopter •...• (2) __ -tl elbow ••••.••. (4) __ <> bandage ...•.. (4) __ 0 feather .•••.•. (l) __ 0 empty •.•.•••• (3) __ 6. fence •..••..•. (4) __ n accident .•..•. (2) __ ~
net. ......••.. (2) __ -tl tearing .••..•.. (4) __ <> sail .••..••... (1) -- 0 measuring ..... (2) __ 0 peeling ...•... (3) __ 6. cage •..•...•. (1) __ n tool ...••..... (4) __ ~
square ........ (4) __ -tl stretching ..... (1) __ <> arrow ..•...... (2) -- 0 tying •........ (2) __ 0 nest. ......... (1) __ 6. envelope ...... (2) __ n hook •...•.•.• (3) __ ~
pasting .••••.. (4) __ -tl patting ........ (1) __ <> penguin ....... (1) -- 0 sewing ....... (2) __ 0 delivering ..... (I) __ b. diving ........ (2) __ n parachute ..... (3) __ ~
furry ......... (4) __ -tl vegetable .•... (4) __ <> shoulder ...... (3) -- 0
--- lit., ~ &mw
44 dripping ....... (2) __ 0 45 claw ......... (4) __ 6. 46 decorated ..... (3) __ n 47 frame ........ (1) __ ~
48 forest. •....... (3) __ -tl 49
.50 51 52 53 54
.55 56 57 58 59 60 61
62 63
64
.65 66
67 68 69
.70 71
72
73
74 75 76
77
faucet ........ (2)
group ........ (3)
stem ......... (3)
<> o o
vase ......... (3) __ 6. pedaL ........ (1) __ n capsule ....... (2) __ ~
surprised ...... (4) __ -tl bark .......... (2) __ <> mechanic ..... (2) __ 0 tambourine .... (1) __ 0 disappointment. (4) __ 6. awarding ...... (3) __ n pitcher ........ (3) __ ~
reel .......... (1) __ -tl signal ........ (1) __ <> trunk ..•...... (2) -- 0 human ........ (2) __ 0 nostril ........ (1) __ 6. disagreement .. (I) __ n exhausted ..... (2) __ ~
vine .......... (4) __ -tl ceremony .•... (4) __ <> casserole ..... (2) -- 0 vehicle ....... (4) __ 0 globe ......... (3) __ 6. filing ......... (3) __ n clamp ........ (2) __ ~
reptile •..••... (2) __ -tl island ........ (1) __ <>
to-' o N

- - --- .... - ... - - ...._- - - .... _-78 spatula ....... (3) __ 0 112 husk ......... (1) __ 0 146 nautical ....... (3) __ -cr 79 cooperation .... ('Il) __ 0 113 utensil. ....... (2) __ 0 147 tangent ....... (1) __ 0
.80 scalp •........ (4) __ L:!. 114 citrus .•....... (3) __ 0 148 inclement ..... (4) __ 0 81 twig .........• (2) __ n 115 pedestrian ..... (2) __ L:!. 149 traj'!Ctory ...... (1) __ 0 82 weasel " ..... (2) __ IV 116 parallelogram .. (1) __ n 150 fettered ....... (1) __ t::. 83 demolishing ... (4) __ * 117 slumbering .... (3) __ IV 151 waif .......... (3) __ n 84 balcony ....•.. (1) __ 0 118 peninsula ..... (4) __ * 152 jubilant ....... (2) __ IV
.85 locket ........ (1) __ 0 119 upholstery ..... (2) __ 0 153 pilfering ....... (4) __ -tr 88 amazed ....... (3) __ 0 120 barricade ...... (4) __ 0 154 repose ........ (2) __ 0 87 tubular .....•.. (1) C::.. 121 Quartet ....... (4) __ 0 155 carrion ........ (3) __ 0 88 tusk .. , ...... , (1) __ n 122 tranquil, , , , , . ,(3) __ L:!. 156 indigent. ... , , ,(2) __ 0 89 bolt ' ..... , , , . (3) __ IV 123 abrasive, ..... (1) __ n 157 convex ....... (1) __ 6. .90 communication, (4) __ -tr 124 fatigued",.", (3) __ IV 158 emaciated ..... (2) __ n 91 carponter , . , . ,(2) __ 0 125 spherical .... , ,(2) __ * 159 divergence .... (4) __ IV 92 isola lion ..... , (1) __ 0 126 syringe . , ..... (2) __ 0 160 dromedary .... (2) __ -(:r
93 inllated ..... , . (3) __ 0 127 feline, ........ (2) __ 0 161 embellishing ... (2) __ 0
94 coast .. , ... , .. (3) __ L:!. 128 arid .......... (4) __ 0 162 entomologist ... (3) -- 0 I-' 0
.9S adJustable ..... (2) __ n 129 extenor . , ..... (1) __ L:!. 163 constrain ...... (1) __ 0 w
96 fragile, , .. , , , . (3) __ IV 130 constellation .. ,(4) __ n 164 infirm., ... ,.,. (1) 6. 97 assaulting .. , , . (1) ___ -cr 131 cornea, .... , .. (2) __ IV 165 anthropoid. , ... (3) n 98 appliance .. , .. (1) __ 0 132 mercantile ..... (1) __ -(:r 166 specter .. , .... (4) IV 99 pyramId .... , .. (4) ___ 0 133 ascendlng. , , .. (3) -- 0 167 incertJtude ..... (2) -(:r
.'00 blazing ... , . , ,(1) ___ 0 134 liltrallon, ...... (1) -- 0 168 VItreoUS ... , ... (1) 0 101 hoIsting. , . , .. , (I) 6. 135 consumll"g , ... (4) 0 169 obehsk ....... (1) -- 0 102 arch. . , ...... (4) n 136 cascade. '" ,(4) __ .6. 170 embossed ..... (4) 0 103 lc<:tunng . , . . ,(4) IV 131 P9rpoOOicular .. (3) __ n 171 ambulatlOn ' .. , (2) 6. 104 d,lap.dated .... (4) -(:r 138 ropieniShlng .. , (t) __ IV 172 calyx ... . (2) n
.,05 conlemplaltng .. (2) ___ 0 139 Oml$SlOn . .(3) __ -cr 173 O$.CulatlOn .... , (3) IV 100 can<stet. . . (t) 0 140 talon ... ' ... (3) -- 0 174 cupola . . .(4) __ tr 107 dlS.'Sec1lfl9 . (3) 0 tot, wrath .. .,(3) __ 0 175 hOmunculus . (") 0 100 link . (4) C::.. '''2 'ocande'Scent (4)_- 0 Calculating Raw Score 100 solemn (l) n 143 atrooJanl . (2) 6. ~item
eltO archery (2) \/ 1« confiding (3) n ~tIm:)t1I'
til IT ansp.lr@nl 13) ~ 145 rhombus (l) <:I Rawsoore ~ "Coo.rf-.._ ~_ ....,_ ..... """
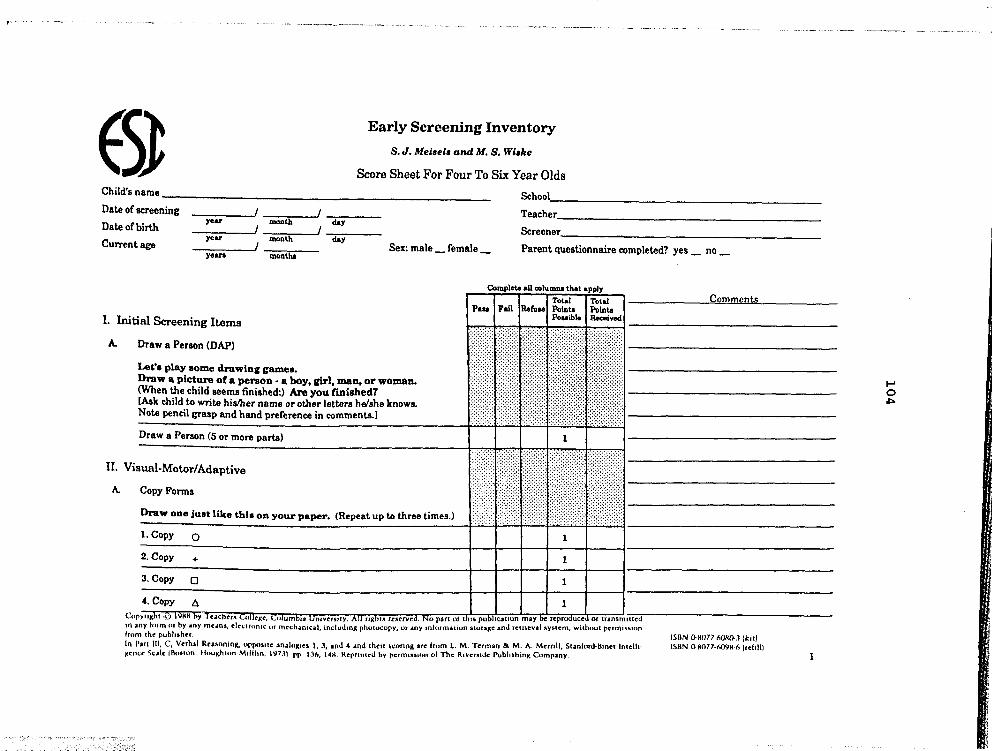
"
ESl Early Screening Inventory
S. J. Meisels and M. S. Wishe
Score Sheet For Four To Six Year Olds Child's name _________________________ _ School, _____________________________________ ___
year monlh day Teacher ________________________ _
year monlh SCreener, __________________________________________ _
Date of 8C1'eening
Date of birth
Current age yean montha
Parent questionnaire completed? yes _ no day
Sex: male __ female _
Draw a Penon (5 or more parts)
II. Visual-Motor/Adaptive
A. Copy Forms
Draw one just like this OD your paper. (Repeat up to three times.)
1. Copy 0
2. Copy +
3. Copy 0
4. Copy 6
Complete aU columna that apply
Total I Total Pall I Fail IReruMI Polate Polate
Po .. ible Received
1
1
1
1 uced or transmitted
Comments
ISBN (}H077-608(}.Ilkll/ ISBN (}K077-609M"n 1'01.11/
I-' o
""'

r~
B.
c.
2
< •• <----~~,,~-- - ----.
Visual Sequential Memory Complete aU column. that apply
P ... I Fall IReluoel Point. Point. Total -1-Tot81
Now we're fOinf to playa hidinc came with these pictures. rm ,oinl to hide this one to) here and this one (~) bere. (Lay down cards, from child's left. to right, as shown below.) Look at them carefully and remember where they are-thl. one here (pointing) and this one here (pointing). Now ru turn them over. Point to where this one is hiding. (Hold up cards, one at a time, as shown in instruction manual.) (lfsecond trials are needed:) Now let's try it a different way. (Repeat instructions.) [Put a cheek by eorreetly remembered figures.]
1. Chlld
-t 0 Examiner
2. Child o -t 0 Examiner
Block Building
C. te (screen)
(Repeat 0",,",. If """" ... ry)
or.ltfallo Child
-t 0 0 Examiner
~ ,att
::;:;:;:;:;::
::::::::::::
Now we're loinl to build with blocks. First, rm gain, to make a ,ate and when I finish I want to see if you can make one just like it. (Make gate behind screen. Remove screen.) Now you make one just like mine. (Give child 5 blocks.) <When child seems finished:) Is this just like the one I made?
Gate (screen)
or, i((ails--Gate (imitate)
Watch how I make this one. (Construct gate.) Now you make onejuBt like mine. (Give child 5 blocks.) <When child seems finished:) Ie that just like the one I made?
Gate (imitate)
Pouibl. Received
o
1
or 2
Comments
I-' o U1

II. C. Block BuildinJr (c:ontlnued)
n [_hI I
bud,o
or, iffail •• ·Bridge (sc:reen)
Now rmlQln. to make a brld.e. (Make bridge behind .creen.) Take. rood look at &hi. ODe. (Remove .creen.) Now you make ODe ju.t like mine. (Give child 3 blockl.) (When child Hems finished:) .. thi. Juat Uke the one I made?
Bridge (screen)
111. Language and Cognition
A. Number Concept
1. Counting
Count theae block.. Point to each ODe and count out loud ao that I CAn hear you. (Put 10 block. in random order on an 8 11'2" by 11" piece of paper.)
Compl_.U colu ...... tIuot .ppIy
Total I Total PIUS I Fail I ReftJ .. 1 Pointe Pointe
Pouiblo a-l*
lObIOCk:S _________________ --r_t--t_-r:-'_i or, if rails··s blocks
2. Allof:t!ther
How mallY are there altorether' (Ir child begins counting:)
See it you cu tell me~ ... ~~~~_DtlD'. ________ .. t----i 10 blocks or, if {ail •. ·S bloch
Comments
3
t-' o 0'1
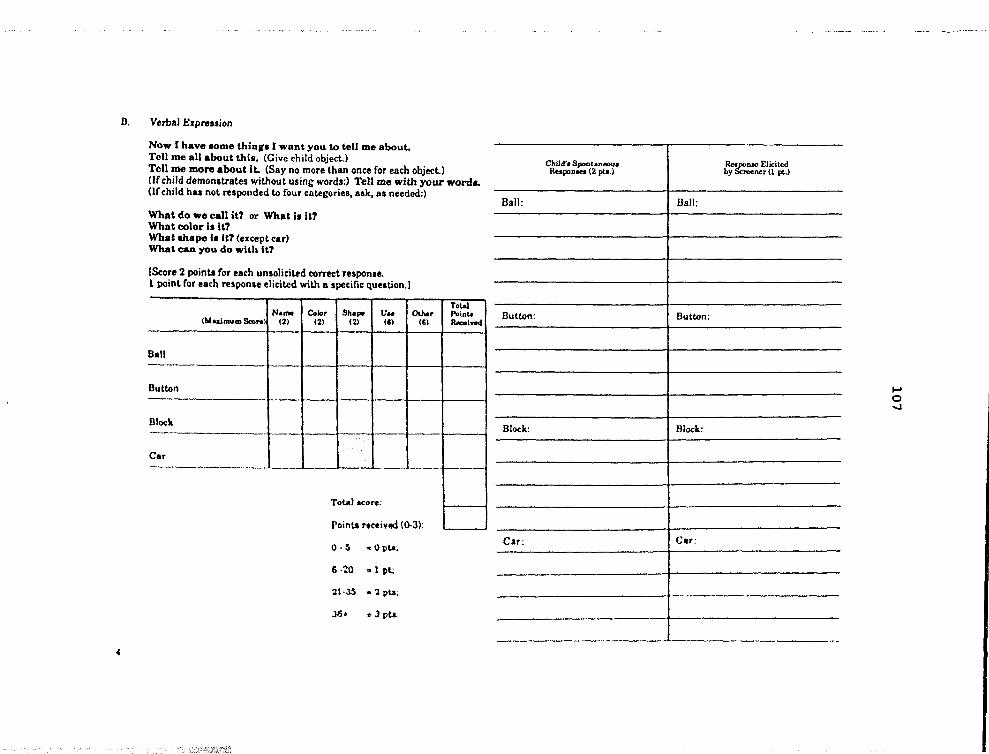
,
D. Verbal Expression
Now I have aome thiQ,' I want you to tell me about. Tell me aU about this. (Give child object.) Tell me more about it. (Say no more than once for each objecl) (If child demonstrates without using words:) Tell me with your word .. (If child haa no~ responded ~ four categories, ask, as needed:)
What do we call it? or What I. It? What color I. it? What Ibape i. Ie? (except ear) What can you do wiU. It?
[Store 2 point. for each unso!iciud correct respon.e. I point for each response eliciud with a specific question.J
N .... Color Sh.r- U .. (Mulmums.., .. (2) (2) (2) (6)
Ball -
8ut~n
Block
Car '----
TotalllCont,
OIlier (6)
Point. rtceived «}oJ):
0-5 .opu;
6·20 " 1 pt;
:l1.JS .. lpU;
J6- ,. J pu.
Total Poinu R.eived
Child', Spontaneou, ~Ipon_ (2 pll.)
Ball:
But~n:
Block:
Car:
Ball:
But~n:
Block:
Ca,:
I!esCrDac Elicited by reener (1 pl.)
~ o -..l

c. Verbal Reasoning
Now we are roinr to play lome talkin, flUDel. Listen carefully and finish what I want to say.
1. Brother il a boy; II.ter il a __ •
2. A hone i. biro amou.ell_.
3. A table II made of wood; a window ot ---'
4. Ablrdftlel; afilh __ •
D. Auditory Sequential Memory
fm fOln, to laY lOme numben. Llaten carefully and wben fm aU throuCh, laY them riCht after me. (Say the digiti one aecond apart.)
1. 9.:1 or, iffaill-2, 6
2.6,1,8 or, if (aila-~ 2, 8
3. 2. 7, ".9 or, if (aila--li, 9, 6,:1
lV. G
A.
ross Motor/Body Awareness
Balanee (2 of 3 au.empt.a, on eith.,. foot)
Now we're coin.: to play lOme .tandLn, up camea. I want to lee howton, you caD baUnce OD one toot like thl •• (Demonstrate.) See it ),,011 can do It whUe I cowu Co teD. (Count at one a..:ond inte ....... I • .) <Try • ..:ond (oot if unsuc~,,{ul with IinL)
101«ond.
or 5 a..:ond.
Complete aU c:olulIUlI that apply
Total Total Paaa Ft.iJ ReruM Point. Point.
Po .. ib1e Reeeivecl
1
1
1
1
2
..
Q2mm!lnt~
5
I-' o CO

B. Imitata Movements
Watch me carefuUy and make your IU'D1I do what mine do.
ttftt ttt1-Smooth: 2 or leIS corrected errors
or He.itant: more than 2 corrected error. and/or 2 or less uncorrected errors
or More than 2 uncorrected erron
C. flop
1 want to He you hop ftve time. on one foot like thl •• (Demonstrate. RepeaL for the other foot.. No more than three triala on each (oo!..l
Five limes on each (ooL
or, Twice on either fool
O. Skip
Let me _ you ,kip. (Demonstrate.) ---------- -----
Skjp; On both (HIt.
Complete aU columnl lhal apply
Total I Total Pointa Pointa Pollible Received
2
or 1
01' 0
2
~, Sk~~ On on~.~-=--___ . 101' •
TOTAL SCRF.F~'flNG SCORF.
g
CQIDments
~ o 1.0

Other Information: (No~ ICOred)
A. Color.matching problema: no __ yes __ Describe: ____________________________ _
(If child doesn't know the names of the colors, teat for color blindness.) B. Consonanterror8: _____________________________________________________________ _
Vowel errors: _______________________ ~ _______________________________________ __
Is speech intelligible? no __
only in context __
with articulation errors __ yes __
C. Uses complete sentences: yes __ no __
Uses incomplete sentences: yes ____ no __
U sea sentences with language errors: yes __ no __
ScreeningDeciaion: Refer __ ResCI'een __ OK __
ESI Cutoff Score. Age range Refer Re.creen 4·0 to 4·5 <11 11·15 4·6 to 4·11 <13 13·17 5·0 to 5·5 <16 16·20 5·6 to 5·11 <18 18·22
OK >15 >17 >20 >22
Conunen~: ________________________________________________________________________________________ _
7
~ ~ o

111
McCARTHY SCALES OF CHILDREN'S ABILITIES Record Form
NAME _____________________ -'AGL ___ SEL __ ~ __
HOME ADDRESS, ________________ . _. ___ .. ____ ... _ •. _".'
NAMES OF PARENTS OR GUAROIAN _____ _
SCHOOL ________________ _ __ .. __ . __ GRADL ... __ _
PLACE OF TESTING ___________________ TESTEO BY __ . _____ . __ ._ ..•
REFERRED BY' ____________________ ___
MSCA PROFILE Enter the e Sca'. Index •• on the appropriate lin •• below. Then c~'el. the ""I,k ,.pre· •• nting the In de. for .Ich Scali. Or ••• "~ connecflng the CU'"" •. NOf. ",,, rt'f valu.' for GC ar. dirt,,..nt fro", thoN for the other Sell ••.
SCALE INDEX
Pereeptuel- OUIIIII. Gener.t Vorbal Performance Iatlve Cognitive Memo,), Motor
lS0 -= :,>3$01
78 78 78 ~ 78 - 78
140 ~
70 ~""'70 ~""'70 ~····ijO .. ~(·2$01 70 -: ..... 70 -: - - - = - -
_ 120 ~
60 -: .... -60 = ... .ro..: ........ ~("SOI 60 -: .... ·60 -::
110~
so ...:.····so ..:. ... -50 ..: •••• 100 ~("''''' SO -:··· .. SO -:: - - - = - -
90 ;
..: •••••••• ::'.'SOI
80 ;
: : - 70 ~ 30 ..:. •. "30":' ..• ,JO ..: .... , •••• =(:501 - - - -
22 : 22 : 22
60~
:(.:501 50-
30 -::·····30
22: 22
--------,---
Year Month Oay
DaleTe$t~
Date ofBinh
Age
COMPOSITE RAW SCORES AND SCALE INDEXES
[ntl'tl\, tOf"'lpe"l, "_ ,«:0'" h~ llot. baU (C''''-' Obf.o, f~' ("()MDO.;'f ' .... teo,. 'or GC t-t .d<,r"'g v .. , .. 0 o.l.r~ll'\. ,,... ("0".'_'(''''''''9 $.tll. tf'l. ct. ••• ff()ft't T.tle " ft. •• p.;* '~1 0' ""I'\~,I to' dt1al l.d d'f.ct,O"')
Verbal (V)
Perceptual. Perlorm,",e (PI
Quantitative (0)
General COlin/five' ,lad C''''''P.t;;I,tt ' ... tcorn v .. p .. O
Memory (Mem)
Motor (Mot)
C~p.o"" A,. Sta'_ ka-,. ''''d4t1
Gel
LATERALITY it",.., ,"'!to'""r'O""I 'r~ lr~~.,j. '. $,¥tI't\~ • .., ~ P0g4 51 Hand _ . _~ ___ "' __ ".
Eye __ ._~ ___ , ___ _
C~f ~ rf1'Cl# '"1.,. r ... ',.-<"' ..... er e".,.,..""..
An rJptt~. MIl ~., t'n ~ ::-,...-:..';::::-:.::.:It-:.~:..~~~f::::;!,:::-~ ~=:';;::;: :'..--:.~.;.:::.::.:.=:..:' ~ "' ......... ,.,..,. ............ fa _;~."" f..-.. ,., ..... I.., .... "" t .... ' ......
Pri ..... f. U.S.A.
...,.,.., i.1t~. Aft .. " ... .....-..4 ..... ,.. • ...,.,. c.-.,.t ..... TM ls,<Ml0tlUI Cq(p«fr~Q't te.. 'I1AS .. ''M1l1
I

!
t
AGES START ...
AGU" IT ... RT ...
112
1. BLOCK BUILDING c.,contlnue _fit' failure on both tnals 01 2 conucut,v, It~I"I'I'
~::-r-;:-Tnall T'1111 Scor. (O·3)
1. Tower I (O·3)
I (O·3) I.CII
2. Chair (O·2) I (O·2) (O·2) 2. Cow
AGES 3. Building
(O·2) (()'2) (O·2) START .. 3. Curol
(O·3) (()'3) (O·3) 4. House
Tetll
...... -,~ ~ . ~.~ ~
TnI'
4. WORD KNOWLEDGE o..conhnu. If teor. Of' 'art I il ,.'s th." a. O.ICOnttnue P~rt U ."", .. ,onHcub .... 'All",., Oft ",.t p.rt.
PART I. PICTURE VOCA8vv.RY C.", "-soonN $<0 ..
1.Appleo TreeD House 0 Woman 0 Cow 0 10 I,
2. Clock 10 It
3. Sailboat 10 II
4. Flower (0-',
5. Purse "-11
...... -I
Total (Part 0
'----
S.Bear go"
6. Bird 120"
·"oflt.m • ...... etc"". Q(tI""t 'Ot QlI'ck f)t'rfor"'l."'" If, g ... '1't O"ly If ''''. ,",IIJ COff"/JI .. , •• 'ht' tl,JtllfI ".rl.crt,
• '1' .t' I~ M'
• •
XI"". , .. , flllQ\jl\d "." .eq .... ""
PART II. ORAL VOCA8UI.ARY o.lContlnve P.11I1.f't(or. (OI'IMe,,"'" flIt",.. I $<-, t1).~ Rt't.DO"M
--·~==--=~t= 1. Towel
2. Coat
3. Tool I ........... -
4. Thread -1-----. I
5. Factory I
6. Shrink r'-7. Expert ~
", ___ ~._ 4'~' ___ U~ ._._-4 '-- .~ "-
8. Month ~'---""~'~
... ,
9. Concert .. ----,-~--- -~.~,
10. Loyal .... x FOt~. 5. ,t." It t~ ,n(2,c.ltM t'~ ",,*,,,.,...,42 of ,." I, a't D"Hd 't~.'f"'-"'ttl _ '",,".IS 'Ot P"" I, ISH .. __ ,
'---
2

113
5. NUMBER QUESTIONS O'ICO",,"u, .ft.r 4 consecutl\lt fallur ...
Right $cO,. Answe' Respon •• Io.,)
1. Ears Two
2. Noses On.
3. Heads On.
4. Toys Thre.
8. TAPPING SEOVENCE ,,,,... d.-· ,..~tI\fO,.,., ,,,., j'-:;;~ ,1l~' ".~ ~:~
,01) ,on 1011 ~ t. 1·2·3·4
,~ .. ", .-"" .. ". '" "·"'''''·''~-l·--(Of\'I,"-... .~., , (O" •• 'vt v. t. I,,~, 0*' ",'''-, : , (0' I ----- ... ,.,. --"-2. , ·3·4
., .,,- ....• 5. Balloon5 r .. o
6. Candy $ ••
7. Pennies SeY.n
a.Apples Twely.
3. 2·4. , -1.--4. 4·1·2·3
f·_·_·-5. 2·3·'·4
....." .... _~_N 9. Crayons Si. 8. '.4·3·2·3
10. Ball Eight, --11. Secret Four
7. 4·2·3·'·2 .-- ~-".","-
12. Cookies Th, .. S. 1·2·4·3-2·,
-" .... -11
Total '---
T ....
, .... ~ X2=D 7, VERBAL MEMORY OtscotUlI'tue "," I ,ft., 3 eortH'cvhve ta.kI," U ,'h14 .. m •• ot
mar-. points (~t 01 30) on Plrt I. g;w P.rt II.
PART I. WORDS AHD SENTENCES Sc_
" toy- chair-light iOoT
2. doll- darll- coat (0·')
3. after· color - tunny -today (0-0'-
4, around - because· under - never (G-41
00 NOT Itres. the underhned _ordsln ,'~m' 5 an" 8 ---~." 5. The ~ said good·bye to his ~ every moming ~ he ~ 10 sc"ool.
~o.i;·
6, The 9!!! lied a e!!!!l pink ribbon on her doll before she went ~. (otl
.. ••. 3<
• I""...·."."' ....... ' 1",., tp.rt Jl )I( V, :'.
'---fft!t,F.'"
PART II. STORY Gn" P.rt II JI ctH!d tim.". Of ",ore pot,,!, (ou' C'~ 30) Of""" f A"tC'Ot'H
it<.,.. lO-'l
1. Term used for Bob ! ...........--, 2. Term used for the woman j
3. Term used tor the letters
4. Bob walking to slore -----------------j ..
5. Bob saw woman .:-~--!
6. Wind blew lette~ -------~.-----~".~ -'1 7. Bob shouted, 'Til gel them for you'" _._--------~ ~-~--'.~---~---"~--~"~'~ - ~ j
8. Bob was careful I . ~~---'-~,-.,- . ~~----~ : • I
9. Bob picked up lette~ --- ~--.---.-~-,.-- -- --~-- -,~- . j 10. Woman was /lappy
<. -.-- --,-- ---- -".-~-- _. -- ~.-. -. . ' 1 11. Woman thanked Bob ... -;-."
'"(1'.' fl'.-1 lr)
3
i
i

114
8. RIGHT·LEFT ORIENTATION Adm,n, ... , only I. 9. LEG COORDINATION 0'''0 ....... ..... ' .... , ~ b_ '-'1" 0' chIldren Iged 5 and above O,tcoofml\H' ."., '.,1,,,,. on 5 COt'lMC\ltlvl Iteml.
"em, '-$ ar. 'a,l.d
'9. Put your right hand on Roger's right shoulder.
-E"ter acor. lor lach ~rt .. par'tely. Both part. mu,. be 'AJled 'Of Total the item to M conlldered I fallute.
Scor. 10-1)
T ....
10. ARM COORDINATION GIW Pa" II evtn If PI'" I ft , .. led thKO"Itl~ 'a" " " ." 3 tn.', 0' ,,.", J, P." JJ •• r. fa,led GIY. Pa" III IV'" if P." II II fl'Ites
PART I. B ... ll BOUNCING Tnal' Tn", 1 .,.'" ",._4
Number of Bounc.n Se ... Number or 80'1ntt' Seoro Se ... 11-(~U) (~7) 10-15) I 10-7) IO-TJ
A l • '''0'11)
P ... RT" Be ... NB ... G C ... TCII G ...... E Give P." II h.n I' Part f is tai'~. Of ... continue Plrt II if aU 3 triaf, 01 i1.", , Ire flifed'.
se-Tnll 10-11
1. Both hands 1
2 , 2. Preferred hand 1 P,.,., ... 4 ......,
2 II l ,
3. Other hand 1
2 , ".IL='
ToIOI(pO'1I1)
'---
P"'~T III BEANB"'G TI<,Rc,n G~"'E Gtvt Pitt III hen if Part II fa 'III~-
Scoro Trill 1O-2l
1. Preferred hand I P",.",4 H_
2 II L S
2. Other hand 1
2
0 0 3 + ".1l.-12 " ... ' Pe<tll
Tot" (pOtt 'Il} - ..
...
tri61..,
rel1.
U 1 " .. . t" S .~ . H , 7 2 , , o 0
1.Crou'Ht
2. Fold hand,

115
T.,112
LATERALITY SUMMARY
HAND DOMINANCE
Test 10, Part I Ball bouncing R L B
Test 10, Part II, item 2 Beanbag catch R L I Test 10, Part III, item 1 Beanbag throw R L ] Tests 12 & 13, a\l ilems Drawing R L B 1
T01.11 R Il 1 B I
HAND DOMINANCE Check one: (See pages 148-14901 manual.)
o Dominance Establish~ (Right-Hand~) o Dominance Establis~ (Lelt-Handed) o Dominance Not Establish~ o Not Scorable
EYEUSEO IN SIGHTfNG (Test t1,item4) Cheek one: (See page 14901 manual.)
o Right OLen o Not Scorable
5

116
14. NUMERICAL MEMORY Ollcontlnut PI"I an., f.,I1",. 0" bot'" '''III, of .~, .~ .. '" " ttl,II' "If" , 0'1 "'0,. pot'"' flo'" .. ,," , .' .. p,n II and dlscontlnut .n.r flilyr, On ~otf, tn,fl of In, 1ft""
PAIIT I, FORWARD SERIES I TI'1111
kor. 10·7)
'ART U 'ACk'Vf."O ,{AIlS j -~;~ 1,.", ,-C _~ .. _T_'_,._, , ___ t .. ~ f::~ ...
1.1 5·8 4·9 1, 9·6 ! 4·' _._~~"' ,_-" ~_~.' __ "<r
2. 6·9· 2 5 . 8 . 3 2 1· e . 3 I 2 . ~ • a I 1----------1--------+--1 ~f_----.-.t_---'----' .•..•...•.... '.' . ... 3_,;..,.: _3_' _8 _. '_._4 ___ +_6_._'_._8_. 5 ____ 1-_~ f-3_, f_5_. 2_._4_. 9 __ ---'I>----~,~..:::._._ ... ~ _. __ 4; 4·1·6·9·2 9·4·1·8·3
5.j 5·2·9·6·'·4 8·5·2·9·4·6
6.18.6.3.5.2.9.' 5·3·8·2·'·9·6 ..... ·12
Tot.1 {Part I, L--..O
r .. t 14. P'" I
15. VERBAL FLUENCY Tim. I limit AKorlS R.,POl"l'" -Wtft),hl'ft
,. Things to eat 20" I E .... mpl.': l bre.d
potltOIl
..... 1~-tIl
2. Animals 20" 1-E.ampl •• : •• t ta.,
3. Things to wear 20"
! eumpl,: shoe,
.~.
4. Things to ride 20"
I Example: tw.
, ... 16 COUNTING AND SORTING " .",,~ p .... d
• g Of mort items 0,", rllt 5. g.ve Pyll cred'i on T .. I " 0ttI,,..,,! ... Idm,nl.t,r Tist " and d1SCQf'llln~ .1M" COtlMcut,ve

117
18. CONCEPTUAL GROUPING D,seontlnue ,ft", • consecutt~e faIlures.
11. OPPOSITE ANALOGIES SCOt.
Score 11).1)
1. Little, big ! {O"I
,. The sun is hot. and ice is 2. Red. yellow, blue {O-'I
2. I throw the ball up, and then it comes 3. Square, round {D-!I
Conrlflue onl)' II ctuld answerS at least one 01 .tems 1 and 2 cor- l>< fectly .• nd d15contmue after 3 c0l'15ecuti'lle failures on items 3-9.
RIO'" >' Number Number '.hnul RIght Wronq Wrong
/
3. An elephant is big, and a mouse is 4. Square blocks {0-61 10-6) (o_e) (0-2)
4. Running is fast, and walking is 5. Big yellow blocks 10-2) (O-lO) 10-2) (O·2)
5. Collon is solt. and rocks are 6. Big round red block 10·!1
6. A lemon is sour, and candy is 7. Small blue square 11).')
7. Feathers are light, and stones are a. Large blue square (1).1)
a. Syrup is thick, and water is _____ 9. Large yellow circle and small yellow square II).~
9. Sandpaper is rough, and glass is
Max. g
Total
'---
r"""-.1~
Total ii.\.· ~
X2=D Tesl11
NOTES:
1
!

118
CO,",'UT ATIO" 0' CO,",'OSIH ".'" KO"IS 1 E"I,r Ih, .... p""Cf ,,- leOt" *''h(.1'1 '" ,,. , ..... 1ft\.I1." bo .. , 0'" Ii'~':' cf""- -f(OI' to'l'I'; '01 •• (" •• 1 ...... ,""-
1((1.'" ," Ih, bQI(", be.tU"g 1~1t t.,t I I"lIoIft'lber ('Of "''''1'1, ''''' ICO" '0' , •• 1 , 11."'."4 .A , tH:-IIJ •••
2 Sum Itl. Icor •• In .IC" ct Ih' S (0.11 .. "'1"11 (I'It" I"" tot.1e ,,, ,"- C(YI'!OOI If ". '(fttt toe •••• ' ttl. to04 f'f'~ ..... 3 TrI"",r t"'- CO""~OJ'" II. ICOf" to t,... frO"' Co.'f IO~", '!'It' boo"I,t ."'4 'v,~ ,t 0 ___ ' '''' ," . .",.,. "OI'>l ..... hIt' • t ......
It, I'd. by .,d. I ["I'" th, ,cor •• ," ,h. COffIp¢a.I, F': •• $.<.()f" (OIUl9l"'''' , .... be_ 1.~\.4 (~"",.( .. 't. l1li,. $.(b~" r'l-e St,I, Ifld.u •..
(Fo, mOt' ".t.iI.d d"'C-holll Of\ tP'l, CQl'ftpJ.tlOt'l of 'fI, t,e.or", 'CHM.'" C""(ll" 1 (;A ""."'.' J
1. Block Building
2. Puzzl. Solving
3. Pictorial Memory
4. Word Know\edge.I+1I
5. Number Questions
6. T epping Sequenee
7. Verbal Memory. ,
.11
8. Right-Len Orientation (Ages 5 and over ONLy)
9. Leg Coordination
10. Arm Coordlnallon.I+11+1II
11. Imitative Action
12. Draw-A-Design
13. Draw-A-Child
14. Numerical Memory.'
.11
15. Verba' fluency
16. Counting and Sorting
17. Opposite Analogies
18. Coneeptual Grouping
COMPOSITE RAW SCORE
...... [IGHT[O RAW :'>CORI S
V p a
•
15
17
8
Met
t)
•

w
119
Name ______________ Examiner _____________ Date _______ _
McCARTHY SCALES OF CHILDREN'S ABILITIES
Drawing Booklet
TEST 12. DRAW-A-DESIGN
TEST 13. DRAW-A-CHILD
I\T(\ THE PSYCHOLOGIC .... L CORP<..iRATIOS W HARCOCRT BRACEJO\: .... ~O\'ICH. I!':C.
Copyright © 1972 1970 by The PsychologICal Corporation. All rights reserved'. No .part o~ this publicahon may be reproduced or tra~smitted in any form or by any means, electronic or mech~mcaJ. mchJomg PhotocO:~ ~:'O~d';o' or any information storage and retrieval system. WIthout permisSIon 10 writing from the publisher. rm In e
United States of America. n. Ps)'ChOIOQical Corporation 555 AcademiC Court San AnfontO, T ... s 18204

mn M
120
TEST 12 DRAW-A-DESIGN

121

5 3FT ·7m :; ., "'§P'fiiilF'
122
3
• -- 1 , "~7'r3" HiBaTUm
123
4.

; n! r " . "'TTS"ESf55i
124
5.

- ~- 1 :
125
6

77 'PS"! -gDP .. ? · t'''S
126
7_

1Z3$
127
8.

128

i - 5
17 }"70 ---F 'T "FET ZF -
129
TEST 13 DRAW"A-CHILO

130
APPENDIX B
PERMISSION TO COLLECT DATA
Q

131
MONT""' ... STATE UNlVERSlTY
CoUEGE OF NURStNG
UNlVERSm' HUMAH SUBJECI'S CoMMOTEE SUMMARY
Page 1 of 3 FORM B
Name of Proposal:. Developmental Assessment and Parental Expectation:, of Rative American Children
Name of Investigatorls: Jean N. Gullicks, Ph.D., R.N.: Joyce Hendricks. M.S,. R.N.,CPNP (Circle one: undergraduate studentls. graduate studentls~culty member7!D
Faculty Advisor (if student research):
Date of College of Nursing Review:
Reviewed by: (List College of Nursing reviewers involved by names and type of committee, e.g. J. Doe, Great Falls Extended Campus Committee)
Jo ... j3",..kJec \S~'':'"i'' ~"'S
I
Approved by: Campus H.S.R. Committee _~~~--L:~=~~ ___ -=::~...L/'::::~"L:.11u' __
Education Director ~ ~LJt.-J 5/e,¢/t:i(
Brief Description of Subjects (age, sex, health Status, etc.) (To Be Completed by the Investigatorls)
~at1v. American children betveen~tbe ages of tvo and six years. Child's caregiver vho accompanies them to preschool or vell-child clinic. Subjects vill be residing in Yellowstone County and understand Englisb. Health of the subjects will not be considered.as selection criteria.

132
(Description continued) the children will be given the McCarthy Scales anrt tni ESI. The caregivers in the third group will be given the Caldwell Home Inventory Parent Questionnaire and the Parent 'Expectations Inventory. The sublects will not be given all three instruments to minimize subj,ct fatigue and the halo effect.
Assessment of the children will be done in the vell-child clinic or preschool according to the standardized procedures for each instrument. Caregivers will cOlllJllete t..bs inattumenu ..in the cl..inic either verbally or in vritins dependinJ on their ability. If the caregiver is unable to complete the questionnaires at that.time, they v1l~ be mailed for completion.
Signed consent forms will be kept separate from the questionnaires in a locked file for a period of five years. Files are maintained in the College of Nursing. Researchers on this project will have access to the file.
T60 Tlf to ;bi- us~ . fn 'tltis study are in c1 rcu1 ation for wide use. Upon purchase of the tool~i permission was given by the individual companies. to use the tools for data collection. Manuals are included with each tool, specifying correct application for each instrument.

• r'g . E E 5;
133
Page 2 of 3 FORM B
Brief Descriplior. of Procedure (what is to be asked of or done 10 subjects) (To Be C:mpleted by the Investigatorls) "
Alter permission from the caregivers has been obtained, children and caregivers will be randomly assigned to one of three groups. In the first group, the cbilciien will be given the Peabody Picture Vocabulary Test and the McCarthy Scales. The caregivers in this group vill be given the Early Screening Inventory Parent Questionnaire and tbe Caldwell ~ome Inventory Parent Questionnaire. In the second group, the children will ,be given the PPVT and the .ESI •.. ·The caregivers in the second group will be given the ESI P~t Questionnaire arid the Parent 'Expectations Inventory •. In the ~hird group (over
OR
I X I E"(ern;t Under Federal Reg: 4S ~ 46 Jli" '10 ~ .' ( 'I'. J,f.O'i , _. _ . . 46.101 (2) (b) _____ ~ __
(Insert number and letter as appropriate)
o Quesr::nabJe or Ruled Not Exempt Under Federal Reg. 45 CFR 46
·Proposal sent to College of Nursing Dean for Review O~ ____________________________________ ___

•
Septesti:ler 24, 1 991
'10: stE;:heo Guggeoheim, Clair Human SUbjects Cormittee
134
FR: Jean N. Gullicks and Joyce Hendricks, COllege of Nursing; am loblly Malone, Graduate Student, COllege of Nursing
RE: DeYelq lIe.tal. Assess!!e It aOO Parental Expectat::ials of Native American Cri..ldreo
In regaro to the above project am in reply to yr:»r letter dated June 21, 1991, the following changes in px:ocedure and subjects will be ~: . ,. DescriPtion of subjects (page' of FOlJII B): In aO:iiticn to subjects residing in YellCMStale Co.mty, subjects resic:lin; in Big Eom camty will also be i!lcluded. All other factors pe..Tta.in:Ulg to subjects will remain the saIIe.
2. DescriPtion of procedure (page 2 of FaDn B) : Careg:i. vers living in Big Hom camty nay cx:mplete·thei.r questian:naires either verl:ally or in writing at· their h::IIe sinCe mst of the cbildren living in Big Hom· County are bussed to· presd¥:ol..O" caregivers will be c::ntacted by the researchers through 'the local piesdx:ol am asked for their o::.rlSent to . p3rt.icipate in the study. '!be·researcher will. then visit their bema where the questicnnaires will be adIIinistered. Children with signed consents fran their caregivers·will be tested at the preschool. 3. The names of the children and· their caregi. vers will. not be used en the tools. Each· will be assigned' a o:xle D1li!tler. 'lbe ident:ifyin;j o::de will be maintained in a loc:lced file at ~ COllege of Nursing_
...
Respectfully sutmi tted,
~11,~ Jean.-N_. QllJ.ic:ks, Ph.D., R.N •.
~.~~) Joyce Be!rlricks, M.S., R.N., c:mP

-
I
~ n Montana State University ~ Bozeman, Montana 59717
Office of the Vice President for Research
October 8, 1991
135
TO: Jean N. Gullicks and Joyce Hendricks College of Nursing
FR: Stephen Guggenheim, Chair ~ Human Subjects Committee ~
7 bwm' 'F aps
Research and Development (406) 994-2891 Grants and Contracts (406) 994-2381
RE: DEVELOPMENTAL ASSESSMENT AND PARENTAL EXPECTATIONS OF NA TIVE AMERICAN CHILDREN
The above project/proposal was reviewed by the MSU Human Subjects Committee (HSC) on June 20, 1991, and approved as submitted.
When the project/proposal is activated, please remember that you should give copies of the consent forms to the subjects as well as keeping a copy in your records. You should also report any injuries or other adverse effects that occur during these studies to the HSC. If the procedures described in the application form or consent form are changed, these changes should be reported to the HSC.
If the HSC can be of further assistance or provide additional information, please feel free to contact us.
dj

I MONT~A STATE UNIVERSITY
1893eCENTENNIALe l993
February 12, 1992
TO: College of Nursing Human Subjects Review
136
FROM: Jean N. Gullicks, Ph.D., R.N.~
CoUeg,- of Nursing
Billings campus EMC Campus Box 574 Billings. Montana 59101
Thlephone 406-657-2912 FAX 406-657-1715
Molly Malone has permission to use selected data from the research study on the use of developmental screening tests with Native American children and their primary caregivers for the purpose of secondary analysis. She will be examining accuracy of three developmental tests in detecting delays in this population of children.
At the end of the study, and after a period of time adequate for her to publish the results, the data will be properly disposed. A year is a customary time frame for such efforts. Since I will be second author on the student's publication, the data are protected.
Please be aware that this study is funded by a College of Nursing Block Grant. That project has approval from Montana State University Human Subjects Committee. Secondary analyses are exempt as long as no identifiers are present, as in the case of Ms. Malone's research.
Mowrt411fS and Minds • Tfte Second CentllT!l

fO
I MONTANA STATE
UNIVERSITY 189:1-CENTENNIAL-199)
Date: April 3, 1992
To: Human Subjects Committee
2
137
.... " ", .. ,.., ..,
CoUege of Nursing
Billings Campus EMC Campus Box 574 Billings. Montana ;9101
"Telephone 406-<l57·29 1 2 FAX 406-657·1715
Regarding: The proposal entitled: "The Use of Selected Developmental Screening Tests with NA children and their Primary Caregivers.R Submitted by Maureen Malone, Jean Gullicks, and Joyce Hendricks.
Proposed Change: The caregivers instruments will be changed from the Early Screening Inve'ntory Parent Questionnaire (Meisels et aJ. 1984), the Caldwell Home Inventory Parent Questionnaire (Bradley & Caldwell, 1979), and the Parent Expectations Inventory (GuIlicks, 1989) to:
1. The Caldwell Home Inventory Parent Questionnaire (Bradley & Caldwell. 1979) 2 The Denver Prescreening Developmental Questionnaire Revised (Frankenburg,
Van Doornick, & LiddeJI, 1986).
Both questionnaires will be administered to all caregivers. The time allotted will be 45 minutes. There will be no change in the administration of the tooL
Mount4ins and Minds • The Second Cnttury

I MONTANA STATE
UNIVERSITY 1893·CENTENNIAL-1993
May 28,1992
TO: Maureen Malone Graduate Student
138
FR: Julie Johnson 9~ ~ Associate Dean
RE: Human Subjects Approval of Your Project
7
CoUege of Nurslng
Sherrick Hall Bozeman. MT 59717·0356
1elephone 406-994·3783 FAX 406-994-6020
"J' [5 Tn.
I am pleased to inform you that the Montana State University College of Nursing's Human Subjects Review Committee has approved the changes for your proposal, "lbe Use of Selected Developmental Screening Tests with NA Children and Their Primary Caregivers." These changes, as well as your proposal, were ruled exempt because they involve survey procedures and subjects cannot be identified. You may begin data collection at your convenience.
Best wishes for success with your research. Please contact me if you have questions or if I can be of further assistance.
JEl/ko
cc: Jean Gullicks. Chair
Mountains and Minds - The Second Century
Vb

f . t'T
139
CROW TRIBAL COUNCIL
Crow Country
Dr. Kathy Long, Dean Montana State University School of Nursing Bozeman, Montana
Dear Or. Long:
P.O. Box 159 Crow Agency, MT 59022
(406) 638·2601
Clara Nome~, Madame Chairman Joseph Pickett, Vice-Chairman Blaine Small, Secretary Sylvester Goes Ahead, Vice-Secretary September ~3, 19q1
Molly Malone is employed as a Public Health Nurse at the Crow Indian Health Service Hospital on the Crow Indian Reservstion since 1978. Molly is also attending Montana State University in order to obtain a Masters Degree In Nursing.
Molly would like to request interview sessions with Crow Indian children ages two to six and their parents or primary caregivers. During these sessions the children will be given two nationslly stsndardized developmental tests and their parents or caregivers will be asked to fill out a questinna,ire to determine their expectations about their child's developmental abilities and behavior. These interview sessions will be part of Nolly' B educational requirements and will be developed into a final thesis project for future reference at Montana Stste University. The information obtained from these sessions will help determine whether these tests and questionnaires can be used by educators snd health care providers to accurately assess developmental delays or risk factors for delays in Crow Indian children.
The Crow Tribe has agreed to the requested interview sessions by Molly Malone. Molly has the understanding that all human rights will be protecterl. The Health Services Division of the Crow Indian Tribe will receive finalized copies of the thesis project.
Clsra Nomee Madsme Chairperson

· ......... :& ( J/{.~ -' .. ::-l
Date
From
Subject
To
140
OEPART.\\ENT OF HEALTH &. HUMAN SERVICES
PlIBLIC HEALD! SERVICE - INDIAN lJEALnI SERVICE
• Septelllber 23, 1991
Service Unit Director Crow Service Unit
Research/Developmental Assessement
To Whom It May Concern:
Memorandum Refer to: PHN
This memo is to document that PHS Indian Hospital of Crow Agency, Montana has been informed of the research entitled Developmental Assessment and Parental Expectations of Native American Children that Molly Malone, PHN will be conducting as part of her Master of Nursing Prograa at Montana State University. Crow Hospital has no objections to this research being conducted and is satisfied that all human rights are being protected.
~ IftAl'/ Ten~~;Zney Service Unit Director

141
HEAD START PROGRAM P.O. Box 249
Dr. Kalhy Long Dean, School of Nursing Montana·State University Bozeman, MT
Dear Doctor Long:
Crow Tribe
Crow Agency, Montana 59022 'J:' (406) 638-2697
September 30, 1991
Thjs letter js to document that Project Head Start of Crow
Agency, Hontana, has been informed of the research entitled Developmental
Assessment and Pa~elllal expectations of Native American Children that
Molly Malone will be conducting as part of her Masters of Nursing Program
at Monlana State University. Project Head Start has no ohjections to this
researclt being conducted at their premises and is satisfied that all
human rjghts are being conducted.
Sincerely,
Nora A. Bird Director
"Building a better tomorrow for our children. "

I MONTANA STATE
UNIVERSITY
142
Jean Gullicks, PhD, RN Montana State University
College of Nursing 657-2912
Joyce Hendricks, MS, RN, CPNP Montana State University
College of Nursing 657-2912
Molly Malone, RN Graduate Student
Montana State University College of Nursing
638-2626
College of Nursing
Billings Campus EMC Campus Box 574 Billings. Montana 59101
1elephone 406-657-2912 FAX 406-657-1715
I am being invited to answer questions for a research study. The questions will be about the child that I am caring for today. I will read the questions and answer them on paper or if I prefer, the questions will be read to me and I will answer them out loud. It will take about 45 minutes to answer all the questions.
The child that I am caring for will be checked with two tests (that are like games) to see how well he or she is growing and developing. If the child does not want to play, the testing will end.
I understand that I am free to withdraw my consent to be in the study at any time without affecting my care. Refusing to be in the study will not affect me in any way. If I do not take part in or if I withdraw from the study, I will continue to receive care. I understand that there are no risks to me or to the child. A benefit is that I will be told the results of the child's testing.
My name and the child's name will not be used in any w~y in thi5 ~tudy. Each adult and each child will be given a number identification instead of using names. The information from the study may be reported as research. Any reported material will not identify me by name.
Questions and concerns about the study will be answered by the nurses listed above. This letter is for me to keep.
J~t~cks~~
Molly Malone,
Mount~dns and Minds • The Second CentllT!l

I MONTANA STATE
UNIVERSITY .193·CENTENMALe l993
Participant's Statement
143
College of Nursing
Billings Campus EMC Campus Box 574 Billings Montana 59101
Telephone 406-651·2912 FAX 406-651·1715
The study has been explained to me. I understand it and I give my permission to be in the study. I also give my permission to let the child that I am caring for be in the study. I have had the chance to ask questions. I understand that other questions that I may have will be answered by the nurses listed above.
Participant's Signature
Researcher or Assistant
Mountains and Minds • The Second Century

144
APPENDIX C
DISTRIBUTION OF HEAD START SCORES

145
12~----------------------------·--------------------,
10
Standard score equiv. Peabody
SId. De" = 11.84 Mean = 77.4 N = 4UJO
Figure 2. Frequency Distribution of Head start PPVT-R Scores.

146
10,---·---------------------------------------------
8
G
4
2
o
Verbal scale index
SId. Dev '" 10.40 Mean = 51.5 N "'40.00
Figure 3. Frequency Distribution of Head start Verbal Scale Scores (MSCA).

------------_.
147
12,,---------------------------------------------------,
PeH;~rlllnl scale index
SId, l>pv - ~ 70 MAnit '" [,4 II N :=- "U.()O
Figure 4. Frequency Distribution of Head start Perceptual Scale Scores (MSCA).

148
14 -.-----. --.. -.----------.---------.----... ---.-- _ .. -.--
a
6
4
2
o
Quantitative scale index
Sid. Dev == 10.64 Mean = 61.3 N "40.00
Figure 5. Frequency Distribution of Head start Quantitative Scale Scores (MSCA).

a ------ ---------
96.0 06.0 106.0
General cognitive scale index
149
---------- --- - ._---
116.0 126.0 136.0
SId. Dev '" 15.11 Mean "109.0 N -40.00
Figure 6. Frequency Distribution of Head start General Cognitive Scale Scores (MSCA).

150
10 --. --.. ------------
4
z
o
Memory Scale Index
Figure 7. Frequency Distribution of Head start Memory Scale Scores (MSCA).
..

151
10
Motor scale index
SId. Dev : 6.90 Mean:59.5 N =39.00
Figure 8. Frequency Distribution of Head start Motor Scale Scores (MSCA).