Embed Size (px)
Citation preview
The Use of the Indentation Test for Studying the
Solidification Behaviour of Different Semicrystalline
Polymers during Injection Molding
Vincenzo La Carrubba,*1 Wouter Gabrielse,2 Stefano Piccarolo1
1DICPM, University of Palermo, Viale delle Scienze, 90128, Palermo, ItalyE-mail: [email protected]
2DSM Engineering plastics, P.O. Box 18, 6160 MD, Geleen, The Netherlands
Received: June 15, 2005; Revised: August 4, 2005; Accepted: August 29, 2005; DOI: 10.1002/mame.200500216
Keywords: injection molding; processing; semicrystalline polymers; thermoplastics
Introduction
The injection molding process of thermoplastic polymers
mainly consists of four stages: filling (the material is injec-
ted into the cavity), packing/holding (additional molten
material is forced into the cavity to compensate for
shrinkage), cooling (part solidifies) and ejection. Generally
speaking, from a technological viewpoint an optimisation
of the injectionmolding process should focus mainly on the
reduction of the cooling time, which is the longest part of
the total injection molding cycle time; this is particularly
true for molded parts in industrial processes, normally
characterized by relatively large shot volumes and thick
walls. Figure 1 shows a schematic representation of the
typical times each stage contributes to in the injectionmold-
ing of crystallizing polymers. Although the cooling process
starts already when the polymer melt gets in contact with
the cold wall, i.e. during the injection stage, the conven-
tional definition of the ‘‘cooling stage’’ is based on the time
when gate freeze-off takes place.[1] On the other hand, the
large number of factors affecting simultaneously final
morphology and properties makes very complex the under-
standing of the global phenomenology occurring during the
various stages of the process. With this respect, the possi-
bility to use innovative in-line and on-line techniques to
monitor solidification/crystallization phenomena during
real processing operations turns out to be the key point for
a deeper insight into the investigation of structure
development.
Several interesting methods for online monitoring the
solidification process have been proposed and implemented
so far, either in real processing equipment (such as injection
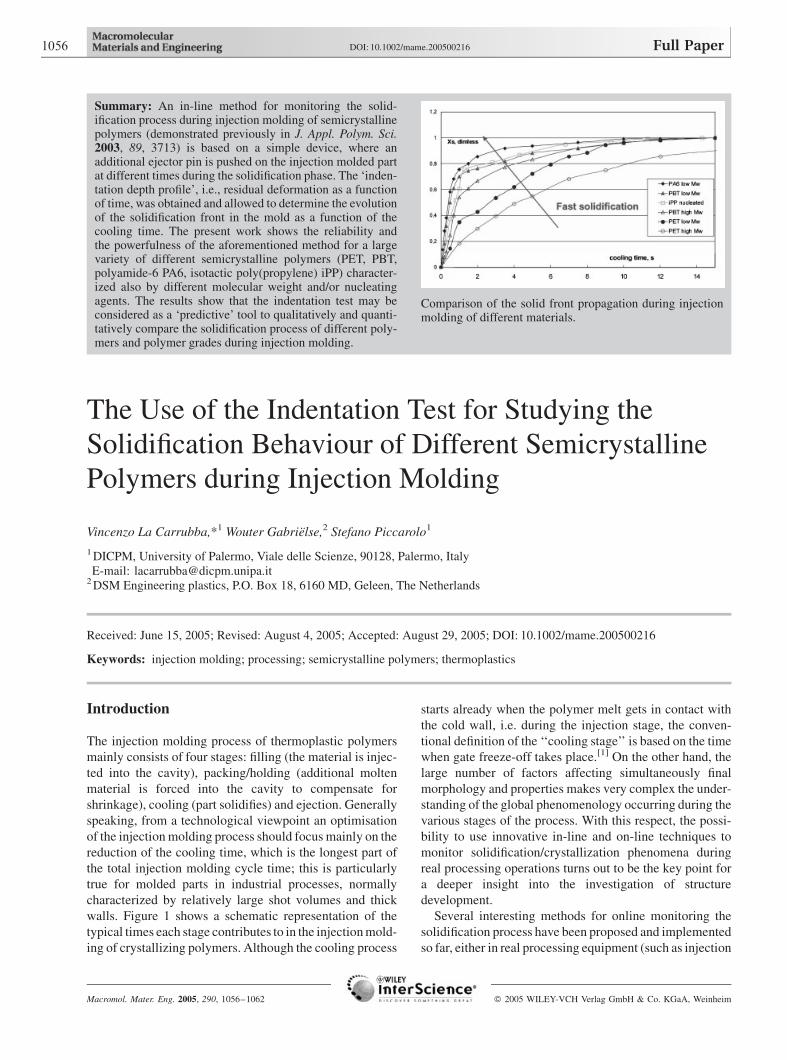
Summary: An in-line method for monitoring the solid-ification process during injection molding of semicrystallinepolymers (demonstrated previously in J. Appl. Polym. Sci.2003, 89, 3713) is based on a simple device, where anadditional ejector pin is pushed on the injection molded partat different times during the solidification phase. The ‘inden-tation depth profile’, i.e., residual deformation as a functionof time, was obtained and allowed to determine the evolutionof the solidification front in the mold as a function of thecooling time. The present work shows the reliability andthe powerfulness of the aforementioned method for a largevariety of different semicrystalline polymers (PET, PBT,polyamide-6 PA6, isotactic poly(propylene) iPP) character-ized also by different molecular weight and/or nucleatingagents. The results show that the indentation test may beconsidered as a ‘predictive’ tool to qualitatively and quanti-tatively compare the solidification process of different poly-mers and polymer grades during injection molding.
Comparison of the solid front propagation during injectionmolding of different materials.
Macromol. Mater. Eng. 2005, 290, 1056–1062 � 2005 WILEY-VCH Verlag GmbH & Co. KGaA, Weinheim
1056 DOI: 10.1002/mame.200500216 Full Paper
molding machine), or in model experiments aiming to
emulate processing conditions. As far as the latter experi-
ments are concerned, it is worth mentioning the use of
depolarised light intensity during fast quenching of thin
polymeric films, as proposed by Ding and Spruiell[2] and,
more recently improved by Titomanlio et al.[3]
Going to the on-line systems implemented in industrial
processes, a method based on an optical sensor measuring
reflected light intensity in a transparent injection mold
has been proposed by Thomas and Bur.[4] Moreover, an
ultrasonic monitoring of solidification behaviour of semi-
crystalline polymers was implemented to describe their
Pressure-Volume-Temperature (PVT) behaviour under
static conditions, as proposed by Kim et al.[5] and under
typical injection molding conditions by Smith et al.[6]
Another potentially promising technique to detect struc-
tural changes occurring during crystallization is dielectric
spectroscopy, recently implemented in injection molding
by Guillet et al.[7]
In a previous paper the present authors reported a new in-
line technique – the so-called ‘indentation test’ – to
monitor the solidification process during the cooling phase
of injection molding.[8] The method is based on a simple
device, where an additional ejector pin is pushed on the in-
jection molded part at different times during the solid-
ification phase, while the mold remains closed and the gate
is already frozen in. By performing the indentation at
different times during the cooling phase, an indentation
depth profile, i.e. residual deformation as a function of time,
can be obtained which gives information about the solid-
ification process. The ease of operation, the large applic-
ability to different classes of semicrystalline polymers
(polyesters, polyamides, polyolefins) and the simplicity of
the interpretation, make the method very useful for a gene-
ral understanding of the ‘‘moldability’’ of a given material
in terms of process cycle time and final properties of the
molded part.
The method was demonstrated on a relatively slow
crystallizing polymer [poly(ethylene terephthalate), PET],
varying in molecular weight, a relatively fast crystallizing
polymer [poly(butylene terephthalate), PBT] and a glass
fibre reinforced PET grade (with 30% glass fibres). A simp-
lified two-phasemodelwas proposed to interpret the experi-
mental data where the disappearance of the liquid phase is
mainly attributed to transient heat conduction through the
thickness of the mold. Based on this model, the propagation
rate of the solidification front was derived from the
indentation depth profiles and experimental data were
compared with predicted data based on a simple heat
transfer model.[8,9]
Whereas in the previous paper the reliability of the
indentation test was demonstrated by applying this method
to some ‘‘test polymers’’ (with this respect PET, being
slowly crystallizing, was the best candidate to highlight the
usefulness of the technique), in this work a more extensive
comparative investigation on different materials and
material grades is reported (PET, PBT, polyamide-6 PA6,
isotactic poly(propylene) iPP), in order to show how the
method can be technologically applied to study the solidi-
fication behaviour during processing, which, in its turn, is
partly responsible for the typical cooling times of injection
molding.
We highlight the applicability to a vast class of semi-
crystalline polymers (polyesters, polyamides, polyolefins),
whose solidification behaviour under processing conditions
can be effectively accounted for. The method accounts and
distinguishes not only polymers crystallizing at very diffe-
rent rates, also fast crystallizing ones, more common in the
molding industry, can be discriminated.
Experimental Part
Materials
Two PET samples, two PBT samples, two PA6 samples andtwo iPP samples were used to illustrate the applicability of themethod. The main material characteristics are reported inTable 1.
Test Method
Details concerning the method are reported in theprevious paper.[8] The method was implemented on a standard
Figure 1. Schematic representation of the injection moldingcycle time.
Table 1. Main characteristics of the materials studied in thiswork.
Zrel Mn
PET lowMw 1.6a) 19 000PET highMw 2a) 33 600PBT lowMw 1.93a) 18 500PBT lowMw 2.4a) 32 000PA6 lowMw 2.2b) 12 000PA6 highMw 3.2b) 25 000iPP – 52 000
a) Relative viscosity measured in 1% m-cresol.b) Relative viscosity measured in formic acid.
The Use of the Indentation Test for Studying the Solidification Behaviour of Different Semicrystalline Polymers . . . 1057
Macromol. Mater. Eng. 2005, 290, 1056–1062 www.mme-journal.de � 2005 WILEY-VCH Verlag GmbH & Co. KGaA, Weinheim
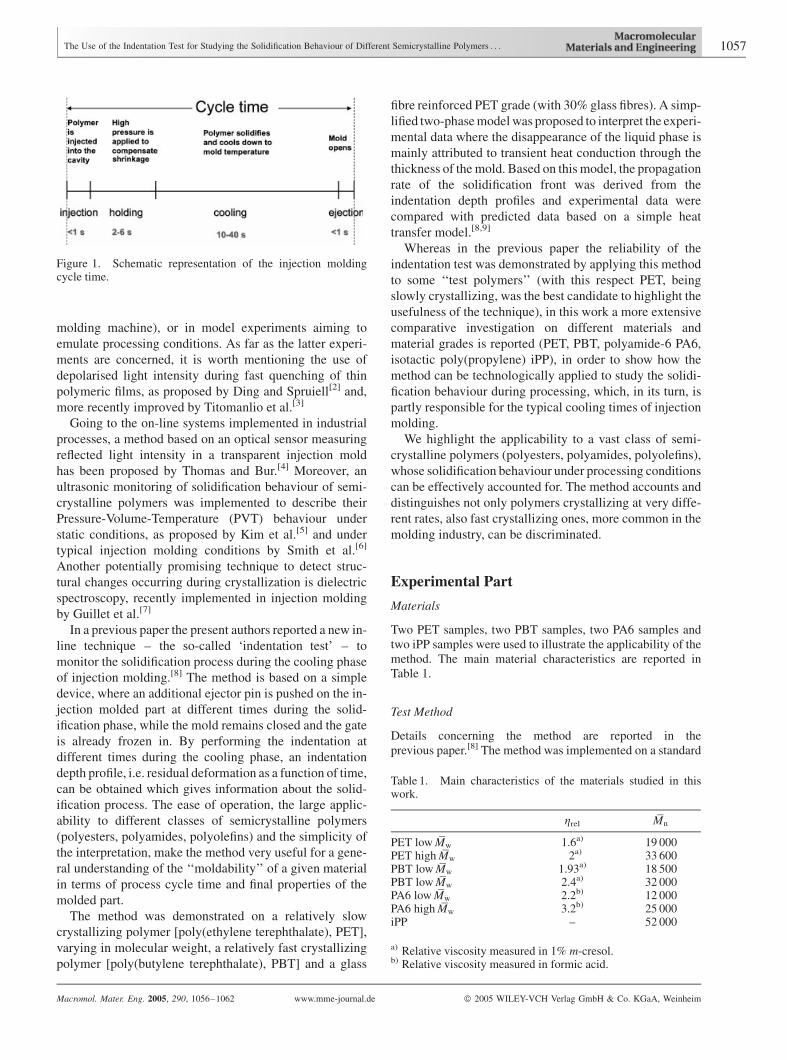
multipurpose injection molding machine with typical operat-ing conditions (see Table 2). A two-cavity mold was adopted,each cavity being of rectangular shape, as shown in Figure 2,reporting cavity length and width. Cavity thickness was1.6 mm. In one of the two cavities, 12 mm apart from thecavity edge, opposite to the gate, a pressure sensor was instal-led, which allowed the pressure trace in the cavity to berecorded during the process (see Figure 2).
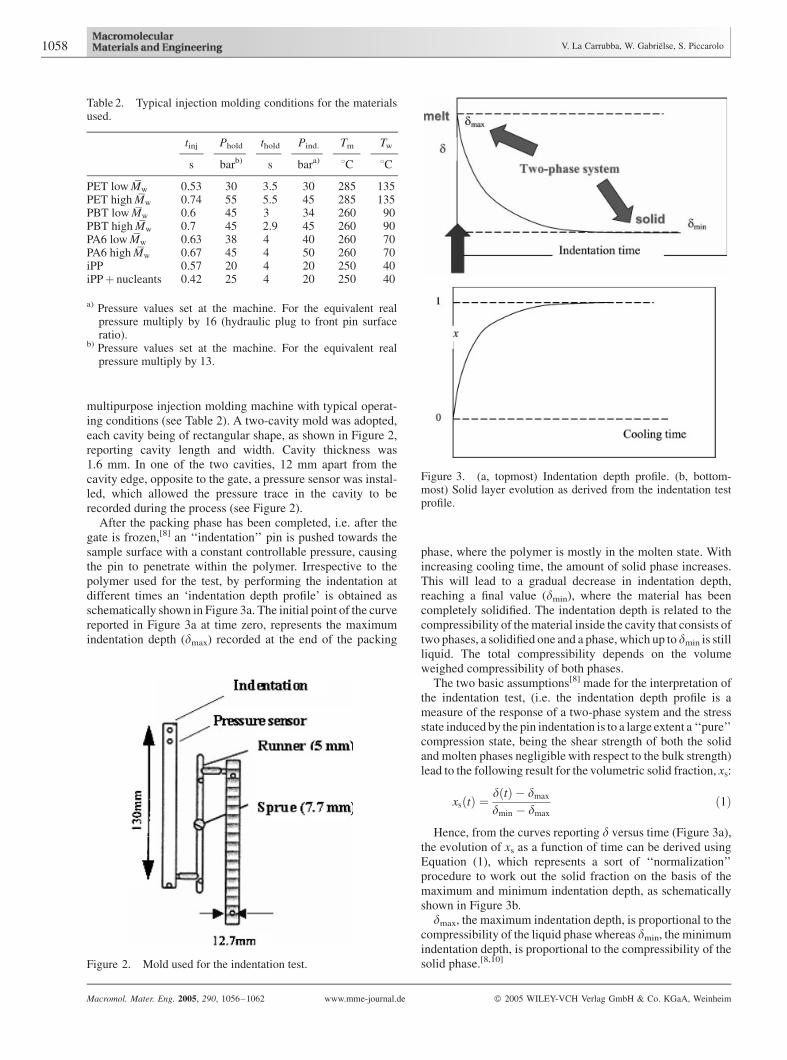
After the packing phase has been completed, i.e. after thegate is frozen,[8] an ‘‘indentation’’ pin is pushed towards thesample surface with a constant controllable pressure, causingthe pin to penetrate within the polymer. Irrespective to thepolymer used for the test, by performing the indentation atdifferent times an ‘indentation depth profile’ is obtained asschematically shown in Figure 3a. The initial point of the curvereported in Figure 3a at time zero, represents the maximumindentation depth (dmax) recorded at the end of the packing
phase, where the polymer is mostly in the molten state. Withincreasing cooling time, the amount of solid phase increases.This will lead to a gradual decrease in indentation depth,reaching a final value (dmin), where the material has beencompletely solidified. The indentation depth is related to thecompressibility of thematerial inside the cavity that consists oftwo phases, a solidified one and a phase, which up to dmin is stillliquid. The total compressibility depends on the volumeweighed compressibility of both phases.
The two basic assumptions[8] made for the interpretation ofthe indentation test, (i.e. the indentation depth profile is ameasure of the response of a two-phase system and the stressstate induced by the pin indentation is to a large extent a ‘‘pure’’compression state, being the shear strength of both the solidand molten phases negligible with respect to the bulk strength)lead to the following result for the volumetric solid fraction, xs:
xsðtÞ ¼dðtÞ � dmax
dmin � dmax
ð1Þ
Hence, from the curves reporting d versus time (Figure 3a),the evolution of xs as a function of time can be derived usingEquation (1), which represents a sort of ‘‘normalization’’procedure to work out the solid fraction on the basis of themaximum and minimum indentation depth, as schematicallyshown in Figure 3b.
dmax, the maximum indentation depth, is proportional to thecompressibility of the liquid phasewhereas dmin, the minimumindentation depth, is proportional to the compressibility of thesolid phase.[8,10]
Table 2. Typical injection molding conditions for the materialsused.
tinj Phold thold Pind. Tm Tw
s barb) s bara) 8C 8C
PET lowMw 0.53 30 3.5 30 285 135PET highMw 0.74 55 5.5 45 285 135PBT lowMw 0.6 45 3 34 260 90PBT highMw 0.7 45 2.9 45 260 90PA6 lowMw 0.63 38 4 40 260 70PA6 highMw 0.67 45 4 50 260 70iPP 0.57 20 4 20 250 40iPPþ nucleants 0.42 25 4 20 250 40
a) Pressure values set at the machine. For the equivalent realpressure multiply by 16 (hydraulic plug to front pin surfaceratio).
b) Pressure values set at the machine. For the equivalent realpressure multiply by 13.
Figure 2. Mold used for the indentation test.
Figure 3. (a, topmost) Indentation depth profile. (b, bottom-most) Solid layer evolution as derived from the indentation testprofile.
1058 V. La Carrubba, W. Gabrielse, S. Piccarolo
Macromol. Mater. Eng. 2005, 290, 1056–1062 www.mme-journal.de � 2005 WILEY-VCH Verlag GmbH & Co. KGaA, Weinheim
Results and Discussion
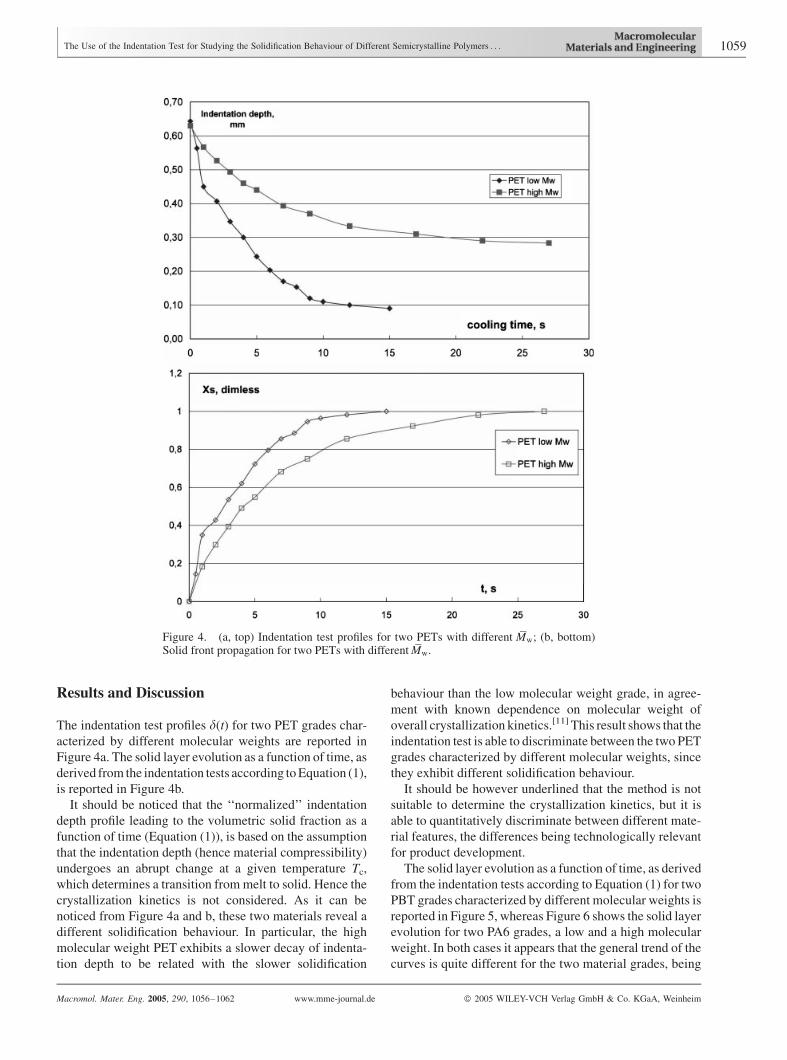
The indentation test profiles d(t) for two PET grades char-
acterized by different molecular weights are reported in
Figure 4a. The solid layer evolution as a function of time, as
derived from the indentation tests according toEquation (1),
is reported in Figure 4b.
It should be noticed that the ‘‘normalized’’ indentation
depth profile leading to the volumetric solid fraction as a
function of time (Equation (1)), is based on the assumption
that the indentation depth (hence material compressibility)
undergoes an abrupt change at a given temperature Tc,
which determines a transition frommelt to solid. Hence the
crystallization kinetics is not considered. As it can be
noticed from Figure 4a and b, these two materials reveal a
different solidification behaviour. In particular, the high
molecular weight PET exhibits a slower decay of indenta-
tion depth to be related with the slower solidification
behaviour than the low molecular weight grade, in agree-
ment with known dependence on molecular weight of
overall crystallization kinetics.[11] This result shows that the
indentation test is able to discriminate between the two PET
grades characterized by different molecular weights, since
they exhibit different solidification behaviour.
It should be however underlined that the method is not
suitable to determine the crystallization kinetics, but it is
able to quantitatively discriminate between different mate-
rial features, the differences being technologically relevant
for product development.
The solid layer evolution as a function of time, as derived
from the indentation tests according to Equation (1) for two
PBT grades characterized by different molecular weights is
reported in Figure 5, whereas Figure 6 shows the solid layer
evolution for two PA6 grades, a low and a high molecular
weight. In both cases it appears that the general trend of the
curves is quite different for the two material grades, being
Figure 4. (a, top) Indentation test profiles for two PETs with different Mw; (b, bottom)Solid front propagation for two PETs with differentMw.
The Use of the Indentation Test for Studying the Solidification Behaviour of Different Semicrystalline Polymers . . . 1059
Macromol. Mater. Eng. 2005, 290, 1056–1062 www.mme-journal.de � 2005 WILEY-VCH Verlag GmbH & Co. KGaA, Weinheim
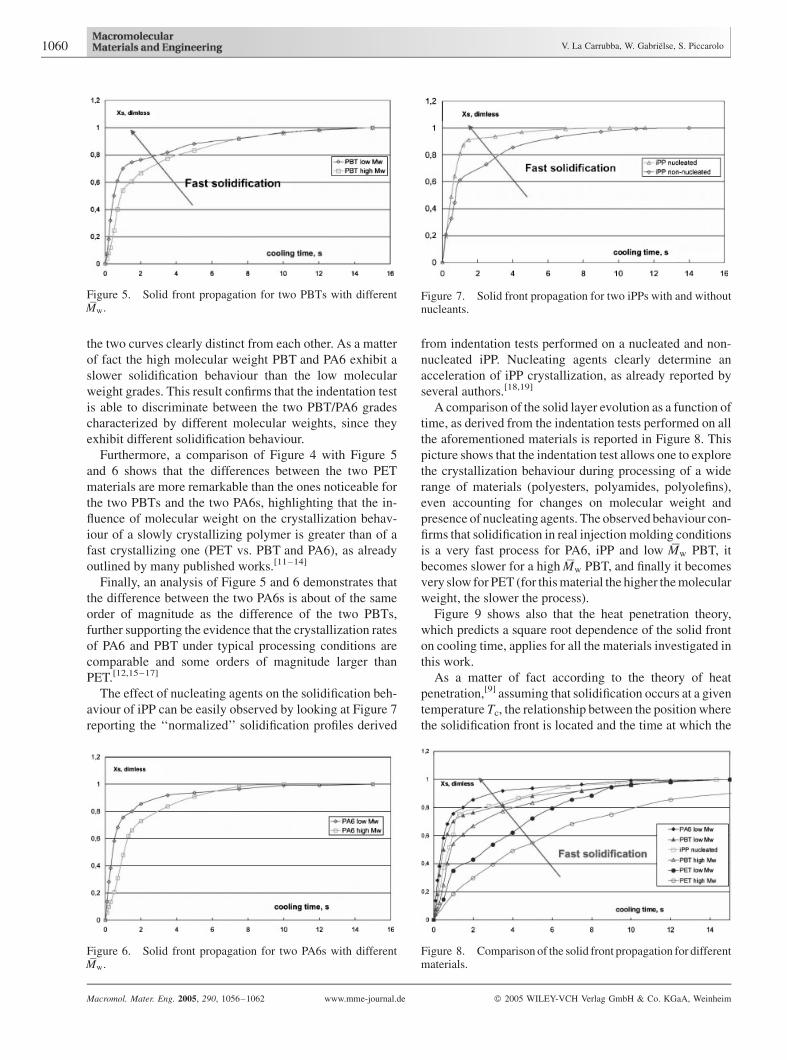
the two curves clearly distinct from each other. As a matter
of fact the high molecular weight PBT and PA6 exhibit a
slower solidification behaviour than the low molecular
weight grades. This result confirms that the indentation test
is able to discriminate between the two PBT/PA6 grades
characterized by different molecular weights, since they
exhibit different solidification behaviour.
Furthermore, a comparison of Figure 4 with Figure 5
and 6 shows that the differences between the two PET
materials are more remarkable than the ones noticeable for
the two PBTs and the two PA6s, highlighting that the in-
fluence of molecular weight on the crystallization behav-
iour of a slowly crystallizing polymer is greater than of a
fast crystallizing one (PET vs. PBT and PA6), as already
outlined by many published works.[11–14]
Finally, an analysis of Figure 5 and 6 demonstrates that
the difference between the two PA6s is about of the same
order of magnitude as the difference of the two PBTs,
further supporting the evidence that the crystallization rates
of PA6 and PBT under typical processing conditions are
comparable and some orders of magnitude larger than
PET.[12,15–17]
The effect of nucleating agents on the solidification beh-
aviour of iPP can be easily observed by looking at Figure 7
reporting the ‘‘normalized’’ solidification profiles derived
from indentation tests performed on a nucleated and non-
nucleated iPP. Nucleating agents clearly determine an
acceleration of iPP crystallization, as already reported by
several authors.[18,19]
A comparison of the solid layer evolution as a function of
time, as derived from the indentation tests performed on all
the aforementioned materials is reported in Figure 8. This
picture shows that the indentation test allows one to explore
the crystallization behaviour during processing of a wide
range of materials (polyesters, polyamides, polyolefins),
even accounting for changes on molecular weight and
presence of nucleating agents. The observed behaviour con-
firms that solidification in real injectionmolding conditions
is a very fast process for PA6, iPP and low Mw PBT, it
becomes slower for a highMw PBT, and finally it becomes
very slow for PET (for thismaterial the higher themolecular
weight, the slower the process).
Figure 9 shows also that the heat penetration theory,
which predicts a square root dependence of the solid front
on cooling time, applies for all the materials investigated in
this work.
As a matter of fact according to the theory of heat
penetration,[9] assuming that solidification occurs at a given
temperature Tc, the relationship between the position where
the solidification front is located and the time at which the
Figure 5. Solid front propagation for two PBTs with differentMw.
Figure 6. Solid front propagation for two PA6s with differentMw.
Figure 7. Solid front propagation for two iPPs with and withoutnucleants.
Figure 8. Comparison of the solid front propagation for differentmaterials.
1060 V. La Carrubba, W. Gabrielse, S. Piccarolo
Macromol. Mater. Eng. 2005, 290, 1056–1062 www.mme-journal.de � 2005 WILEY-VCH Verlag GmbH & Co. KGaA, Weinheim
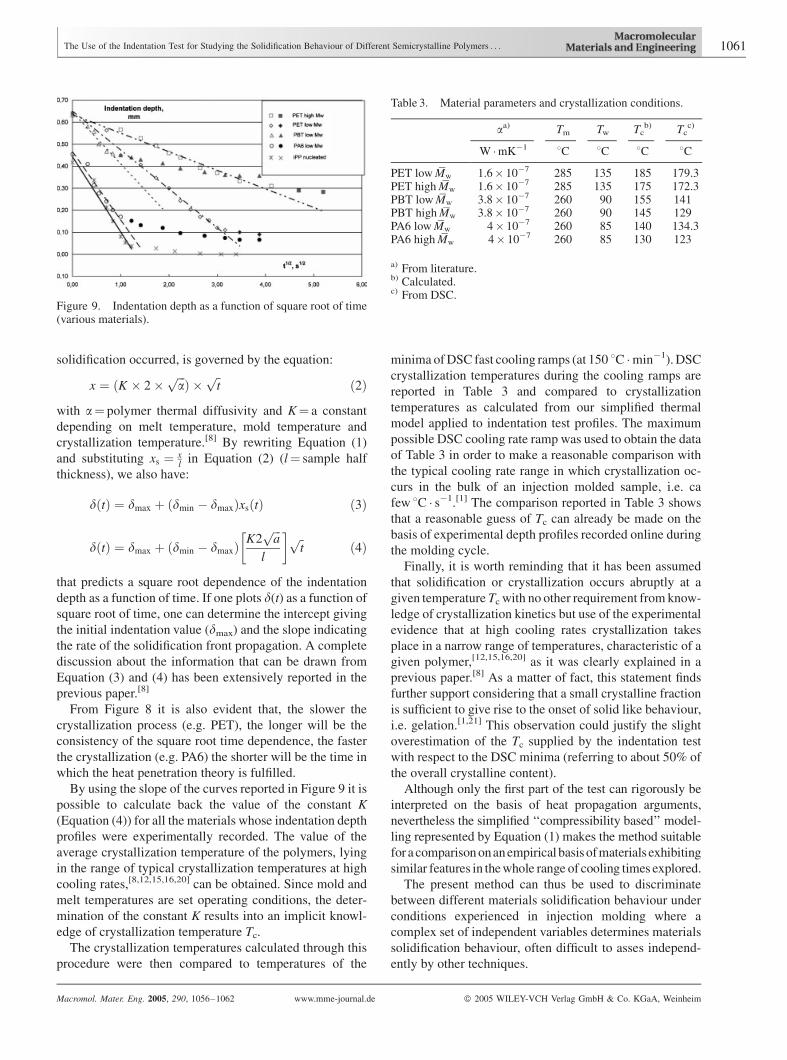
solidification occurred, is governed by the equation:
x ¼ ðK � 2�ffiffiffia
pÞ �
ffiffit
pð2Þ
with a¼ polymer thermal diffusivity and K¼ a constant
depending on melt temperature, mold temperature and
crystallization temperature.[8] By rewriting Equation (1)
and substituting xs ¼ xlin Equation (2) (l¼ sample half
thickness), we also have:
dðtÞ ¼ dmax þ ðdmin � dmaxÞxsðtÞ ð3Þ
dðtÞ ¼ dmax þ ðdmin � dmaxÞK2
ffiffiffia
p
l
� � ffiffit
pð4Þ
that predicts a square root dependence of the indentation
depth as a function of time. If one plots d(t) as a function ofsquare root of time, one can determine the intercept giving
the initial indentation value (dmax) and the slope indicating
the rate of the solidification front propagation. A complete
discussion about the information that can be drawn from
Equation (3) and (4) has been extensively reported in the
previous paper.[8]
From Figure 8 it is also evident that, the slower the
crystallization process (e.g. PET), the longer will be the
consistency of the square root time dependence, the faster
the crystallization (e.g. PA6) the shorter will be the time in
which the heat penetration theory is fulfilled.
By using the slope of the curves reported in Figure 9 it is
possible to calculate back the value of the constant K
(Equation (4)) for all the materials whose indentation depth
profiles were experimentally recorded. The value of the
average crystallization temperature of the polymers, lying
in the range of typical crystallization temperatures at high
cooling rates,[8,12,15,16,20] can be obtained. Since mold and
melt temperatures are set operating conditions, the deter-
mination of the constant K results into an implicit knowl-
edge of crystallization temperature Tc.
The crystallization temperatures calculated through this
procedure were then compared to temperatures of the
minima ofDSC fast cooling ramps (at 150 8C �min�1).DSC
crystallization temperatures during the cooling ramps are
reported in Table 3 and compared to crystallization
temperatures as calculated from our simplified thermal
model applied to indentation test profiles. The maximum
possible DSC cooling rate ramp was used to obtain the data
of Table 3 in order to make a reasonable comparison with
the typical cooling rate range in which crystallization oc-
curs in the bulk of an injection molded sample, i.e. ca
few 8C � s�1.[1] The comparison reported in Table 3 shows
that a reasonable guess of Tc can already be made on the
basis of experimental depth profiles recorded online during
the molding cycle.
Finally, it is worth reminding that it has been assumed
that solidification or crystallization occurs abruptly at a
given temperature Tc with no other requirement from know-
ledge of crystallization kinetics but use of the experimental
evidence that at high cooling rates crystallization takes
place in a narrow range of temperatures, characteristic of a
given polymer,[12,15,16,20] as it was clearly explained in a
previous paper.[8] As a matter of fact, this statement finds
further support considering that a small crystalline fraction
is sufficient to give rise to the onset of solid like behaviour,
i.e. gelation.[1,21] This observation could justify the slight
overestimation of the Tc supplied by the indentation test
with respect to the DSC minima (referring to about 50% of
the overall crystalline content).
Although only the first part of the test can rigorously be
interpreted on the basis of heat propagation arguments,
nevertheless the simplified ‘‘compressibility based’’ model-
ling represented by Equation (1) makes the method suitable
for acomparisononanempirical basisofmaterials exhibiting
similar features in thewhole range of cooling times explored.
The present method can thus be used to discriminate
between different materials solidification behaviour under
conditions experienced in injection molding where a
complex set of independent variables determines materials
solidification behaviour, often difficult to asses independ-
ently by other techniques.
Figure 9. Indentation depth as a function of square root of time(various materials).
Table 3. Material parameters and crystallization conditions.
aa) Tm Tw Tcb) Tc
c)
W �mK�1 8C 8C 8C 8C
PET lowMw 1.6� 10�7 285 135 185 179.3PET highMw 1.6� 10�7 285 135 175 172.3PBT lowMw 3.8� 10�7 260 90 155 141PBT highMw 3.8� 10�7 260 90 145 129PA6 lowMw 4� 10�7 260 85 140 134.3PA6 highMw 4� 10�7 260 85 130 123
a) From literature.b) Calculated.c) From DSC.
The Use of the Indentation Test for Studying the Solidification Behaviour of Different Semicrystalline Polymers . . . 1061
Macromol. Mater. Eng. 2005, 290, 1056–1062 www.mme-journal.de � 2005 WILEY-VCH Verlag GmbH & Co. KGaA, Weinheim
Conclusion
An on-line technique on injection molding recently pro-
posed,[8] the ‘‘indentation test’’, was extensively performed
on different classes of materials (polyesters PET and PBT,
polyamides PA6 and polyolefins iPP) characterized by
variation in structural parameters (molecular weight and
presence of nucleants).
From the shape of the indentation curve obtained, the
evolution of the solidification front as a function of time can
be determined and a good agreement between experimental
data and predictions of the evolution of the solid layer
thickness based on the classical theory of heat penetration
(without taking into account crystallization kinetics) was
obtained. The method appears to be very sensitive to ma-
terials adopted, allowing one to discriminate between
different polymers (from slowly crystallizing, e.g. PET, to
fast crystallizing ones, e.g. PBT, PA6, iPP) and material
features (Molecular weight, nucleants). It also allows to
indirectly determine the temperature range in which crys-
tallization occurs under typical injection molding con-
ditions, thus confirming previous authors’ results. It bridges
commonmolders’ practicewith knowledge of solidification
behaviour under processing conditions, few examples
behind any words. The experimental evidence that the soli-
dification rate (and hence cycle time) of PBT and PA6 are
comparable, as already shown, and the observation that the
larger the crystallization rate (PBT vs. PET) the less rele-
vant the influence of molecular weight are a few successful
proofs reported here.
The method can thus be regarded as a reliable and
powerful tool to monitor on-line the solidification process
during injection molding and may represent an effective
method to describe the solidification behaviour under
‘‘realistic’’ operating conditions.
[1] G. Titomanlio, S. Piccarolo, G. Levati, J. Appl. Polym. Sci.1988, 35, 1483.
[2] Z. Ding, J. Spruiell, J. Polym. Sci., Part B: Polym. Phys.1996, 34, 2783.
[3] G. Lamberti, F. De Santis, A. Giannattanasio, V. Brucato,G. Titomanlio, ‘‘Proc. of PPS 18’’, Guimaraes 2002.
[4] C. L. Thomas, A. J. Bur, Polym. Eng. Sci. 1999, 39,1291.
[5] J. G. Kim, J. W. Lee, ‘‘Proc. of PPS 18’’, Guimaraes 2002.[6] G. D. Smith, E. C. Brown, P. D. Coates, ‘‘Proc. of PPS 18’’,
Guimaraes 2002.[7] J. Guillet, J. M. Gonnet, I. Sirakov, R. Fulchiron, G. Seytre,
‘‘Proc. of PPS 17’’, Montreal 2001.[8] V. La Carrubba, W. Gabrielse, M. van Gurp, S. Piccarolo,
V. Brucato, J. Appl. Polym. Sci. 2003, 89, 3713.[9] R. B. Bird, W. E. Stewart, E. N. Lightfoot, ‘‘Transport
Phenomena’’, Wiley, New York 1960.[10] ‘‘Kenndaten fur die Verarbeitung thermoplastischer Kunst-
stoffe, 1: Thermodynamik’’, Carl Hanser Verlag, Munchen,Wien 1979.
[11] B. Gumther, H. G. Zachmann, Polymer 1983, 24, 1008.[12] S. Piccarolo, V. Brucato, Z. Kiflie,Polym. Eng. Sci. 2000, 40,
1263.[13] C. Vanderdonckt, M. Krumova, F. J. Balta Calleja, H. G.
Zachmann, S. Fakirov, Colloids Polym. Sci. 1998, 276,138.
[14] Y. Y. Cheng, M. Brillhart, P. Cebe, M. Capel, J. Polym. Sci.,Part B: Polym. Phys. 1996, 34, 2953.
[15] V. Brucato, G. Crippa, S. Piccarolo, G. Titomanlio, Polym.Eng. Sci. 1991, 31, 1411.
[16] V. Brucato, S. Piccarolo, G. Titomanlio, Int. J. Form.Processes 1998, 1, 35.
[17] G. Coppolino, personal communication, 1997.[18] M. A. Lopez-Manchado, M. Arroyo, Polymer 2000, 41,
7761.[19] K. Nagarajan, K. Levon, A. S. Myerson, J. Therm. Anal.
Calorim. 2000, 59, 497.[20] V. Brucato, S. Piccarolo, V. La Carrubba, Chem. Eng. Sci.
2002, 57, 4129.[21] N. V. Pogodina, H. H. Winter, Macromolecules 1998, 31,
8164.
1062 V. La Carrubba, W. Gabrielse, S. Piccarolo
Macromol. Mater. Eng. 2005, 290, 1056–1062 www.mme-journal.de � 2005 WILEY-VCH Verlag GmbH & Co. KGaA, Weinheim