Embed Size (px)
Citation preview
The Use of Terrain Conductivity and VLF Methods toLocate Acid Seep Source Areas in a Coal Refuse Pile
byJennifer ShogrenSenior Thesis (completed April 2001)Department of Geology and GeographyWest Virginia University

The Use of Terrain Conductivity and VLF Methods to Locate Acid Seep SourceAreas in a Coal Refuse Pile
By Jennifer S. Shogren
AbstractThe purpose of this study was to compare the results of geophysical surveys
using electromagnetic induction. The surveys were conducted at Falls Run Coal
Refuse Pile operated by the Preston County Coke and Coal Association located
in Preston County, West Virginia. Acidic waters seeping out of the base of the
refuse pile are creating minor environmental problems in the surrounding areas,
despite preventative measures undertaken by the Preston County Coal and Coke
Association. This study, in addition to the study by Tang (2001), was to
determine the location and distribution of the acid water source areas within the
pile using geophysical methods. Several types of geophysical surveys were
conducted, including terrain conductivity, magnetic, and very low frequency (VLF)
conductivity surveys. Data analysis revel the presence of high conductivity
anomalous regions within the refuse pile that could be the source area of acidic
waters that drain from the refuse pile. Several terrain conductivity models were
developed to in attempt to describe and delineate the vertical extent of the acid
source areas within the refuse pile. Four-layer and three-layer conductivity
models can be used to describe the anomalies in the refuse pile. The VLF and
terrain conductivity responses showed a considerable similarity over anomalous
regions identified within the refuse pile. Some of the variations observed in the
VLF data are thought to be a result of noise. Noise tests were performed to
better understand the fluctuation the VLF results.
Introduction
Acid mine drainage (AMD) is a serious environmental problem in West Virginia.
Coal from the Pittsburgh and Freeport formations, which are mined in nearby
areas, contains a high concentration of pyrite. Refuse piles, mine spoils, and
coal can generate acidic water that invades the streams of West Virginia. This
study focuses on the Falls Run Refuse Pile in order to locate AMD sources within
the pile.

The Falls Run Coal Refuse Pile is located approximately 12 miles east of
Morgantown along State Route 7 (see Figure1). The site is located on the
southeast limb of the Chestnut Ridge Anticline. Acidic sandstone underlies the
refuse pile.
Coal refuse from the Greer Mansion mining operation was deposited in
the area beginning in 1983. From 1985 to 1988, the coal plant was disabled. At
this time, lime slurry was placed over the refuse. In 1988, treated coal sludge
from the Greer mine site was deposited over the refuse pile as a preventive
measure. Additional sludge was brought to the site until 1998. The area was
covered with limestone. Both the limestone and sludge were added to neutralize
the water leaching through the pile. Several soft spots developed within the
refuse pile; several hundred tons of limestone was added to the refuse pile to
stabilize the structure. Unfortunately, acid water now seeps from the base of the
refuse pile in spite of the treatments. Figure 2 is a schematic diagram
representing a cross-section of the refuse pile. The coal refuse tops a naturally
acidic sandstone. The treated sludge and lime slurry tops the refuse. The entire
pile is covered by limestone.
Though the general location of the coal refuse and sludge are known, the
areas generating the acid are not. Traditionally, an area in which AMD is
seeping is excavated to locate the source. Terrain conductivity and magnetic
surveys were performed in attempt to locate the acid-generating materials within
the pile in hopes of minimizing the amount and cost of excavation. Information
from these surveys was compared to very low frequency (VLF) surveys. The
purpose of the VLF survey was to compare the relationship of the VLF variations
with the variations measured by the EM-31.

Figure 2: Generalized cross-section of Falls Run Refuse Pile.
Scale: 1in=10 feet
Methodology
Terrain Conductivity
Terrain Conductivity surveys use an artificially generated alternating
electromagnetic field to probe the earth's subsurface for conductivity variations.
Figure 1: Location of Falls Run Coal Refuse Pile. The refuse pile islocated approximately 12 miles east of Morgantown.

An alternating electromagnetic field is generated by running an alternating
current through a transmitter coil. The flow of the current through the transmitter
coil produces a dipole magnetic field of constantly varying intensity. For the
purpose of this study, the EM-31 and the EM-34, manufactured by Geonics,
Limited, were used to perform the terrain conductivity surveys (see Figure 3).
Conductivity varies within the earth and is controlled by the rocks and soil that
make up the subsurface. Factors controlling the conductivity of a given area are:
porosity, moisture content, dissolved electrolyte content, temperature and phase
state of pore water, and the amount and composition of colloids (McNeill, 1980).
The terrain conductivity method uses a transmitter coil that produces a primary
electromagnetic wave that travels through the ground. The alternating electric
current produces an alternating magnetic field that induces current flow through
the earth. The receiver coil senses the secondary magnetic field produced by
this induced current.
The strength of the secondary field is dependent on such things as intercoil
spacing, frequency of the primary field, and ground conductivity. As described by
McNeill, there is a simple relationship between the primary and secondary fields
when the operation frequency of the terrain conductivity meter is confined to the
constraints of a low induction number. The terrain conductivity has a linear
Figure 3: The EM-31pictured on the left has a fixed intercoil spacing of 12feet. The EM-34, right, has three intercoil spacings of 10m, 20m, and 40m.

relationship with the ratio of the primary and secondary magnetic fields. McNeill
gives the relationship:
Hs = iωµ0σs2
Hp 4
Where Hs is the secondary magnetic field at the receiver coil
Hp is the primary magnetic field at the receiver coil
ω is equal to 2πf
f is the frequency of alternating current in transmitter coil
µ0 is permeability of free space
σ is ground conductivity
s is the intercoil spacing
i is square root of -1.
The primary and secondary fields are directly measured by the instrument and
the ratio is known; therefore, the apparent conductivity is also known.
A low induction number makes the general relationship between the ratio of the
primary and secondary and terrain conductivity possible. The induction number,
B, is dependent on the intercoil spacing and the skin depth:
B = s δ
where s is the intercoil spacing and δ is the skin depth. The skin depth is
described as the depth at which the amplitude of the electromagnetic field drops
to 1/e of the source amplitude, e being the natural base, and is a function of the
operating frequency and the ground conductivity. The skin depth is given by the
following relationship:
δ = 500(1/σf)-1
In general, the relationship of the peak amplitude of an oscillating
electromagnetic field at a distance r from the source will drop off is given by:

Ar = Ase -αr
where Ar is the peak amplitude and α is the attenuation coefficient.
The attenuation coefficient varies in proportion to the frequency of the
electromagnetic wave such that higher frequencies are attenuated more than
lower frequencies over the same distance. Therefore, to obtain a greater
exploration depth, a lower frequency must be used.
Combined use of both the EM-31 and the EM-34 provides observations at four
different coil spacings. Depth of penetration increases with increased coil
spacing as well as the dipole position of the instrument. Generally, the effective
depth of exploration is greater when the instrument operates in the vertical dipole
field (see Figure 4). The coil spacing for the EM-31 is fixed at 3.67 meters, which
has an effective exploration depth of 2.75 meters in the horizontal dipole position
and 5.5 meters in the vertical dipole position. The EM-34 has three different coil
spacings: 10 meters, 20 meters, and 40 meters. The effective exploration depth
in the horizontal dipole field is 7.5 m, 15 m, and 30 m, respectively; the effective
exploration depth in the vertical dipole field is 15 m, 30 m, and 60 m,
respectively. For this survey, the 10-m and 20 m intercoil spacings were used.
Figure 4: The use of vertical or horizontal dipole orientation provides additionalInformation of subsurface terrain conductivity values.
Vertical Horizontal

VLF
The very low frequency (VLF) method is a variant of the terrain conductivity
method that uses electromagnetic fields generated by military transmitters.
Several transmitters have been set up throughout the world to facilitate
submarine navigation and communication. The first VLF transmitter was built in
1912 (McNeill and Labson) with most existing transmitters built by the late
1950's. Operating frequencies of VLF transmitters vary between 15 and 30
kilohertz (kHz). The transmitter antennas are comprised of several hundred
kilometers of vertical cable top-loaded with horizontal antennae that extend for
distances of two to three miles. The VLF unit is simply a small receiver. Its
portability allows one person to quickly traverse the survey area. For this study,
the Phoenix VLF unit was used.
The magnetic field generated by the VLF transmitters travels parallel to the
earth's surface. The amplitude of the magnetic wave is proportional to the
amplitude of the vertical electric field that decays in proportion to the inverse of
the source distance as given in the equation by McNeill and Labson:
Ez(mV/m) = 300 (P(kw) r(km)
where P is the radiated power in kilowatts, r is the distance from the source in kilometers,
and E is the peak electric field in millivolts per meter.
Attenuation of the 30kHz signal is more than 25 dB below that of a 10KHz signal
at a distance of 5000 km from the transmitter.
The earth's ionosphere acts as a high impedance boundary. Coupled with the
earth's surface the ionosphere forms a confining layer that prevents the VLF
signal from escaping into outer space. This makes it possible for VLF signals to
be recorded at distances exceeding 10,000 kilometers from the transmitters.
Because of the interaction with the ionosphere, the VLF signal varies throughout
the day with the daily variations of the ionosphere height. The VLF signal varies
additionally with seasonal changes and sunspot activity.
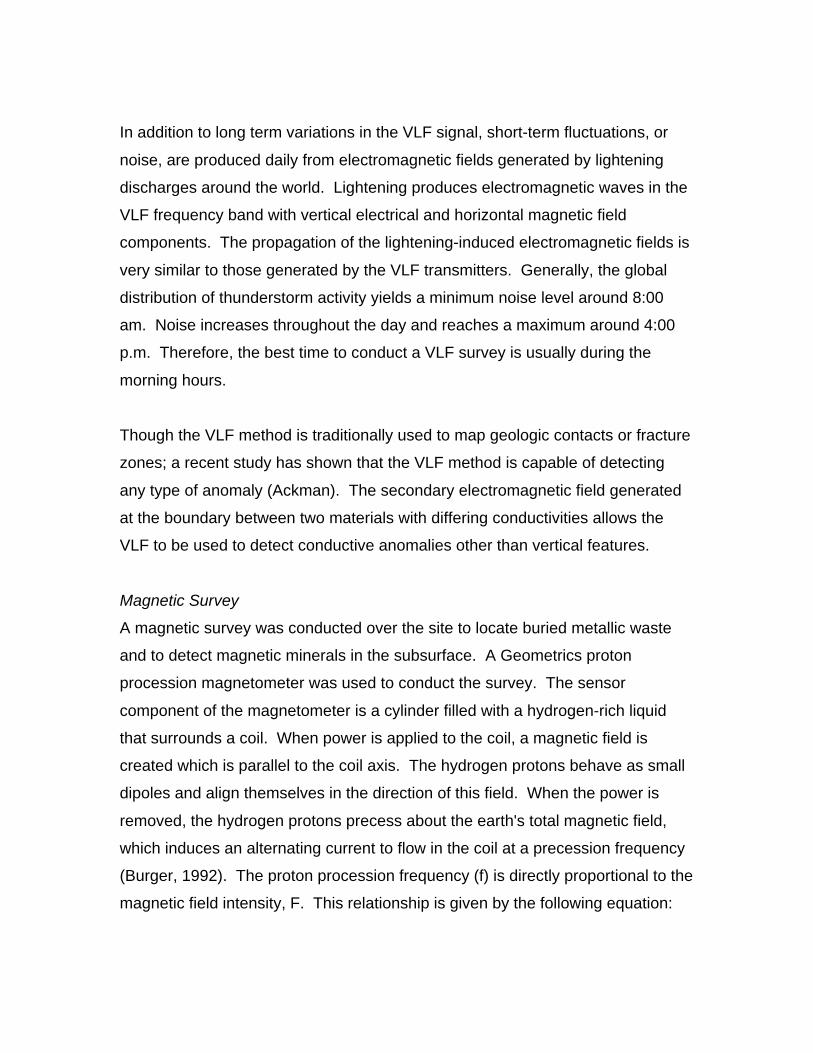
In addition to long term variations in the VLF signal, short-term fluctuations, or
noise, are produced daily from electromagnetic fields generated by lightening
discharges around the world. Lightening produces electromagnetic waves in the
VLF frequency band with vertical electrical and horizontal magnetic field
components. The propagation of the lightening-induced electromagnetic fields is
very similar to those generated by the VLF transmitters. Generally, the global
distribution of thunderstorm activity yields a minimum noise level around 8:00
am. Noise increases throughout the day and reaches a maximum around 4:00
p.m. Therefore, the best time to conduct a VLF survey is usually during the
morning hours.
Though the VLF method is traditionally used to map geologic contacts or fracture
zones; a recent study has shown that the VLF method is capable of detecting
any type of anomaly (Ackman). The secondary electromagnetic field generated
at the boundary between two materials with differing conductivities allows the
VLF to be used to detect conductive anomalies other than vertical features.
Magnetic Survey
A magnetic survey was conducted over the site to locate buried metallic waste
and to detect magnetic minerals in the subsurface. A Geometrics proton
procession magnetometer was used to conduct the survey. The sensor
component of the magnetometer is a cylinder filled with a hydrogen-rich liquid
that surrounds a coil. When power is applied to the coil, a magnetic field is
created which is parallel to the coil axis. The hydrogen protons behave as small
dipoles and align themselves in the direction of this field. When the power is
removed, the hydrogen protons precess about the earth's total magnetic field,
which induces an alternating current to flow in the coil at a precession frequency
(Burger, 1992). The proton procession frequency (f) is directly proportional to the
magnetic field intensity, F. This relationship is given by the following equation:
f = M(F) = GF 2πL 2π
where L is the angular momentum and G is the gyromagnetic ratio.
Because the frequency of procession is proportional to the strength of the total
field, the total field intensity can be easily determined.
Grid
Since the purpose of the VLF survey was to compare its response directly to that
obtained form the EM-31 terrain conductivity survey (Tang 2001), a relatively
small grid was established. The grid consisted of approximately 15 lines that
were 600 feet long and 20 feet apart. Readings were taken every 20 feet with
the exception of the VLF. The station spacing for the VLF ranged from 40 to 50
feet.
Data Analysis
The key issue addressed in this study, as well as Tang's (2001) study, was to
locate highly conductive areas within the refuse pile that might serve as source
areas for the acid seeps.
A magnetic survey was conducted over the refuse pile (see Figure 5). Several
anomalous areas are present within the pile. These anomalies are a result of
buried metallic debris. Metallic pipes were visible on the surface of the pile.
Figure 6 shows a graph of the magnetic intensity at the refuse pile. A
comparison the terrain conductivity survey (Figure 7) and the magnetic survey
was done to ensure that the anomalous regions detected within the magnetic
survey did not correspond to those found in the terrain conductivity survey.

0.00 50.00 100.00 150.00 200.00 250.00 300.00 350.00 400.00 450.00 500.00 550.00 600.000.00
50.00
100.00
Figure 5: Results of the magnetic survey. Dark areas represent anomalous areaswithin the magnetic survey.
Figure 6: The magnetic intensity of the refuse pile.

Figure 7 presents a contour map of the terrain conductivity survey (Tang, 2001).
Anomalous regions are highlighted in yellow. Three anomalous regions are
present within the pile and could be the source of the AMD.
0.00 50.00 100.00 150.00 200.00 250.00 300.00 350.00 400.00 450.00 500.00 550.00 600.000.00
50.00
100.00
150.00
200.00
0.00 50.00 100.00 150.00 200.00 250.00 300.00 350.00 400.00 450.00 500.00 550.00 600.000.00
50.00
100.00
150.00
200.00
250.00
Figure 7: Contour Map depicting the results of the terrain conductivity survey.Green lines indicate EM-34 survey lines; red circles indicate anomalousregions similar to the VLF survey.
Figure 8: A contour map depicting the results of the VLF surveys.

Figure 8 is a graphic representation of the data collected from the VLF surveys.
Typically, VLF surveys are reserved for determining vertical features within the
subsurface such as water-filled dikes or fractures. This study compared the
results of the terrain conductivity survey with the VLF survey to determine if VLF
methods have applications similar to terrain conductivity methods, i.e. delineating
conductive areas of horizontal extent. Comparing Figures 7 and 8 shows
similarity in the anomalous regions. The dashed red circles show the
corresponding anomalous areas.
Several VLF surveys were conducted over the area. Two transmitting stations
were used; F2, Cutler, Maine, and F1, Annapolis, Maryland. Figure 9 a-f, depict
the results of the line traverses conducted on December 9, 2000.
VLF Survey, 12-9-00
0
50
100
150
200
250
300
350
400
450
500
550
600
0 100 200 300 400 500 600
Distance
Fie
ld S
tren
gth
F2, Line 1
Figure 9a: The VLF results, line 1.

VLF Survey 12-9-00
400
450
500
550
600
650
700
0 100 200 300 400 500 600
Distance
Fie
ld S
tren
gth
F2, Line 3
Figure 9b: The VLF results, line 3.
VLF Survey 12-09-00
400
450
500
550
600
650
700
0 100 200 300 400 500 600
Distance
Fie
ld S
tren
gth
F2, Line 5
Figure 9c: The VLF results, line 5.

VLF Survey 12-09-00
400
450
500
550
600
650
700
0 100 200 300 400 500 600
Distance
Fie
ld S
tren
gth
F2, Line 7
Figure 9d: The VLF results, line 7.
VLF Survey 12-09-00
400
450
500
550
600
650
0 100 200 300 400 500 600
Distance
Fie
ld S
tren
gth
F2, Line 9
Figure 9e: The VLF results, line 9.

In all graphs there are two general peaks in field strength. One peak occurs at or
near the 250-foot distance. The other peak in field strength occurs at a distance
at or near 550 feet. The peaks in field strength correlate to the anomalous areas
seen in Figure 7.
Figures 10 a-b present the VLF results of line traverses conducted on January
13-14, 2001. Again, notice peaks in field strength around distances of 250 feet
and 500 feet, correlating with anomalous regions indicated in Figure 7. Figures
11-12 show similar results of line traverses on different dates.
12-9-00 VLF Survey
0
100
200
300
400
500
600
700
0 100 200 300 400 500 600 700
Distance
Fie
ld S
tren
gth
F2, Line -1
F2, Line 1
F2, Line 3
F2, Line 5
F2, Line 7
F2, Line 9
Figure 9f: The VLF results, all lines.

VLF Survey 1/14/01
0
50
100
150
200
250
300
350
400
450
500
550
600
0 100 200 300 400 500 600
Distance
Fie
ld S
tren
gth
F2, Line 1
F1, Line 1
Figure 10a: VLF results, line 1.
VLF Survey 1-14-01
200
250
300
350
400
450
500
0 100 200 300 400 500 600 700
Distance
Fie
ld S
tren
gth
F2, Line 3
F1, Line 3
Figure 10b: VLF results, line 3.

2-8-01 VLF
0
50
100
150
200
250
300
350
400
450
500
550
600
0 100 200 300 400 500 600
Distance
VL
F S
tren
gth
F2-Maine
F1-Maryland
2.18.01 VLF Survey
0
20
40
60
80
100
120
140
160
180
200
0 100 200 300 400 500 600 700
distance
fiel
d s
tren
gth
F2, Line -1
F1, Line -1
Figure 11: VLF results, line 1.
Figure 11a: VLF results, line -1.

2-18-01 VLF Survey
0
50
100
150
200
250
300
350
400
450
500
550
600
0 100 200 300 400 500 600
Distance
Fie
ld S
tren
gth
F2, Line 1
F1, Line 1
2-18-01 VLF Survey
0
20
40
60
80
100
120
140
160
180
200
0 100 200 300 400 500 600
Distance
Fie
ld S
tren
gth
F2, Line 3
F1, Line 3
Figure 11b: VLF results, line 1.
Figure 11c: VLF results, line 3.

The variations and irreproducibility of the VLF conductivity surveys are exhibited
in the above figures. The variations, or noise, can have a significant effect on the
data collected from a VLF survey. To better understand the extent of field
strength fluctuations, a noise test was performed. A noise survey was conducted
for both stations F1 and F2 in a single location. A measurement of the field
strength was taken every five seconds for a period of five minute. Figure 12
depicts the results of the noise survey. Severe fluctuations occur over a
relatively short time period due to variations in the electromagnetic field.
2-18-01 VLF Survey
0
20
40
60
80
100
120
140
160
180
200
0 100 200 300 400 500 600
Distance
Fie
ld S
tren
gth
F2, Line -1
F1, Line -1
F2, Line 1
F1, Line 1
F2, Line 3
F1, Line 3
Figure 11d: VLF results, all lines.

N o i s e S u r v e y f o r F 2
1 6 5
1 7 0
1 7 5
1 8 0
1 8 5
1 9 0
1 9 5
2 0 0
2 0 5
0 5 0 1 0 0 1 5 0 2 0 0 2 5 0 3 0 0
s e c o n d s
fiel
d s
tren
gth
F 2
N o i s e S u r v e y f o r F 1
3 0
3 5
4 0
4 5
5 0
5 5
6 0
6 5
0 5 0 1 0 0 1 5 0 2 0 0 2 5 0 3 0 0
s e c o n d s
fiel
d s
tren
gth
F 1
Figure 12a: Noise survey for station F2.
Figure 12b: Noise survey for station F1.

In attempt to determine the vertical extent of the different anomalous regions of
the refuse pile, four EM-34 surveys were conducted at distances of 60 feet, 200
feet, 260 feet, and 520 feet. These survey lines are highlighted in green on
Figure 7. Results were modeled using EMIX software. Because no additional
subsurface information was available (well logs, conductivity measurements,
etc.), the modeling of the refuse pile became a problem in which there proved to
be many non-unique solutions. Figure 13 depicts the modeled soundings at a
distance of 60 feet. The approximate depth bedrock is thought to be about 4
meters. Figures 13a and 13b show the pile modeled as a four-layer model.
Figure 13a shows the sludge as the zone of high conductivity, whereas Figure
13b shows the coal refuse as being the high conductivity zone. Figure 13c
shows the full extent of the non-uniqueness of the problem in that the refuse
layer and sludge layer have been combined into a single layer. The generated 3-
layer model offers yet another solution. Notice that the thickness of the
generated models decrease with each sounding. This is due the pile topography;
the soundings move down-slope, thus the thickness decreases.
Figure 14 through 16 depict models derived from the EM-34 soundings.
Similarly, each sounding can be modeled as either a four-layer model or a three-
layer model. The four-layer models can be manipulated such that either the coal
refuse or the sludge is the area of high conductivity.
Conclusions
By comparing different geophysical electromagnetic induction methods, three
anomalous regions within the Falls Run Coal Refuse Pile where identified.
These regions are thought to be responsible for the acid water seeps discharging
from the base of the pile.
VLF surveys were compared to terrain conductivity surveys. The comparison
shows similarity in anomalous regions. Noise in VLF surveys can complicate
field strength readings. Because irreproducible field strength readings were
observed over the same area at different times, general trends of corresponding
lines must be taken into account when interpreting the data, rather than specific
field strength readings. Nonetheless, the VLF conductivity surveys proved to
have a terrain conductivity component in that the two survey results yielded
similar anomalous regions.
One of the most important aspects of the study was to show that the results and
conclusions of the data analysis are non-unique. The idea of non-uniqueness is
demonstrated best by the models generated from the EM-34 results. Different
models generated to describe the vertical extent and distribution of the acid
source shows that more than one answer is appropriate.
The preliminary results of the various geophysical surveys were discussed with
Joe Dean, operator of the Falls Run Refuse Pile. Observed anomalous regions
correspond to "hot spots" within the refuse pile. All three anomalous regions
(Figure 7) can be linked to trouble areas within the pile. Excavation of these
three areas are planned for the Summer of 2001. By completing and comparing
various geophysical techniques, possible acid sources were identified, thus
reducing the amount and extent of excavation in the refuse area.
Acknowledgements
Special thanks to Joe Dean of Greer Industries for giving us permission toaccess the Preston County Coke and Coal Co. Refuse area. The area is a greatresource for providing students with basic skills in the use of geophysicalinstrumentation for subsurface investigation.
I’d also like to thank the NASA Space Grant Consortium for their Scholarshipaward. This helped cover the costs of travel back and forth to the site and easedthe burden of taking on the additional responsibilities required by the thesis effort.
References
Ackman, T.E., G.A. Veloski, R.A. Dotson, Jr., R.W. Hammack. An Evaluation of
Remote Sensing Technologies for Watershed Assessment. U.S.
Department of Energy, National Energy Technology Laboratory,
Pittsburgh, PA.
Ackman, T.E., and K.K. Cohen, 1994. Geophysical Methods: Remote
Techniques Applied to Mining-related Environmental and
Engineering Problems. U.S. Department of Energy, National Energy
Technology Laboratory, Pittsburgh, PA.
Ackman, T.E. Locating Water Loss Zones in the North Unit Canal using Two
Electromagnetic Geophysical Techniques. U.S. Department of Energy,
National Energy Technology Laboratory, Pittsburgh, PA.
Ackman, T.E., R.W. Hammack, G.A. Veloski. Geophysical Investigation of
Selected Stream Segments in the Upper Animas River Watershed,
San Juan County, Colorado to Identify Potential Water Loss Zones. U.S.
Department of Energy, Federal Energy Technology Center, Pittsburgh,
PA.
Burger, Robert H. 1992. Exploration Geophysics of the Shallow Subsurface.
pp. 310,405.
McNeill, J.D. 1980. Electrical Conductivity of Soils and Rocks. Geonics
Limited, TN-5.
McNeill, J.D. 1980. Electromagnetic Terrain Conductivity Measurements at Low
Induction Numbers. Geonics Limited, TN-6.
McNeill, J.D. and V.F. Labson. Geologic Mapping using VLF Radio Fields
pp.521-640.
Wilson, Tom, 2000. Geology 252 Lecture Notes.
www.geo.wvu.edu/~wilson.teach.htm