Embed Size (px)
Citation preview

The Use of Technical Analysis by Fund Managers:
International Evidence
Lukas Menkhoff
Discussion Paper No.466
April 2010
ISSN 0409-9962
Abstract
The use of technical analysis by financial market professionals is not well understood. This
paper thus analyzes survey evidence from 692 fund managers in five countries, the vast major-
ity of whom rely on technical analysis. At a forecasting horizon of weeks, technical analysis is
the most important form of analysis and up to this horizon it is thus more important than fun-
damental analysis. Technicians are as experienced, as educated, as successful in their career
and largely just as overconfident in decision-making as others. However, technical analysis is
somewhat more popular in smaller asset management firms. What we find most significant is
the relation of technical analysis with the view that prices are heavily determined by psycho-
logical influences. Consequently, technicians apply trend-following behavior.
JEL-Classification: G 14 (information), G 23 (fund management)
Keywords: fund managers, technical analysis, fundamental analysis, personal cha-
racteristics, investment behavior
* I thank all the participating fund managers for taking time either in interviews or in answer-
ing the questionnaire. Moreover, I thank the investment management associations of Germany
(Bundesverband BVI), Italy and Thailand as well as Michael Melvin for their generous sup-
port in conducting the survey study and an anonymous referee for valuable comments. Great
research assistance was provided by Fabian Bätje, Daniela Beckmann, Oliver Gloede, Torben
Lütje and Marina Nikiforow. Financial support by the Volkswagen Foundation is gratefully
acknowledged.
Lukas Menkhoff, Department of Economics, Leibniz Universität Hannover, Königsworther
Platz 1, D-30167 Hannover, Germany, [email protected]
2
The Use of Technical Analysis by Fund Managers:
International Evidence
1 Introduction
Some decades ago, the use of technical analysis was heavily debated in academia (see
Fama, 1970). Since then, however, modern capital market theory has revolutionized fund
management, seemingly taking the grounds away for non-fundamental analyses. So it may be
puzzling that even a superficial contact with real world fund management already reveals the
survival of a prominent non-fundamental kind of analysis, i.e. technical analysis. Interestingly,
in academia, forms of this analysis are also seriously analyzed, as shown by articles in leading
journals.1 We can thus conclude that technical analysis is still an issue in financial markets,
both in practice and in academia. In contrast to this relevance, however, according to our
knowledge, there is no systematic information about the use of technical analysis in fund
management. How important is technical analysis nowadays, how do professionals use it and
why do professionals use it at all? This paper provides evidence on these questions, based on a
broad survey study conducted with 692 fund managers in five markets, namely the US, Ger-
many, Switzerland, Italy and Thailand.
We have deliberately chosen to use data about fund managers in our examination of the
use of technical analysis for two reasons. First, fund managers have evolved as the most im-
portant group in modern financial markets when it comes to holdings and transactions (Davis
and Steil, 2001), so they are of undisputed empirical importance when it comes to understand-
ing real world markets. Second, fund managers are—in contrast to individual investors—
highly qualified market participants; this exempts them from any concerns about a lack of
professionalism. Accordingly, if there is evidence that technical analysis plays a significant
role in their decision making, this finding is not rooted in the examination of a dubious or
marginal group. On the contrary, a use of technical analysis by fund managers would be an
important factor to be considered when attempting to reach an appropriate theoretical under-
standing of financial markets.
1 To mention some examples: Brock, Lakonishok and LeBaron (1992), Blume, Easley and O’Hara
(1994), Lo, Mamaysky and Wang (2000), Kavajecz and Odders-White (2004), Nam, Washer and Chu
(2005), Kliger and Kudryavtsev (2008), Friesen, Weller and Dunham (2009), Harris and Yilmaz
(2009) or Zhu and Zhou (2009).

3
We find that technical analysis is highly important as an information category. The share
of fund managers that put at least some importance on technical analysis is very large at 87%
and a major group (18%) even generally prefers it to other ways of information processing.
Nevertheless, technical analysis does not dominate the decision-making of fund managers in
general. Fundamental analysis gets the highest relative importance at 68% as compared to
22% for technical analysis and 10% for flows (equal weighting of countries). When we focus
on forecasting horizons, however, we find that technical analysis is the most important form
of analysis for decisions with forecasting horizons of some weeks, dominating fundamental
analysis up to this horizon. So, technical analysis is obviously in wide-spread and relevant use
among fund managers.2 Given this unexpected fact—from the view of conventional capital
market theory—what may the motivation for the application of technical analysis be?
We structure our examination of possible motivations according to three major positions
that can be stated with reference to the efficient market hypothesis (EMH) and which are sub-
sequently introduced at length in Section 3. According to position 1, arguing from the view-
point of efficient financial markets, technical analysis is seen as a sign of less than fully ra-
tional behavior. A somewhat modified EMH-view, our position 2, argues that the use of tech-
nical analysis may be a rational response to high information costs. Finally, we reduce the
understanding of efficient markets to its minimum condition, i.e. the absence of strategies that
generate systematic excess returns, our position 3. According to this position, heterogeneous
agents possess different sets of information or different beliefs about market processes, the use
of technical analysis being a sign of this heterogeneity.
We test these three positions by relating the intensity of the use of technical analysis to
fund managers’ answers to respective items of the survey. Evidence supports position 3,
somewhat supports position 2 but does not support position 1. In order to test position 1, i.e.,
users of technical analysis are irrational, we relate the use of technical analysis to personal
indicators of fund managers, such as experience or the degree of education—without any sig-
nificant findings. The same non-result is found when we use—for the first time in this litera-
ture—indicators of overconfidence in order to test whether users of technical analysis are infe-
rior to non-users. So there is no evidence that technical analysis is preferred by less rational or
otherwise inferior fund managers, which is in line with findings from foreign exchange (e.g.
Menkhoff, 1998; Cheung, Chinn and Marsh, 2004). Our most interesting result with respect to
2 The structural information fits well to results from foreign exchange but the overall level is higher in
foreign exchange with a share of more than 30% (see Menkhoff and Taylor, 2007).

4
position 2 is the fact that technical analysis is more heavily used in smaller fund management
firms. As these firms have less capacity to conduct or to buy first-class fundamental research,
technical analysis may serve as a second best (cheaper) form of analysis. Finally, regarding
position 3, we obtain strong results again, indicating that users of technical analysis share a
view about financial markets that is different from non-users. They seem to believe that psy-
chological factors are important and that herding is beneficial.3 Users of technical analysis
consequently react to this view with trend-following behavior (and also by relying more
strongly on momentum and contrarian investment strategies).
The remainder of the paper is structured into seven more parts. Section 2 refers our ex-
amination of technical analysis to related literature. Section 3 leads into the above-mentioned
three positions that guide our discussion. Section 4 presents the data that have been compiled
for this study. Section 5 describes the international evidence with respect to the importance of
using technical analysis by fund managers. Possible motivations for the important role of
technical analysis are analyzed in Sections 6 and 7. Section 8 concludes.
2 Literature
The questions whether and, possibly, why fund managers use technical analysis have not
been often directly examined before. Therefore, we want to relate our study to literature which
indeed provides two motivating lines of research—theoretical and empirical.
From the theoretical side of financial market research, the mainstream models of asset
pricing, such as the CAPM, are equilibrium models which do not care much about the process
towards an equilibrium (see the Grossman and Stiglitz, 1980, information paradox). Whenev-
er such a process involves a time-consuming path from one equilibrium to another, a chance
to learn efficiently by observing prices and by employing technical analysis for this purpose
may evolve (Hellwig, 1982; Treynor, 1985; Brown and Jennings, 1989).
The potential usefulness of technical analysis is even more evident if financial market
prices are influenced by non-fundamental behavior, a reasoning which is modeled for example
in noise trading models (e.g. De Long et al., 1990). Assuming that non-fundamental behavior
is not chaotic but has a systematic component (as behavioral finance does, e.g. Hirshleifer,
2001; Shiller, 2003), technical analysis may be an instrument to appropriately analyze this
component. Whereas technical analysis may occur in the general noise trader models, it is a
3 Again, the relation of using technical analysis with believing in an important role of psychology in
financial markets is found in foreign exchange too (see Taylor and Allen, 1992).

5
crucial ingredient in the more specific chartist-fundamentalist models, such as Frankel and
Froot (1990), Brock and Hommes (1998) or De Grauwe and Grimaldi (2006). These models
assume that market participants either prefer chartism (i.e. technical analysis) or fundamental-
ism (i.e. fundamentalist analysis) and that they may switch between both kinds of analysis
according to the profitability of these trading strategies in the preceding period. Simulations of
such models create complex price dynamics with outcomes similar to real world financial
markets. It is an interesting implication of the chartist-fundamentalist approach that both
groups will co-exist and can make money, i.e. also users of technical analysis.
The second line of literature motivating our research is evidence that technical analysis
may indeed play a relevant role in fund managers’ decision making. A prominent example is
the recent debate about momentum trading, i.e., a mechanical investment strategy whose cal-
culus is solely based on past asset returns (e.g. Jegadeesh and Titman, 2001; Griffin, Ji and
Martin, 2003; Li et al., 2008). Grinblatt, Titman and Wermers (1995) found for example that
most US mutual funds behave in a way consistent with momentum trading. So, backward-
looking investment behavior may be a common practice.4 Interestingly, and in contrast to the
scarcity of evidence on the use of technical analysis in fund management, there is plenty of
evidence on its use by traders in a particular financial market, the foreign exchange market.5 A
reasonable explanation for this difference may be—as we see later—that technical analysis is
even more important in foreign exchange.
3 Positions
We have structured the examination into the use of technical analysis by fund managers
and their possible motivation for doing so according to three positions already briefly men-
tioned in the introduction. These positions are stated with reference to the efficient market
hypothesis (EMH) and are developed in the following.
With reference to Fama’s (1970) seminal contribution, one might be tempted to say that
any use of technical analysis should be taken—in the present world of quite efficient mar-
kets—as a sign of limited rationality. Accordingly, there are fully rational users of fundamen-
tal analysis and less rational users of technical analysis. Due to their limited rationality, the
4 This is supported by some survey evidence from studies conducted in Germany; see Menkhoff
(1998) for fund managers with an international investment focus, Arnswald (2001) for equity fund
managers and Menkhoff, Schmidt and Brozynski (2006) for fund managers in equities and bonds.

6
latter will generate below market returns. This is clearly one way of looking at the widespread
use of technical analysis and we have named this our position 1. However, the finding that
most fund managers use this instrument and that it is most important for shorter-term deci-
sion-making definitely raises concerns as to whether outright irrationality will be the main
motivation of professionals for using technical analysis.
In order to overcome the simplistic identification of technical analysis with inefficiency,
it seems helpful to remember the origin of efficient markets, i.e., the power of competitive
market forces to arbitrage (risk-adjusted) excess returns away (Malkiel, 2003). The mention-
ing of excess returns implies the reference to a “normal” market return and the size of this
return follows from the appropriate market model. If we allow for the possibility that there is
not an undisputed fundamental equilibrium model—and there is a thorough discussion of
what this model should look like—then we cannot exclude the possibility that technical analy-
sis may be a rational tool for understanding financial markets. This perspective basically re-
duces the implication of market efficiency here to the condition that technical analysis should
not systematically generate excess returns, but allows for the possibility that the use of tech-
nical analysis may yield returns similar in size to “normal” market returns.6
This back-to-the-roots emphasis of efficient markets allows an understanding of the use
of technical analysis that does not automatically imply inefficiency: Technical analysis can be
a rational response to high information costs of fundamental analysis, which we have named
position 2. According to this position, heterogeneity of market participants is generated by
their different level of information quality (about fundamentals). As a consequence of infor-
mation differences, technical trading may yield lower returns than fundamental strategies be-
fore considering information costs but similar returns afterwards. Table 1 summarizes charac-
teristics of the positions 1 and 2 so far introduced and allows for an easy comparison between
them. This table also considers position 3.
Technical analysis may rationally reflect the fact that there is heterogeneous information
processing in the market, which we have named position 3. This heterogeneity may be due to
the fact that market participants possess different items of information—not different quality
5 Studies include Taylor and Allen (1992) on the UK, Menkhoff (1998) on Germany, Cheung and
Wong (2000) on Asian markets, Cheung and Chinn (2001) on the US and Cheung, Chinn and Marsh
(2004) on the UK. 6 It seems noteworthy in this respect that studies examining the risk-adjusted profitability of technical
analysis often find some value in following such strategies and that the critical issue is about returns
in excess of the regular market return (Park and Irwin, 2007). A good example seems to be the debate
about returns to momentum strategies.

7
levels as in position 2—or due to different ex ante beliefs about the right model, etc. The first
kind of heterogeneity, i.e. differences in information, can lead to a price discovery process
during which technical analysis may be a proper instrument to reveal superior knowledge and
thus to partially anticipate price development in the sense of Hellwig (1982) and others. The
second kind of heterogeneity, i.e. differences in beliefs, can lead to groups of market partici-
pants who are each characterized by their particular behavior. Pronounced examples of model-
ing such kind of heterogeneity are chartist-fundamentalist-models, as introduced in Section 2
above.
Obviously, the chartist-fundamentalist models are very closely related to position 3.
Both, that is the theoretical models as well as our more unspecific position, build on the idea
that there is heterogeneity and that the use of technical analysis is part of this heterogeneity.
As we will show in Section 5 below, fund managers do indeed rely to a remarkable degree on
technical analysis and related trading strategies, which is consistent with the chartist-
fundamentalist approach. However, due to our kinds of data, we analyze cross-sectional rela-
tions, whereas the chartist-fundamentalist approach basically refers to a time-series view. In
this sense, this approach reaches beyond our study. We simply provide direct information
about fund managers’ behavior and thus lend credibility to the chartist-fundamentalist ap-
proach.
Accepting that there are chartists in the market, their behavior may influence the market
outcome, as for example investigated by Schulmeister (2007). According to this argument,
technical analysis may have a self-fulfilling character. This possibility becomes more relevant
when the share of chartists is high and when counter-balancing forces are weak. We cannot
make a judgment on these conditions. Whatever the case, however, the outcome will be con-
sistent with position 3.
Overall, this paper takes the three positions as given and examines whether the use of
technical analysis by fund managers shows empirical patterns which are more or less consis-
tent with each of these positions.
4 Data
The data for this research are taken from a questionnaire survey conducted in 2003/04 in
Germany, Switzerland, United States, Italy and Thailand—in the order of data compilation.
We show that the data set provides reliable information and is largely representative for fund
managers in these countries.

8
The reason why we have conducted this survey is straightforward: There is no available
systematic information on the use of technical analysis by fund managers which we could ana-
lyze and there is no alternative method of getting this information than conducting a survey.
We are aware of objections to the survey approach and share the view that “revealed prefe-
rences” by trading data are superior to possible “cheap talk”. However, this is not the choice
here. The bottom line is either: Get survey information or have no information. Accordingly,
the use of survey information has a long-standing tradition of complementing more conven-
tional data when necessary. Examples with respect to financial markets include the financial
decision-making of households (Lease, Lewellen and Schlarbaum, 1974), the portrayal of
views from central bankers (Blinder, 2000), finance academics (Welch, 2000) or financial
executives (Brav et al., 2005) and the comparative analysis of individual and institutional in-
vestors’ views (Shiller and Pound, 1989).7 We conclude that questionnaire surveys can pro-
vide unique and important information; however, data must be reliable and representative.
In order to realize these goals, a series of intensive interviews with the members of the
target group in each country precedes each survey. We develop the questionnaire during the
course of these interviews until the first survey takes place in Germany and thereafter keep
this version almost unchanged (aside from some slight adjustment to the individual countries).
A pretest is conducted in all countries. In this manner, we are quite confident that the items
are formulated in such a way as to minimize misunderstanding. Moreover, we get support
from three apex organizations of asset management firms, the ones in Germany, Italy and
Thailand. In the US, we send out the questionnaire in cooperation with a US university. All
this probably signals to the fund managers that knowledgeable “others” also support the sur-
vey. Finally, there is hardly any incentive for professionals to make wrong statements. The
survey is anonymous, single responses cannot influence the outcome (due to overall sample
size) and, finally, there is no reason why fund managers should not be helpful.
Their major constraint is time; higher ranking fund managers may delegate the survey
response to junior staff, so it is therefore important for our research that it is not only marginal
persons in this business who respond. As regards the fund managers in our sample, Table 2
shows that the average respondent (equal weighting of countries) is about 35 to 42 years old,
has almost ten years’ professional experience in asset management and has successfully ab-
solved an academic education (about 90% of respondents). A potentially even more important
7 One may also consider the vast literature based on expectation data which are collected by surveys
(overview by MacDonald, 2000).

9
fact is that about every second respondent has a senior position, ranging from senior asset
managers to many chief investment officers or chief executive officers answering the ques-
tions. In addition to the figures for each of the five countries, the last column in Table 2 gives
figures for pooled sample.
With regard to the representation of various fields in fund management (see Table 2),
the sample comprises—with larger differences between countries—managers of mutual and
pension funds in almost equal proportions. Similarly, equity and bonds fund managers are
both well represented. Overall, the total sample size of 692 fund managers ensures that there
is enough variety and room for disaggregated analyses.
As far as the representation of firms is concerned, Table 3 shows that about 204 asset
management firms participate in the five countries. The response rate differs between coun-
tries and is highest in countries where we receive support from the apex organizations. The
highest absolute number of 74, however, comes from the US, where we approach—in light of
our limited resources—only the largest 250 firms. In order to test representativeness further,
we order participating firms—as far as we can identify responses—according to their assets
under management, then compare the distribution of our sample with that of the market.8
There are no significant differences in any country. Moreover, we find positive correlations
between the number of responses per firm with firm size.
Finally, there may be concerns with regard to the representativeness of technicians ver-
sus others in our sample. First, there may be a survivorship bias in favor of or against users of
technical analysis. Technicians would be overrepresented if technical trading strategies were
comparatively successful, thus driving out other fund managers who do not rely on them.
However, if the reverse were true, i.e. with technical trading strategies being less successful,
then technicians would be driven out of the market. It seems difficult to make any ex ante
judgment on such a possible distortion, but one can see ex post whether the one or the other
group is more successful in terms of career success; we do not find any evidence in either di-
rection (in the later Subsection 5.2 on personal characteristics), which cautiously indicates
usefulness of our sample.
Another, second, concern with regard to the representativeness of technicians stems
from possible time-dependent influences. During 2003/04, when the survey was conducted,
stocks were valued relatively low but were increasing in value over time. For example, the
8 Despite the opportunity to keep anonymity almost all firms have signalled their participation al-
though the fund managers themselves always stayed anonymous.

10
EuroSTOXX50 increased from about 2,300 to 2,800 during the survey period of about 15
months. So did this particular time-period favor, or rather disadvantage, the use of technical
analysis thus leading to distorted information? We analyze possible relations between the ex-
act time of the response and the use of technical analysis but cannot find any stable relation,
cautiously indicating that the sample will hardly be spoiled by such an effect.
Overall, the survey data are expected to provide reliable and largely representative in-
formation towards discovering the importance of technical analysis, a point which is analyzed
in the following section.
5 The importance of technical analysis
This section addresses the basic question regarding the role of technical analysis in fund
management: Is it important enough to deserve further attention? The survey provides a clear
answer, as in each country of our sample the vast majority of fund managers use technical
analysis. At forecasting horizons of up to some weeks—indicating tactical asset allocation
decisions—technical analysis is seen as even more important than fundamental analysis.
There is not much systematic information on the importance of technical analysis for
fund mangers that could guide our ex ante expectations. So we take findings from foreign ex-
change as a first rough benchmark. Starting with Taylor and Allen (1992), three stylized facts,
reported here in an abbreviated form, have emerged (Menkhoff and Taylor, 2007): First, al-
most all professionals use technical analysis to some degree, second, most professionals use
some combination of technical and fundamental analysis, and, third, technical analysis be-
comes relatively more important for shorter-term horizons.
In accordance with earlier surveys, we ask fund managers how much importance they at-
tach to either fundamentals or technical analysis or (order) flows. As can be seen from Table
4, there is a vast majority of 87% that use technical analysis at all; the figure is identical if we
calculate it as unweighted average of the five country means. If we request a higher hurdle to
accept the use as being really important for their decision making, we find that 77% still give
it a weight of 10% and more. Of course, with an even higher hurdle, the weights go down, as
shown in Table 4 for minimum levels of 20% and 30% importance. However, it seems note-
worthy that there are about 20% of fund managers who prefer the use of technical analysis

11
compared to fundamentals and flows; the figure is 18% if we calculate an average of country
means.9
Despite this importance of technical analysis—also indicated by an average importance
of 23%—it is fundamentals that, on average, clearly dominate at 67%, whereas flows (order
flow, observed transactions) lag behind at 10%. This pattern is quite robust across countries,
despite a few noticeable differences. The use of technical analysis in fund management is
highest in the three European countries and lowest in the US. This difference is statistically
highly significant, for both fundamental and flow analysis (see last column in Table 4). The
full distribution of answers is shown in Figure 1: The plane below the lines represents graphi-
cally the weight given to technical analysis in each country, whereas the plane above the lines
indicates the weight given to fundamentals and flows together. Interestingly, the US line inter-
sects the four other lines, demonstrating that it has the most extreme attitudes towards tech-
nical analysis, placing either no importance or—possibly less expected—very high importance
on it.
Such minor differences disappear, however, when we turn to the third stylized fact, i.e.,
the relationship of technical analysis with shorter-term horizon. The respective question di-
rectly asks fund managers for their typical forecasting horizon when applying these kinds of
information (for some trading rules horizons may differ from the “typical” horizon, see
Schulmeister, 2009). Figure 2 gives the distribution of answers. When looking, for example,
at the use of technical analysis by US fund managers, the most often applied horizon for this
instrument is weeks or a few months, whereas fundamentals are used at longer horizons, such
as many months, and flows are preferably applied at very short horizons, such as days. This
same pattern holds for fund managers from the four other countries as well. Thus, results are
consistent across countries and in line with findings for foreign exchange (Menkhoff and Tay-
lor, 2007).
In summary, 87% of fund managers use technical analysis to some extent, with a range
between the five countries of 68% to 94%. Technical analysis is consistently of particular im-
portance at a shorter-term (forecasting) horizon, such as weeks. At this horizon, technical
analysis is clearly more important than fundamentals or flows.
9 The importance of technical analysis is consistent with the finding that our fund managers rely to a
large degree on strategies with a technical appeal, i.e. momentum and tentatively also contrarian trad-
ing strategies. These strategies together receive a share of between 30 and 40% among five alterna-
tives of trading strategies, although their combined share is lower than that of fundamentalist strate-

12
6 Correlates of technical analysis
The following five subsections provide evidence on fund managers’ use of technical
analysis from five areas: Psychological influences, their personal, behavioral and business
characteristics and fund managers’ beliefs. In each section, we correlate fund managers’ res-
ponses, such as their education, with the degree to which these fund managers use technical
analysis. This provides detailed information about relations, which seems appropriate for an
explorative study and also helps to link some findings to earlier studies. Results are given
country by country, showing which relations are of a more general kind. Evidence is inter-
preted from the viewpoint of the three positions formulated.
6.1 Psychological influences
The investigation of a possible relation between using technical analysis and believing
in important psychological influences on financial markets has two motivations. First, there is
the literature which has inspired our position 3, formulated in Section 2 above. Heterogeneous
information processing can have different kinds of motivation, as we have argued, but one line
of argument is very straightforward: If there is a “social dynamic” (Shiller, 1984) with relev-
ance for price dynamics, then conventional capital market models will miss an important price
determinant. At the same time, technical analysis may, due to its approach, be able to capture
such dynamics. A second motivation to examine the nexus between technical analysis and
psychological influences is available evidence from foreign exchange. Several studies in this
field consistently report this relation, so that it is regarded as a stylized fact (Menkhoff and
Taylor, 2007). Does this relation also hold for fund managers in several countries?
Figure 3 presents the relation of interest by denoting the intensity of the use of technical
analysis to a survey item capturing psychological influences. Regarding the latter, fund man-
agers were asked to respond to the following statement with their individual degree of agree-
ment or disagreement: “People are not machines; thus, security prices are clearly more deter-
mined by psychological influences than by fundamentals” (emphasis added). Interestingly,
answers on average rather affirm than reject the statement (exact figures in later Table 8). Our
focus, however, is on the relation between technical analysis and psychological influences.
Figure 3 gives the frequency distribution of all responding fund managers regarding these two
gies. The use of both technical trading strategies is highly positively correlated to the use of technical
analysis. Details are available on request.
13
dimensions: A positive relation between the use of technical analysis (given in seven catego-
ries on the left axis) and a perceived dominance of psychological influences on prices (given
in six categories on the bottom axis) is easily visible in our sample. We will show later by
statistical analyses that this relation also holds in each country (Subsection 6.5) and that it
survives the consideration of any control variable (Section 7).
This evidence is consistent with position 3 and provides motivation to further examine
related beliefs of fund managers in more detail (see Subsection 6.5). Next, however, we ex-
amine personal characteristics.
6.2 Personal characteristics
This subsection contains a test of position 1, stating that users of technical analysis show
limited rationality or are characterized by other indicators of inferiority. We do not find any
evidence in support of this position, either for any characteristic or for any country in the sam-
ple.
It is at this point that we introduce the method that we apply as it is used in the same
way in the following subsections. First, we define information that might help us to test the
position, i.e., here to learn about the rationality of fund managers. It is obvious that we do not
have the direct knowledge about fund managers’ rationality that might be inferred by a psy-
chological test. However, survey information can be informative about personal characteris-
tics that are revealing with respect to rationality. We define four characteristics in this respect.
First, the age of fund managers indicates their accumulation of professional knowledge.
Assuming that good fund managers will be kept in the market and bad ones will be driven out
of it, older fund managers tend to be superior to younger colleagues. As a consequence of the
selection process, older fund managers should behave in a relatively rational way and thus
contribute better towards efficient markets. Second, one might prefer to reduce the informa-
tion contained in the age-variable to the professional experience in asset management. More
experienced fund managers are expected—in analogy to the above discussion—to be superior
to less experienced ones. Third, one can reasonably expect that education helps to improve
decision-making in fund management. Finally, we argue that fund managers in higher posi-
tions have proved their proficiency.
For these four characteristics, which supply information about the rationality and supe-
riority of fund managers, we compile survey information in an ordinal form. For example, age

14
is measured in six categories.10
Thus we choose a non-parametric rank correlation to infer
whether there is a significant relation between these characteristics and the degree to which
technical analysis is used. Table 5 presents the exact formulation of the four items in the ques-
tionnaire and the coefficients of correlation. We show the coefficients for the five countries
separately in order to examine robustness across countries; in addition we show coefficients
for the pooled sample.
Obviously, there is only one out of the possible 20 country coefficients statistically sig-
nificant at a level of at least 5%, i.e., better educated Thai fund managers use technical analy-
sis more. To control for some interdependencies between the four variables we also put them
into one ordered probit regression per country where the use of technical analysis is measured
in categories (not shown here). The formerly significant education variable in Thailand be-
comes insignificant, but position is positively correlated with technical analysis in the US and
Thailand, indicating that managers in better positions in these countries use this instrument
more. As this result seems to depend on the exact specification, we do not put too much em-
phasis on it but note that evidence—if anything—is rather against expectations derived from
position 1. In addition, the experience variable becomes significant in the pooled sample (col-
umn “ALL”). However, this result is basically driven by the coincidence of high experience
and comparatively little use of technical analysis in the US.11
We conclude that the use of technical analysis is unrelated to personal characteristics, a
finding that is in accordance with the literature in foreign exchange and that does not provide
evidence in favor of position 1.
6.3 Overconfidence
Studies examining behavioral distortions have shown some surprising results, in particu-
lar that professionals sometimes behave in an inferior way to laymen (e.g. Haigh and List,
2005). This motivates the testing of another dimension of “inferiority” in addition to the more
conventional indicators used in Subsection 6.2 above. We advance the test of position 1 by
linking indications of overconfidence to the use of technical analysis. Again, there is no robust
relation.
10
The reason for asking fund managers to give answers in categories is to increase the perception of
anonymity because a certain age may already be enough to identify the respondent in one’s firm. 11
If we rerun this analysis by normalizing the level of technical analysis across countries, i.e. focusing
on within country relations, the significance of the coefficient disappears completely.

15
Overconfidence is a general characteristic of investors, laymen and professionals alike.
In the past, overconfidence has mainly been seen as a distortion in decision-making that will
cause reduced investment performance (Barber and Odean, 2000). Recent research, however,
questions this interpretation. Oberlechner and Osler (2008) find that overconfidence does not
reduce performance of foreign exchange traders and Ko and Huang (2007) show that overcon-
fidence could lead to high information acquisition and thus improved market efficiency. Thus,
in case there is any relation between overconfidence and the use of technical analysis, it may
be worthwhile to dig deeper; in the first instance, however, the question arises whether the
potential relation of interest exists at all.
When analyzing overconfidence, Glaser and Weber (2007) find that different measures
of overconfidence may lead to inconclusive results. Accordingly, we include the three dimen-
sions of overconfidence as they have been found in earlier studies. The first dimension of
overconfidence is unrealistically positive self-evaluation (“better than average”), the second is
illusion of control and the third is miscalibration. We use basically the same items as Menk-
hoff, Schmidt and Brozynski (2006) in our survey to capture these dimensions and find, in-
deed, internationally uniform results. Table 6, Panel A shows for the first dimension—
unrealistically positive self-evaluation—that fund managers typically assess their own
achievements above average, as the mean values are between 2.7 for the US and 3.2 for Thail-
and, compared to a “market-neutral” self-assessment of 4 on a scale from 1 to 7. Moreover,
they rather claim not to be surprised by news and they underestimate return variance in their
forecasts. Thus, they are overconfident in each dimension, which we mention here to demon-
strate that our sample is not different from others.
These three items—indicating overconfidence—are then related to the use of technical
analysis. Table 6, Panel B presents the respective coefficients of rank correlations. One can
directly see that there is hardly any significant coefficient. Only Thai fund managers fulfill
expectations of position 1 to some degree (and Germans in one category to a marginal extent):
Those who are worse in calibration use technical analysis more intensively. Results are also
unconvincing for the pooled sample. Here, item 1 becomes significant, indicating that techni-
cians are less overconfident with respect to their achievements in asset management; but this
result is neither robust nor consistent.12
12
When we normalize country levels of the use of technical analysis, the coefficient on item 1 be-
comes borderline significant, whereas the coefficient on item 3 turns highly significant, showing a
positive relation between overconfidence and the use of technical analysis (results not shown here).

16
As an intermediate summary, the test of position 1 conducted in Subsection 6.2 (person-
al characteristics) and Subsection 6.3 (overconfidence) does not receive support: The use of
technical analysis appears to be unrelated to these indicators of personal or behavioral “defi-
ciencies”. Thus, we turn to position 2, arguing that fund managers using technical analysis
respond to their—institutionally caused—incentives.
6.4 Business characteristics
Institutional incentives clearly influence decision-making in financial markets and we
show that they are related to the degree at which technical analysis is used. This provides
some support for position 2.
We focus on the findings that larger financial institutions employ “better” analysts
(Hong, Kubik and Solomon, 2001; Clement and Tse, 2005) and that mutual fund managers are
exposed to fewer agency problems than pension fund managers, which may avoid costs that
draw on performance (Lakonishok, Shleifer and Vishny, 1992). These business characteristics
are proxied with the help of four indicators. First, larger firms, here asset management com-
panies with more assets under management, have better abilities to either create their own
research or to pay for qualified research from other sources. Assuming that fundamental re-
search is tentatively more expensive than technical analysis, this translates into larger firms
putting more emphasis on fundamentals and less on technical analysis. Another item is the
time fund managers can spend on data procurement and research. Again, we argue that more
time for research should allow more focusing on fundamental analysis.
Descriptive statistics for these items can be seen in Table 7, Panel A. Thai asset man-
agement firms are relatively small, with a mean volume of about 10 bn. USD, and Swiss res-
pondents’ firms are the largest in the sample, with a mean size of more than 50 bn. USD.13
In
any case, there is a lot of variation within each country and enough overlap in firm size be-
tween countries. In contrast to this heterogeneity, mean values for average time spent on re-
search are internationally similar (and range between 18.3 hours per week in Switzerland and
Thailand and 21.7 hours in Italy.)
Regarding the second kind of business characteristics mentioned above—pension vs.
mutual funds—we have asked fund managers about their major responsibility. Following La-
However, this holds only for the EuroSTOXX 50 and not for the Dow Jones and the sign is opposite
to the finding regarding item 1.
17
konishok, Shleifer and Vishny (1992), we argue that the agency problems in the pension fund
business do not support the reliance on fundamental analysis. Finally, we test whether bond
managers may have a different preference concerning the categories of analysis—there is no
ex ante expectation on this item, it serves mainly as a control variable. Descriptive informa-
tion on these items was provided in Table 2 above, showing that pension and mutual fund
managers are roughly balanced in the sample, whereas equity fund managers outnumber bond
fund managers by about two to one on average.
In contrast to the two previous subsections, Table 7, Panel B does indeed reveal consis-
tent significant coefficients of correlation. The firms’ size variable has the expected and statis-
tically significant sign in Germany, the coefficients in Switzerland and Thailand are borderline
significant (significant at the 10% level) and the remaining countries—US and Italy—have the
same negative sign as the three other countries. Taken together, and as evident in the full sam-
ple, these results provide evidence that fund managers in smaller asset management firms use
technical analysis more.
In order to further examine this relation, Panel C in Table 7 provides the mean impor-
tance of technical analysis in small versus large firms for all five countries. Obviously, each
country fulfills the expectation that technical analysis is used more in small than in large
firms. In the US, for example, values are 19% to 14%, so that managers in small firms use
technical analysis by 37% more than colleagues from large firms. Despite this clear difference,
behavior is so heterogeneous in this limited sample that the difference is not statistically sig-
nificant. This applies in a similar way to most other countries. Therefore, if we pool countries,
we find a difference of 25%, which is highly significant.
The result for the variable “time for research” tentatively supports the firm size variable.
The coefficients of correlation in Panel A show that fund managers from the US and Germany
with less time rely significantly more on technical analysis, which also dominates the pooled
sample. The other countries—with smaller sample sizes—do not reveal any significant coeffi-
cient.
Turning to the third item in Table 7—pension vs. mutual funds—there is no obvious re-
lationship within countries; the significant coefficient on the full sample is mainly driven by
country heterogeneity.14
For the last variable we find that bond managers in the US and Ger-
13
We do not distinguish between US dollar and euro as the exchange rate between these currencies
during the survey period was close to one. 14
Consequently, it becomes borderline significant if we normalize the use of technical analysis.

18
many rely more on technical analysis than equity managers, but the three other countries have
the opposite coefficient sign, being borderline significant for Italy and close to significance for
Switzerland. We therefore hesitate to put any general interpretation on the type of fund ma-
naged and the major investment segment.
In summary, the examination of business characteristics provides some tentative evi-
dence that technical analysis is used both by fund managers from smaller firms and those who
have less time for research. This suggests support for position 2, interpreting the use of tech-
nical analysis as a response to incentives, here as a second best solution to address constraints
in information-processing capacity. We now turn to tests of position 3.
6.5 Beliefs about fund managers’ behavior
If one allows for the possibility that markets do not always reflect the price of an undis-
puted equilibrium model but that there may be heterogeneity in information processing, this
provides a strong rationale for trying to understand such processes. Technical analysis may be
seen as an instrument for understanding price determinants that cannot be derived from a gen-
erally accepted fundamental model.
We examine in the following whether four statements indicating interesting beliefs are
related to users of technical analysis. First, a complex which is often mentioned as a short-
coming of real-world financial markets is the phenomenon of herding. We thus ask whether
herding is observable and, second, whether herding is beneficial in the sense that it benefits
the fund manager’s career. As our next step in this sequence, we ask, thirdly, whether herding
is practiced by the respondent in the sense that he generally follows the trend. Finally, we here
report statistics—comparable in form to the other items—on the relative importance of psy-
chological influences versus fundamentals (see Subsection 6.1). If the use of technical analy-
sis were indeed rooted in such beliefs then coefficients of relation should be negative—
according to our encodings.
The responses to these four items are presented in Table 8, Panel A. Obviously, fund
managers agree strongly on the notion of herding. However, small majorities reject the idea
that herding would benefit the career, the idea that they themselves follow the trend and that
psychological influences dominate fundamentals. With the exception of item 1, i.e., the obser-
vation of herding among fund managers, deviation around the mean is considerable, so that
opinions among responding fund managers are effectively inhomogeneous.

19
Table 8, Panel B presents—following our standard procedure—coefficients of rank cor-
relation of the four belief items with the use of technical analysis. The many significant coef-
ficients at the country level—and even more the pooled results—signal that these beliefs may
be helpful in understanding the use of technical analysis. Starting with the first item, techni-
cians are only slightly more persuaded than the average fund manager that herding is observa-
ble. Views of technicians become somewhat more pronounced when it comes to the benefits
of herding. Interestingly, support for a herding variable is strongest when we ask about the
managers’ own behavior (item 3): In four countries, fund managers do follow the trend more
strongly when they use technical analysis more. This sequence of three herding items indicates
that following the trend is the variable that distinguishes technicians from the others. Interes-
tingly, the view that herding is observable amongst professional asset managers is not a clear
characteristic of the users of technical analysis—implying that fundamentalists tend to share
this view. However, fundamentalists seem to draw a different conclusion from this observa-
tion. A fundamentalist position in the presence of herding will tend to be stabilizing, whereas
technical analysis can be both, stabilizing or destabilizing. The destabilizing part does not
need any explanation but technical analysis can also be stabilizing, for example when trends
towards the fundamental value are enforced or when turning points towards the end of bubble
periods are recognized in advance. Finally, the statement of the great importance of psycho-
logical influence on prices—which we had presented in Figure 3 above—is shared by propo-
nents of technical analysis to a statistically significant degree in all countries and matches the
observation of trend following among fund managers.
In summary, there is clear evidence in favor of position 3: The users of technical analy-
sis seem to have different views about financial markets, as they tentatively follow trends in
their decision-making and as they believe in a more important role of psychological influences
on pricing, consistent with their observation of herding in the market.
7 Multivariate correlates of technical analysis
In this section, we aggregate the information gained in Section 6 into multivariate re-
gressions. This allows us to assess the relative importance of relevant correlates as well as
their robustness when considering further possible determinants.
The multivariate regressions start with a specification considering only those variables
that were unanimously statistically significant in Section 6, i.e. two items from business cha-
racteristics (Table 7)—firm size and time for research—and the four items from beliefs about

20
asset managers’ behavior (Table 8)—herding amongst professional asset managers, herding
benefits career, trend following and psychological influences. We also include country dum-
mies allowing for country-specific levels in the use of technical analysis (see Table 4). The
result shows that most coefficients are statistically significant in the joint estimation with the
same sign as in the bivariate correlations, see column (1) of Table 9. Moreover, the size of
coefficients may be cautiously interpreted, as variables are similarly coded; only the item
”time for research” has roughly to be inflated by a factor of three. The coefficient sizes indi-
cate that belief variables are clearly most important in explaining the use of technical analysis.
This mainly confirms position 3 and also position 2, although more robustness tests seem to
be necessary.
In a subsequent step, we reduce the number of variables by excluding the two herding
items which are insignificant in specification (1) because they are highly correlated with the
further items about fund managers’ beliefs. The resulting specification (2) does not provide a
new insight. Thus, we add the four personal characteristics, i.e. age, experience, education and
position in specification (3). Again, the earlier results are robust. Finally, we include the two
most important indicators of overconfidence according to Subsection 6.3. These variables
show the same signs as before; i.e., they indicate a contradictory influence of overconfidence
on the use of technical analysis. Thus, position 1 does not receive support. We note that coun-
try dummies are almost unchanged through all specifications, i.e., the reason why they are not
listed in Table 9. In non-reported regressions we experiment with further specifications, con-
sidering either more or less or different sets of variables, but our main findings are unaffected
by these changes. This includes specifications with “normalized” levels of the use of technical
analysis.
8 Conclusions
From an academic point of view, the use of technical analysis is mostly looked upon
very skeptically, as it seems difficult to imagine why backward-looking behavior should help
investors to predict future returns. This skepticism is well expressed in Fama’s (1970) state-
ment that financial markets are weakly efficient, implying that the analysis of past prices can-
not provide profitable forecasts. In contrast to this established view in the finance profession,
practitioners seem to rely on technical analysis. This paper presents survey evidence from
fund managers in five countries in order to better understand this phenomenon: How impor-

21
tant is technical analysis among professionals nowadays, how do they use it and why do they
use it?
We present empirically substantiated answers to all the three questions just raised; find-
ings hold for each of the five countries examined: First, technical analysis is important, as the
vast majority of fund managers use it to some extent. Second, technical analysis is used in
preference as a complement to fundamental analysis. As such, it is used at shorter-term fore-
casting horizons. Up to horizons of weeks, it is more important than fundamental analysis in
all countries. Third, our evidence strongly supports what we have called position 3; that is the
view of heterogeneous information-processing in financial markets. Users of technical analy-
sis share the view that psychological influences are an important pricing determinant in finan-
cial markets, they tend to believe that herding is beneficial and thus rely on trend-following
behavior. We also find some support for position 2, indicating that high information costs of
fundamental analysis may contribute to the use of technical analysis. There is no consistent
evidence for position 1 that the users of technical analysis may be in some way inferior to oth-
er fund managers—they are equally well experienced, educated, successful and overconfident
in decision-making.
Overall, does this suggest that financial markets are inefficient? To be sure, this research
does not provide an answer to this question. We would prefer to take Fama’s (1970) advice
seriously, not to regard market efficiency too literally. There is obviously severe disagreement
about the most appropriate understanding of financial markets: Some fund managers seem to
believe more in the power of conventional fundamentals to explain returns, whereas others see
an important role for psychological influences. Finding consistent behavior among these pro-
fessionals may provide some reassurance: Each group will consider its own reactions as ra-
tional.

22
References
Arnswald, T., 2001. Investment behaviour of German equity fund managers: An exploratory
analysis of survey data. Deutsche Bundesbank Discussion Paper 08/01.
Barber, B.M., Odean, T., 2000. Trading is hazardous to your wealth: Common stock invest-
ment performance of individual investors. Journal of Finance 55, 773-806.
Blinder, A.S., 2000. Central-bank credibility: Why do we care? How do we build it? Ameri-
can Economic Review 90, 1421-1431.
Blume, L., Easley, D., O'Hara, M., 1994. Market statistics and technical analysis – the role of
volume. Journal of Finance 49, 153-183.
Brav, A., Graham, J.R., Harvey, C.R., Michaely, R., 2005. Payout policy in the 21st century.
Journal of Financial Economics 77, 483-527.
Brock, W.A., Hommes, C.H., 1998. Heterogeneous beliefs and routes to chaos in a simple
asset pricing model. Journal of Economic Dynamics and Control 22, 1235-74.
Brock, W.A., Lakonishok, J., LeBaron, B., 1992. Simple technical trading rules and the sto-
chastic properties of stock returns. Journal of Finance 47, 1731-1764.
Brown, D.P., Jennings, R.H., 1989. On technical analysis. Review of Financial Studies 2, 527-
551.
Chang, P.H.K., Osler, C.L., 1999. Methodical madness: Technical analysis and the irrationali-
ty of exchange-rate forecasts. Economic Journal 109, 636-661.
Cheung, Y.-W., Chinn, M.D., 2001. Currency traders and exchange rate dynamics: A survey
of the US market. Journal of International Money and Finance 20, 439-471.
Cheung, Y.-W., Chinn, M.D., Marsh, I.W., 2004. How do UK-based foreign exchange dealers
think their market operates? International Journal of Finance and Economics 9,
289-306.
Cheung, Y.-W., Wong, C.Y.-P., 2000. A survey of market practitioners' views on exchange
rate dynamics. Journal of International Economics 51, 401-423.
Clement, M.B., Tse, S.Y., 2005. Financial analyst characteristics and herding behavior in fo-
recasting. Journal of Finance 60, 307-341.
De Grauwe, P., Grimaldi, M., 2006. Exchange rate puzzles: A tale of switching attractors.
European Economic Review 50, 1-33.
De Long, J.B., Shleifer, A., Summers, L.H., Waldmann, R.J., 1990. Noise trader risk in finan-
cial markets. Journal of Political Economy 98, 703-738.

23
Davis, E.P., Steil, B., 2001. Institutional Investors. MIT Press: Cambridge.
Fama, E.F., 1970. Efficient capital markets: A review of theory and empirical work. Journal of
Finance 25, 383-417.
Frankel, J.A., Froot, K.A., 1990. Chartists, fundamentalists, and trading in the foreign ex-
change market. American Economic Review 80, 181-85.
Friesen, G.C., Weller, P.A., Dunham, L.M., 2009. Price trends and patterns in technical analy-
sis: A theoretical and empirical examination. Journal of Banking and Finance 33,
1089-1100.
Glaser, M., Weber, M., 2007. Overconfidence and trading volume. Geneva Risk and Insur-
ance Review 32, 1-37.
Griffin, J.M., Ji, S., Martin, J.S., 2003. Momentum investing and business cycle risk: Evi-
dence from pole to pole. Journal of Finance 58, 2515-2547.
Grinblatt, M., Titman, S., Wermers, R., 1995. Momentum investment strategies, portfolio
performance, and herding: A study of mutual fund behavior. American Economic
Review 85, 1088-1105.
Grossman, S., Stiglitz, J.E., 1980. On the impossibility of informationally efficient markets.
American Economic Review 70, 393-408.
Haigh, M.S., List, J.A., 2005. Do professional traders exhibit myopic loss aversion? An expe-
rimental analysis. Journal of Finance 60, 523-534.
Harris, R.D.F., Yilmaz, F., 2009. A momentum trading strategy based on the low frequency
component of the exchange rate. Journal of Banking and Finance 33, 1575-1585.
Hellwig, M.F., 1982. Rational expectations equilibrium with conditioning on past prices: A
mean-variance example. Journal of Economic Theory 26, 279-312.
Hirshleifer, D., 2001. Investor psychology and asset pricing. Journal of Finance 56, 1533-
1597.
Hong, H., Kubik, J.D., Solomon, A., 2000. Security analysts’ career concerns and herding of
earnings forecasts. Rand Journal of Economics 31, 121-144.
Jegadeesh, N., Titman, S., 2001. Profitability of momentum strategies: An evaluation of alter-
native explanations. Journal of Finance 56, 699-720.
Kavajecz, K.A., Odders-White, E.R., 2004. Technical analysis and liquidity provision. Re-
view of Financial Studies 17, 1043-1071.
Kliger, D., Kudryavtsev, A., 2008. Reference point formation by market investors. Journal of
Banking and Finance 32, 1782-1794.
24
Ko, K.J., Huang, Z., 2007. Arrogance can be a virtue: Overconfidence, information acquisi-
tion, and market efficiency. Journal of Financial Economics 84, 529-560.
Lakonishok, J., Shleifer, A., Vishny, R.W., 1992. The structure and performance of the money
management industry. Brookings Papers on Economic Activity: Microeconomics,
339-391.
Lease, R.C., Lewellen, W.G., Schlarbaum, G.G., 1974. The individual investor: Attributes and
attitudes. Journal of Finance 29, 413-433.
Li, X., Miffre, J., Brooks, C., O’Sullivan, N., 2008. Momentum profits and time-varying un-
systematic risk. Journal of Banking and Finance 32, 541-558.
Lo, A.W., Mamaysky, H., Wang, J., 2000. Foundations of technical analysis. Journal of
Finance 55, 1705-1765.
MacDonald, R., 2000. Expectations formation and risk in three financial markets: Surveying
what the surveys say. Journal of Economic Surveys 14, 69-100.
Malkiel, B., 2003. The efficient market hypothesis and its critics. Journal of Economic Pers-
pectives 17, 59-82.
Menkhoff, L., 1998. The noise trading approach – questionnaire evidence from foreign ex-
change. Journal of International Money and Finance 17, 547-564.
Menkhoff, L., Schmidt, U., Brozynski, T., 2006. The impact of experience on risk taking,
overconfidence, and herding of fund managers: Complementary survey evidence.
European Economic Review 50, 1753-1766.
Menkhoff, L., Taylor, M.P., 2007. The obstinate passion of foreign exchange professionals:
Technical analysis. Journal of Economic Literature 45, 936-972.
Nam, K., Washer, K.M., Chu, Q.C., 2005. Asymmetric return dynamics and technical trading
strategies. Journal of Banking and Finance 29, 391-418.
Oberlechner, T., Osler, C.L., 2008. Overconfidence in currency markets. Discussion Paper,
Brandeis University.
Osler, C., 2003. Currency orders and exchange-rate dynamics: An explanation for the predic-
tive success of technical analysis. Journal of Finance 58, 1791-1819.
Park, C.-H., Irwin, S.H., 2007. What do we know about the profitability of technical analysis?
Journal of Economic Surveys 21, 786-826.
Schulmeister, S., 2007. The interaction between the aggregate behavior of technical trading
systems and stock price dynamics. Working Paper, Austrian Institute of Economic
Research.

25
Schulmeister, S., 2009. Profitability of technical stock trading: Has it moved from daily to
intraday data? Review of Financial Economics 18, 190-201.
Shiller, R.J., 1984. Stock prices and social dynamics. Brookings Papers on Economic Activity
No.2, 457-498.
Shiller, R.J., 2003. From efficient markets theory to behavioral finance. Journal of Economic
Perspectives 17, 83-104.
Shiller, R.J., Pound, J., 1989. Survey evidence on diffusion of interest and information among
investors. Journal of Economic Behavior and Organization 12, 47-66.
Taylor, M.P., Allen, H., 1992. The use of technical analysis in the foreign exchange market.
Journal of International Money and Finance 11, 304-314.
Treynor, J.L., Ferguson, R., 1985. In defense of technical analysis. Journal of Finance 40, 757-
775.
Welch, I., 2000. Views of financial economists on the equity premium and on professional
controversies. Journal of Business 73, 501-537.
Zhu, Y., Zhou, G., 2009. Technical analysis: An asset allocation perspective on the use of
moving averages. Journal of Financial Economics 92, 519-544.

26
TABLE 1. Positions taken on the role of technical analysis
Characteristics Position 1 Position 2 Position 3
Core characteristic of positions Technical analysis as sign of less than fully
rational behavior
Technical analysis as rational response to
high information costs
Technical analysis as expression of differ-ent information or
belief sets
Drivers of heterogeneity Different degree of rationality
Different levels of in-formation quality
Different sets of in-formation or beliefs
Technicians are …
Less rational
Less well-informed
Less focused on fun-damental information
Rationality of technicians no yes may be
Return on technical analysis Below the average re-
turn of rational fun-damental investors
At the market level after considering in-
formation costs
The same risk-adjusted return as on fundamental trading
(after costs)
The Efficient Market Hypothesis is …
Fully appropriate Appropriate after cost adjustment
Less appropriate
TABLE 2. Information about responding fund managers
US GER CH ITA THAI ALL
Average age (in years) 42.5 35.6 38.7 36.0 35.3 37.3
Average professional experience (in years)
14.0 7.4 10.6 8.8 7.0 9.2
Academic education (in % of total) 81.8 86.8 86.8 93.5 96.0 88.5
Senior position (in % of total) (a) 84.8 68.0 92.9 83.3 61.9 74.4
Mutual fund managers (vs. pension funds, etc. in %)
42.0 39.1 50.0 79.0 61.5 51.2
Equity fund managers (vs. bond and money market funds in %)
64.8 73.9 77.8 53.4 44.7 63.8
(a) Senior position is defined as current position in a company not being classified as Junior asset manager but as either Senior asset manager, Head of asset management team or CIO / CEO.
TABLE 3. On the representativeness of responses
US GER CH ITA THAI
Number of individual responses 149 263 42 112 126
Number of responding firms 74 51 18 32 29
Share of responding asset managing firms 29.6% 77.3% 29.0% 58.2% 93.5%
H0: Structure of responding firms equals structure of the market
(a)
-1.213 (0.225)
-0.669 (0.503)
-0.385 (0.700)
-0.403 (0.687)
-0.136 (0.892)
(a) Firms are characterized by asset under management. For Switzerland, however, the number of mutual funds offered is used as a
proxy for the asset management industry. The figures given are the z-value of the Mann-Whitney U-test and the p-value in pa-
renthesis.

27
0%
10%
20%
30%
40%
50%
60%
70%
80%
90%
100%
0% 10% 20% 30% 40% 50% 60% 70% 80% 90% 100%
US
GER
CH
ITA
THAI
TABLE 4. The relevance of technical analysis
(a) We test the H0 that figures for the US and the group of European countries (GER, CH, ITA) are the same. The figures given are
the coefficients of the Mann-Whitney U-Test with p-value in ( ), rejecting the hypotheses.
Stars refer to level of significance: ***
1%.
Figure 1. The cumulative distribution of technical analysis’ importance(a)
(a) For the measure of technical analysis’ importance see Table 4.
For example, this figure shows, that among German fund managers about 7% of respondents do not use technical analysis at all, a few use it to 2% or to 5% or to 9% (altogether 12.3% use it to less than 10%); then there is a larger group who gives 10% importance to technical analysis, etc.
“How much importance do you attach to the following categories of information?”
Please assign 100 % altogether. If a category does not apply, please assign 0 % to it. ___ % Fundamentals (economic and political hard facts) ___ % Technical analysis (charts and quantitative indicators) ___ % (Order) Flows (observed transactions)
US GER CH ITA THAI ALL MWU-Test
(a)
Technical analysis mean 16.1 29.6 23.3 22.8 16.8 22.5 -8.756*** (0.000)
Fundamentals mean 77.9 59.6 66.2 65.6 70.9 67.0 -7.925*** (0.000)
Flows mean 5.9 9.6 10.5 11.6 12.3 9.7 -5.370*** (0.000)
TA > 0% 68.2 93.1 90.0 93.6 90.4 87.1
TA ≥ 10% 55.4 87.7 80.0 82.6 76.0 77.3
TA ≥ 20% 31.1 72.7 65.0 63.3 44.0 56.5
TA ≥ 30% 17.6 53.1 42.5 38.5 20.0 36.4
TA preferred 11.5 31.5 25.0 16.5 5.6 19.6
Relative importance of technical
analysis
Respondents

28
FIGURE 2. The importance of fundamentals, technical analysis and flows at different fore-
casting horizons
Question: “How far in advance reaches your personal forecasting horizon typically when applying the following types of information? Please give one answer each:” Fundamentals: ___ (minutes, hours, days, weeks, months, years) Technical analysis: ___ (minutes, hours, days, weeks, months, years) Flows: ___ (minutes, hours, days, weeks, months, years)
21.1
28.431.6
8.42.1
8.45.5
18.3
29.429.4
13.8
3.7
44.1
35.7
16.1
1.41.41.4
Intraday Days Weeks 2-6 Months 6-12 Months Years
US FUND MANAGERS
60
2.1
22.6
61.6
12.6
01.11.2 0.83.3
15.918.89.1
32.3
51.2
6.70.80
Int raday Days W eeks 2-6 Months 6-12 Months Years
2035
255.7
65.7
5.7 2.9 02.721.6
56.8
18.90 0
32.5
7.50 0
Intraday Days Weeks 2-6 Months 6-12 Months Years
SWISS FUND MANAGERS
GERMAN FUND MANAGERS
12.4
38.231.5
14.6
1.12.23.8
27.6
45.7
15.2
4.8 2.91.9 0.9
49.1
33.3
13.9
0.9
Intraday Days Weeks 2-6 Months 6-12 Months Years
ITALIAN FUND MANAGERS
0 0 0
12.3
40.4
12.3
35.1
0.8
22.5
55.8
1.7
19.2
12.1
39.542.7
2.41.61.6
Intraday Days W eeks 2-6 M onths 6-12 M onths Years
Flows Technical Analysis Fundamentals
THAI FUND MANAGERS

29
0%
2%
4%
6%
8%
10%
12%
14%
0
0<x<=10
10<x<=20
20<x<=30
30<x<=40
40<x<=50
x>50
1 2 3 4 5 6
FIGURE 3. Perceived psychological influences and the use of technical analysis
This figure plots responses on the item “use of technical analysis (see Table 4) and on the following item : “People are not machines; thus security prices are clearly more determined by psychological influences than by fundamentals”. There are 6 answering categories, ranging from “disagree completely” (coded as 1) to “agree completely” (coded as 6).
Perceived dominance of psycho-
logical influences on prices
The use of technical analysis (in %)
Frequency of responses
(total=100%)

30
TABLE 5. Personal characteristics and the use of technical analysis
(1) Item(a)
: “How old are you?” ( < 31 [1], 31-35 [2], 36-40 [3], 41-45 [4], 46-50 [5], > 50 [6] )
(2) Item(a):
“Professional experience in asset management (in years)” ( < 4 [1], 4-6 [2], 7-9 [3], 10-12 [4],13-15 [5], > 15 [1] )
(3) Item(a)
: “Educational level” (Non-academic education [1], Academic education [3])
(4) Item(a)
: “Current position within your company” (Junior asset manager [1], Senior asset manager [2], Head of asset management team [3], CIO / CEO [4])
(a) Response categories and encodings in [ ] in parenthesis.
(b) The figures given are the coefficient of the Spearman rank correlation with p-value in parenthesis.
Stars refer to level of significance: * 10%,
** 5%,
*** 1%.
For example, the coefficient of 0.108 for “Germany” and “Higher age” shows that older fund managers in Germany use tech-nical analysis more than younger ones (i.e. that they give relative more importance to technical analysis according to the measure introduced in Table 4).
Coefficients of rank correlation with the use of technical analysis(b)
US GER CH ITA THAI ALL
(1) Higher age -0.085 (0.306)
0.108*
(0.083)
-0.050 (0.760)
0.075 (0.442)
-0.060 (0.505)
-0.057 (0.139)
(2) More experience -0.094 (0.259)
0.039 (0.534)
-0.147 (0.370)
0.068 (0.494)
0.041 (0.647)
-0.099**
(0.011)
(3) Better education -0.032 (0.707)
-0.087 (0.167)
-0.039 (0.821)
0.017 (0.862)
0.243***
(0.006)
0.000 (0.991)
(4) More senior position
0.057 (0.501)
0.059 (0.351)
-0.094 (0.563)
-0.056 (0.578)
0.034 (0.709)
0.000 (0.991)

31
TABLE 6. Overconfidence and the use of technical analysis
(a) Response categories and encodings in [ ] in parenthesis.
(b) N is the number of responses.
(c) The width is calculated as (expected maximum level- expected minimum level) / average index level.
(d) The figures given are the coefficient of the Spearman rank correlation with p-value in parenthesis.
Stars refer to level of significance: * 10%,
** 5%,
*** 1%.
(1) Item(a)
: “How do you assess your achievement in asset management – compared to other asset manag-ers´ achievement in the same investment segment?” (much better [1], …, much worse [7])
(2) Item(a)
: “Most of the published business news does not surprise me at all.” (complete approval [1], …, complete contradiction [6] )
(3) Item(a)
: “Please estimate the development of the EuroSTOXX 50 and the Dow Jones within the next month. Please forecast the performance of the respective index with a probability of 90%.” (Today’s level, expected minimum level, expected maximum level.)
PANEL A Response category
(b)
Descriptive statistics
US GER CH ITA THAI ALL
(1) Comparatively worse achievement
Mean
N
2.7 145
3.1 249
3.0 39
2.9 104
3.2 122
3.0 659
(2) News does surprise Mean
N
3.1 148
3.2 262
3.1 39
3.5 106
3.1 126
3.2 681
(3) 90% width of index forecast: - EuroSTOXX 50
Mean(c)
N
15.7% 38
23.3% 213
29.6% 30
11.2% 78
15.9% 119
19.3% 478
- Dow Jones Mean
N
28.1% 74
16.8% 211
49.2% 30
9.0% 76
12.9% 98
18.5% 489
Share of correct estimations:
- EuroSTOXX 50
N
52.6% 20
92.1% 199
66.7% 20
66.7% 52
-
- Dow Jones
N
68.1% 47
67.6% 144
50.0% 15
66.7% 50
-
PANEL B Coefficients of rank correlation with the use of technical analysis(d)
US GER CH ITA THAI ALL
(1) Comparatively worse achievement
0.102 (0.226)
0.091 (0.156)
-0.177 (0.288)
-0.005 (0.963)
0.089 (0.331)
0.114*** (0.003)
(2) News does surprise -0.033 (0.695)
-0.054 (0.383)
0.237 (0.153)
-0.027 (0.785)
0.122 (0.176)
0.006 (0.867)
(3) 90% width of index forecast: - EuroSTOXX 50
-0.207 (0.213)
-0.124* (0.071)
0.156 (0.410)
0.064 (0.581)
-0.382*** (0.000)
-0.047 (0.311)
- Dow Jones -0.009 (0.942)
-0.077 (0.268)
0.053 (0.780)
0.055 (0.635)
-0.313*** (0.002)
-0.037 (0.421)

32
TABLE 7. Business characteristics and the use of technical analysis
(1) Item(a)
: “Your company’s total volume of asset under management (in billion of US dollar or euro)” ( < 5 [1], 5-10 [2], 10-20 [3], 20-50 [4], 50-100 [5], > 100 [6] )
(2) Item(a)
: “Average period of data procurement and research” (hours per week)
(3) Item(a)
: “Type of managed fund” (mutual fund [1], restricted / special / pension fund [3])
(4) Item(a)
: “Major investment segment” (equities [1], bonds and money market [3])
PANEL A Response category
(b)
Descriptive statistics
US GER CH ITA THAI ALL
(1) Firm size Mean
N
3.7 145
4.0 258
4.7 40
3.0 102
2.5 123
3.6 668
(2) Time for research Mean
N
21.0 122
20.1 189
18.3 30
21.7 65
18.3 112
20.0 518
PANEL B Coefficients of rank correlation with the use of technical analysis(c)
US GER CH ITA THAI ALL
(1) Larger firm size -0.051 (0.542)
-0.230***
(0.000)
-0.294*
(0.073)
-0.086 (0.393)
-0.150*
(0.099)
-0.088**
(0.024)
(2) More time for research -0.211**
(0.019)
-0.175**
(0.017)
-0.180 (0.359)
0.106 (0.402)
-0.100 (0.294)
-0.121***
(0.006)
(3) Pension fund (vs. mutual) 0.116 (0.251)
100
0.113 (0.108)
204
0.255 (0.182)
29
-0.085 (0.402)
99
0.129 (0.308)
64
0.107**
(0.017) 496
(4) Bonds investment (vs. equities)
0.221**
(0.013) 124
0.125*
(0.065) 220
-0.307 (0.119)
27
-0.199*
(0.093) 72
-0.107 (0.285)
102
-0.008 (0.851)
545
PANEL C Response category
(b)
Descriptive statistics
US GER CH ITA THAI ALL
Technical analysis in small firms
(d)
Mean in %
N
19.2 68
35.3 108
28.6 10
23.4 61
18.4 63
25.8 310
Technical analysis in large firms
(d)
Mean in %
N
14.0 76
25.8 147
20.2 28
21.8 39
15.4 59
20.6 349
Relative use in small firms
37.1% 36.8% 41.6% 7.3% 19.5% 25.2%
Difference signifi-cant
(e)
-0.838 (0.402)
-4.203***
(0.000)
-1.356 (0.175)
-0.532 (0.595)
-1.186 (0.235)
-3.267***
(0.001) (a)
Response categories and encodings in [ ] in parenthesis. (b)
N is the number of responses. (c) The figures given are the coefficient of the Spearman rank correlation with p-value in parenthesis. (d)
The differentiation in small and large firms is based on the answering categories of item (1) in this Table. Thus, small firms are
those companies with a volume of asset under management of less than 20 billion $ (encodings 1-3), large firms are those with a volume of asset under management of more than 20 billion $ (encodings 4-6). For Thailand small firms are defined through vo-lume of asset under management of less than 10 billion $ (encodings 1-2), large ones are those with asset under management of more than 10 billion $ (encodings 3-4).
(e) The figures given are the z-value of the Mann-Whitney U-test and the p-value in parenthesis. H0 states that there is no difference
in the use of technical analysis between the respective groups of comparison.
Stars refer to level of significance: * 10%,
** 5%,
*** 1%.

33
TABLE 8. Beliefs about fund managers’ behavior and the use of technical analysis
(a) There are 6 answering categories, ranging from “agree completely” (coded as 1) to “disagree completely” (coded as 6). Thus, a
mean of 3.5 or less indicates rather approval to the statement. N is the number of responses. (b) The figures given are the coefficient of the Spearman rank correlation with p-value in parenthesis.
Stars refer to level of significance: * 10%,
** 5%,
*** 1%.
(1) Item: “Herding is observable amongst professional asset managers.”
(2) Item: “Following the herd benefits the asset manager’s career.”
(3) Item: “I generally follow the trend.”
[(4) Item: “People are not machines; thus security prices are clearly more determined by psychological influences than by fundamentals.”]
PANEL A Response category
(a)
Descriptive statistics
US GER CH ITA THAI ALL
(1) Herding amongst profession-als
Mean 2.2 2.3 2.2 2.5 2.9 2.4
(2) Herding benefits career Mean 4.2 3.9 3.6 4.2 3.7 4.0
(3) Follow the trend Mean 4.4 3.7 4.0 3.9 3.3 3.8
[(4) Dominance of psychological influences on prices]
Mean 3.2 2.8 2.7 3.0 3.3 3.0
PANEL B Coefficients of rank correlation between statements of behavior and technical analysis
(b)
US GER CH ITA THAI ALL
(1) No herding amongst professionals 0.047 (0.574)
-0.148**
(0.017)
-0.081 (0.625)
-0.140 (0.149)
-0.161*
(0.074)
-0.115***
(0.003)
(2) Herding does not benefit career -0.272***
(0.001)
-0.220***
(0.000)
-0.006 (0.974)
0.104 (0.288)
-0.130 (0.152)
-0.160***
(0.000)
(3) Do not follow the trend -0.309***
(0.000)
-0.329***
(0.000)
-0.151 (0.367)
-0.268***
(0.006)
-0.322***
(0.000)
-0.335***
(0.000)
[(4) No dominance of psychological influences]
-0.257***
(0.002)
-0.261***
(0.000)
-0.371**
(0.020)
-0.236**
(0.014)
-0.289***
(0.001)
-0.321***
(0.000)
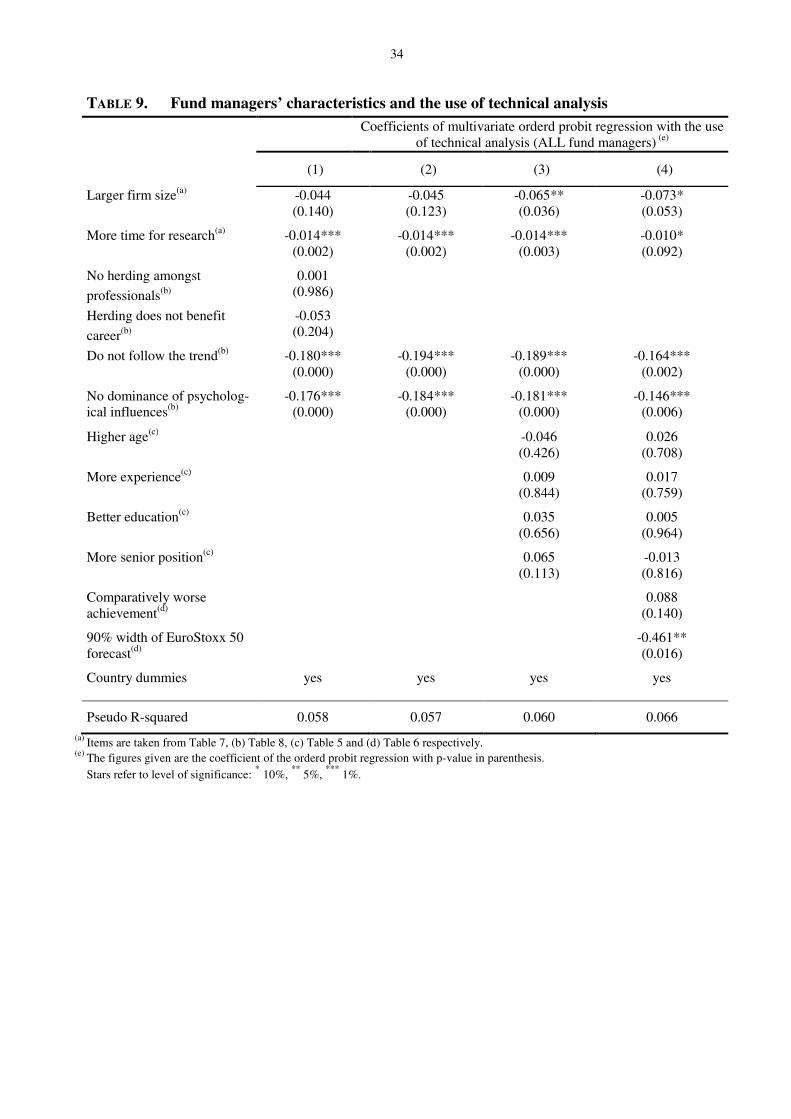
34
TABLE 9. Fund managers’ characteristics and the use of technical analysis
Coefficients of multivariate orderd probit regression with the use of technical analysis (ALL fund managers)
(e)
(1) (2) (3) (4)
Larger firm size(a)
-0.044 (0.140)
-0.045 (0.123)
-0.065** (0.036)
-0.073* (0.053)
More time for research(a)
-0.014*** (0.002)
-0.014*** (0.002)
-0.014*** (0.003)
-0.010* (0.092)
No herding amongst
professionals(b)
0.001 (0.986)
Herding does not benefit
career(b)
-0.053 (0.204)
Do not follow the trend(b)
-0.180*** (0.000)
-0.194*** (0.000)
-0.189*** (0.000)
-0.164*** (0.002)
No dominance of psycholog-ical influences
(b)
-0.176*** (0.000)
-0.184*** (0.000)
-0.181*** (0.000)
-0.146*** (0.006)
Higher age(c)
-0.046 (0.426)
0.026 (0.708)
More experience(c)
0.009 (0.844)
0.017 (0.759)
Better education(c)
0.035 (0.656)
0.005 (0.964)
More senior position(c)
0.065 (0.113)
-0.013 (0.816)
Comparatively worse achievement
(d)
0.088 (0.140)
90% width of EuroStoxx 50 forecast
(d)
-0.461** (0.016)
Country dummies yes yes yes yes
Pseudo R-squared 0.058 0.057 0.060 0.066
(a) Items are taken from Table 7, (b) Table 8, (c) Table 5 and (d) Table 6 respectively.
(e) The figures given are the coefficient of the orderd probit regression with p-value in parenthesis.
Stars refer to level of significance: * 10%,
** 5%,
*** 1%.