Embed Size (px)
Citation preview

Journal of Labor Economics, 16, forthcoming, 1998.
The Use of Replacement Workers in Union Contract Negotiations:The U.S. Experience, 1980-1989
Peter C. Cramton and Joseph S. Tracy*
Abstract
It is argued in many circles that a structural change occurred in U.S. collective bargaining in the 1980s.Strike incidence declined, dispute incidence increased, and the composition of disputes shifted away fromstrikes and toward holdouts. We investigate the extent to which the hiring of replacement workers canaccount for these changes. For a sample of over 300 major strikes since 1980, we estimate the likelihood ofreplacements being hired. We find that the risk of replacement is lower for bargaining units with moreexperienced workers, and declines during tight labor markets. The composition of disputes shifts awayfrom strikes as the predicted risk of replacement increases. In addition, the overall level of disputesincreases as a result of the shift in the composition of disputes. Based on our estimates reducing thepredicted replacement risk faced by bargaining units to the pre-1982 levels would have lead to a reductionin the dispute incidence by around 5 percentage points, an increase in the fraction of disputes involving astrike by around 4 percentage points, and an increase in the strike incidence by around 0.8 percentagepoints.
*University of Maryland and Federal Reserve Bank of New York. Funding has been provided by theNational Science Foundation. We thank the Bureau of National Affairs for providing us with wage andstrike information. We thank workshop participants at the City University of New York, U.S. Departmentof Justice, University of North Carolina, University of Maryland, University of Pittsburgh, and U.S. CensusBureau for their helpful comments. The views expressed in the paper are those of the authors and are notnecessarily reflective of views at the Federal Reserve Bank of New York or the Federal Reserve System.

2
It is widely believed that U.S. collective bargaining has changed substantially in the 1980s from
earlier decades.1 One piece of evidence used to support this view is that strike activity as measured by the
Bureau of Labor Statistics (BLS) declined by over 50% from its level in the 1970s. Less well known is that
the overall level of labor disputes increased in the 1980s. The decline in strike incidence was the result of a
shift in the composition of labor disputes. Cramton and Tracy (1992) demonstrate that a sharp increase
occurred in the percentage of labor disputes that are settled without a strike under an extension of the
expired contract (a "holdout").
The reason(s) for the increase in overall disputes and the shift in the composition of disputes has yet
to be empirically established. Labor leaders argue that a change in collective bargaining tactics has been
necessitated by the increased tendency for firms to hire replacement workers if the union calls a strike.
Organized labor has lobbied for several years for Congress to "restore the strike threat" by amending the
labor law to ban the use of permanent replacements.2 Careful consideration of such legislation is hampered
by the lack of any comprehensive analysis of the use of replacement workers in the U.S..
In this paper, we begin to answer the question of whether the changes in collective bargaining
outcomes in the 1980s can be explained by the use of replacement workers. We analyze the most
comprehensive data collected to date on the use of replacement workers in U.S. union contract negotiations
for the 1980s. We present a detailed description of the determinants of the firm's decision to hire
replacement workers during a strike. We show that the replacement risk facing a union varies
systematically with the work experience of its members and the tightness of the local labor market. We use
this systematic variation in replacement risk to measure its impact on the union's threat choice between
strike and holdout. We find that increases in the predicted replacement risk significantly increases the
likelihood that the union selects the holdout threat; that the induced reduction in the likelihood of a strike
given a dispute increases the probability of a dispute; and that the net impact is a small reduction in the
overall strike incidence. Our best estimate is that increased use of replacements can explain about half of
the unaccounted for shifts in bargaining outcomes in the 1980s.
The outline of the paper is as follows. In section 1 we summarize our earlier efforts at establishing
that the shift in collective bargaining patterns represents a change in the process of bargaining. In section 2
we summarize the existing empirical literature on replacement workers. In section 3 we discuss our data
collection efforts and present an overview of the use of replacement workers in the 1980s. In section 4 we
1See Cappelli (1982), Freedman (1982, 1985), and Mitchell (1982, 1983) for related discussions.
2The first bill was introduced into Congress in 1988 by Representative Brennan which proposed banning the use ofpermanent replacements during the initial ten weeks of a strike. A strengthened version of this bill was introduced intothe 101st Congress (H.R. 3936 & S. 2112) which proposed completely banning the use of permanent replacements. In1992, similar legislation passed in the House but failed in the Senate. In 1993, the replacement bill was reintroduced(H.R. 5 & S. 55). On 8 March 1995, President Clinton signed an executive order banning the federal government fromdoing business with firms that use permanent replacements.

3
present a simple model of the firm's decision to use replacements. Our empirical implementation of this
model is given in section 5. We evaluate the economic significance of our findings, and compare them to
estimated replacements effects from Canadian data. The paper ends with a summary of our findings.
I. A Perspective on Collective Bargaining in the 1980s
The 1980s proved to be a difficult decade for the U.S. labor movement. The private sector
unionization rate fell into single digits leaving many to wonder if unions would soon become an
anachronism. In the U.S., unions like politicians are typically measured by the general populace in terms of
their impact on the pocketbook. The changing economic and political landscape in the 1980s may have
seriously imperiled the ability of unions to produce visible benefits for their members.3
Many of the benefits of unionization are embodied in the labor contracts they negotiate. The process of
labor contract negotiations, then, is vital to the institutional interests of unions. An examination of the
collective bargaining process in the 1980s reveals significant changes from the 1970s. Cramton and
Tracy (1992) emphasize that unions have multiple threat options available when a labor contract expires.
The union can either call a strike or extend the former contract, a holdout. In a holdout, the union applies
pressure on the firm through a work-to-rule, slow-down, or other “in-plant” strategies. Holdouts need not
involve the large costs common to strikes. Indeed, the theory applies regardless of the extent of holdout costs
(and is largely invariant to the size of these costs). The cost may simply be from maintaining the possibility of
a strike, rather than from more aggressive in-plant strategies by the union. Figure 1 illustrates that the incidence
of strikes fell in the 1980s while the incidence of holdouts rose sharply, resulting in an increase in the overall
dispute incidence.
Holdouts are defined as in Cramton and Tracy (1992) to be any contract signed without a strike more than
one day after the prior contract expiration. Dispute incidence is defined as the sum of the strike and holdout
incidence. Our choice of this definition of a holdout is motivated by the strong deadline effect which is
exhibited in the data. The empirical hazard rate into settlement is quite high on the expiration date of the
previous contract as well as the following day. The settlement rate declines significantly between the first and
second day following the prior expiration date, and remains roughly flat over the next month. Nonetheless,
it is surely the case that some holdouts are misclassified using our procedure. For example, it may be that a
settlement is reached at the contract expiration, but that it is not ratified until several days after expiration.
Alternatively, some settlements may involve periods of costly holdout before contract expiration, and hence
are better classified as holdouts. Unfortunately, data on the size and timing of bargaining costs does not exist.
3See Farber and Krueger (1992) for an analysis of changing worker attitudes toward unions. Another indication ofthis weakness is the recent merger activity between the United Rubber Workers and the United Steel Workers, andbetween the United Auto Workers, the United Steel Workers and the International Association of Machinists.

4
We simply do the best we can with the best data that is available. The upward trend in holdouts in the 1980s,
though, is robust to defining a holdout using a 7-day window and a 30-day window between the prior
expiration date and the beginning of the holdout. If classification errors are more likely with short duration
holdouts, then the trend is unlikely to be due to increased classification problems in the 1980s.
An explanation for this increase in dispute incidence and shift in the composition of labor disputes has
not been demonstrated to date. Labor leaders emphasize the growing risk of union workers being replaced in
the event of a strike.4 In August 1981, President Reagan replaced the air traffic controllers after their union,
PATCO, called an illegal strike. As a result of the President's action, the union was decertified.5 Unions claim
that this dramatic action signaled to the private sector that hiring replacements is both legal and acceptable.
The Industrial Union Department of the AFL-CIO in a 1986 manual for its union leaders titled The Inside
Game: Winning With Workplace Strategies argues that the threat of replacement has significantly diminished
the attractiveness of the strike threat relative to the holdout threat:
To be sure, the strike in many cases is still a powerful and effective weapon. But when an employer begins trying
to play by the "new rules" and actually force a strike, staying on the job and working from the inside may be more
appropriate (page 5, emphasis in original).
Whether the 1980s represent a structural break in the process of collective bargaining is addressed in
Cramton and Tracy (1994). We estimate the first empirical model of the determinants of labor disputes, and
the composition of these disputes between strikes and holdouts. The observed changes in the patterns of strike
and holdout incidence illustrated in Figure 1 could be the result of changes in the economic environment, rather
than of changes in the collective bargaining process itself. Using data on twelve hundred major contracts
negotiated between 1970 and 1989, we find mixed evidence supporting the structural change hypothesis.
Without controlling for any covariates, dispute incidence in the post-PATCO period is only 2.3
percentage points higher than in the earlier period, an insignificant difference. Once we control for changes
in the underlying covariates, the difference increases to 7.5 percentage points and is significant. If we replace
the post-PATCO indicator with individual year effects for 1982-1989, we find that the year effects are jointly
significant, although only 1986 is individually significant. The point estimate indicates that the actual dispute
incidence was 27 percentage points higher than predicted in 1986.
4The right of firms to hire replacement workers during an economic strike was upheld by the Supreme Court in its1938 decision Mackay Radio & Telegraph Co. v. NLRB (304 U.S. 333). Once the strike is settled, the firm mustrestrict its future hiring from within the bargaining unit.
5On 12 August 1993, President Clinton lifted the ban on hiring former PATCO members that had participated in thestrike.

5
Similarly, without controlling for any covariates the fraction of disputes involving a strike is 13
percentage points lower in the post-1981 period, a significant difference. When we control for the covariates
suggested by our bargaining model (Cramton and Tracy 1992), this difference falls to 7.5 percentage points
and is only marginally significant. Replacing the post-1981 indicator with eight year indicators, we find that
the year effects are jointly insignificant and that 1989 is the only individually significant year effect.
To test for the stability of our estimated bargaining model over the two decade period, we interact the
post-1981 indicator with each variable in our empirical model. The chi-square statistic (probability value) for
the joint significance of the intercept and slope interactions is 26.1 (0.02), and for the slope interactions alone
is 23.4 (0.02). The interactions with the industry employment residual and the real wage change over the prior
contract were both individually significant. In contrast to the evidence regarding a shift in the overall
composition of disputes, there is clearer evidence that the responsiveness of the union's threat choice to
underlying economic variables has shifted since 1981.
The key interaction from the viewpoint of the theory is with the real wage change over the prior contract.
Our bargaining model predicts that the attractiveness of the strike threat decreases as the real wage at the end
of the prior contract increases. This suggests a negative coefficient on the real wage change over the prior
contract in predicting the likelihood of a strike given a labor dispute. The data indicate an increase in the
marginal effect associated with the real wage change of 13 percentage points between the pre- and the post-
1981 period, a statistically significant change. This increase is sufficient to reverse a negative and significant
coefficient on the real wage change for the 1970-81 period to a positive and marginally significant coefficient
for the 1982-89 period.
II. Summary of Replacement Worker Literature
There are only a handful of papers that analyze data on the use of replacement workers in U.S. contract
negotiations. This reflects the difficulty in obtaining replacement data. The General Accounting Office (GAO
1991) undertook a study of the use of replacements at the request of the Senate Subcommittee on Labor which
was considering replacement legislation. The GAO obtained data from the Federal Mediation and Conciliation
Service (FMCS) on all strikes in 1985 and 1989.6 They surveyed the firm and union involved in all major
strikes (those involving at least 1,000 workers) and a random sample of the smaller strikes. From this data, the
GAO reports that 11% (17%) of major (smaller) strikes in 1985 involved replacements, and 9% (16%)
involved replacements in 1989. The GAO also reports that the occurrence of replacements was three times
higher in strikes which lasted at least a month in duration.
6Only bargaining units covered by the National Labor Relations Act (NLRA) are required to file with the FMCSbefore a strike. As a result, the GAO sample excludes negotiations in the trucking and airline industries, which arecovered by the Railway Labor Act.

6
Olson (1991) reports on the use of replacements in major U.S. strikes between 1984-1988, and in New
York strikes for three periods before the NLRA. For the 1980s, Olson finds that the incidence of replacements
is 10.5%. For the earlier periods, Olson finds that the use of replacements ranged from a low of 1.5% in 1926-
31 to a high of 61% in 1881-86. Like the GAO report, Olson also finds that the use of replacements is
associated with longer strike durations. Interpreting this correlation is difficult, however, without information
on the timing of the hiring of the replacements. The finding is consistent with the hazard rate from strike to
settlement being higher, lower, or unchanged following the hiring of replacements.
Based on a sample of thirty-five large strikes in the U.S. and twenty-one small strikes in New York from
1984 to 1988, Gramm (1991) reconfirms that strike durations are much longer when permanent replacements
are hired. Gramm reports that permanent replacements were hired in 20% of her strikes and temporary
replacements in 8%. Gramm's data also includes information on the firm's operating capacity during the strike.
In the U.S. sample, the mean operating capacity was 57% with no replacements, 90% with temporary
replacements, and 77% with permanent replacements. In the New York sample, the mean operating capacity
was around 60% regardless of the use of replacements.
Schnell and Gramm (1994) and Gramm and Schnell (1994) extend Gramm's earlier work. Schnell and
Gramm (1994) examine the GAO replacement data. They classify strikes into three categories: no intent to hire
permanent replacements was given and no permanent replacements were hired (64.5% of the sample), intent
to hire permanent replacements was given but no permanent replacements were hired (15.5% of the sample),
and intent to hire permanent replacements was given and permanent replacements were hired (19.9% of the
sample). They estimate a Cox proportional hazard model of strike durations controlling for the bargaining unit
size, establishment size, state unemployment rate, an indicator for whether the observation came from the 1985
sample, an indicator for replacement intent given but no replacements hired, and an indicator for replacement
intent given and replacements hired. Both replacement indicators are negative and significant in the overall
sample. Unfortunately, Schnell and Gramm can not control for the timing of the announcement of the intent
to hire permanent replacements nor the decision to hire permanent replacements. Gramm and Schnell (1994)
find that firms hiring permanent replacement workers have a higher operating capacity even after controlling
for other factors which may affect the firm's operating effectiveness. The percentage of strikers who are
reinstated following the settlement of a strike is significantly lower for strikes involving permanent
replacements. Finally, they report that firms hiring permanent replacements conclude the negotiations on
average with more favorable terms.7
7This finding is sensitive to how the authors treat not reaching a contract. The positive effect of hiring replacementsoccurs when not reaching a contract is treated as the most favorable outcome to the firm. When the authors delete thenegotiations that fail to reach a contract, then permanent replacements yield on average less favorable terms to the firm.

7
III. Collection of Replacement Data
We have carried out an extensive project to collect data on the use of replacement workers during contract
negotiations in the 1980s. We restricted our collection efforts to strikes involving bargaining units with at least
1,000 workers. In principal, these major strikes can be matched up with collective bargaining chronologies
compiled by the BLS that we have analyzed in our earlier studies.
Using previously collected strike information, we conducted computer literature searches for each strike
in our sample using the Lexis/Nexis service.8 This service provides the full text of most major newspapers,
magazines and trade journals since the early 1980s. Each strike in our sample generated typically more than
two dozen articles, and those that involved replacements generated far more media attention. Information on
the use of replacements and indications of violence were recorded for each strike in our sample.9
We have data on 3,129 contract negotiations involving 312 strikes in the 1980s that can be linked to the
BLS bargaining chronologies. The dispute incidence in this sample is 58.9%, the strike incidence 10.0%, and
the fraction of strikes involving replacements 14.1%. The incidence of permanent replacements given a strike
is 6.7%, while the incidence of temporary replacements given a strike is 7.4%. Table 1 illustrates that the
likelihood of replacements being hired during a strike varies across years. While there is considerable variation
in these figures due to the small number of major strikes in a given year, this variation suggests that the
decision to use replacements may depend on underlying macro and labor market conditions. Table 2 illustrates
that risk of replacement also varies across industry classifications. Again, the impression is that the decision
to use replacements may depend on product market conditions and characteristics of workers in each industry.
Together, these two tables suggest that the risk of replacement is unlikely to be uniform across bargaining units
and time periods, but rather may follow systematic patterns. Identifying these patterns will point to negotiations
in the 1980s where the replacement risk remained low, and consequently strikes should have remained a viable
union threat choice.
Our data allow us to paint a general picture of the bargaining environment where replacements are hired.
Wages are the primary issue in roughly 64% of the major strikes in the 1980s. The onset of concession
bargaining is evidenced by the fact that 14% of strikes where wages were the primary issue involved demands
by the firm for nominal wage reductions. Importantly, though, strikes where replacements were hired account
8The strike information is gathered from BLS and Bureau of National Affairs (BNA) reports. This data is availablethrough ICPSR by referencing Cramton and Tracy (1992).
9As a check on the accuracy of our combined BLS, BNA, Lexis/Nexis strike information, we surveyed each of thefirms and unions involved in these strikes. We first developed a contact data base listing the appropriate firm and unionrepresentatives, addresses, and phone numbers. This information was verified through phone contacts. The surveyrequested corrections and/or additions to our strike/replacement information. While the response rate was only 15%, thereturned surveys confirmed the accuracy of our information.

8
for 32% of these wage reduction cases, more than twice the share of replacements in overall strikes. Further,
the use of permanent replacements is often preceded by layoffs during the prior contract. Roughly one-third
of strikes involve violence during the negotiations, though the incidence of violence increases when
replacements are hired. Forty-six percent of negotiations involving major violence were associated with the
use or replacements. When replacements are hired, on average 36% (permanent) and 41% (temporary) of the
bargaining unit is replaced. The firm's operating capacity during a strike is higher on average when the firm
hires replacements. The mean operating capacity figures in our sample are 43% when no replacements are
hired, 67% when temporary replacements are hired, and 56% when permanent replacements are hired.
Earlier studies consistently find longer strike durations associated with the hiring of replacements. Not
surprisingly, our data illustrate the same association. The mean strike duration in our sample is 32 days if no
replacements are hired, 70 days if temporary replacements are hired, and 217 days if permanent replacements
are hired. A further understanding of this effect requires information on the timing of the onset of hiring of
replacements. The mean number of days between the prior contract expiration and the hiring of replacements
in our data is 12 days for temporary replacements and 48 days for permanent replacements. Comparing these
figures suggests that the impact of replacements is to reduce the hazard rate from strike to settlement. However,
one must be careful in interpreting this finding, since many of the longest "strikes" are actually situations where
the union workforce has been replaced and the contract negotiations have effectively ceased.10
IV. Incorporating Fixed Costs and Replacements Into a Bargaining Model
In this section, we provide a brief sketch of how the replacement decision can be added to the basic wage
bargaining model in Cramton and Tracy (1992). Our purpose is to show how the threat of replacement affects
the union's decision to strike. We find that as the risk of replacement increases the strike threat becomes less
attractive to the union. Strike incidence, then, should drop with a greater risk of replacement. This shift away
from the relatively expensive threat leads to a higher level of total disputes. Readers not interested in this
extension should skip to the next section.
We begin by extending our earlier model to include fixed costs of initiating a dispute. This extension
serves two purposes. First, by including a fixed cost of striking (in addition to the constant variable cost), the
model is able to explain why overall dispute incidence may increase as strike incidence falls, which is a
prominent feature of the data shown in Figure 1. Second, the model with fixed costs is a building block for the
replacement model, since the replacement decision involves fixed costs, namely, the cost of hiring and training
replacement workers.
10Firms hiring permanent replacements have an incentive to prolong a strike. Replaced striking workers retain theirvoting rights for a period of twelve months following the start of the strike (Landrum Griffin amendments to the NLRA,1959).

9
The union and firm are bargaining over the wage w to be paid during a contract of length T. The union
is uncertain about the firm's willingness to pay v. Bargaining begins with the union selecting a threat
θ ∈ {H, S}, either holdout or strike, which applies until a settlement is reached. In the holdout threat, the union
workers put pressure on the firm while continuing to work under the terms of the expired contract. In the strike
threat, the union workers withhold their labor services. There is some inefficiency associated with disagreement
in either threat.
Inefficiencies arise in the holdout threat through union tactics such as work-to-rule and sickouts. In the
threat θ, the payoff to the union is xθ and the payoff to the firm is aθv - bθ, where aθ ∈ [0,1) and bθ ≥ 0. For the
holdout threat xH = w0 and bH = w0, where w0 is the wage under the expired contract. The term 1 - aθ, which
we call the dispute cost, measures how far the parties are from the Pareto frontier during the threat θ. Since the
total payoff in agreement is v and the total payoff in the threat is aθv - bθ + xθ, the inefficiency during
disagreement is (1 - aθ)v + bθ - xθ = (1 - aθ)(v + cθ), where cθ = (bθ - xθ)/(1 - aθ). For the holdout threat, cH = 0
so the inefficiency during disagreement simplifies to (1 - aH)v. This inefficiency is the pie that can be gained
through settlement.
Moreover, assume that there are fixed costs of initiating a dispute. Let kfθ and kuθ be the fixed costs for
the firm and union if the threat θ is initiated, and kθ = kfθ + kuθ be the joint fixed cost. To make the fixed costs
easily comparable to the flow payoffs (e.g., v and w), each k should be thought of as the flow k from [0,T] that
is equivalent to the one-time fixed cost K; that is, k = rK/(1 - e-rT). The fixed costs may be from a loss of
goodwill in the employment relationship, or costs of shifting production or looking for temporary employment.
In addition, immediate settlement avoids the fixed cost kθ.
An outcome of the bargaining, denoted ⟨t,w, θ⟩, specifies the time of agreement t, the contract wage w at
the time of agreement, and the threat θ ∈ {H, S} before agreement. We assume that the union and firm are risk
neutral and that the payoff flows, both during the threat and after agreement, are constant over time. The
overall payoffs, then, are calculated as a combination of the threat payoff and the agreement payoff, weighted
by the fraction of time spent in each outcome.
After the union's threat choice, the union and firm alternate wage offers, with the union making the initial
offer. The side receiving an offer has two possible responses: (1) a counteroffer, in which case the bargaining
continues, or (2) acceptance, in which case the bargaining ends with labor supplied at the offered wage for the
remainder of the contracting period. The fixed costs kθ provide an added incentive to accept the union's initial
offer, since only immediate acceptance avoids incurring the fixed costs. As in Admati and Perry (1987), a
bargainer can delay responding to an offer. This assumption leads to the signaling equilibrium in which the
firm signals its value through its willingness to delay agreement. For simplicity, we assume that the minimum
time between offers is arbitrarily small.

10
The equilibrium takes a simple form. If the wage w0 under the expired contract is sufficiently low (below
an indifference level w̃) the union selects the strike threat; otherwise (w0 ≥ w̃) the union selects the holdout
threat. The indifference level w̃ depends on the threat payoffs and the distribution of v. A second indifference
level m is determined by the union's initial offer. The firm accepts the union's initial offer if its valuation v is
above m and otherwise rejects the offer. If the firm rejects the offer, it waits until it has credibly signaled its
valuation before making an acceptable counteroffer. The counteroffer is the full-information wage offer, which
in the case of equal discount rates is given by wθ (v) = xθ + ½(1 - aθ)(v + cθ). The union gets its threat payoff,
xθ, plus one-half of the inefficiency avoided by settlement, (1 - aθ)(v + cθ). The counteroffer is independent of
the fixed costs, since at the time of the offer the fixed costs are already sunk. The fixed costs, however, affect
both the union's initial offer and the firm's decision to accept.
Proposition 1. Let θ = (xθ, yθ) be the threat chosen by the union, where yθ = aθv - bθ and cθ = (bθ - xθ)/(1 - aθ).
In the limit as the time between offers goes to zero, there is a perfect Bayesian equilibrium with the following
form:
• The union makes an immediate offer of kfθ + wθ(m), where wθ(m) = xθ + ½(1 - aθ)(m + cθ) and m ∈ [l, h)
maximizes
• The firm accepts the offer if v ≥ m. Otherwise, if v < m, the firm waits until (m-v)/(m+cθ) of the contract
period has passed before offering wθ (v) = xθ + ½(1 - aθ)(v + cθ), which is accepted immediately by the union.
• If m >l, the union's expected payoff from the threat θ is Uθ, the firm's expected payoff is Vθ, and the
expected loss is Lθ, where
k k F m a m c F mv c
m cdF vf
m
θ θ θ θθ
θ
− + − + − +++
XZY
LNMM
OQPP( ) ( ) ( )( ( ))
( )( ) .1
2
2
1 1l
U k k F m m c f m x a m c F m
V k k m c f m a E v b a v c dF v
L k F m k m c f m a c m c F m vdF v
f
fm
h
m
θ θ θ θ θ θ θ
θ θ θ θ θ θ θ θ
θ θ θ θ θ θ θ
= − + + + + − + −
= − − + + − + − +
= + + + − − + − +LNM
OQP
zz
[ ( ) ( ) ( )] ( )( )( ( ))
( ) ( ) ( ) ( ) ( ) ( )
( ) ( ) ( ) ( ) ( )( ( )) ( ) .
1 1
1
2 1 2 1l
11
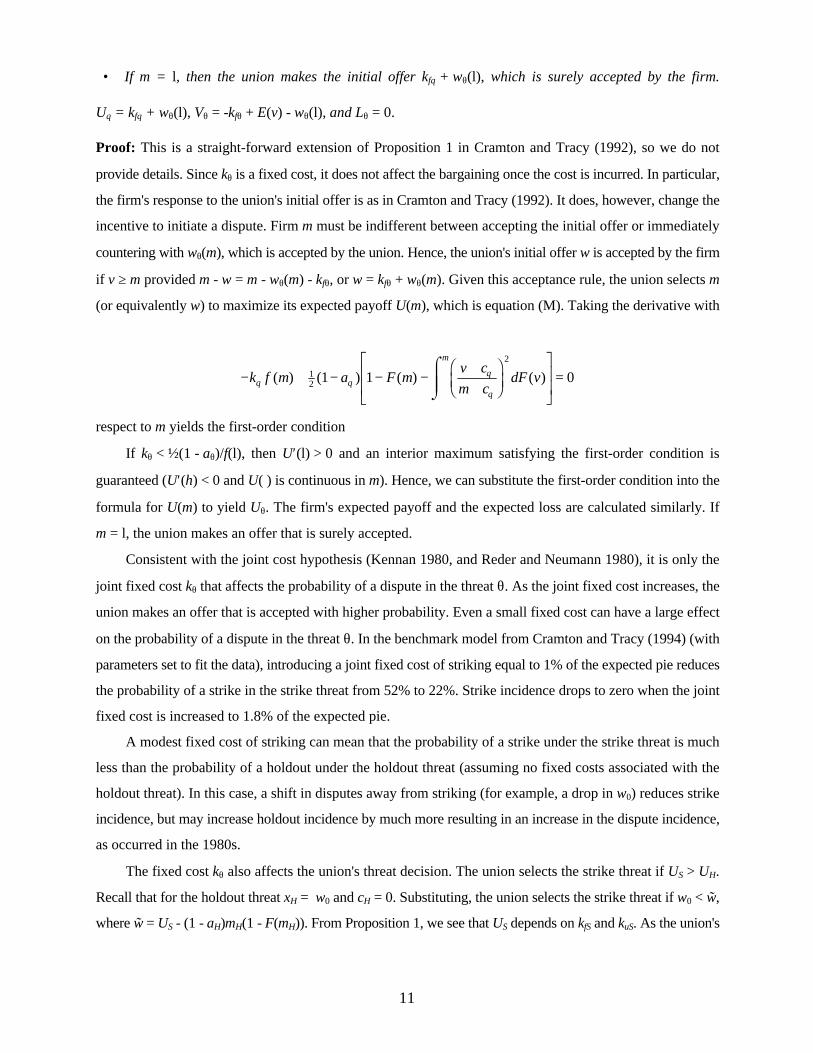
• If m = l, then the union makes the initial offer kfθ + wθ(l), which is surely accepted by the firm.
Uθ = kfθ + wθ(l), Vθ = -kfθ + E(v) - wθ(l), and Lθ = 0.
Proof: This is a straight-forward extension of Proposition 1 in Cramton and Tracy (1992), so we do not
provide details. Since kθ is a fixed cost, it does not affect the bargaining once the cost is incurred. In particular,
the firm's response to the union's initial offer is as in Cramton and Tracy (1992). It does, however, change the
incentive to initiate a dispute. Firm m must be indifferent between accepting the initial offer or immediately
countering with wθ(m), which is accepted by the union. Hence, the union's initial offer w is accepted by the firm
if v ≥ m provided m - w = m - wθ(m) - kfθ, or w = kfθ + wθ(m). Given this acceptance rule, the union selects m
(or equivalently w) to maximize its expected payoff U(m), which is equation (M). Taking the derivative with
respect to m yields the first-order condition
If kθ < ½(1 - aθ)/f(l), then U′(l) > 0 and an interior maximum satisfying the first-order condition is
guaranteed (U′(h) < 0 and U(⋅) is continuous in m). Hence, we can substitute the first-order condition into the
formula for U(m) to yield Uθ. The firm's expected payoff and the expected loss are calculated similarly. If
m = l, the union makes an offer that is surely accepted.�
Consistent with the joint cost hypothesis (Kennan 1980, and Reder and Neumann 1980), it is only the
joint fixed cost kθ that affects the probability of a dispute in the threat θ. As the joint fixed cost increases, the
union makes an offer that is accepted with higher probability. Even a small fixed cost can have a large effect
on the probability of a dispute in the threat θ. In the benchmark model from Cramton and Tracy (1994) (with
parameters set to fit the data), introducing a joint fixed cost of striking equal to 1% of the expected pie reduces
the probability of a strike in the strike threat from 52% to 22%. Strike incidence drops to zero when the joint
fixed cost is increased to 1.8% of the expected pie.
A modest fixed cost of striking can mean that the probability of a strike under the strike threat is much
less than the probability of a holdout under the holdout threat (assuming no fixed costs associated with the
holdout threat). In this case, a shift in disputes away from striking (for example, a drop in w0) reduces strike
incidence, but may increase holdout incidence by much more resulting in an increase in the dispute incidence,
as occurred in the 1980s.
The fixed cost kθ also affects the union's threat decision. The union selects the strike threat if US > UH.
Recall that for the holdout threat xH = w0 and cH = 0. Substituting, the union selects the strike threat if w0 < w̃,
where w̃ = US - (1 - aH)mH(1 - F(mH)). From Proposition 1, we see that US depends on kfS and kuS. As the union's
− + − − −++
FHG
IKJ
XZYY
L
NMM
O
QPP =k f m a F m
v c
m cdF v
m
θ θθ
θ
( ) ( ) ( ) ( )12
2
1 1 0

12
fixed cost of striking increases, US falls, implying a shift toward holdouts. An increase in the firm's fixed cost,
typically increases US, implying a shift toward strikes.
Strike incidence (what we observe in the data) depends on the combined effect of the change in the
probability of a dispute given that the strike threat is selected and the shift in the probability that the union
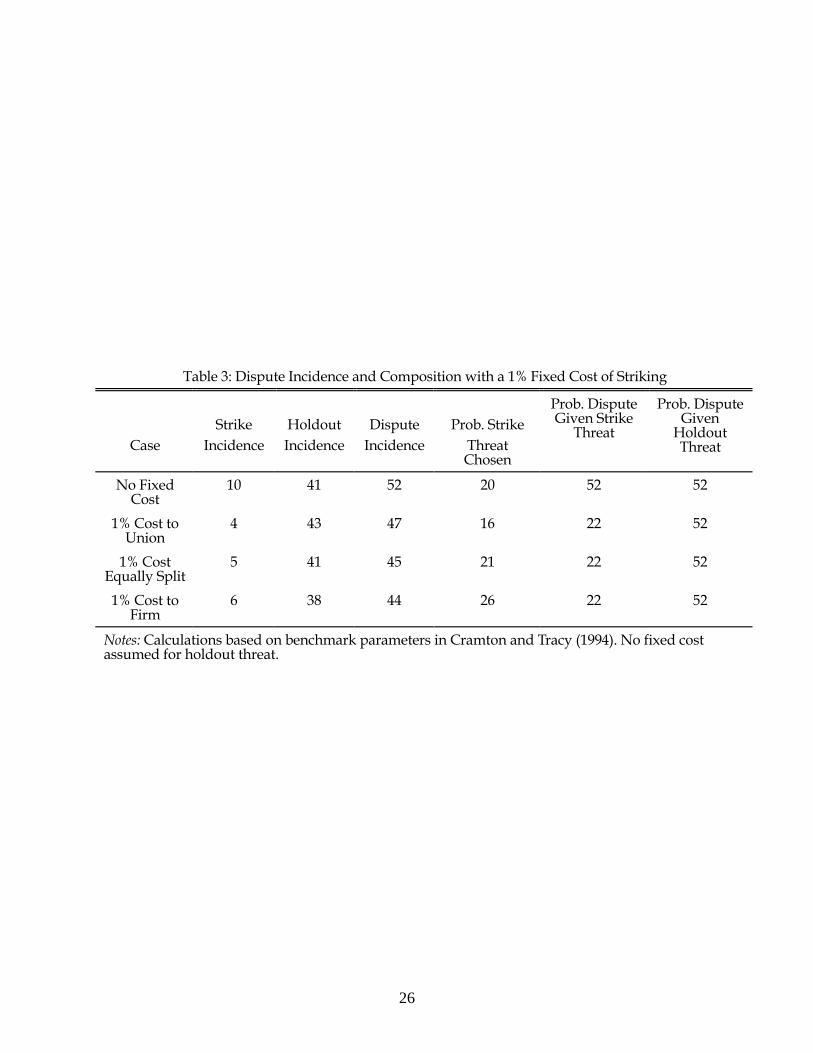
selects the strike threat. Table 3 shows how introducing a 1% fixed cost of striking affects strike incidence and
holdout incidence in the benchmark model. Regardless of who bears the fixed cost, strike incidence drops
substantially, because of the large drop in the probability of a dispute given that the strike threat is selected.
The drop is largest when the union bears the fixed cost, since in this case the strike threat becomes less
attractive and is adopted less often.
We further modify this game by now allowing the firm to decide to replace the workforce. Replacement
can be thought of as a new threat θ = R with its own threat payoffs. If the union selects the strike threat and
the firm finds the union's initial offer unacceptable, then the firm decides whether to hire temporary
replacements at a fixed cost kfR. The cost kfR represents the hiring and training costs associated with
replacement. It is assumed that the replacements' productivity is some fraction aR < 1 of the productivity of the
prior workers.11
To understand the implications of this extension of the model, first consider the case where v and kfR are
known by the firm and the union. The full-information settlement wages under the three threats, wH(v), wS(v),
and wR(v), play an essential role in determining the outcome. If the cost of replacement is prohibitively high
or the replacement wage is higher than the strike wage, wR(v) ≥ wS(v), then the firm never hires replacements.
The settlement wage in this case is the strike wage wS(v) or the holdout wage wH(v), whichever is greater.
Now suppose that the replacement wage is less than the strike wage, wR(v) < wS(v). This wage differential
gives the firm an incentive to replace if the cost of replacement is not too high. In the event that wS(v) -
wR(v) > kfR and that the union selects the strike threat, it will reduce its wage demand in order to keep the firm
from hiring replacements. The union offers the wage w = kfR + wR(v) ≤ wS(v), such that the firm is indifferent
between accepting w or replacing the workforce and settling at wR(v). As a result, we never observe
replacements used, but the threat of replacement reduces the union's wage demand in the strike threat.
Now suppose that v is again common knowledge, but the firm has private information about the cost kfR
of replacement. In particular, suppose the cost of replacement is either low or high, kfR ∈ {L,H}, and let
p = Pr(kfR = L) be the probability of a low replacement cost. Assume that wS(v) - wR(v) ≥ H, so that the union
must be concerned about replacement by both types of firms. There are two possible equilibria, pooling and
separating.
11The replacements are temporary in that they are employed by the firm only until a settlement is reached with theunion. In addition, we assume that the firm's decision to use replacements does not affect v once a settlement with theunion is reached.
13
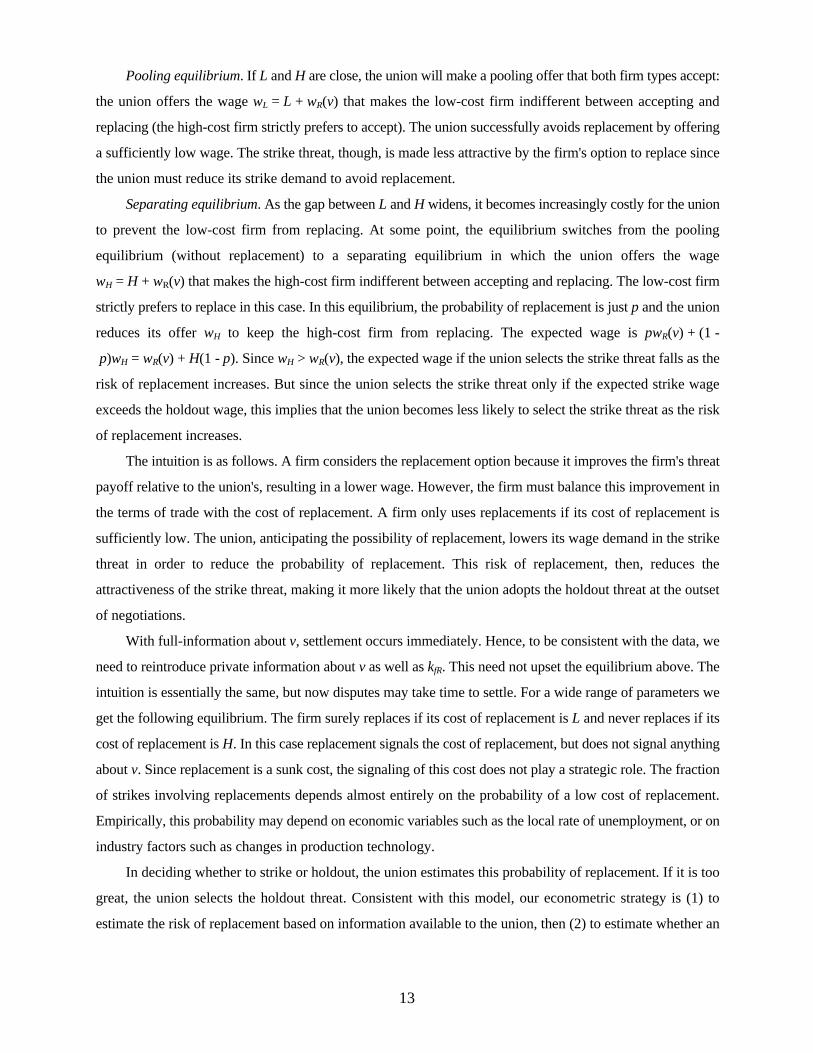
Pooling equilibrium. If L and H are close, the union will make a pooling offer that both firm types accept:
the union offers the wage wL = L + wR(v) that makes the low-cost firm indifferent between accepting and
replacing (the high-cost firm strictly prefers to accept). The union successfully avoids replacement by offering
a sufficiently low wage. The strike threat, though, is made less attractive by the firm's option to replace since
the union must reduce its strike demand to avoid replacement.
Separating equilibrium. As the gap between L and H widens, it becomes increasingly costly for the union
to prevent the low-cost firm from replacing. At some point, the equilibrium switches from the pooling
equilibrium (without replacement) to a separating equilibrium in which the union offers the wage
wH = H + wR(v) that makes the high-cost firm indifferent between accepting and replacing. The low-cost firm
strictly prefers to replace in this case. In this equilibrium, the probability of replacement is just p and the union
reduces its offer wH to keep the high-cost firm from replacing. The expected wage is pwR(v) + (1 -
p)wH = wR(v) + H(1 - p). Since wH > wR(v), the expected wage if the union selects the strike threat falls as the
risk of replacement increases. But since the union selects the strike threat only if the expected strike wage
exceeds the holdout wage, this implies that the union becomes less likely to select the strike threat as the risk
of replacement increases.
The intuition is as follows. A firm considers the replacement option because it improves the firm's threat
payoff relative to the union's, resulting in a lower wage. However, the firm must balance this improvement in
the terms of trade with the cost of replacement. A firm only uses replacements if its cost of replacement is
sufficiently low. The union, anticipating the possibility of replacement, lowers its wage demand in the strike
threat in order to reduce the probability of replacement. This risk of replacement, then, reduces the
attractiveness of the strike threat, making it more likely that the union adopts the holdout threat at the outset
of negotiations.
With full-information about v, settlement occurs immediately. Hence, to be consistent with the data, we
need to reintroduce private information about v as well as kfR. This need not upset the equilibrium above. The
intuition is essentially the same, but now disputes may take time to settle. For a wide range of parameters we
get the following equilibrium. The firm surely replaces if its cost of replacement is L and never replaces if its
cost of replacement is H. In this case replacement signals the cost of replacement, but does not signal anything
about v. Since replacement is a sunk cost, the signaling of this cost does not play a strategic role. The fraction
of strikes involving replacements depends almost entirely on the probability of a low cost of replacement.
Empirically, this probability may depend on economic variables such as the local rate of unemployment, or on
industry factors such as changes in production technology.
In deciding whether to strike or holdout, the union estimates this probability of replacement. If it is too
great, the union selects the holdout threat. Consistent with this model, our econometric strategy is (1) to
estimate the risk of replacement based on information available to the union, then (2) to estimate whether an

14
increase in replacement risk reduces the union's use of the strike threat, and finally (3) to estimate whether a
shift in the composition of disputes away from strikes increases overall dispute activity.
V. The Firm's Decision to Replace and its Consequences for the Union's Threat Choice
The summaries given in Tables 1 and 2 suggest that the replacement risk facing a union if it selects the
strike threat may vary systematically with some underlying economic factors. Our bargaining model indicates
that a union's perceived replacement risk is a key parameter in its choice between the strike and the holdout
threat. We assume that unions form their expectations regarding this replacement risk by examining the
characteristics of bargaining situations in which replacements were used. Systematic patterns that emerge can
be used by a union to inform itself of its own replacement risk.
The firm's decision to replace is based on weighing the wage reductions that can be gained by using
replacements versus the cost of hiring replacements. Our model considered a simplified version in which the
firm faces either high or low replacement costs. All firms with low replacement costs find it in their interest
to replace workers on strike, while all firms with high replacement costs do not find it in their interest to hire
replacements.
The union's search for patterns in the replacement data should begin with variables that potentially relate
to the firm's cost of using replacements. For example, the more the firm engages in specific training of its
workers the more difficult it will be for the firm to find adequately skilled replacements. The decision to hire
replacements must also be cast with an eye toward the ability of the firm to quickly find replacement workers.
This suggests that conditions in the labor market (local and possibly industry) may be important. Tight labor
markets will increase the cost of replacements by driving up the spot wage, or increasing the time required to
replace a given fraction of the bargaining unit.
To begin to identify the underlying determinants of the replacement decision, we have collected data on
many of the variables relevant to the firm's cost of replacements. Our first effort is to attempt to proxy for
differing levels of specific human capital investments across our bargaining units. We do not observe any
demographic information on the workers in our bargaining units. Hence, we use only the industry affiliation
of the bargaining unit and year of the contract negotiation to construct demographic variables.
We created extracts of union workers using Current Population Survey (CPS) data for the period 1980-
1989. We sorted these workers into major CPS industry/year cells, calculated means of their potential labor
market experience, and then smoothed these averages across years using weighted linear regression. We linked
these smoothed data series into our collective bargaining file based on the bargaining unit's SIC classification
and the expiration year of the prior contract.
Variations in labor market experience will help to capture differences in training investments occurring
at the extensive margin. Holding experience constant, differential investment levels across bargaining units

15
can arise at the intensive margin due to differences in the rate of job training. We use two different approaches
in an attempt to capture this additional source of variation. Industries which on average invest in a higher rate
of job training per year should have steeper wage/experience profiles.12 To measure these differential returns
to experience we created extracts of nonunion workers using CPS surveys for the period 1980-1991. We
estimated simple wage equations by major CPS industry. We do not attempt to measure any time variation in
these returns to experience, and focus instead on industry differences.13
Our second measure is a proxy for differences in technological progress by industry. The variable we use
is the industry employment share of scientists and engineers, a measure proposed by Allen (1993). Bartel and
Sicherman (1995) find that increases in this employment share are associated with a significant increase in
hours of company training among workers in the National Longitudinal Survey of Youth data. They find
similar effects when productivity growth or computer investment measures were used in place of the
employment share
To study the impact of labor market conditions on the replacement decision, we use measures developed
for our earlier studies. Specifically, we measure aggregate labor market conditions using the prime-age male
unemployment rate averaged to a quarterly basis. For industry and local labor market conditions we fit
regression models to the BLS quarterly unadjusted employment series from 1970 to 1989 allowing for
quadratic trends, quarterly seasonal effects, and autoregressive error terms.
where ln Eit = log quarterly employment in industry i at time t; Qj = dummy variable for the jth quarter; φ(L)
= second-order distributed lag polynomial; and εit = white noise error term. We measure the tightness of the
labor market using the quarterly employment residual, Ûit, for the quarter in which the prior contract expired.14
The structure of collective bargaining in the industry may also have an impact on the firm's replacement
decision. The industrial relations literature has long emphasized that the bargaining power of unions depends
crucially on the concentration of union membership in an industry. For example, the ability of unions to use
12We assume here that firms and workers have an incentive to share in the costs and returns of specific trainingin order to minimize turnover.
13We control for a worker's education, experience, marital status, sex and race. We constructed a similar seriesof return estimates using the extract of union workers. The process of collective bargaining may introduce severalother considerations that affect the wage/experience slopes in union contracts. For this reason, we prefer thenonunion estimates.
14Positive residuals correspond to tighter employment conditions.
ln
( ) ,
E t t Q U
U L U
it i i i ij jj
it
it it it
= + + + +
= +=
−
∑β β β δ
φ ε
0 1 22
1
3
1

16
bargaining tactics such as pattern bargaining is greatly weakened when the union membership becomes
fragmented across several unions.
For each industry, a union coverage concentration measure is constructed from the bargaining unit
coverage numbers in our data and BLS industry employment data. We observe the size of every bargaining
unit at the outset of each contract it negotiates. We interpolate between contracts to construct a bargaining unit
coverage history. For each month, we aggregate across bargaining units in a given industry to estimate the total
industry coverage. Annual averages of industry coverage levels are normalized by BLS employment rates to
arrive at the industry/year coverage rate.15 Since the union is identified in our data, we can measure the
concentration of the union coverage in an industry across different unions. We calculate by industry and year
a Herfindahl index of union coverage concentration.
We consider two additional variables that may affect the firms decision to use replacements. Holding
constant the local labor market conditions, the ability of a firm to hire replacements may depend on local union
sentiments. If unions enjoy wide public support in a locality, there will be even greater social pressure exerted
on workers not to cross picket lines, and on firms not to attempt to hire replacements. To capture geographic
variation in this union sentiment, we include an indicator variable which equals one for states that prohibit
collective bargaining for their state public sector workers. If public sentiment for unions is lower in these states,
then we would expect the risk of replacement to be higher.
The final variable we consider is an indicator for whether “similar” bargaining units experienced
replacements in a recent contract negotiation. Unions that observe replacements being used at similar
bargaining units may revise upward their assessment of their own replacement risk. We define similar to mean
a bargaining unit in the same two-digit industry classification and state. We restrict attention to negotiations
that occurred within a year prior to the contract expiration. Specifically, we code an indicator which takes a
value of one if a bargaining unit in the same industry and state experienced replacements during contract
negotiations that occurred within the prior twelve months of the contract expiration.
Summary statistics on our strike sample disaggregated by the firm's replacement decision are provided
in Table 4(a). While our data classify replacements as temporary or permanent, we ignore this distinction for
the rest of our analysis. There are several reasons for this decision. The classification of replacements is based
on an ex post analysis of the strike. At the time that the firm makes a replacement decision, it is typically
unclear if the replacements will be temporary or permanent. Workers that are hired as temporary can be
converted to permanent status, while permanent replacements are sometimes dismissed following the end of
a strike.16 It seems reasonable that the union's primary concern is whether the firm will choose to use
replacements.
15See also Bronars, Deere, and Tracy (1993) for a discussion of constructing firm level unionization measuresfrom this contract data.
16The case law provides some restrictions on the process used by the firm to classify replacements as temporary
17
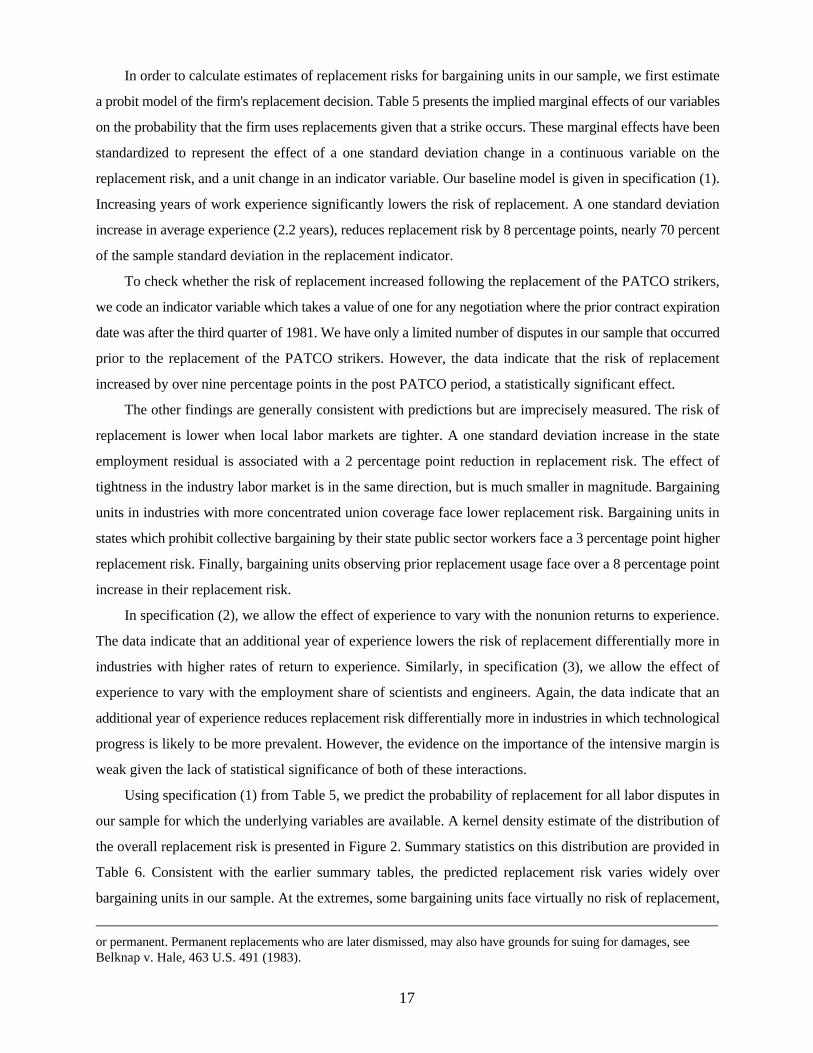
In order to calculate estimates of replacement risks for bargaining units in our sample, we first estimate
a probit model of the firm's replacement decision. Table 5 presents the implied marginal effects of our variables
on the probability that the firm uses replacements given that a strike occurs. These marginal effects have been
standardized to represent the effect of a one standard deviation change in a continuous variable on the
replacement risk, and a unit change in an indicator variable. Our baseline model is given in specification (1).
Increasing years of work experience significantly lowers the risk of replacement. A one standard deviation
increase in average experience (2.2 years), reduces replacement risk by 8 percentage points, nearly 70 percent
of the sample standard deviation in the replacement indicator.
To check whether the risk of replacement increased following the replacement of the PATCO strikers,
we code an indicator variable which takes a value of one for any negotiation where the prior contract expiration
date was after the third quarter of 1981. We have only a limited number of disputes in our sample that occurred
prior to the replacement of the PATCO strikers. However, the data indicate that the risk of replacement
increased by over nine percentage points in the post PATCO period, a statistically significant effect.
The other findings are generally consistent with predictions but are imprecisely measured. The risk of
replacement is lower when local labor markets are tighter. A one standard deviation increase in the state
employment residual is associated with a 2 percentage point reduction in replacement risk. The effect of
tightness in the industry labor market is in the same direction, but is much smaller in magnitude. Bargaining
units in industries with more concentrated union coverage face lower replacement risk. Bargaining units in
states which prohibit collective bargaining by their state public sector workers face a 3 percentage point higher
replacement risk. Finally, bargaining units observing prior replacement usage face over a 8 percentage point
increase in their replacement risk.
In specification (2), we allow the effect of experience to vary with the nonunion returns to experience.
The data indicate that an additional year of experience lowers the risk of replacement differentially more in
industries with higher rates of return to experience. Similarly, in specification (3), we allow the effect of
experience to vary with the employment share of scientists and engineers. Again, the data indicate that an
additional year of experience reduces replacement risk differentially more in industries in which technological
progress is likely to be more prevalent. However, the evidence on the importance of the intensive margin is
weak given the lack of statistical significance of both of these interactions.
Using specification (1) from Table 5, we predict the probability of replacement for all labor disputes in
our sample for which the underlying variables are available. A kernel density estimate of the distribution of
the overall replacement risk is presented in Figure 2. Summary statistics on this distribution are provided in
Table 6. Consistent with the earlier summary tables, the predicted replacement risk varies widely over
bargaining units in our sample. At the extremes, some bargaining units face virtually no risk of replacement,
or permanent. Permanent replacements who are later dismissed, may also have grounds for suing for damages, seeBelknap v. Hale, 463 U.S. 491 (1983).
18
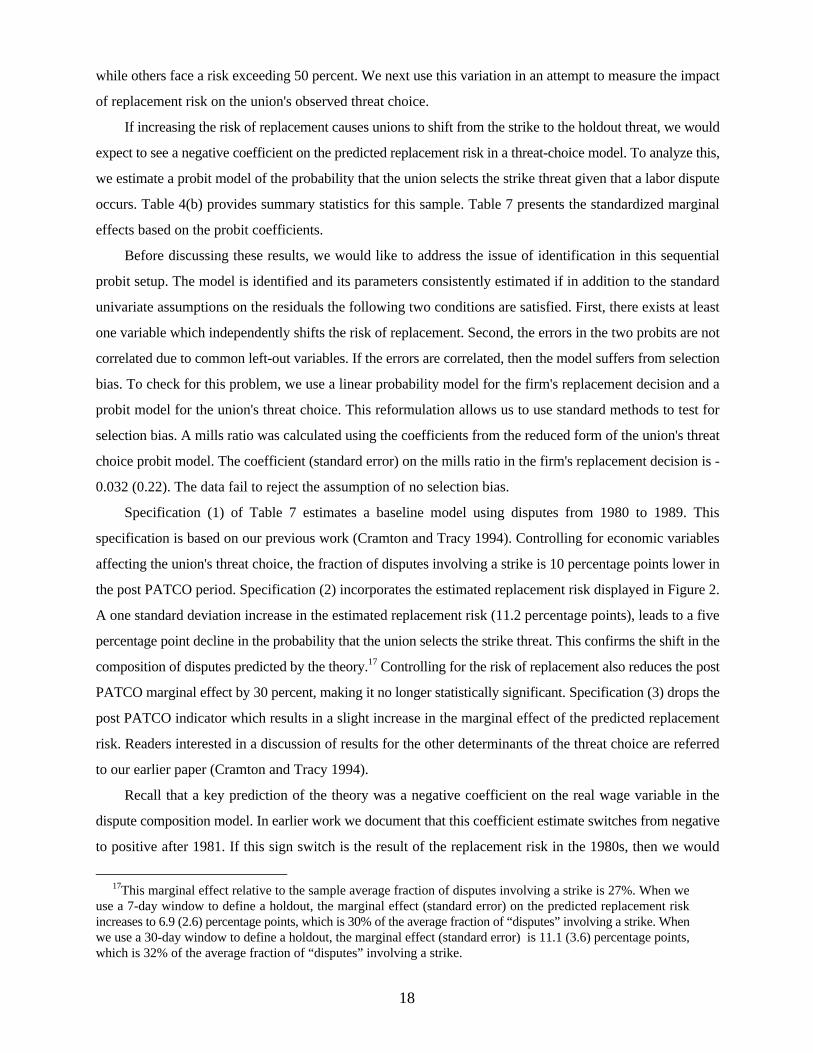
while others face a risk exceeding 50 percent. We next use this variation in an attempt to measure the impact
of replacement risk on the union's observed threat choice.
If increasing the risk of replacement causes unions to shift from the strike to the holdout threat, we would
expect to see a negative coefficient on the predicted replacement risk in a threat-choice model. To analyze this,
we estimate a probit model of the probability that the union selects the strike threat given that a labor dispute
occurs. Table 4(b) provides summary statistics for this sample. Table 7 presents the standardized marginal
effects based on the probit coefficients.
Before discussing these results, we would like to address the issue of identification in this sequential
probit setup. The model is identified and its parameters consistently estimated if in addition to the standard
univariate assumptions on the residuals the following two conditions are satisfied. First, there exists at least
one variable which independently shifts the risk of replacement. Second, the errors in the two probits are not
correlated due to common left-out variables. If the errors are correlated, then the model suffers from selection
bias. To check for this problem, we use a linear probability model for the firm's replacement decision and a
probit model for the union's threat choice. This reformulation allows us to use standard methods to test for
selection bias. A mills ratio was calculated using the coefficients from the reduced form of the union's threat
choice probit model. The coefficient (standard error) on the mills ratio in the firm's replacement decision is -
0.032 (0.22). The data fail to reject the assumption of no selection bias.
Specification (1) of Table 7 estimates a baseline model using disputes from 1980 to 1989. This
specification is based on our previous work (Cramton and Tracy 1994). Controlling for economic variables
affecting the union's threat choice, the fraction of disputes involving a strike is 10 percentage points lower in
the post PATCO period. Specification (2) incorporates the estimated replacement risk displayed in Figure 2.
A one standard deviation increase in the estimated replacement risk (11.2 percentage points), leads to a five
percentage point decline in the probability that the union selects the strike threat. This confirms the shift in the
composition of disputes predicted by the theory.17 Controlling for the risk of replacement also reduces the post
PATCO marginal effect by 30 percent, making it no longer statistically significant. Specification (3) drops the
post PATCO indicator which results in a slight increase in the marginal effect of the predicted replacement
risk. Readers interested in a discussion of results for the other determinants of the threat choice are referred
to our earlier paper (Cramton and Tracy 1994).
Recall that a key prediction of the theory was a negative coefficient on the real wage variable in the
dispute composition model. In earlier work we document that this coefficient estimate switches from negative
to positive after 1981. If this sign switch is the result of the replacement risk in the 1980s, then we would
17This marginal effect relative to the sample average fraction of disputes involving a strike is 27%. When weuse a 7-day window to define a holdout, the marginal effect (standard error) on the predicted replacement riskincreases to 6.9 (2.6) percentage points, which is 30% of the average fraction of “disputes” involving a strike. Whenwe use a 30-day window to define a holdout, the marginal effect (standard error) is 11.1 (3.6) percentage points,which is 32% of the average fraction of “disputes” involving a strike.

19
expect to find a positive interaction between the real wage variable and the predicted replacement risk.
Specification (4) adds this interaction to the model, which the data indicate is positive and significant.
Controlling for the interaction effect, the marginal effect for the real wage becomes negative and statistically
significant. If the risk of replacement increased significantly after 1981 from its levels in the 1970s, then this
positive interaction would help to explain the sign reversal in our previous work.
If the fixed costs of associated with the strike threat are higher than those associated with the holdout
threat, then a shift in the composition of disputes away from strikes should lead to a higher overall dispute
incidence. We test for this effect in the data in Table 8. Descriptive statistics for this sample are given in Table
4(c). Specification (1) provides a benchmark. In specification (2) we include the predicted probability of a
strike given a dispute. A one standard deviation increase in the probability of a strike given a dispute (a 6.6
percentage point rise) is associated with nearly a twenty two percentage point decline in the probability of a
dispute (where the mean dispute rate is 52%). Specifications (3) and (4) explore the extent to which this result
reflects variations in the risk of replacement if the strike threat is selected. In specification (3) the data indicate
that a one standard deviation increase in the risk of replacement is associated with a fourteen percentage point
rise in the incidence of disputes. This is consistent with the earlier finding that as the risk of replacement
increases, the union shifts away from the strike threat.18 In specification (4) we control for both the probability
of a strike given a dispute and the probability of replacement given a strike. The data indicate that there is no
independent effect of the risk of replacement controlling for the overall probability of a strike.19
The results from the dispute composition and the dispute incidence analysis suggest offsetting effects of
the risk of replacement on the likelihood of a strike given a negotiation. As the underlying risk of replacement
increases, the composition of disputes shifts away from strikes which leads to a lower strike incidence.
However, at the same time the increase in the replacement risk increases the overall dispute incidence which
leads to a higher strike incidence. The theoretical model predicts that the composition effect should outweigh
the incidence effect. That is, the overall impact of a higher risk of replacement should be a lower strike
incidence.
Table 9 checks for this effect in the data. Specification (1) provides a benchmark. Specification (2) adds
the predicted risk of replacement, while specification (3) checks to see if the findings are robust to the inclusion
of year effects. The coefficient on the predicted replacement risk is negative and imprecisely measured in both
18This marginal effect relative to the sample average dispute incidence is 21%. When we use a 7-day windowto define a holdout, the marginal effect (standard error) on the predicted replacement risk is 13.9 (2.7) percentagepoints, which is 33% of the average “dispute” incidence. When we use a 30-day window to define a holdout themarginal effect (standard error) is 9.7 (2.2) percentage points, which is 34% of the average“dispute” incidence.
19Note that table 8 is based on a sample of 471 disputes and not the 765 disputes analyzed earlier in table 7. Thetheory suggests that profit uncertainty affects dispute incidence but need not affect dispute composition. Ouruncertainty measure is only available for publicly traded firms. Consequently, in an effort to minimize loss ofnegotiations we only impose that the uncertainty measure is available for the dispute incidence sample.
20
specifications. While the sign is consistent with the model, we can not reject the hypothesis that the two effects
exactly offset each other.
The results from the dispute composition, dispute incidence, and strike incidence models all suggest the
possibility that the basic trends in collective bargaining in the 1980s could be explained in part by the simple
hypothesis that the underlying risk of replacement increased in the 1980s. What remains is an attempt to
measure how much of the change in bargaining outcomes can reasonably be attributed to this hypothesis. While
we do not have the data to answer the question of by how much (if any) the risk of replacement increased from
the 1970s to the 1980s, out best estimate is based on the coefficient on the post-PATCO indicator variable in
the replacement risk model.
The average predicted replacement risk for the sample of bargaining units negotiating contracts in 1982-
1989 is 11.8 percent based on specification (1) of Table 5. Using the coefficient on the post-PATCO indicator
variable from this specification we reestimated the predicted replacement risks as if these negotiations all
occurred prior to the PATCO decision. The average predicted replacement risk for this sample falls to 3.3
percent.
We use this implied difference in replacements risks facing each bargaining unit in the 1982-1989 sample
to simulate the bargaining outcomes if replacement risks remained at their pre-PATCO levels. The average
predicted dispute incidence falls from 54.5 percent to 49.2 percent, roughly a five percentage point change.
The average predicted fraction of disputes involving a strike increases from 18.2 percent to 22.9 percent,
almost a four percentage point change. These two effects account for over half of the unexplained shifts in
dispute incidence and dispute composition documented in Cramton and Tracy (1994). Finally, the strike
incidence increases from 11.8 percent to 12.6 percent, less that a full percentage point.
In a similar manner, the empirical models can be used to assess the likely implications of a change in labor
law which prohibits the use of replacement workers. We focus relatively more attention to the question of how
banning replacements would affect strike incidence since the literature has dealt exclusively with this particular
bargaining outcome. Using the model given in specification (3) of Table 9, we estimate strike probabilities for
each bargaining unit under the counter factual of no replacement risk. Figure 3 presents kernel density
estimates of the distribution of strike incidence probabilities with and without the union facing replacement
risk. Table 10 provides descriptive statistics for these two distributions. A ban on replacements increases the
mean (median) strike incidence by 1.4 percentage points (1.3), slightly over a ten percent increase in strike
incidence.
Table 11 provides a more extensive analysis of the simulated impact of a ban on replacements. This table
breaks down the simulated impact into its three components: dispute incidence, dispute composition, and strike
incidence. In addition, results are tabulated by year. The largest impacts generally occur in the years
immediately following the PATCO decision. Overall, the empirical model indicates that eliminating the risk
of replacement would have dramatically altered the course of negotiations in the 1980s. Dispute incidence

21
would have fallen by 16 percentage points, while the fraction of disputes involving strikes would have
increased by nearly five percentage points. The net impact of these two effects is an increase in the strike
incidence of 1.4 percentage points. If we restrict out attention to the post-PATCO period, then the predicted
increase in strike incidence is 1.7 percentage points, a 14 percent increase. However, given the imprecision in
these estimates, we can not make definitive statements as to the magnitude of the net effect of a replacement
ban on strike incidence.
This modest rise in the predicted strike incidence implied by a ban on replacements sharply contrasts with
estimates of the impact of replacement bans enacted in three Canadian provinces: Quebec in December 1977,
and British Columbia and Ontario in December 1993. Cramton, Gunderson, and Tracy (1993) estimate the
impact of these replacement bans as well as other labor policies on real wage settlements, strike incidence, and
strike durations. This work extends the earlier work by Gunderson, Kervin, and Reid (1986) and Gunderson
and Melino (1990). We use information on over 5,000 contracts negotiated between January 1967 and March
1993. The data indicate that banning replacements led to a 16 percentage point increase in the strike incidence
(a doubling), a 40 percent (34 percent) increase in strike durations for large (all) strikes, and a 11 percent
increase in the real wage. The Canadian replacement bans also prohibit the firm from using transfers or
management to maintain production. This is one reason to expect that their effect on strike incidence would
be stronger than what we would predict for the U.S. using the methods we develop in this paper.
VI. Conclusion
The decline in U.S. strike activity in the 1980s represented a shift by unions from the strike threat to the
holdout threat. At the same time, overall dispute rates increased. These changes in bargaining outcomes could
be a response to a heightened risk of replacements in the 1980s. To address this issue we estimate the
determinants of the firm's decision to use replacements conditional on a strike. We find that firms are reluctant
to use replacements the greater the level of job experience of their workers and the tighter the conditions are
in the local labor market. We use this empirical model to estimate the replacement risk for each labor dispute
in our sample. We find that increases in the risk of replacement significantly reduce the likelihood that the
union exercises the strike threat. This reduction in the likelihood of a strike given a dispute significantly
increases the incidence of disputes. This increase in dispute incidence mitigates the shift in disputes toward
strikes yielding only a modest increase in strike incidence.
The current debate on amending the U.S. labor law to overturn or restrict the McKay Radio doctrine
should be informed as to the likely efficiency and distributional effects. In this paper, we demonstrate that this
legislation will likely have offsetting effects on the overall costs of negotiating labor contracts. The model and
22
data indicate that a ban on replacements will shift the composition of disputes from the low cost threat
(holdouts) to the higher cost threat (strikes). Importantly, the model and data also indicate that the total volume
of disputes will decline which works in the direction of lowering total negotiation costs. Estimating the net
effect on negotiation costs requires estimates of the relative difference in negotiation costs between strikes and
holdouts.
References
Admati, Anat R., and Motty Perry. "Strategic Delay in Bargaining." Review of Economic Studies 54 (July1987): 345-364.
Allen, Steven G. "Technology and the Wage Structure." Working Paper, North Carolina State University,1993.
Bartel, Ann P., and Nachum Sicherman. "Technological Change and the Skill Acquisition of YoungWorkers." Working Paper. Columbia University, March, 1995.
Bronars, Stephen, Donald Deere, and Joseph Tracy. "The Effect of Unions on Firm Behavior: AnEmpirical Analysis Using Firm-Level Data." Industrial Relations 33 (October 1994): 426-451.
Cappelli, Peter. "Concession Bargaining and the National Economy." In Proceedings of the Thirty-FifthAnnual Meeting, 362-71. Madison, WI, Industrial Relations Research Association, 1982.
Cramton, Peter C., and Joseph S. Tracy. "Strikes and Holdouts in Wage Bargaining: Theory and Data."American Economic Review 82 (March 1992): 100-121.
------, and Joseph S. Tracy. "The Determinants of U.S. Labor Disputes." Journal of Labor Economics 12(April 1994): 180-209.
Cramton, Peter, Morley Gunderson, and Joseph Tracy. "The Effect of Collective Bargaining Legislation onStrikes and Wages." Working Paper, August, 1993.
Farber, Henry S., and Alan B. Krueger. "Union Membership in the United States: The Decline Continues."Working Paper #306. Industrial Relations Section, Princeton University, August, 1992.
Freedman, Audrey. "A Fundamental Change in Wage Bargaining." Challenge 25 (July-August 1982): 14-17.
------. The New Look in Wage Policy and Employee Relations. New York, The Conference Board,Research Report, 1985.
Gramm, Cynthia L., and John F. Schnell. "Some Empirical Effects of Using Permanent StrikerReplacements." Contemporary Economic Policy 12 (July 1994): 122-133.
Gramm, Cynthia. "Employers' Decision to Operate During Strikes: Consequences and Policy Implications."In Employee Rights in a Changing Economy: The Issue of Replacement Workers, edited by WilliamSpriggs. Washington, DC, Economic Policy Institute, 1991.
Gunderson, Morley, John Kervin, and Frank Reid. "Logit Estimates of Strike Incidence from Canadian

23
Contract Data." Journal of Labor Economics 4 (April 1989): 257-276.
------, and Angelo Melino. "The Effects of Public Policy on Strike Duration." Journal of Labor Economics8 (1990): 296-316.
Industrial Union Department. The Inside Game: Winning with Workplace Strategies. Washington, DC,AFL-CIO, 1986.
Kennan, John. "Pareto Optimality and the Economics of Strike Duration." Journal of Labor Research 1(Spring 1980): 77-94.
Mitchell, Daniel. "Recent Union Contract Concessions." In Brookings Papers on Economic Activity, 165-204. Washington, DC, Brookings Institution, 1982.
------. "The 1982 Union Wage Concessions: A Turning Point For Collective Bargaining?" CaliforniaManagement Review 25 (Summer 1983): 78-92.
Olson, Craig. "The Use of Strike Replacements in Labor Disputes: Evidence from the 1880s to the 1980s."Working Paper. Industrial Relations Section, Princeton University, 1991.
Reder, Melvin, and George Neumann. "Conflict and Contract: The Case of Strikes." Journal of PoliticalEconomy 88 (1980): 867-886.Schnell, John F., and Cynthia L. Gramm. "The Empirical Relations Between Employers' StrikerReplacement Strategies and Strike Duration." Industrial & Labor Relations Review 47 (January 1994):189-206.
U.S. General Accounting Office. "Labor-Management Relations: Strikes and the Use of Permanent StrikeReplacements in the 1970s and 1980s." Report to Congressional Requestors, GAO/HRD-91-2, January,1991.

24
Table 1: Incidence of Replacements, by Year.
Year Negotiations
Strikes(Incidence)
Replacements(Incidence)
1980 388 43(11.1)
1(2.3)
1981 264 30(11.4)
2(6.7)
1982 320 23(7.2)
2(8.7)
1983 403 35(8.7)
7(21.2)
1984 313 38(12.1)
9(23.7)
1985 301 33(11.0)
5(15.1)
1986 354 45(12.7)
6(13.3)
1987 238 20(8.4)
4(20.0)
1988 264 26(9.8)
4(15.4)
1989 284 19(6.7)
4(14.1)
3,129 312(10.0)
44(14.1)

25
Table 2: Incidence of Replacements, by Industry
CPS Industry
Number ofStrikes
Number ofReplacement
s
Primary Metals 14 1(7.1)
Fabricated Metals 16 0(0.0)
Machinery, except Electrical 26 1(3.9)
Electrical Equipment 14 1(7.2)
Trans Equip - Automobiles 16 0(0.0)
Trans Equip - Aircraft 16 4(25.0)
Trans Equip - Other 14 3(21.4)
Food 21 5(23.8)
Paper 15 3(20.0)
Other Trans 20 7(35.0)
Communications 16 2(12.5)
Other Public Utilities 21 2(9.5)
Other Retail Trade 20 9(45.0)
Medical, except Hospitals 19 6(31.6)
Notes: Cell counts (row percents) given for industries withat least 10 strikes in the sample period.
26
Table 3: Dispute Incidence and Composition with a 1% Fixed Cost of Striking
CaseStrike
IncidenceHoldoutIncidence
DisputeIncidence
Prob. StrikeThreatChosen
Prob. DisputeGiven Strike
Threat
Prob. DisputeGiven
HoldoutThreat
No FixedCost
10 41 52 20 52 52
1% Cost toUnion
4 43 47 16 22 52
1% CostEqually Split
5 41 45 21 22 52
1% Cost toFirm
6 38 44 26 22 52
Notes: Calculations based on benchmark parameters in Cramton and Tracy (1994). No fixed costassumed for holdout threat.

27
Table 4: Descriptive Statistics
(a) Strike Sample, 1980-1989
Overall No Replacements Replacements
Variable Mean Std Dev Mean Std Dev Mean Std Dev
Replacementindicator
0.134 0.341
Experience 22.1 2.2 22.4 2.0 20.4 2.8
Nonunion returns toexperience
0.007 0.002 0.007 0.002 0.006 0.002
Scientist & engineeremployment share
0.050 0.037 0.052 0.036 0.034 0.039
State employmentresidual
-0.007 0.035 -0.005 0.036 -0.017 0.028
Industry employmentresidual
-0.011 0.077 -0.009 0.080 -0.023 0.054
Union coverageconcentration
0.565 0.246 0.566 0.244 0.556 0.257
Prior replacementuseage
0.020 0.139 0.018 0.134 0.029 0.171
Collective bargainingprohibited for stateworkers
0.098 0.298 0.100 0.301 0.088 0.288
Post PATCO indicator 0.787 0.410 0.764 0.426 0.941 0.239
Sample size 254 220 34

28
Table 4: Descriptive Statistics, Continued
(b) Dispute Sample, 1980-1989
Overall No Strike Strike
Variable Mean Std Dev Mean Std Dev Mean Std Dev
Strike Indicator 0.187 0.390
Unemployment rate 6.05 1.42 6.06 1.43 5.99 1.41
State employmentresidual
-0.008 0.036 -0.008 0.036 -0.010 0.035
State employmenttrend
0.005 0.002 0.005 0.002 0.005 0.002
Industry employmentresidual
-0.009 0.074 -0.009 0.070 -0.007 0.086
Industry employmenttrend
-0.001 0.005 -0.001 0.006 -0.001 0.004
Union coveragedensity
0.232 0.211 0.225 0.201 0.263 0.248
Union coverageconcentration
0.594 0.234 0.602 0.231 0.562 0.246
% change in real wageover prior contract
-0.033 0.077 -0.032 0.077 -0.036 0.079
Post PATCO indicator 0.817 0.387 0.829 0.376 0.762 0.427
Predicted replacementrisk
0.111 0.112 0.114 0.117 0.097 0.089
Sample size 765 622 143
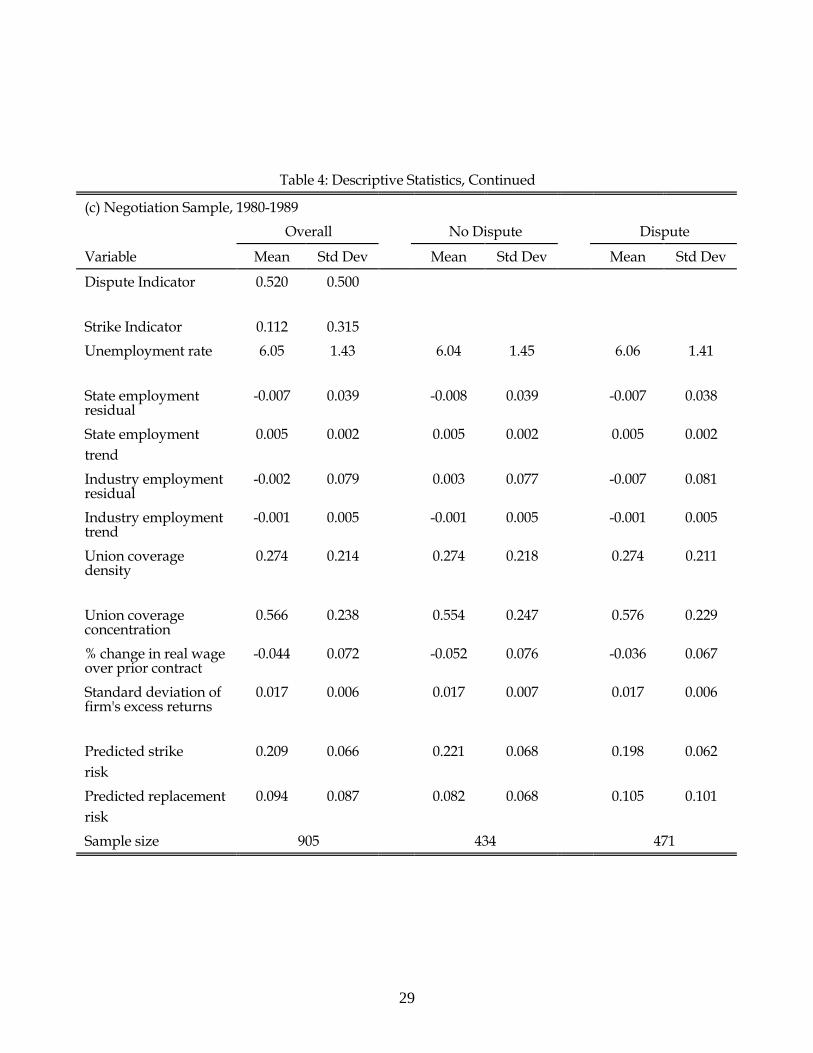
29
Table 4: Descriptive Statistics, Continued
(c) Negotiation Sample, 1980-1989
Overall No Dispute Dispute
Variable Mean Std Dev Mean Std Dev Mean Std Dev
Dispute Indicator 0.520 0.500
Strike Indicator 0.112 0.315
Unemployment rate 6.05 1.43 6.04 1.45 6.06 1.41
State employmentresidual
-0.007 0.039 -0.008 0.039 -0.007 0.038
State employmenttrend
0.005 0.002 0.005 0.002 0.005 0.002
Industry employmentresidual
-0.002 0.079 0.003 0.077 -0.007 0.081
Industry employmenttrend
-0.001 0.005 -0.001 0.005 -0.001 0.005
Union coveragedensity
0.274 0.214 0.274 0.218 0.274 0.211
Union coverageconcentration
0.566 0.238 0.554 0.247 0.576 0.229
% change in real wageover prior contract
-0.044 0.072 -0.052 0.076 -0.036 0.067
Standard deviation offirm's excess returns
0.017 0.006 0.017 0.007 0.017 0.006
Predicted strikerisk
0.209 0.066 0.221 0.068 0.198 0.062
Predicted replacementrisk
0.094 0.087 0.082 0.068 0.105 0.101
Sample size 905 434 471

30
Table 5: Probit Model of Replacement Risk
Variable (1) (2) (3)
Experience -0.079(0.017)
-0.072(0.020)
-0.069(0.020)
Experience x nonunionreturns to experience
-0.012(0.020)
Experience x scientist & engineeremployment share
-0.018(0.022)
State employment residual -0.021(0.024)
-0.020(0.024)
-0.022(0.024)
Industry employment residual -0.011(0.023)
-0.010(0.023)
-0.008(0.024)
Union coverage concentration -0.022(0.019)
-0.023(0.019)
-0.022(0.019)
Prior replacement useage 0.086(0.165)
0.106(0.179)
0.110(0.180)
Collective bargainingprohibited for state workers
0.030(0.077)
0.028(0.076)
0.031(0.077)
Post PATCO indicator 0.094(0.039)
0.096(0.038)
0.095(0.038)
Log likelihood -84.60 -84.24 -84.27
Number of observations 254 254 254
Notes: Coefficients represent the marginal effect of a one standarddeviation change in a continuous variable, or a unit change in an indicatorvariable on the replacement probability. Standard errors are given inparentheses.

31
Table 6: Summary Statistics on Predicted Replacement Risk
Minimum 10% 25% 50% 75% 90% Maximum Mean Std Dev
0.001 0.015 0.039 0.079 0.136 0.248 0.726 0.111 0.112
Notes: Based on specification (1) of Table 5.
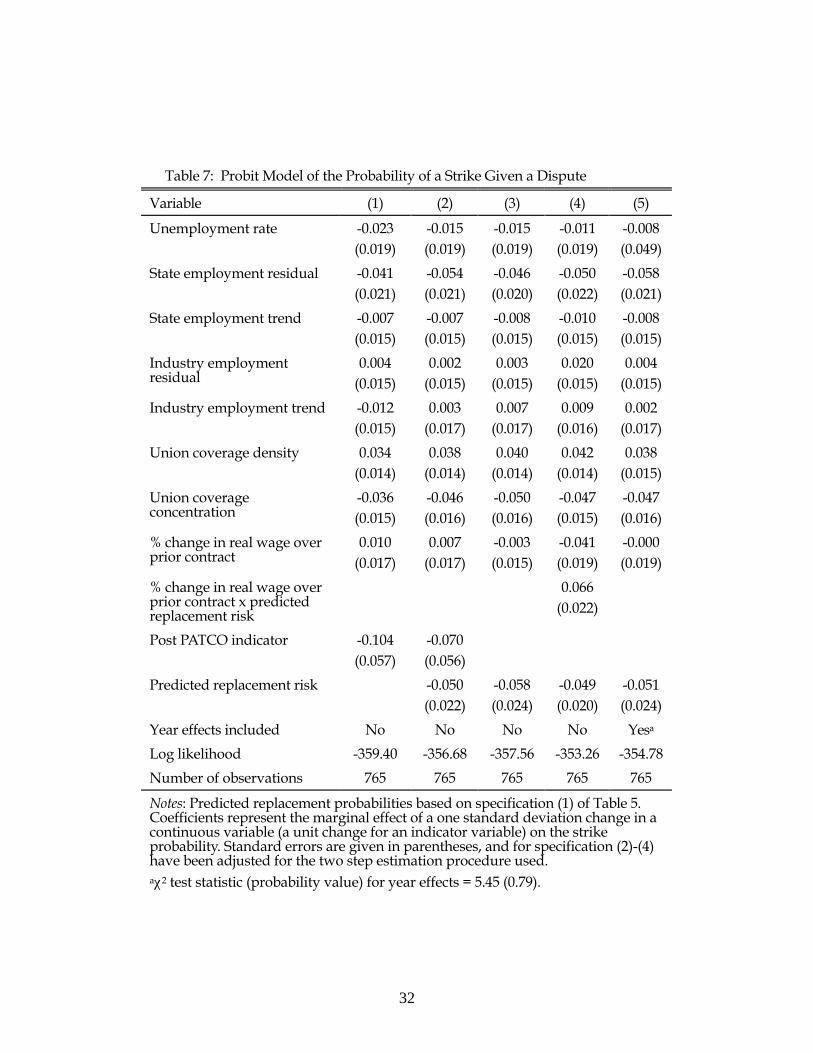
32
Table 7: Probit Model of the Probability of a Strike Given a Dispute
Variable (1) (2) (3) (4) (5)
Unemployment rate -0.023(0.019)
-0.015(0.019)
-0.015(0.019)
-0.011(0.019)
-0.008(0.049)
State employment residual -0.041(0.021)
-0.054(0.021)
-0.046(0.020)
-0.050(0.022)
-0.058(0.021)
State employment trend -0.007(0.015)
-0.007(0.015)
-0.008(0.015)
-0.010(0.015)
-0.008(0.015)
Industry employmentresidual
0.004(0.015)
0.002(0.015)
0.003(0.015)
0.020(0.015)
0.004(0.015)
Industry employment trend -0.012(0.015)
0.003(0.017)
0.007(0.017)
0.009(0.016)
0.002(0.017)
Union coverage density 0.034(0.014)
0.038(0.014)
0.040(0.014)
0.042(0.014)
0.038(0.015)
Union coverageconcentration
-0.036(0.015)
-0.046(0.016)
-0.050(0.016)
-0.047(0.015)
-0.047(0.016)
% change in real wage overprior contract
0.010(0.017)
0.007(0.017)
-0.003(0.015)
-0.041(0.019)
-0.000(0.019)
% change in real wage overprior contract x predictedreplacement risk
0.066(0.022)
Post PATCO indicator -0.104(0.057)
-0.070(0.056)
Predicted replacement risk -0.050(0.022)
-0.058(0.024)
-0.049(0.020)
-0.051(0.024)
Year effects included No No No No Yesa
Log likelihood -359.40 -356.68 -357.56 -353.26 -354.78
Number of observations 765 765 765 765 765
Notes: Predicted replacement probabilities based on specification (1) of Table 5.Coefficients represent the marginal effect of a one standard deviation change in acontinuous variable (a unit change for an indicator variable) on the strikeprobability. Standard errors are given in parentheses, and for specification (2)-(4)have been adjusted for the two step estimation procedure used.aχ2 test statistic (probability value) for year effects = 5.45 (0.79).

33
Table 8: Probit Model of the Probability of a Labor Dispute
Variable (1) (2) (3) (4) (5)
Unemployment rate 0.001(0.021)
-0.075(0.025)
-0.030(0.021)
-0.090(0.030)
-0.083(0.053)
State employment residual 0.025(0.022)
-0.074(0.021)
0.076(0.024)
-0.131(0.070)
-0.040(0.032)
State employment trend 0.030(0.018)
-0.003(0.019)
0.028(0.018)
-0.015(0.023)
-0.006(0.019)
Industry employmentresidual
-0.037(0.019)
-0.015(0.020)
-0.026(0.019)
-0.012(0.020)
0.006(0.020)
Industry employment trend 0.022(0.018)
0.010(0.018)
-0.008(0.019)
0.018(0.021)
0.015(0.018)
Union coverage density -0.001(0.018)
0.124(0.028)
-0.014(0.018)
0.174(0.064)
0.131(0.029)
Union coverageconcentration
0.012(0.018)
-0.126(0.029)
0.040(0.019)
-0.188(0.078)
-0.128(0.030)
% change in real wage overprior contract
0.057(0.018)
0.033(0.017)
0.047(0.018)
0.029(0.018)
0.005(0.023)
Standard deviation offirm's excess returns
-0.012(0.017)
0.008(0.017)
0.005(0.018)
0.008(0.017)
0.013(0.019)
Predicted strike risk -0.219(0.033)
-0.297(0.097)
-0.203(0.039)
Predicted replacement risk 0.140(0.027)
-0.058(0.068)
Year effects included No No No No Yesa
Log likelihood -615.53 -595.68 -599.71 -595.32 -582.44
Number of observations 905 905 905 905 905
Notes: Predicted replacement probabilities based on specification (1) of Table 5.Predicted strike probabilities based on specification (3) of Table 7. Coefficientsrepresent the marginal effect of a one standard deviation change in a continuousvariable (a unit change for an indicator variable) on the dispute probability.Standard errors are given in parentheses, and for specification (2)-(5) have beenadjusted for the multi-step estimation procedure used.aχ2 test statistic (probability value) for year effects = 29.6 (0.0005).

34
Table 9: Probit Model of the Probability of a Strike Given a Negotiation
Variable (1) (2) (3)
Unemployment rate -0.015(0.013)
-0.013(0.014)
-0.032(0.032)
State employment residual 0.006(0.014)
0.004(0.015)
0.005(0.015)
State employment trend -0.016(0.011)
-0.016(0.011)
-0.017(0.012)
Industry employment residual -0.011(0.011)
-0.012(0.011)
-0.009(0.012)
Industry employment trend 0.004(0.011)
0.006(0.011)
0.007(0.012)
Union coverage density 0.013(0.011)
0.013(0.011)
0.015(0.011)
Union coverage concentration -0.001(0.011)
-0.011(0.012)
-0.014(0.012)
% change in real wage over priorcontract
0.034(0.011)
0.035(0.011)
0.030(0.014)
Standard deviation offirm's excess returns
0.004(0.010)
0.003(0.011
0.004(0.011)
Predicted replacement risk -0.007(0.015)
-0.012(0.016)
Year Effects Included No No Yes
Log likelihood -309.22 -309.09 -307.52
Number of observations 905 905 905
Notes: Predicted replacement probabilities based on specification (1) ofTable 5. Coefficients represent the marginal effect of a one standarddeviation change in a continuous variable (a unit change for anindicator variable) on the dispute probability. Standard errors are givenin parentheses, and for specification (2) and (3) have been adjusted forthe multi-step estimation procedure used.

35
Table 10: Simulated Ban on Replacement Workers, Overall
Strike Incidence Minimum 10% 25% 50% 75% 90% Maximum
Mean Std Dev
With Replacements 0.020 0.058 0.078 0.107 0.139 0.172 0.271 0.111 0.045
No Replacements 0.020 0.066 0.088 0.120 0.158 0.190 0.323 0.125 0.049
Notes: Based on specification (3) of Table 9.

36
Table 11: Simulated Impact of a Ban on Replacement Workers, By Year
Predicted Dispute IncidencePredicted Strike Incidence
Given a Labor Dispute
YearRepl.
Allowed
Repl.Prohibited
PercentagePoint
Change
Repl.Allowe
d
Repl.Prohibite
d
PercentagePoint Change
1980 35.2 37.9 2.7 29.9 31.8 1.9
1981 48.0 36.0 -12.0 20.4 22.4 2.0
1982 51.6 25.6 -26.0 18.5 27.4 8.9
1983 54.8 26.0 -28.8 19.1 27.8 8.7
1984 50.6 38.0 -12.6 22.8 29.3 6.5
1985 60.0 41.4 -18.6 19.9 24.7 4.8
1986 73.0 42.1 -30.9 21.2 25.3 4.1
1987 57.3 42.3 -15.0 13.2 16.8 3.6
1988 55.8 47.0 -8.8 19.1 22.7 3.6
1989 52.8 40.6 -12.2 16.7 19.9 3.2
1980 - 1989 52.1(1.6)a
36.1(4.4)
-16.0(4.1)
21.4(1.6)
26.3(3.9)
4.9 (3.3)
1982 - 1989 57.0(1.9)
35.7(5.3)
-21.3(5.0)
19.3(1.7)
25.4(4.5)
6.1 (3.9)
Notes: Predicted dispute incidence is based on specification (5) of Table 8. Predicted strike incidence givena dispute is based on specification (5) of Table 7. Predicted strike incidence given a negotiation is based onspecification (3) of Table 9. Standard errors are given in parentheses.
aStandard errors are based on 5,000 simulations.

37
Table 11: Continued
Predicted Strike IncidenceGiven a Negotiation
YearRepl.
AllowedRepl.
ProhibitedPercentage
PointChange
PercentChange
1980 9.1 9.4 0.3 3.3
1981 8.0 8.4 0.4 5.0
1982 8.8 11.0 2.2 25.0
1983 10.3 12.7 2.4 23.3
1984 12.6 14.4 1.8 14.3
1985 16.7 18.5 1.8 10.8
1986 15.8 17.2 1.4 8.9
1987 9.3 10.4 1.1 11.8
1988 13.5 14.7 1.2 8.9
1989 11.5 12.4 0.9 7.8
1980 - 1989 11.1(1.0)
12.5(2.8)
1.4 (2.5)
12.6
1982 - 1989 12.1(1.3)
13.8(3.4)
1.7(3.1)
14.1
Notes: Predicted dispute incidence is based on specification (5) ofTable 8. Predicted strike incidence given a dispute is based onspecification (5) of Table 7. Predicted strike incidence given anegotiation is based on specification (3) of Table 9. Standard errorsare given in parentheses.
aStandard errors are based on 5,000 simulations.