Embed Size (px)
Citation preview
1
Department of Process and Environmental Engineering
Water Resources and Environmental Engineering Laboratory
Master’s Thesis
The Use of Organic Polymers in the Chemical Purification of Peat
Derived Runoff Water
In Oulu 20.03.2013
Author: _______________________________
Joseph Ngakfumbe
Supervisor: _______________________________
Bjørn Kløve
Professor, University of Oulu
Advisor(s): _______________________________
Elisangela Heiderscheidt
M.Sc. (Tech), University of Oulu
_______________________________
Anna-Kaisa Ronkanen
D.Sc. (Tech.) University of Oulu

2
Acknowledgements
Foremost, I would like to express my sincere gratitude to my supervisor Prof. Bjørn
Kløve, my advisors Elisangela Heiderscheidt and Ana-Kaisa Ronkanen for their
continuous support, patience, motivation, enthusiasm, and immense knowledge. They
worked relentlessly to see me through the research and writing of this thesis. My sincere
thanks also goes to MVTT r.y for their financial support in the realization this work.
Special thanks go to Jaakko Saukkoriipi of the Finnish Environmental Institute – SYKE,
Epie Kenedy of the Department of Agriculture, University of Helsinki, Meseret Walle
and Justice Akanegbu of the Water Resourse Laboratory and Tiomo laboratory
technician, Water Resource Laboratory, University of Oulu for their encouragement,
insightful comments and hard questions.
Last but not the least I would like to thank my family: my dad Dr. Ngakfumbe Simon
(late 1942 – 11.02.2013), my kids Etonde, Jr Njeba and Berry, my sisters and brother,
my in-law Bungong Kwalar, my nieces: Nyuito and Rinyui. Though far away your
relentless prayers, moral and financial support kept me going, I miss you all dearly.
Special appreciations go to Jones Karawa and his family for supporting me morally and
spiritually. My sincere thanks also go to Anong O. Patience for her steadfast moral,
spiritual and financial support.

3
UNIVERSITY OF OULU Thesis Abstract Faculty of Technology
Department Degree Programme (Master’s thesis) or Major Subject
(Lic.thesis) Process and environmental engineering Water resources and environmental engineering laboratory
Author Thesis Supervisor
Ngakfumbe ,W.Joseph Klove, B., Professor
Title of Thesis; The use of organic polymers in the chemical purification of peat derived runoff waters
Major Subject Type of Thesis Submission Date Number of Pages
Water resource management Master´s Thesis 20.03.2013 66
Abstract
In our present day wastewater management have a high influence on the quality of our
environment, its neglect or poor treatment can lead to very negative effect on our bio-diversity
and the environment in general.
This study seeks to address the limitations of using inorganic coagulants in the treatment of
peat runoff water by evaluating the efficiency of organic polymers as coagulants agents in the
chemical purification process. The limitations of inorganic coagulants include; discharge of
residual metals into downstream waters, over dependence on pH, high dosage and high sludge
production.
For our experiments two cationic organic polymers epichlorohydrin/dimethylamine (pAMINE)
and polydiallyldimethyl ammonium chloride (pDADMAC) were selected based on their
molecular weight and charge density. Polyferric sulfate (PFS) which is the pre-hydrolyzed
metal salt coagulant presently being used at several peat extraction treatment sites in Finland
was also tested.
The optimum dosage requirements of the tested coagulants were determined based on turbidity
removal. The dosage requirement of the coagulants were considerably different; optimum
dosages of PFS ranged from 190 mg/l to 200 mg/l while that of the organic polymers ranged
from 40 mg/l to 60 mg/l for pAMINE and 70 mg/l to 90 mg/l for pDADMAC. Where optimum
dosages were applied removal of turbidity ranged from 85 % to 95 %. PFS presented better
overall performance in the removal of TOC about 80 % against less than 40 % for both organic
coagulants. pAMINE leached nitrogen into the system, the leaching diminished in tests at low
temperature.
The evaluation of the influence of mixing on the coagulants performance revealed that PFS’s
performance is more sensitive to variation in mixing than the organic coagulants. Optimum
values for fast mixing intensity were over 100 rpms for all tested coagulants with no
improvement or detrimental effects observed for values up to 400 rpm. Optimum observed fast
mixing time was 10 s for all coagulants. Best slow mixing speed and time were achieved at
above 20 rpm and above 10 minutes for all tested coagulants.
Organic polymers and inorganic coagulants alike showed lower dosage requirements with
lower pH values, pAMINE achieved purification efficiency at dosages as low as 30 mg/l and
pDADMAC was less affected by low pH achieving acceptable turbidity removal at dosages of
less than 60 mg/l. PFS dosage requirements dropped by as much as 45 % from 200 mg/l at pH
6.5 to 120 mg/l at pH 4.5
Place of Storage
University of Oulu, Science and Technology library Tellus
Additional Information

4
Table of contents
Abstract
Acknowledgement
Symbol and abbreviations .............................................................................................. 6
1 Introduction .............................................................................................................. 9
2 Chemical treatment ............................................................................................... 12
2.1 Processes in chemical treatment ....................................................................... 12
2.1.1 Coagulation ............................................................................................... 12
2.1.2 Flocculation ............................................................................................... 14
2.1.3 Sedimentation or settling........................................................................... 15
2.2 Parameters influencing purification efficiencies .............................................. 16
2.2.1 Influence of temperature ........................................................................... 16
2.2.2 Influence of pH ......................................................................................... 16
2.2.3 Influence of mixing ................................................................................... 17
2.2.4 Influence of Dosage .................................................................................. 18
3 Organic polymers ................................................................................................... 19
3.1 General characteristics of polymers ................................................................. 19
3.2 Types of polymers ............................................................................................ 21
3.2.1 Cationic Polymers ..................................................................................... 22
3.2.2 Anionic Polymers ...................................................................................... 23
3.2.3 Non-ionic Polymers .................................................................................. 23
3.3 The use of organic polymers as primary coagulants ........................................ 24
3.3.1 Turbidity and suspended solid removal .................................................... 25
3.3.2 Removal of organic matter ........................................................................ 26

5
4 Research Methods and Materials ......................................................................... 29
4.1 Selected chemicals ........................................................................................... 30
4.1.1 Preparation and handling of selected coagulants ...................................... 31
4.2 Laboratory tests ................................................................................................ 32
5 Results and Discussions ......................................................................................... 39
5.1 The determination of dosage requirement and purification efficiency ............ 39
5.1.1 Optimum dosage and purification efficiency at 22±1 ⁰C ......................... 39
5.1.2 Purification efficiency at 2±2 ⁰C .............................................................. 43
5.1.3 Settling characteristics of tested coagulants. ............................................. 47
5.1.4 The determination of dosage requirement and purification efficiency -
Discussion ................................................................................................................ 49
5.2 Optimization of mixing parameters .................................................................. 50
5.2.1 Coagulation or fast mixing stage............................................................... 50
5.2.2 Flocculation or slow mixing stage ............................................................ 52
5.2.3 Influence of mixing - Discussion .............................................................. 54
5.3 Influence of pH on purification efficiency ....................................................... 54
5.3.1 Influence of pH - Discussion .................................................................... 58
6 Conclusion .............................................................................................................. 59
References ...................................................................................................................... 61
Appendix 1

6
Symbol and abbreviations
AL aluminium
C Color (mg/l Pt)
C0 Initial concentration of particles in suspension
COD Chemical oxygen demand
DOC dissolved organic carbon
Fe Iron
g Acceleration due to gravity (cm/s2)
G Velocity gradient (s1)
L length of rectangle basin (m)
n Mixer rotational speed (revolution per second)
NOM Natural organic matte
PO4 Phosphate phosphorous (µg/l)
Q Flow rate (m3/s
1)
rpm Revolution per minute
SS Suspended solids
t Retention time (s)

7
T Turbidity (NTU)
ti Elapsed time (s)
TOC Total organic carbon
T.P Total phosphorous (µg/l)
Tt Turbidity at time t (NTU)
v Horizontal flow velocity (m/s1)
V Volume of tank (m3)
P Power (W)
µ Absolute velocity (N.s/m2)
AlCl3 Aluminium chloride
RT Residual turbidity (NTU)
MV molecular weight (mol)
CD Charge density (meq/g)
TSS Total suspended solids
T.N Total nitrogen (µg/l)
Ci Initial color

8
Tt0 Turbidity measure minutes a minute before the end of flocculation
time(NTU)
Ti Initial turbidity
Av Average
PFS Polyferric sulphate
pAMINE Epichlorohydrin-dimethylamine-copolymer
pDADMAC Poly-diallyldimethylammoniumchloride
9
1 Introduction
Today more than ever before there is a dire need to protect our natural resources and
ensure the wise and sustainable use of our environment. Like every other human
activity, peat extraction has always been of great interest to the public, governments and
environmental organizations (Canadian Peat Harvesting and the Environment, 2001).
Peat is an important source of energy in Finland, and it is therefore of high economic
importance. The Association of Finnish Peat Industries (2010), estimates that 17 % to
20 % of combined heat and power energy in Finland is produced from peat, it is also
been used as a growing medium in horticulture, as frost insulation, absorbent peat,
composting peat as well as landfill structure and improvement.
Though peat extraction is very important to the Finnish economy, it also has
environmental drawbacks; peat extraction involves removing of the natural vegetation,
landscape alterations, changing of hydrological balance, nutrient load, noise and dust
emission, and this will in turn lead to the disappearance and changing of biodiversity
(Sopo, et al., 2002). Peat extraction has dramatically altered and modified the surface
topography and vegetation of the pristine peatlands. The drainage of peatlands for peat
extraction and other activities such as forestry and agriculture are a cause for concern
(Seters and Price, 2001).
One environmental impact related to peat extraction and usage is increased greenhouse
gase emissions. WWF, 2008 equates the emission of carbon dioxide from peat burning
to that from the transport sector estimated at 10 million tons per year. The formation of
peat takes place in wetlands with high water table under anaerobic conditions. Lowering
of water table during peat extraction quickens decomposition processes of organic
matter releasing carbon dioxide which is a main greenhouse gas (Canadian Peat
Harvesting and the Environment, 2001). On a global basis, combustion of peat as a fuel
releases three times the quantity of carbon as is released from drained peatlands, on the
other hand, the release of methane from un-drained peatland has a greater impact than

10
the combined total from areas used for peat combustion and other drainage (Gorham,
1991).
One of the most significant negative impacts of peat extraction is that it has a major
effect on downstream aquatic ecosystems. The leaching of pollutant substances and the
increase in runoff water volume will inevitably negatively influence the physical and
chemical quality of the receiving water bodies (Klove, 1997, 1998, 2000; Canadian Peat
Harvesting and the Environment, 2001). Fresh water quality one of vital natural
resource is seriously loaded by pollutants from our domestic, industrial, and agro-
industrial activities sectors. Sustainable management of this resource should be our
utmost priority in order to guarantee it stays renewable (Jern, 2006 pp. 1). Due to the
detrimental effects of peat extraction discharging waters, it is important that purification
methods are developed and optimized to fit the unique condition required. Peat
extraction areas are generally isolated in areas where in most cases electricity is not
provided, hence for purification methods to be feasible they need to be simple,
inexpensive and low maintenance while efficient. Of particular interest is the removal of
organic matter, nutrients and suspended solids from the discharging water. Amongst the
numerous water and wastewater purification methods; sedimentation basin, overland-
flow areas, chemical purification and others, chemical treatments though expensive is a
well-known method and it is required for sites where water quality is crucial. Chemical
purification is considered by the Finnish authorities to be one of the best available
technologies for the treatment of peat extraction runoff water (Association of Finnish
Peat Industries, 2010).
Chemical treatment using metal salts of iron and aluminum has long been applied in
several peat extraction sites in Finland. Nevertheless, variations in incoming water
quality and lack of optimization of treatment facilities have resulted in significant
variations in purification efficiency and increase in metal residual in the discharge water
(Heiderscheidt, 2011). The goal of this study is to develop the chemical purification
method by evaluating the efficiency of organic polymers as coagulant agents in the
treatment of peat extraction water and therefore provide an alternative to metal salt
11
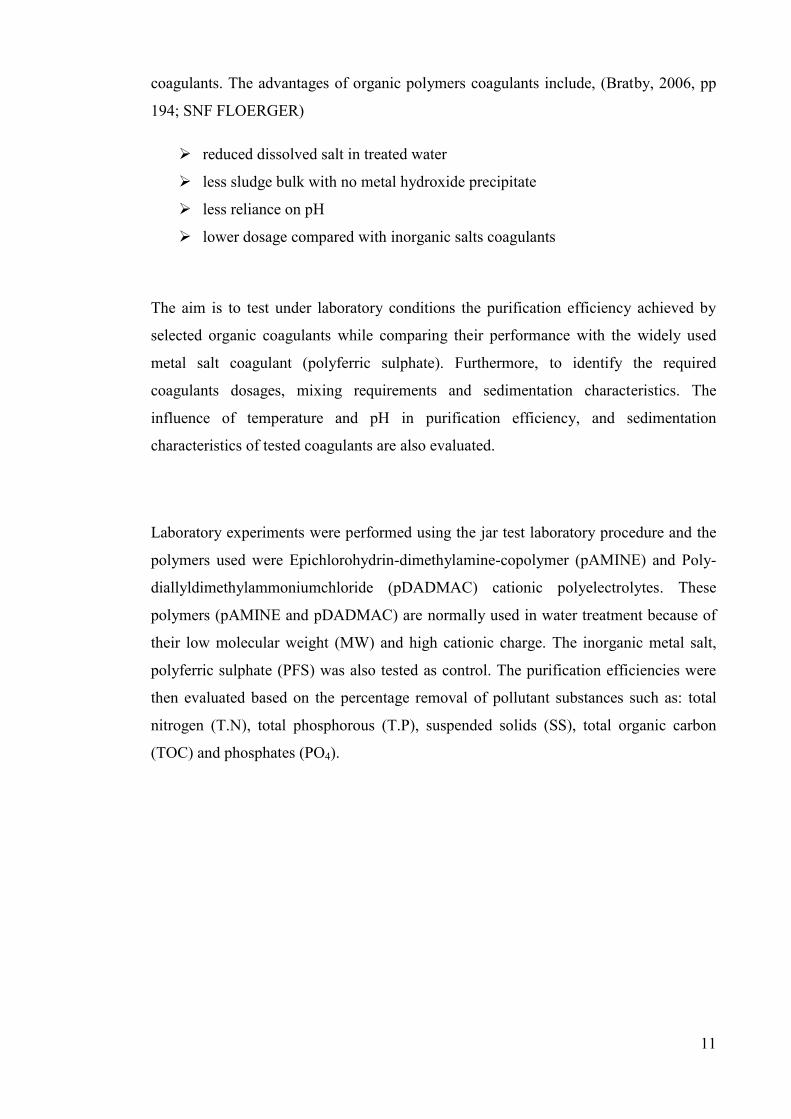
coagulants. The advantages of organic polymers coagulants include, (Bratby, 2006, pp
194; SNF FLOERGER)
reduced dissolved salt in treated water
less sludge bulk with no metal hydroxide precipitate
less reliance on pH
lower dosage compared with inorganic salts coagulants
The aim is to test under laboratory conditions the purification efficiency achieved by
selected organic coagulants while comparing their performance with the widely used
metal salt coagulant (polyferric sulphate). Furthermore, to identify the required
coagulants dosages, mixing requirements and sedimentation characteristics. The
influence of temperature and pH in purification efficiency, and sedimentation
characteristics of tested coagulants are also evaluated.
Laboratory experiments were performed using the jar test laboratory procedure and the
polymers used were Epichlorohydrin-dimethylamine-copolymer (pAMINE) and Poly-
diallyldimethylammoniumchloride (pDADMAC) cationic polyelectrolytes. These
polymers (pAMINE and pDADMAC) are normally used in water treatment because of
their low molecular weight (MW) and high cationic charge. The inorganic metal salt,
polyferric sulphate (PFS) was also tested as control. The purification efficiencies were
then evaluated based on the percentage removal of pollutant substances such as: total
nitrogen (T.N), total phosphorous (T.P), suspended solids (SS), total organic carbon
(TOC) and phosphates (PO4).

12
2 Chemical treatment
The processes involved in chemical treatment of both wastewater and portable or
drinking water treatment are mainly coagulation, flocculation and sedimentation.
Coagulation is an essential mechanism in the removal of suspended colloidal particles
mostly responsible for turbidity, color, taste and odor. Coagulants are responsible for
the formation of small scattered particles which come together into larger and more
stable particles flocs. These then settle as sediments and can be removed (Bratby, 2006;
Tzoupanos and Zouboulis, 2008; SNF FLOERGER).
2.1 Processes in chemical treatment
2.1.1 Coagulation
Coagulation is the first stage in chemical water treatment and it is meant to neutralize
the electric charges in the particles destabilizing the colloidal suspension and cause the
particles to agglomerate, the particles can be mineral, organic and biological in nature
(SNF, FLOERGER).
Aluminum and iron based metal coagulants are the most commonly used, these include
ferric sulfate, ferrous sulfate, ferric chloride and aluminum sulfate, aluminum chloride
and sodium aluminate for iron based and aluminum based respectively. Low cost and
availability of metal coagulant favors its wide spread use (Bratby, 2006 pp. 32;
Tzoupånos and Zouboulis, 2008). Their high dependence on pH, high dosage
requirement, vulnerability to temperature variation and high sludge stand as the
drawbacks to their use (Tzoupånos and Zouboulis, 2008). Addition of these salts into
raw water results in dissociation of the salts to give their trivalent ions, which hydrates
to give complex water molecules Al (H2O)63+
and Fe (H2O)63+
. A series of reactions
then lead to the replacement of H2O molecules by OH- ions to form soluble Al (OH)
2+
and Fe (OH)2+
which are effective as coagulants due to their ability to strongly adsorb
on the surface of most negative colloids (Bratby, 2006 pp. 42).

13
There has been considerable research on the use of prehydrolyzed inorganic coagulants
and its effectiveness as primary coagulants, they include; polyaluminum chloride,
polyaluminum silicate chloride and polyaluminum chloride. Their primary advantage is
that they are not very dependent on raw water pH and temperature. (Bratby, 2006 pp.
38-39).
Coagulation mechanisms for organic polymers
According to Bratby, (2006) there is no single mechanism of destabilization by
polyelectrolytes which can be considered the main mechanism. In all instances however
two key mechanisms do stand out which may operate in opposition, conjointly, or one
mechanism clearly predominating over the other. These are referred to as the bridging
mechanism (Figure 1) and the electrostatic patch mechanism;
a. The bridging model; where polyelectrolytes segments are adsorbed on the
surfaces of adjacent colloids, binding them together.
b. Electrostatic patch model; oppositely charged ionic polyelectrolytes to the
suspended material are adsorbed and thus reducing the potential energy of
repulsion between adjacent colloids.

14
Figure 1. Schematic picture of (a) bridging flocculation and (b) restabilisation by
adsorbed polymer chains (Modified from Bolto and Gregory, 2007).
2.1.2 Flocculation
The flocculation process is one of the main stages in water and wastewater treatment. It
occurs when destabilized particles from the coagulation stage are mechanically induced
to agglomerate into compact and fast settleable particles commonly called flocs. The
agglomeration of the particles is due to velocity difference or gradient in the previously
coagulated water. The agglomerates or flocs are ultimately removed by sedimentation or
in some cases floatation (Bolto and Gregory, 2007).
Flocculation process is generally classified into two separate processes; perikinetic and
orthokinetic flocculation. Perikinetic flocculation is the process that is caused by the
collision of colloidal particles (Brownian motion of particles). Perikinetic flocculation is
completed within seconds and it initiated soon after the destabilization of particles.
On the other hand orthokinetic flocculation is the process that starts once the perikinetic
flocculation is completed. It is flocculation due to contact of colloidal particles resulting

15
from induced bulk fluid motion. (Bratby, 2006; Vigneswaran and Visvanathan, 1995)
According to Bratby (2006), velocity gradient is inversely proportional to floc size and
directly proportion to particle contact, there is therefore a limiting flocculation time
beyond which floc particles will stop growing, Bratby (2006) again states that “the
lower the velocity gradient, the longer will be the time needed to reach the optimum floc
size, but the larger will be the final floc size”.
2.1.3 Sedimentation or settling
Settling is a physical separation (solid-liquid separation) process with the clarified
supernatant water on top and concentrated sediments at the bottom of the tank. The
purpose of sedimentation is to remove coarse suspensions, coagulated or flocculated
impurities and precipitated impurities of chemical treatment and settle them at the
bottom of the tank (Hammer Jr, 2008 pp.213). Types of sedimentation include
(American Water works Association, 1990);
a. Settling of discrete particles; individual particles will sediment without coming
in contact with bordering particles.
b. Flocculent particles; particles will agglomerate and increase in size due
flocculation thereby increasing in mass and as such settle faster.
c. Zone settling; particles may settle en-mass as a unit with individual particles
maintaining a fixed position with respect each other as they settle.
d. Compression settling; this will occur where particles concentration is so high
that sedimentation can only be achieved through compaction.
The quality of supernatant water depends on certain parameter such as temperature, pH,
mixing, and dosage and their effects on the optimum condition (Gregory and Duan,
2001).

16
2.2 Parameters influencing purification efficiencies
2.2.1 Influence of temperature
Higher temperature quickens the rate of chemical reactions; Arrhenius 1889 cited in
Hammer Jr, 2008 states the relationship between the rate of reaction and temperature as;
k2 = k1QT2 (1)
Where k = reaction rate constant at respective temperature T (1/day)
Q = temperature coefficient, dimensionless
T = temperature, (oC)
Low temperatures are known to stabilize colloidal surfaces and to reduce the rate of
hydrolysis reactions which in turn causes a decrease in particle recovery (Yu et al
2006). High temperatures results in lower viscosity of water and free movement of
particles as well as higher reactions kinetics and higher solubility of applied chemicals
(Bradtby, 2006 pp171-172).
Heiderscheidt et al (2013) showed that when temperature was lowered from 20o C to 5
0
C the purification efficiency of metal salt coagulants were reduced with varying degree;
it resulted in the decrease of the removal percentage of T.N and TOC by about 10 %,
the most affected was the removal of SS with a reduction of up to 60 %, the lowering of
the temperature also adversely affected the rate of settling of all the metal salt
coagulants.
2.2.2 Influence of pH
The performance of metal salt coagulants is known to be highly dependent on the pH of
the water compared to organic coagulants, according to Baghvand et al., (2010) working
with alum and ferric chloride at a pH range of 4 – 8 they found out that the best pH for
optimum results was between 5 and 6 for ferric chloride and 6 and 7 for alum.

17
With cationic polyelectrolytes, humic acid precipitation is directly proportional to pH
due to lower negative charge presented by these substances; this is caused by a decline
in the degree of ionization. Narkis and Rebhun (1975 and 1977 cited in Bratby 2006)
observed that a drop in pH from 6.0 to 2.8 sees a drop in the best dosage requirement of
the polyelectrolyte from 3.0 mg/l to 0.8 mg/l.
The addition of metal salt coagulants will significantly affect the pH of the solution,
according to Heiderscheidt (2011, pp 47 - 65) the pH of raw water range between 5.8 -
6.8 and after treatment they ranged from 3.5 – 4.8 showing a significant drop in the pH
range due to the treatment with metal salt coagulants. This is not the case with organic
coagulants, according to Bratby 2006 pp194 organic polymers do not require too much
adjustments in pH.
2.2.3 Influence of mixing
An important parameter in the treatment of water and wastewater is the fast-mixing
which is when coagulants are added to the water and require turbulent mixing, so that
they can be circulated rapidly and uniformly through the mass of the water. The lack of
fast mixing can cause the coagulants to perform poorly due to regional under and over
dosing (Kan et al, 2001). Slow mixing comes soon after rapid mixing and it is intended
to introduce particle contact and growth of primary flocs formed during rapid mixing
(Rossini et al, 1998).
Heiderscheidt (2011, pg. 75) shows the optimum mixing speeds for tested solid and
liquid metal salt coagulant on various raw water samples ranges from 50 - 90 rpm for
slow mixing speed and 100 - 400 rpm for fast mixing speed. The optimum mixing times
ranged from 15 - 25 minutes for slow mixing time and 10 - 60 seconds for fast mixing
time, mixing parameters applied during the flocculation phase were found to be more
significant than that applied during the coagulation phase.

18
As mixing proceeds, there is point to point and time variation in the fluid velocity, the
parameter stating mixing strength is identified as velocity gradient or simply G-value
(Rossini et at., 1998);
Where G = (P/µV) ½ (2)
Where:
G = Velocity gradient for rapid mixing (s)
P = Power (W)
V = Channels volume (m3)
µ = absolute velocity or dynamic water viscosity (N.s/m2)
2.2.4 Influence of Dosage
The dosage administered in a chemical treatment would affect the purification
efficiency of all coagulants. There is a rapid drop in turbidity with increase in dosage,
this will often peak at the optimum dosage and in most cases further increase after
optimum dosage will not change the residual turbidity of the treated water. In other
cases the further increase in dosage can cause charge reversal and re-suspension of
particles causing increase in turbidity values (Heiderscheidt et al., 2013, Yu et al., 2006,
Baghrand et al., 2010). Increase in initial turbidity results in decrease in turbidity
removal. According to Baghrand et al., (2010), working with alum; a fixed dosage of 10
mg/l at pH 7 and initial turbidity of 10 NTU achieved a residual turbidity of about 0.1
NTU, at 100 NTU the achieved residual turbidity was about 2 NTU, at initial turbidity
of 200 NTU the achieved residual turbidity was about 40 NTU, at 500 NTU residual
turbidity was up to 70 NTU and at 1000 NTU it was about 180 NTU. Ferric chloride
was less affected by initial turbidity, at pH 5 and dosage of 10 mg/l ferric achieved
residual turbidity of 0.1 NTU at initial turbidity of 10 NTU, about 2 NTU residual
turbidity was achieved with initial turbidity of 100 NTU, residual turbidity of about 15
NTU was achieved with initial turbidity of 200 NTU and about 70 NTU residual
turbidity with an initial turbidity of 1000 NTU.
19
3 Organic polymers
Polymers are a variety of natural or synthetic water soluble compounds whose
molecules are held together by repeating covalent bonds (Bratby, 2006). Their use as
primary coagulants will better eliminate turbidity; they can greatly enhance processes in
potable water and wastewater treatment by wholly or partially replacing inorganic
coagulant (Lee et al., 1998; SNF FLOERGER). Organic polymers are generally
classified based on the electric charge they carry due to ionization of functional groups;
positively charged or cationic polymers, negative charged or anionic polymers and those
with no charge are termed non-ionic polymers. Charged or ionic polymers are generally
called polyelectrolytes (Bolto and Gregory, 2007; Lee et al., 1998; Bratby, 2006).
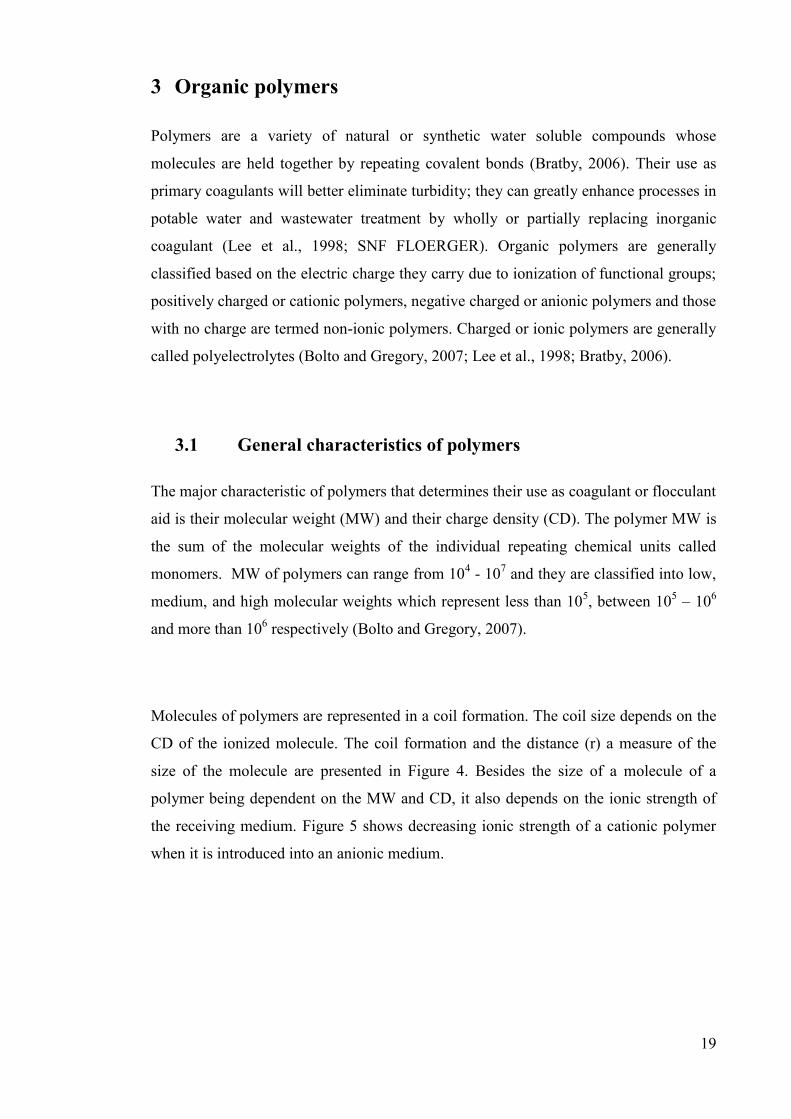
3.1 General characteristics of polymers
The major characteristic of polymers that determines their use as coagulant or flocculant
aid is their molecular weight (MW) and their charge density (CD). The polymer MW is
the sum of the molecular weights of the individual repeating chemical units called
monomers. MW of polymers can range from 104 - 10
7 and they are classified into low,
medium, and high molecular weights which represent less than 105, between 10
5 – 10
6
and more than 106 respectively (Bolto and Gregory, 2007).
Molecules of polymers are represented in a coil formation. The coil size depends on the
CD of the ionized molecule. The coil formation and the distance (r) a measure of the
size of the molecule are presented in Figure 4. Besides the size of a molecule of a
polymer being dependent on the MW and CD, it also depends on the ionic strength of
the receiving medium. Figure 5 shows decreasing ionic strength of a cationic polymer
when it is introduced into an anionic medium.

20
Figure 4. Polymer chain in random coil configuration (Modified from Bolto and
Gregory, 2007).
Figure 5. Showing a random polymer coil configuration and the expansion of a poly
electrolyte chain with decrease ionic strength (Modified from Bolto and Gregory, 2007).

21
3.2 Types of polymers
Organic polymers can generally be divided into natural and synthetic polymers. Natural
polymers have an advantage that they are; virtually not toxic to humans,
environmentally biodegradable and can be readily available to rural communities in the
underdeveloped world. The use of natural polymer may be limited because they may not
be effective in all cases and their properties cannot be modified. Examples of natural
polymers include; chitosan, guar gum, starch, tannin and sodium alginate, Synthetic
polymers on the other hand could be toxic to humans but due to the fact that their
characteristics (MW and CD) can be easily modified and optimized during the
manufacturing process, they are more widely used. Types of organic polymers include
cationic, anionic and nonionic polymers. Figure 6 shows common examples of cationic,
anionic and nonionic polymers and their chemical structures (Lee et al, 1998; Bratby,
2006 pp 50-56; Bolto and Gregory, 2007).
Figure 6. Common structures of cationic (PDADMAC, ECH/DMA, CPAM) and
anionic (APAM) synthetic polymers and natural polymer chitosan (Bolto and Gregory,
2007).
22
3.2.1 Cationic Polymers
These are positively charged polymers commonly used as primary coagulants. Cationic
polymers can also be natural or synthetic based. Polydiallyldimethyl ammonium
chloride (pDADMAC), Epichlorohydrin/dimethylamine polymers (ECH/DMA) and
Cationic Polyacrylamides (CPAMs) are examples of cationic synthetic polymers while
Chitosan is an example of cationic natural polymer. PDADMAC and ECH/DMA are
water soluble containing about 10 to 50% active polymers with low to medium and
medium molecular weights respectively. ECH/DMA is also called polyamines (Bolto
and Gregory, 2007; Bratby, 2006 pp. 52-62).
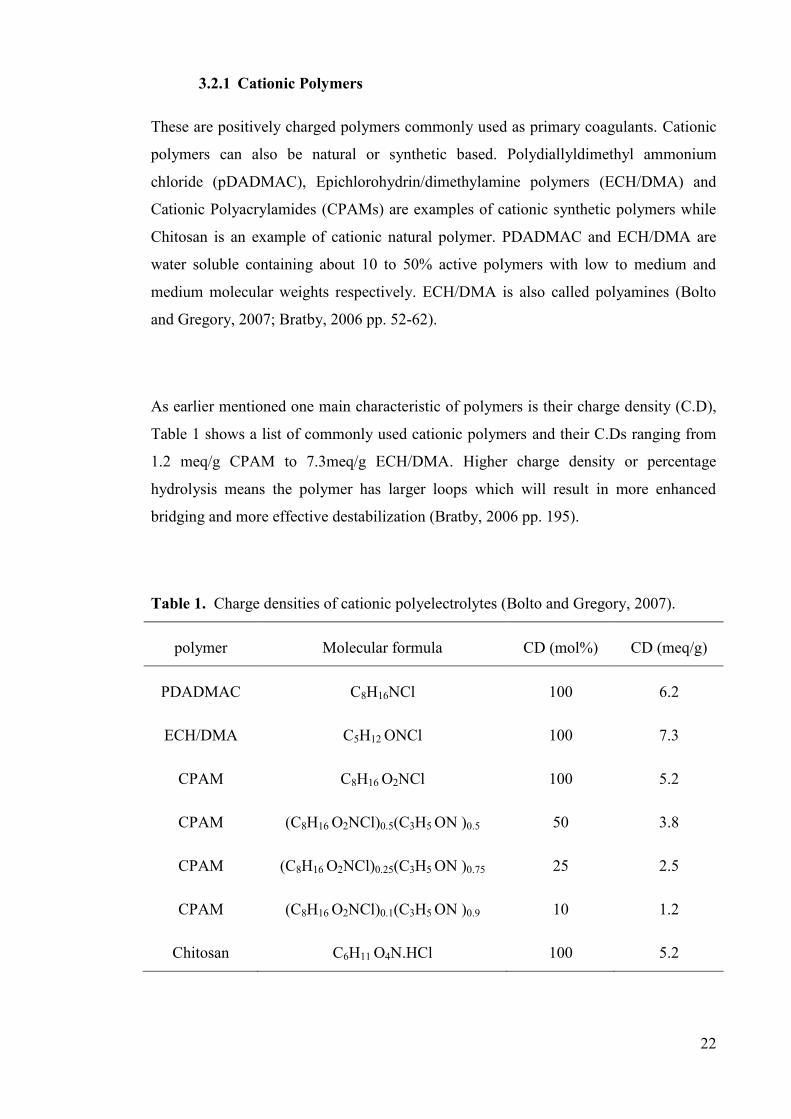
As earlier mentioned one main characteristic of polymers is their charge density (C.D),
Table 1 shows a list of commonly used cationic polymers and their C.Ds ranging from
1.2 meq/g CPAM to 7.3meq/g ECH/DMA. Higher charge density or percentage
hydrolysis means the polymer has larger loops which will result in more enhanced
bridging and more effective destabilization (Bratby, 2006 pp. 195).
Table 1. Charge densities of cationic polyelectrolytes (Bolto and Gregory, 2007).
polymer Molecular formula CD (mol%) CD (meq/g)
PDADMAC C8H16NCl 100 6.2
ECH/DMA C5H12 ONCl 100 7.3
CPAM C8H16 O2NCl 100 5.2
CPAM (C8H16 O2NCl)0.5(C3H5 ON )0.5 50 3.8
CPAM (C8H16 O2NCl)0.25(C3H5 ON )0.75 25 2.5
CPAM (C8H16 O2NCl)0.1(C3H5 ON )0.9 10 1.2
Chitosan C6H11 O4N.HCl 100 5.2

23
3.2.2 Anionic Polymers
Anionic polymers are ampholytic polymers which acquire a negative charge when the
ionizable groups dissociate. Examples of anionic polymers include APAMs (Figure 6),
many sulfate polysaccharides (heparin, mannan sulfate, dextran sulfate and chondroitin
sulfate) and starch with carboxylic substitutions (Voycheck and Tan, 1993 cited by
Bolto and Gregory, 2007; Bolto and George, 2007; Bratby, 2006 pp.54). Table 2 shows
the molecular formulas and C.D of some anionic polymers ranging 1.4 meq/g to 10.6
meq/g
Table 2. Charge densities of anionic polyacrylamides (Bolto and Gregory, 2007).
Molecular formula CD (mol%) CD (meq/g)
C3H3 O2Na 100 10.2
(C3H3 O2Na)0.75(C3H5 ON )0.25 75 8.5
(C3H3 O2Na)0.50(C3H5 ON )0.50 50 6.1
(C3H3 O2Na)0.25(C3H5 ON )0.75 25 3.3
(C3H3 O2Na)0.1(C3H5 ON )0.9 10 1.4
Another natural polymer that forms a negative charge electrolyte is the non-toxic extract
from brown seaweeds called sodium alginate. It is commonly used as flocculant aid in
the United Kingdom and Japan (Bratby, 2006 pp. 56).
3.2.3 Non-ionic Polymers
Common non-ionic polymers are; polyacrylamides (PAMs), natural polymers like
starch without substitutions, galacto mannans, cellulose derivative, gelatins and glues.
Non-ionic polymers vary in structure, molecular weight, and degradability; they are
used to aid solid-liquid separations as flocculant. Like most natural polymers their toxic

24
free nature makes them generally acceptable on health grounds (Lavine, 1981; Rath and
singh, 1997 cited in Bolto and Gregory, 2007; Bratby, 2006 pp. 54-56).
3.3 The use of organic polymers as primary coagulants
Studies carried out by Micheals and Morelos, 1995 cited in Bolto and Gregory, 2007
shows that polyelectrolytes could be successfully used as primary coagulants in water
and wastewater treatment.
The use of organic polymers as primary coagulants have a lot of advantages,
nevertheless, it can be quite challenging. The most significant of which is the selection
of the right polymer to use under the circumstances in question. This involve a look into
their molecular weight, charge density, structure, dose, mixing condition, amount and
type of impurities found in the water and pH dependency (Ghosh et al., 1985; Bolto et
al., 1998; Lurie and Rebhun, 1997 as cited in Bolto and Gregory, 2007; Bratby, 2006
pp. 196). Some advantages of the use of organic polymers as coagulants include;
dissolved salt reduction in treated water, less sludge, no metal hydroxide precipitate,
less reliance on pH and lower dosage requirement (Bolto and Gregory, 2007).
Polymer usages in water and wastewater treatment also have its drawbacks to the
environment, the danger of over or under dosing can be very damaging and could lead
to; (Veal 1990 as cited in Bolto and Gregory, 2007)
high turbidity and color in supernatant water
re-dispersion of impurities
increase in sludge formation
There is therefore need to pay attention to the polymer dosage throughout the treatment
process. According to Bolto and Gregory (2007) other important issues are;
polymer toxicity, though less a problem with anionic and non-anionic polymers
residual polymer analysis in the resultant water

25
polymer degradation and
Disinfection by-product, some cationic polymers like pDADMAC and
pAMINE when used properly will produce very insignificant amount of DBPs
from chlorine.
Cost of organic polymers could be another drawback but advantages like lower dosages,
filter backwash saving, reduced filter loading, increase turbidity removal and reduced
sludge could offset the overall cost in favor of organic polymers in the long run. Bratby
(2006) stated that “a 5.4h increase in filter run time equated to an 18% reduction in the
volume of backwash water required, and a saving of US$0.12/kl of product water”. He
further argued that the lowest cost polymers were not the most cost effective.
3.3.1 Turbidity and suspended solid removal
The optimum dosage requirement for organic polymers will be influenced by the type of
material in the raw water, and it is inversely dependent on the size of the particles in
suspensions. Where the particle sizes are small with the resultant high surface area more
polyelectrolytes are require achieving optimum stabilization, on the other hand a wider
optimum dosage range is achieved with larger range particle size. The relationship
between particle concentration and pDADMAC dosage was investigated by Black et al.,
1965 (cited in Bolto and Gregory, 2007). Their research showed a linear relationship
between clay concentration (mg/l) and optimum polymer dosages (µg/l), where the clay
concentration was doubled the optimum polymer dosage required was as well doubled;
at a concentration of 20 mg/l the required optimum polymer dosage was 40 µg/l, at clay
concentration of 30 mg/l optimum polymer dosage was about 60 µg/l and at 60 mg/l
required optimum polymer dosage was 120 µg/l.
The dosage requirement for polyamine varies from (1.5 to 9.0 mg/l) depending on the removal of turbidity and
color (
Table 3) (Deeble, 1976 cited in Bratby, 2006).

26
Table 3. Removal of turbidity and color with Pt-Co Deeble (1976) cited in Bratby
(2006).
before treatment after treatment
Turbidity 5 – 30 mg/l 1 mg/l SiO2
Color 30 – 140 mg/l 5 mg/l Pt-Co
According to Nozaic et al (2001 cited in Bratby, 2006 pp. 200) optimum dosage of
cationic polymer was much lower than that of alum. This is one of the advantages in the
use of organic polymer compared to metal salt coagulants. He also showed that over
dosage of cationic polymers can lead to charge reversal; when dosages above optimum
of organic polymers were applied, it resulted in charge reversal and an increase in
turbidity. This was nevertheless not the case when alum was overdosed.
Greater rates of filtration with better turbidity removal through coarser media is
achieved with cationic polymers as oppose to metal coagulant Bratby, 2006 pp. 196-
197. ECH/DMA with polymer range of 10,000 and 50,000 Dalton were appropriate for
with highly turbid raw water (Lee et al., 2001 as cited in Bolto and Gregory 2007).
3.3.2 Removal of organic matter
Natural organic matter (NOM) is mostly composed of humic substances. NOMs have
similar chemical properties but varying physical properties, hence they require different
chemical treatments (Bratby, 2006 pp. 88). NOMs cause the majority of the visual
problems in most waters (Vaezi et al., 2005; Jian-Jun Qin et al., 2006). Organic
polymers with higher MW are most appropriate in treatment of water with NOM
according Bolto et al., (1999, cited in Bolto and Gregory, 2007).

27
Table 4 shows a classification of humic substances into four fractions based on Odens
classification.
Table 4. Classification of humic sbstances (Bratby, 2006 pp. 88).
Group Name Alternative Name Definition
Humus coal Humin, ulmin Insoluble in water and sodium
hydroxide
Fulvic acid Crenic and aprocrenic acids soluble in sodium hydroxide
and mineral acid
Hymatomelanic acid Hematomelanic, ulmic acids Soluble in sodium hydroxide
and alcohol, insoluble in
mineral acids
Humic acid - Soluble in sodium hydroxide
insoluble in mineral acids and
alcohol.
Humic substances in water decrease water quality by; impacting taste to water, blocking
lights thereby impeding photosynthesis, transport heavy metals and organic pollutants,
and most of all they are repulsive for aesthetic reasons (Bratby, 2006 pp. 88-89).
Color removal besides turbidity is the main prerequisite for a good polyelectrolyte since
they vary in their color removal efficiency. The removal percentage ranged from 3 % to
87 % and best performance dosage ranging from 2 mg/l to 16 mg/l for the various tested
polyelectrolytes (Packham, 1972 cited in Bratby, 2006 pp. 200).
The coagulation mechanism of organic matter removal is mainly charge neutralization;
there is evidence of a correlation between best dosage and charge neutralization. The

28
cationic charge of the polyelectrolyte can be stoichiometrically related to the anionic
charge of the humic particles making the charge density mostly responsible in
eliminating humic materials (Bolto et al., 1999; Kan and Gregory, 2001 cited in Bolto
and Gregory 2007; Bratby, 2006).
Higher charged polymers require less dosage for optimum results than lower charged
polymers. Highly charged cationic polyelectrolytes generally are most appropriate in
municipal wastewater treatment and are quite good in total suspended solids (TSS) and
chemical oxygen demand (COD) elimination from wastewaters with a purification
efficiency of about 84 % to 98 % but less appropriate in phosphorous removal (Bratby,
2006 pp. 203-204).

29
4 Research Methods and Materials
The objective of this research was to evaluate the suitability of organic polymers as
coagulants and flocculants agents for the purification of peat extraction runoff water.
The aim was to test under laboratory conditions the purification efficiency achieved by
selected organic coagulants and compare their performance with the metal salt
coagulant ferric sulphate (PIX 115 – Kemira Oyj, Kemwater). Furthermore, to identify
the required coagulants dosages, mixing requirements and sedimentation characteristics.
The influence of temperature and pH in purification efficiency, and sedimentation
characteristics of tested coagulants were also evaluated.
About 500 litres of water was collected from the ditches of the Kurkisuo peat extraction
site prior to chemical treatment. The samples were kept in pre-acid washed galloons and
stored in a cold room (5 to 100
C). Water quality analyses (Table 5) were performed in
each of the used gallons (total of 12) so that information of initial water conditions and
variations in water quality during storage were determined. The average water quality
of Kurkisuo samples is shown in Table 6.
Table 5. Water quality performed and utilized standard methods.
Analysis Abbreviation’s Standard
Total organic carbon TOC SFS-EN 1484:1997
Total nitrogen T.N SFS-EN ISO 11905-1:1998
Total Phosphorous T.P In-house method 51b,FIA method
Phosphate phosphorous PO4-P In-house method 55b,FIA method
Suspended solids SS SFS-EN 872:2005

30
Table 6. Kurkisuo water quality (n = 12).
Parameters Average water quality Standard deviation
T.N (µg/l) 2200.0 405.0
T.P (µg/l) 74.7 4.6
PO4 44.2 5.9
SS (mg/l) 20.8 5.2
TOC (mg/l) 30.7 0.9
Fe (µg/l) 6745.5 486.5
Al (µg/l) 862.9 261.5
Turbidity (NTU) 50.5 4.9
Color mg Pt/l 396.4 12.1
4.1 Selected chemicals
The organic polymers being tested (Table 7) were selected based on required
characteristics such as molecular weight and electric charge. The pre-hydrolyzed metal
salt coagulant ferric sulphate (PIX 115) was selected because it is the coagulant now
used at Kurkisuo treatment facility and for which optimization of process parameters are
required.

31
Table 7. Characteristics of tested chemicals.
Brand
name
Chemical type Characteristics Manufacturer Density
g/cm3
Coagulant
Superfloc
C-587
Polydiallyldimethy
lammoniumchloride
(PolyDADMAC)
Liquid
Medium
molecular
weight and
high relative
cationic charge
Kemira Oyj,
Kemwater
1.03-1.05
Coagulant
Superfloc
C-567
Epichlorohydrin-
copolymer (PolyAMINE)
Liquid
Low molecular
weight and
high relative
cationic charge
Kemira Oyj,
Kemwater
1.14-1.18
Coagulant
PIX-115
Pre-hydrolysed
Metal salt coagulant
(PolyFerric sulphate)
Liquid Kemira Oyj,
Kemwater
155
4.1.1 Preparation and handling of selected coagulants
Stock solutions of 10 mg/l of selected coagulant were prepared in a 200 ml flat bottom
flask. Dilutions were prepared using equations (3) and the density of the individual
coagulants (Table 7).
C1V1=C2V2 (3)
Where;
C1 = initial concentration,
C2 = final concentration,
V1 = initial volume and
V2 = final volume

32
As the density of polyamine (pAMINE) is 1.16 g/cm3 or 1160 mg/ml, from equation 3
the volume require to make a solution containing 10 mg/l of the product pAMINE in the
200 ml flask was calculated to be 1.724 ml, similar procedure was applied in the
preparation of stock solutions of polyDADMAC (pDADAMAC) (1.920 ml) and PFS
(1.290 ml). The prepared coagulant solutions were stored at room temperature and used
for up to 3 days after which they were discarded and a new solution prepared.
4.2 Laboratory tests
Jar test equipment were used to carry out the experiment and on the spot analysis like
turbidity, color, pH and electric conductivity were performed and recorded, further
analysis were carried out by SYKE certified laboratory.
Before starting each experiment, the galloon to be analyzed at each stage is vigorously
shaken, this allowed for in-depth mixing to prevent water quality changes caused by
settling. The laboratory experiments were carried out in the following stages:
1. Dosage optimization and determination of purification efficiency at 22±1 ⁰C,
2. Mixing optimization,
3. Settling characteristics,
4. Dosage optimization and determination of purification efficiency at 2±2 ⁰C,
5. Influence of temperature and pH adjustment.
Stage 1 required 12 jar tests, stage 2 which is mixing parameter optimization 8 jar tests
were required, 9 jar tests were required in stage 3. Stage 4 which is dosage optimization
and determination of purification efficiency at low temperatures required 3 sets of jar
tests which were done as follows; 3 dosages, 2 replica for the 3 coagulants. Each set of
jar required on the spot test of turbidity, color, pH, and conductivity. These stages
required 2300 litters of raw water for total of 38 jar tests with 24 sets of supernatant
waters sent for further analyses.
33
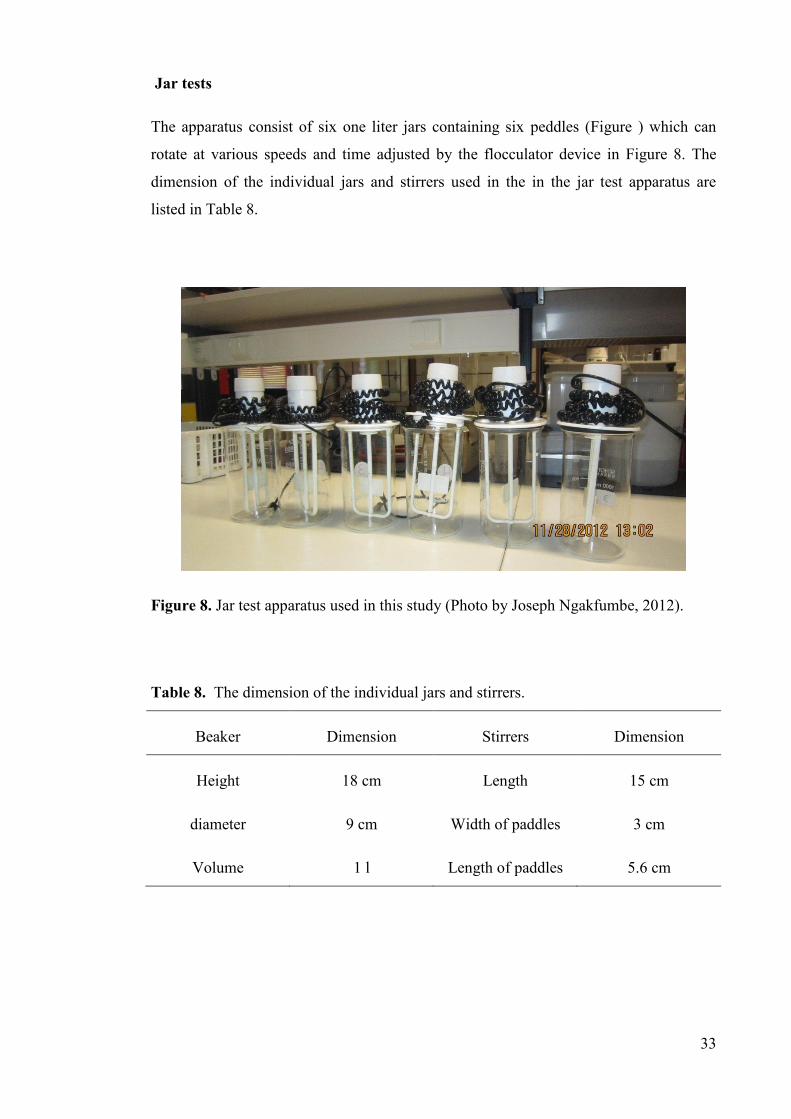
Jar tests
The apparatus consist of six one liter jars containing six peddles (Figure ) which can
rotate at various speeds and time adjusted by the flocculator device in Figure 8. The
dimension of the individual jars and stirrers used in the in the jar test apparatus are
listed in Table 8.
Figure 8. Jar test apparatus used in this study (Photo by Joseph Ngakfumbe, 2012).
Table 8. The dimension of the individual jars and stirrers.
Beaker Dimension Stirrers Dimension
Height 18 cm Length 15 cm
diameter 9 cm Width of paddles 3 cm
Volume 1 l Length of paddles 5.6 cm

34
Jar test procedure;
Fill in each of the individual jars with 1 litter of water sample.
Apply constant and equal mixing parameters as well as sedimentation time to all
the jars. Constant mixing parameters applied: Fast mix speed: 300 rpm; fast mix
time: 10 sec; Slow mix speed: 50 rpm; Slow mix time: 25 min. The speeds and
times were adjusted using the flocculator 200 Figure 9. Sedimentation time of 30
min was applied.
Figure 9. Flocculator 200 used in varying flocculation speeds and times (Photo by
Joseph Ngakfumbe 2012).
Add incremental dosages of the coagulant from jar 1 to jar 6 and start the
running the experiment.
Supernatant water was carefully extracted from each jar soon after sedimentation
time and analyzed on the spot for turbidity, color, pH and conductivity.
Purification efficiency of each jar was evaluated and expressed in the ratio of;
turbidity of the treated water (T) against turbidity of the raw water (Ti), and
color of the treated water (C), against color of the raw water (Ci). The turbidity
and color were measured using the HACH Ratio XR turbidity meter and
Lovibond color measuring device Figure 10 and
Figure respectively.

35
Figure 10. Turbidity meter used for measuring turbidity (Photo by Joseph Ngakfumbe
2012).
Figure 11. Lovibond device used in measuring color (Photo by Joseph Ngakfumbe
2012).
About 400 ml of supernatant water is carefully extracted from the jar which
presented the best removal of color and turbidity after a total of 45 minutes of
sedimentation. The extracted samples was then sent for further analyses.

36
Stage 1 – Jar test procedure
Three replication of the jar test procedure was performed in this stage of laboratory
experiments where increasing dosages of the individual coagulants were applied into the
6 sequential jars. The best or the optimum dosage was sent for further analysis from
each replica. With pAMINE a dosage range of 20 mg/l to 80 mg/l was applied while a
range from 50 mg/l to 110 mg/l was applied for pDADMAC, and dosages from 120
mg/l to 220 mg/l were tested for PFS. The mixing parameters were constant for all the
experiments as detailed in the previous section.
Stage 2 - Optimization of mixing
Using the one factor at a time procedure a series of jar tests were carried out to
investigate the influence of each mixing parameters on the purification efficiencies of
each of the chemicals. Mixing speeds and times were investigated while the settling
time stayed constant at 30 minutes in all the experiments.
The experiments were carried out as follows;
Three jars were filled with raw water and dosed with the optimum dosage of the
coagulant in question (50 mg/l, 80 mg/l and 200 mg/l for pAMINE,
pDADMAC, PFS respectively).
The stirrers of each of the three jars were programed with one of the four mixing
parameters different in each of the jars and the other three remaining constant as
shown in .

37
Table 9.
Table 9. Fast mixing times and speeds.
Fast mixing Slow mixing
Time (seconds) Speed (rpm) Time (minutes) Speed (rpm)
10 100 5 20
30 200 10 50
60 300 15 70
90 400 25 90
Stage 3 – Settling
The settling characteristics of the coagulants were investigated in two experiment
replications for each chemical at room and low temperatures; jar test procedure was
followed with the following modifications;
The jars marked at 8cm from the bottom.
The optimum dosage of the coagulant to be investigated was then added, a
sample is collect from jar a minute before the end of slow mixing time and 10
other samples are collected at 1, 2, 3, 4, 6, 8, 11, 13, 17 and 25 minutes after
slow mixing (flocculation) time or during sedimentation.

38
Stage 4- Influence of low Temperature
Experiments to evaluate the influence of temperatures were performed using a
temperature control water tank. The jars containing raw water were placed in the tank
until the required temperature of 2±2o
C was achieved. The optimum dosage at low
temperature was tested following the steps in stage 1.
Samples extracted from the jars treated with the optimum dosage of each coagulant
were sent for further analyses.
Stage 5- influence of pH
The initial pH of water samples was decreased from 6.5 to 5.5 and then to 4.5 using
stock solution of sulphuric acid 0.5 M. When the desired pH was achieved the adjusted
raw water samples were then submitted to the procedures highlighted in stage 1 for the
evaluation of dosage requirements and purification efficiency, the effect of pH on the
settling characteristics were not investigated.
After every step in the jar test procedure the results were recorded in a log sheet. The
ratio of treated turbidity (T) and color (C) against turbidity (Ti) and color (Ci) of the raw
water were also calculated for each dosage to determine dosage requirement and
purification efficiency. Average percentage removal of turbidity and color were also
calculated. Similar calculation were done on result from accredited laboratory SYKE
results where percentage removal of total nitrogen (T.N), total phosphorous (T.P),
phosphate (PO4), Suspended Solids (SS), total organic carbon (TOC), iron and
aluminum. For easy evaluation and visualization graphs were drawn and some cases the
results were presented in tables.

39
5 Results and Discussions
5.1 The determination of dosage requirement and purification
efficiency
The results of the determination of dosage requirement and purification efficiency were
presented in graph of the ratio of C/Ci and T/Ti against dosage (mg/l). The graph of pH
and dosage was also plotted for all tested coagulant at room temperature (22±1 ⁰C) and
low temperature (2±2 ⁰C). The average removal of the analyzed substances which
shows how they are reduced by each coagulant compared to their initial concentration
was also presented at both temperatures.
5.1.1 Optimum dosage and purification efficiency at 22±1 ⁰C
Increasing the dosage of coagulants resulted in an increase in the removal of color and
turbidity for all tested coagulants (Figure 12). The dosage requirement of tested
coagulant, however, differed considerably; PSF required higher dosage than the
pAMINE and the pDADMAC to achieve similar purification levels. The optimum
dosage range for pAMINE was found to be from 40 mg/l to 80 mg/l (Figure 12a). There
is a sharp drop in turbidity between 20 mg/l and 40 mg/l. The removal of turbidity

40
peaked at 40 mg/l and further increase in dosage showed little or no change in the
removal of turbidity. The optimum dosage for pAMINE was identified as 50 mg/l.
PDADMAC showed slightly different trends of turbidity and color removal compared
to pAMINE and the dosage requirements were also higher (Figure 12b), pDADMACs
curves presents a gentle slope from 0 mg/l up to about 55 mg/l where there is sharp drop
in turbidity when the dosage of 60 mg/l is applied. The best removal was achieved
around the dosage of 75 mg/l. As with pAMINE there is no further change in turbidity
removal after the optimum dosage was achieved. The pH was also plotted against
dosage. For both organic polymers dosage had no effect on the initial pH.

41
Figure 12. Optimum dosage range determination; removal of color and turbidity with
increasing dosage of coagulants.
0,0
1,0
2,0
3,0
4,0
5,0
6,0
7,0
0,0
0,2
0,4
0,6
0,8
1,0
1,2
0 20 40 60 80
pH
Rat
io f
/i
Dosage (mg/l)
A. pAMINE
T/Ti
C/Ci
pH
0,0
1,0
2,0
3,0
4,0
5,0
6,0
7,0
0,0
0,2
0,4
0,6
0,8
1,0
1,2
0 30 60 90
pH
Rat
io f
/i
Dosage (mg/l)
B. pDADMAC
T/Ti
C/Ci
pH
0,0
1,0
2,0
3,0
4,0
5,0
6,0
7,0
0,0
0,2
0,4
0,6
0,8
1,0
1,2
1,4
80 100 120 140 160 180 200 220 240
pH
Rat
io f
/i
Dosage mg/l
C. PSF
T/Ti
C/Ci
pH

42
The optimum dosage for the inorganic coagulant PFS ranged between 180 mg/l – 220
mg/l (Figure 12c). Analysis of obtained results for PFS showed a slight increase in
turbidity between 0 to 120 mg/l followed by a relatively gentle drop in turbidity and
color between 120 mg/l and 180 mg/l. There was no further change in turbidity removal
up to 220 mg/l. The pH was again plotted against dosage and unlike the organic
coagulants there was a considerable drop in pH when increasing dosages of PFS were
applied from 6.0 to 3.8 at 220 mg/l. The identified optimum dosages for all tested
coagulants were; 200 mg/l for PFS, 50 mg/l for pAMINE and 80 mg/l pDADMAC.
The observed average removals T.N, T.P, PO4, SS, turbidity, color, Fe and Al are
presented in Figure 13. The removal of T.P, PO4, SS, Fe and Al ranged from 80 to 97
%, PFS performed better in the removal of most analyzed substances, and the organic
coagulant removed higher amounts of Fe. Samples treated with pAMINE presented
more than 40 % increase in their nitrogen content while PFS and pDADMAC remove
around 40 % of the initial nitrogen concentration. Low TOC removal was observed with
organic polymers, pAMINE removes about 20 %, pDADAMAC around 40 % while
PFS removed about 75 %. Where optimum dosages were applied all coagulants
achieved high removal of turbidity and color (85-95 %). PFS showed a slightly higher
removal of color and turbidity (95 %) compared to the organic coagulants (85-95 %).

43
Figure 13. Average removal efficiency of analyzed substances compared with their
initial concentration at 22±1⁰C.
5.1.2 Purification efficiency at 2±2 ⁰C
During the evaluation of dosage requirements at low temperature for all coagulants it
was observed that although the identified optimum dosages were the same as those
identified at 22±1 ⁰C the curves representing the removal of color and turbidity with
increasing dosages were slightly different Figure 14. The pH remained unchanged with
the organic polymers but decreased steadily with increase in dosage with PFS as is the
case at temperature 22±1⁰C.
-80,0
-60,0
-40,0
-20,0
0,0
20,0
40,0
60,0
80,0
100,0
T. N T. P PO4 SS TOC Turb. Colour Fe μ g/l
Al μ g/l
Av
% r
emo
val pAMINE
pDADMAC
PFS

44
Figure 14. Determination of dosage requirement according to turbidly and color
removal for all tested coagulants at 2±2 ⁰C.
0,0
1,0
2,0
3,0
4,0
5,0
6,0
7,0
0,0
0,2
0,4
0,6
0,8
1,0
1,2
0 30 60 90
pH
Rat
iio f
/i
Dosage (mg/l)
A. pAMINE T/Ti
C/Ci
pH
0,0
1,0
2,0
3,0
4,0
5,0
6,0
7,0
0,0
0,2
0,4
0,6
0,8
1,0
1,2
0 30 60 90 120
pH
Rat
io f
/i
Dosage (mg/l)
B. pDADMAC
T/Ti
C/Ci
pH
0,0
1,0
2,0
3,0
4,0
5,0
6,0
7,0
0,0
0,2
0,4
0,6
0,8
1,0
1,2
0 50 100 150 200
pH
Rat
io f
/i
Dosage (mg/l)
C. PSF T/Ti
C/Ci
pH
45
In Figure 14a at 30 mg/l for example the results show that pAMINE’s removal ratio of
color and turbidity was less than 0.4, this is similar to the removal of color and turbidity
at room temperature. The impact of low temperature was visible when dosage was
above 30 mg/l. In Figure 14b at 60 mg/l pAMINE removed around 60 % of turbidity at
low temperatures; it had performed better at 60 mg/l at room temperature removing
about 80 % of turbidity. In Figure 14c, 170 mg/l of PFS at 2±2 ⁰C removed about 80 %
of turbidity and color; its removal ratio improved only slightly when dosage was
increased to 220 mg/l. Although at 22±1 ⁰C and low temperature PFS had a similar
percentage removal at 170 mg/l; the removal of turbidity and color improved to more
than 95 % at 190 mg/l and above at 22±1 ⁰C.
Comparing the performance of coagulants in the removal of analyzed substances at 2±2
⁰C (Figure 15), it can be seen that pAMINE did not leach nitrogen into the system rather
it removed over 10 %. Futhermore, the removal of T.N was higher at lower
temperatures for all tested coagulants. The removal of PO4 showed no dependence on
temperature with pAMINE while with pDADMAC there was a slight decrease in the
removal of PO4 at lower temperatures (Figure 15a). There was a more significant
difference in PO4 removal when PFS was applied, PO4 removal varied from about 90 %
at low temperature to 98 % at 22±1⁰C. The removal of TOC was not very temperature
dependent although all tested coagulants performed slightly better at lower
temperatures. Total phosphorous removal was also not temperature dependent; the
percentage removal variations were minimal although there was slightly higher removal
at 22±1⁰C. Nevertheless the removal of SS, turbidity and nitrogen did suffer detrimental
effects due to the low temperature applied (Figure 15).

46
Figure 15. Comparison between removal efficiencies at 2±2 ⁰C and 22±1 ⁰C.
-60
-40
-20
0
20
40
60
80
100
T. N T. P PO4 SS TOC Turb. Colour
Av
% r
emo
val
A. pAMINE
2°C
20°C
0
20
40
60
80
100
T. N T. P PO4 SS TOC Turb. Colour
Av
% r
emo
val
B. pDADAMAC
2 C
20 C
0
20
40
60
80
100
T. N T. P PO4 SS TOC Turb. Colour
Av
% r
emo
val
C. PFS
2 C
20 C

47
5.1.3 Settling characteristics of tested coagulants.
Settling characteristics is a measure of how flocs generated by the addition of coagulant
settle under the applied process parameters.
At 22±1oC the settling characteristics of pAMINE and pDADMAC show similar trends
when their optimum dosages was applied, the settling begins as soon as slow mixing
was completed and hits the 0.2 Tt/Ti ratios or 80 % removal after about 13 minutes.
PSF showed slightly better settling characteristics, it achieved the 0.2 ratio much earlier
after about 11 minutes.
The settling characteristics were also investigated at low temperatures, the results
obtained shows that the coagulants settling rate dropped slightly although similar results
were obtained at the end of the 25 minutes settling time. Comparing the settling
performance of the tested coagulants at 2±2 ⁰C and 22±1 ⁰C Figure 16a, b and c clearly
show better settling at higher temperatures. At room temperature all the tested
coagulants had their best clarification over 15 minutes of sedimentation but best
clarification levels was only achieved close to 25 minutes of sedimentation at low
temperature, especially for organic coagulants.

48
Figure 16. Settling characteristics of tested coagulants at 22±1oC and 2±2 ⁰C.
From Figure 16a pAMINE settled 50 % of particles within the first 7 minutes, while it
took approximately 12 minutes at low temperature to settle 50 % of the particles,
0,0
0,2
0,4
0,6
0,8
1,0
1,2
0 5 10 15 20 25 30
Tt/T
i
Time (min)
A.pAMINE
5 C
20 C
0,0
0,2
0,4
0,6
0,8
1,0
1,2
0 5 10 15 20 25 30
Tt/T
i
Time (min)
B. pDADMAC
5 C
20 C
0,0
0,2
0,4
0,6
0,8
1,0
1,2
0 5 10 15 20 25 30
Tt/T
i
Time (min)
C. PSF
5 C
20 C

49
pDADMAC showed little variation with change in temperature while PFS reached the
50 % mark within the first 5 minutes at 22±1oC but double that time to settle 50 % of
flocs at low temperatures.
5.1.4 The determination of dosage requirement and purification efficiency -
Discussion
In this study the dosage requirement of the organic coagulant obtained were 50 mg/l to
80 mg/l and 70 mg/l to 110 mg/l for pAMINE and pDADMAC respectively while the
dosage requirement for PFS was observed between 170 mg/l to 220 mg/l. This tie with
Bratby, 2006 and Nozaic et al 2001 who affirm that, one of the advantages of organic
polymers is the lower dosage requirement compared to inorganic coagulants. The
purification efficiencies achieved by all tested coagulants varied with the various water
quality parameters but most of them were within the projected level for chemical
treatment of peat - derived runoff water; 30 - 90 % SS, 30 - 60% T.N, and 75 - 95 %
T.P ( IPS, 2009, cited in Heiderscheidt et al 2013). For example pAMINE and
pDADMAC removed above 85 % SS and T.P, while pDADMAC removed about 38 %
of T.N well within expected level of for chemical treatment of peat – derived runoff
water. These performances are in line with studies carried out by Micheal and Morelos,
1995 cited in Bolto and Gregory, 2007 affirming that polyelectrolytes could be
successfully used as primary coagulants in water and wastewater treatment. Studies
carried out by Volk et al, 2000; Matilainen et al, 2005, 2010 cited in Heiderscheidt,
2013, shows the use of iron salts as coagulant favors the removal organic matter, there
was therefore comparatively low removal of TOC by the organic coagulants 23 % and
38 % for pAMINE and pDADAMAC respectively compared to 75 % by PFS. There
was a slightly higher removal of Fe by the organic coagulants compared to PFS, this
again tie with the one the advantages of organic coagulant; reduced dissolved salt in
treated water as compared to inorganic coagulants. Where optimum dosages were
applied all tested coagulants achieved above 80 % removal within the first 15 minutes.
Contrary to Nozaic et al 2001 cited in Bratby, 2006 there was no charge reversal and
increase in turbidity when organic coagulants were applied beyond optimum dosage,
there was steady increase in removal of turbidity with increases in dosage.

50
Low temperatures will slowdown reaction rate and increase viscosity (Yu et al, 2006).
Our results clearly portray lower removal efficiency in most of the parameters at low
temperatures; 18 % reduction in SS, 16 % drop in removal of turbidity, 11 % drop in
color with pAMINE, and 24 % drop in SS, 11 % reduction in turbidity, 11 % drop in
color with pDADMAC when temperatures were lowered. Similarly reduced
performances were also observed with PFS; 26 % reduction in SS and 0.5 % reduction
in turbidity and color. However, all tested coagulants showed little or change in removal
of TOC, T.P, and PO4 at lower temperatures while there was an increase in the
percentage removal of T.N with all tested coagulants.
5.2 Optimization of mixing parameters
The goal of optimizing the mixing parameter was to establish the effects of the different
stages of mixing on purification efficiency as well as to identify the most optimum
mixing parameters for the individual coagulants. Various mixing speeds and different
times were investigated. The results for mixing optimization are present based on
turbidity removal.
5.2.1 Coagulation or fast mixing stage
Figure 17 shows the effects of fast mixing speed and time variation on percentage
removal of turbidity. The slow mixing speed and time were 50 rpm and 25 minutes
respectively; the result show that fast mixing had less effect on organic coagulant, at 0
rpm or when there was no fast mixing pAMINEs removal of turbidity was above 80 %
and pDADMAC about 70 %. According to the results PSF is much more dependent on
fast mixing; its removal efficiency of turbidity when no fast mixing was applied was
only about 20 %. The removal efficiency improved significantly when fast mixing was
applied. The percentage removal of the organic polymers improved with increase in
speed and peaked at 300 rpm while PFS removal did not vary beyond 100 rpm with
increase in mixing speed. The best fast mixing speed was 300 rpm for the organic
polymers and it ranged from 100 rpm to 400 rpm for PFS. There was a slight reduction
in percentage removal of turbidity beyond 300 rpm for the organic coagulants.

51
Figure 17. The effects of fast mixing speed and time on percentage removal of
turbidity.
With fast mixing time fluctuating from 0 s up to 90 s all three tested coagulant peaked at
10 s, there was a general fluctuation in percentage removal between 10 s and 90 s. As
was the case with fast mixing speed, PFS´s performance was relative weak at 0 s mixing
time. The best fasting mixing time was found to be 10 s for all coagulants. The
performance of PFS did not change much with longer mixing times beyond 10 s but
there a drop in the performance of the organic coagulants though it was stable between
30 s and 90 s.
0
10
20
30
40
50
60
70
80
90
100
0 rpm 100 rpm 200rpm 300rpm 400rpm
Av
% r
emo
val
A. Fast mixing speed
pAMINE
pDADMAC
PSF
0
10
20
30
40
50
60
70
80
90
100
0s 10s 30s 60s 90s
Av
% r
emo
val
B. Fast mixing time
pAmine
pDADMAC
PFS

52
5.2.2 Flocculation or slow mixing stage
During this phase fast mixing speeds and times were fixed at 300 rpm and 10 s
respectively. At 0 rpm or no slow mixing all tested coagulants presented low removal
efficiency, pAMINE suffered least with a percentage removal of turbidity of about 42
%, PFS about 33 % while pDADMAC suffered most. When no slow mixing was
applied pDADMAC increased the sample initial turbidity increasing turbidity by 20 %.
With slow mixing speed percentage removal peaked at 20 rpm for all the tested
coagulant. There was no significant change in the performance of the coagulants when
the speed was increased above 20 rpm, there was a slight drop though in the
performance of organic coagulants at higher speeds reducing from 90 % to 82 % with
pAMINE, and about 92 % to 85 % with pDADAMAC between 70 rpm and 90 rpm
(Figure 18). The best slow mixing speed for all tested coagulant was found to be
between 20 to 50 rpm.

53
Figure 18, - The effects of slow mixing speed and time variation on percentage removal
of turbidity.
Regarding the influence of slow mixing time, a sharp surge is observed in percentage
removal of turbidity when slow mixing time was applied (5 minutes) for all tested
coagulants. The removal of turbidity increased progressively up to the 25 minutes mark.
All tested coagulants showed a similar pattern with slow mixing speed although
pDADMAC was relatively weaker at mixing times less than 10 minutes (Figure 18).

54
5.2.3 Influence of mixing - Discussion
Our results show that the tested organic coagulants were not significantly affected by
variations in fast mixing speed. At 0 rpm pAMINE had a percentage removal of
turbidity above 80 % and pDADMAC above 70 % while PFS above 20 %. This is in
line with earlier studies carried out by Heiderscheidt et al., 2013; Rossini et al., 1998;
Kan et al., 2001. Working with metal salts they found a strong reliance of their
performance on rapid mixing. When no slow mixing was applied, all coagulant’s
performances were relatively poor; pDADMAC suffered the most and presented a 20 %
surge in turbidity. The other coagulants pAMINE and PFS removed around 40 % and
35 % respectively. Nevertheless all coagulant soon peaked between 20 rpm and 50 rpm.
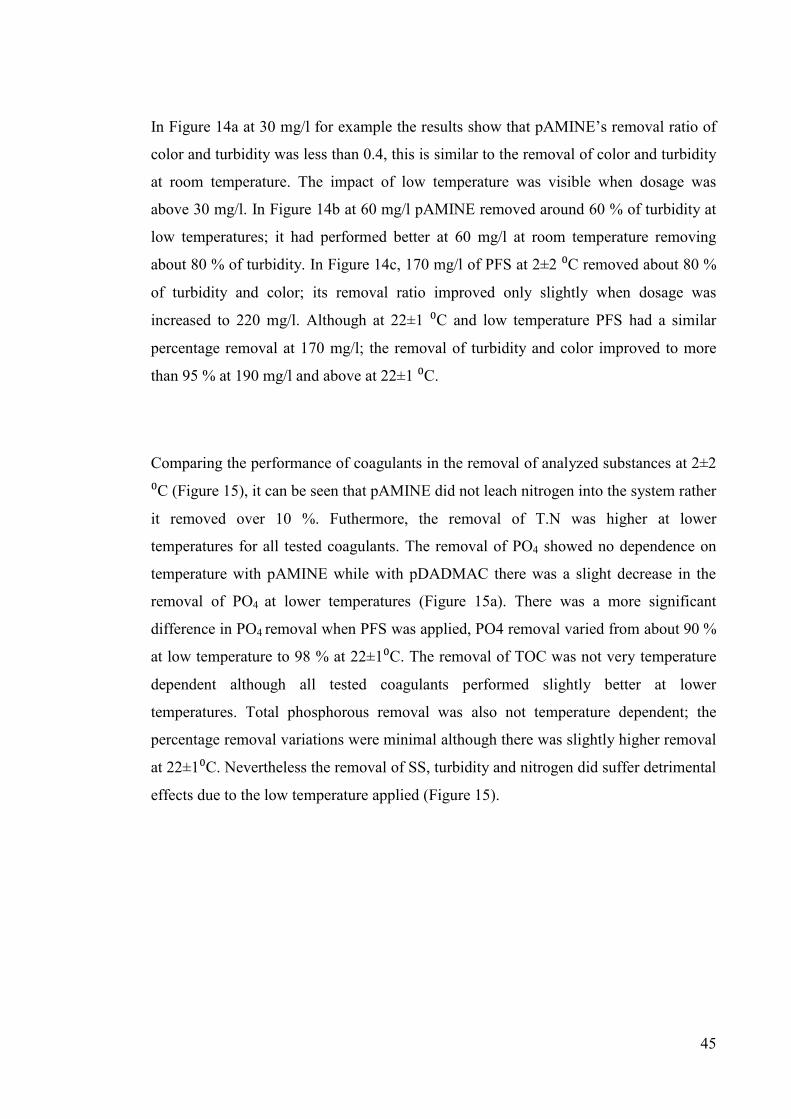
5.3 Influence of pH on purification efficiency
The influence of pH on the purification efficiencies was tested and the results are shown
in Figure 19a, b and c. In comparing the obtained results for pAMINE at 20 mg/l it is
clear that dosage requirement decrease with decreasing pH. For pH 4.5 pAMINE had
already achieved a removal of turbidity of above 80% while at pH 5.5 the removal was
only about 20% at the same dosage. The coagulant had similar removal efficiency at
both pH 4.5 and 5.5 after 30 mg/l (Figure a). The optimum dosage was identified as 30
mg/l and 40 mg/l for pH 4.5 and 5.5 respectively. Figure b shows that similar conditions
were observed for pDADMAC, at 40 mg/l pDADMAC had achieved a removal
percentage of less than 60% while at pH 4.5 the dosage of 40 mg/l had achieved about
80% removal.
According to the obtained results the performance of the inorganic polymer PFS was the
most dependent on pH. PFS dosage requirements greatly reduced with lower pH. At pH
4.5, a dosage of 120 mg/l of PFS had already achieved best removal of more than 85 %
while at the same dosage it removed barely 50 % of turbidity at pH 5.5 (Figure 22c).
55
Figure 19. Removal of turbidity with increasing dosages at pH 4.5 and 5.5.
0
0,2
0,4
0,6
0,8
1
1,2
0 20 30 40 50 60
Tt/T
i
dosage mg/l
A. pAMINE
pAMINE pH 6.5
pAMINE pH 5.5
pAMINE pH 4.5
0
0,2
0,4
0,6
0,8
1
1,2
0 40 50 60 80 90
Tt/T
i
dosage mg/l
B. pDADMAC
pDADMAC pH 6.5
pDADMAC pH 5.5
pDADMAC pH 4.5
0
0,2
0,4
0,6
0,8
1
1,2
0 120 140 160 180 200
Tt/T
i
dosage mg/l
C. PFS
PFS pH 6.5
PFS pH 5.5
PFS pH 4.5
56
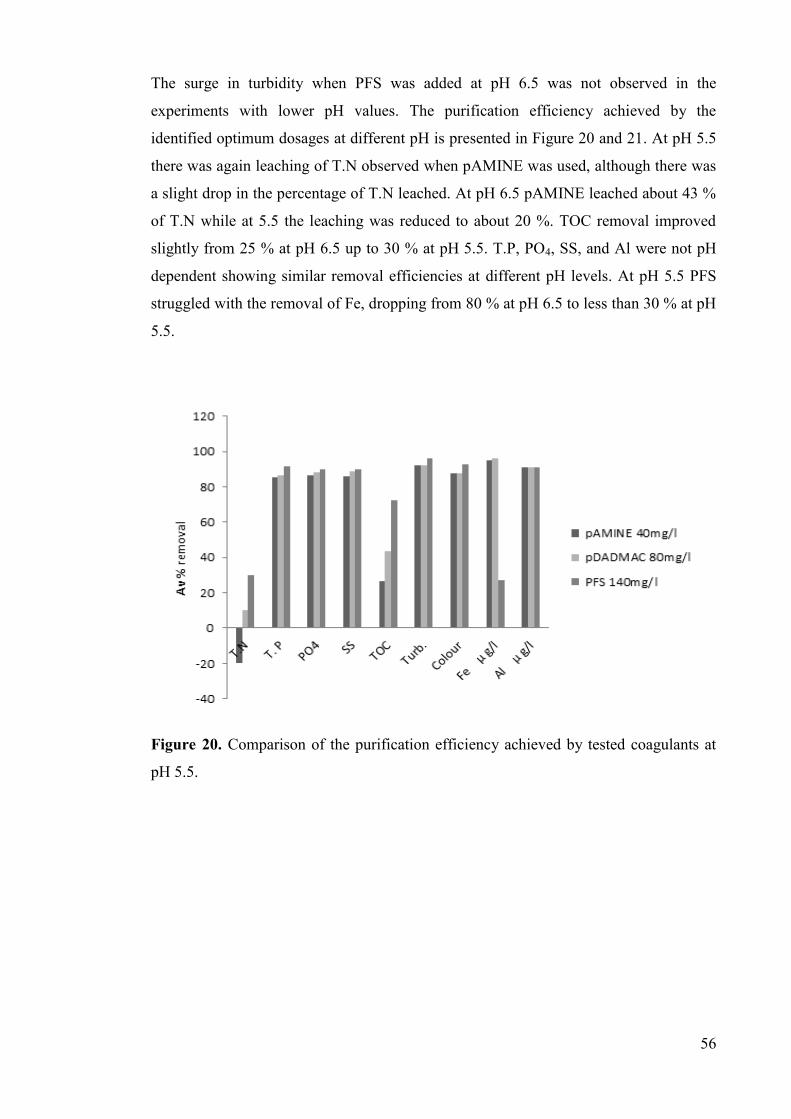
The surge in turbidity when PFS was added at pH 6.5 was not observed in the
experiments with lower pH values. The purification efficiency achieved by the
identified optimum dosages at different pH is presented in Figure 20 and 21. At pH 5.5
there was again leaching of T.N observed when pAMINE was used, although there was
a slight drop in the percentage of T.N leached. At pH 6.5 pAMINE leached about 43 %
of T.N while at 5.5 the leaching was reduced to about 20 %. TOC removal improved
slightly from 25 % at pH 6.5 up to 30 % at pH 5.5. T.P, PO4, SS, and Al were not pH
dependent showing similar removal efficiencies at different pH levels. At pH 5.5 PFS
struggled with the removal of Fe, dropping from 80 % at pH 6.5 to less than 30 % at pH
5.5.
Figure 20. Comparison of the purification efficiency achieved by tested coagulants at
pH 5.5.

57
Figure 21. Comparison of the purification efficiency achieved by tested coagulants at
pH 4.5.
There was again leaching of T.N into the system with pAMINE at both pH of 4.5 and
5.5, though there was a slight reduction in amount of Fe leached as pH decreased from
43 % at pH 6.5 (Figure 13), down to 20 % and 10 % at pH 5.5 and 4.5 respectively.
There was an improvement in removal of TOC with pAMINE from 22 % at pH 6.5 up
to about 38 % at pH 4.5. PSF showed a visible drop in the removal of Fe from about 80
% at pH 6.5 down to 30 % and 42 % removal at pH 5.5 and 4.5 respectively, PFS
showed an improved performance in the removal of Al from less than 80 % at pH 6.5 to
more 90 % at pH 4.5.
Where optimum dosages were applied at the various pH levels, the removal efficiency
was 90% and above Figure 22. Although lower pH values had lower optimum dosage
requirements, they all had an average removal of turbidity of more than 93 % at pH 6.5.
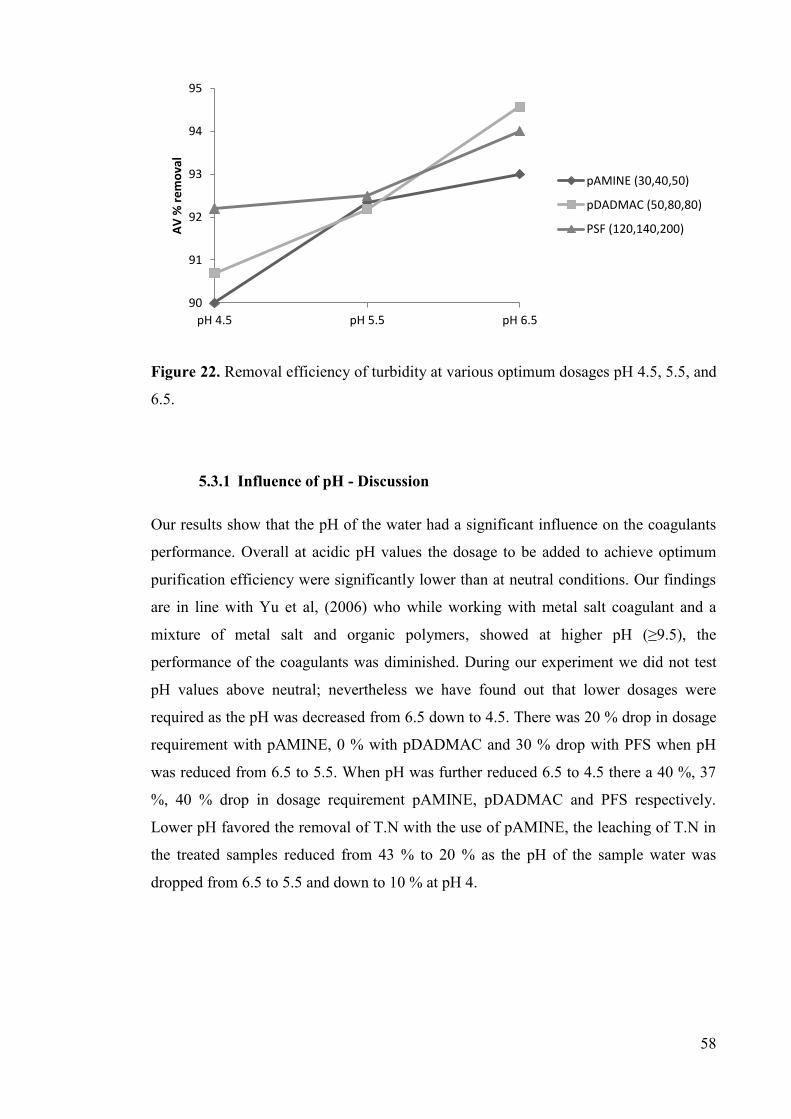
58
Figure 22. Removal efficiency of turbidity at various optimum dosages pH 4.5, 5.5, and
6.5.
5.3.1 Influence of pH - Discussion
Our results show that the pH of the water had a significant influence on the coagulants
performance. Overall at acidic pH values the dosage to be added to achieve optimum
purification efficiency were significantly lower than at neutral conditions. Our findings
are in line with Yu et al, (2006) who while working with metal salt coagulant and a
mixture of metal salt and organic polymers, showed at higher pH (≥9.5), the
performance of the coagulants was diminished. During our experiment we did not test
pH values above neutral; nevertheless we have found out that lower dosages were
required as the pH was decreased from 6.5 down to 4.5. There was 20 % drop in dosage
requirement with pAMINE, 0 % with pDADMAC and 30 % drop with PFS when pH
was reduced from 6.5 to 5.5. When pH was further reduced 6.5 to 4.5 there a 40 %, 37
%, 40 % drop in dosage requirement pAMINE, pDADMAC and PFS respectively.
Lower pH favored the removal of T.N with the use of pAMINE, the leaching of T.N in
the treated samples reduced from 43 % to 20 % as the pH of the sample water was
dropped from 6.5 to 5.5 and down to 10 % at pH 4.
90
91
92
93
94
95
pH 4.5 pH 5.5 pH 6.5
AV
% r
em
ova
l pAMINE (30,40,50)
pDADMAC (50,80,80)
PSF (120,140,200)

59
6 Conclusion
From this study it is very evident that cationic polyelectrolytes could be a suitable
replacement for the commonly used metal salt coagulant in chemical treatment of
wastewaters. Overall they presented satisfactory removal efficiencies and were less
affected by temperature, mixing and pH variations. The dosage requirements of the
tested organic polymers were significantly lower compared to the inorganic coagulant.
Organic polymers perform relatively well when fast mixing stage was excluded from
the treatment process unlike PFS which had its performance greatly affect. Organic
polymers have nevertheless showed higher sensitivity to the variations applied during
the slow mixing stage of the process although the removal efficiencies were not
significantly affected.
Lower temperatures greatly reduced the removal ability of SS, nevertheless the lower
percentage removal of T.P, PO4, turbidity and color stayed above 80 % for all
coagulants. Low temperatures though favored the removal of T.N and to a lesser extend
TOC.
Lower dosages were required to achieve optimum efficiencies for water samples with
lower initial pH. Based on our results it is therefore possible to conclude that lower
water pH leads to lower dosage requirements for the coagulants and pH range tested.
Further investigation is recommended for pAMINE and its leaching of nitrogen into the
system. Further dosage reduction could be achieved with the use of polyelectrolytes as
flocculant aids, hence further research in the combined use of polyelectrolytes as
coagulant and flocculant agents is highly recommended.

60
One of the main concerns of the use of organic polymers is their high cost some authors
nevertheless believe that this can be offset by their reduced dosages, less dependence on
pH, reduced sludge bulk, and their less susceptibility to mixing.

61
References
Akbar Baghvand, Ali Daryabeigi Zand, Nasser Mehrdadi and Abdolreza Karbassi,
2010. Optimizing Coagulation Processes for Low and High Turbidity Waters Using
Aluminum and Iron Salts. American Journal of Environmental Sciences 6 (5): 442-448.
American Water Works Association (AWWA), 1990. Water quality and treatment
Association of Finnish Peat Industries, 2010. Peat is an important natural resource in
Finland. Avialable at: http://www.turveliitto.fi/index.php?id=223 (accessed 25.10.2012)
Barkacs, K. Bohuss, I. Bukovszky, A. Varga, I. Gyula, Z., 2000. Comparison of
polyelectrolytes applied in drinking water treatment. Microchemical journal 67 (2000)
271-277.
Bolto, B. & Gregory, J., 2007. Organic polyelectrolytes in water treatment, Water
Research, 41 (2007), pp. 2301-2324.
Bratby, J., 2006. Coagulation and flocculation in water and wastewater treatment. 2nd
ed. London: IWA Publishing.
Daigle, J-Y. Gautreau-Daigle, H. 1999. Canadian peat harvesting and the environment
2nd
edition, Sustainable wetlands issues paper series, 2001 (1), pp. 2 – 22.
Gregory , J. & Duan, J., 2001. Hydrolyzing metal salts as coagulants. Pure Applied
Chemistry, 73 (12), pp. 2017-2026.
Hammer, J. & Hammer, J, Jr. 2008. Water and wastewater technology. 6th
edition.
Pearson International Edition.
Heiderscheidt, E., 2011. Chemical purification peat harvesting runoff water. M.Sc thesis
Unpublished. Water and environmental engineering laboratory, University of oulu.
Heiderscheidt, E, Saukkoriipi, J. Ronkanen, A-K. Klove, B., 2012. Optimization of
chemical purification conditions for the direct application of solid metal salt coagulants:
Treatment of peat derived diffuse runoff. Journal of Environmental Sciences. Accepted
Manuscript. DOI: 10.1016/S1001-0742(12)60111-9 pp. 1-24.
Jern, W. 2006. industrial wastewater treatment. Imperial College press.

62
Kan, C. Huang, C, Pan, J. 2002. Time requirement for rapid-mixing in coagulation.
Physiochemical and engineering aspects. 203 (2002), pp. 1-9.
Klove, B., 2001. characteristics of nitrogen and phosphorous loads in peat mining
wastewater. Water resources, 35 (10), pp. 2353-2362.
Lee, J-F. Liao, P-M. Tseng D-H. Wen, P-T. 1998. Behavior of organic polymers in
drinking water purification. Chemosphere 37 (6), pp. 1045-1061.
Rossini, M. Garrido, G, Galluzzo, M. 1999. Optimization of the coagulation-
flocculation treatment: influence of rapid mix parameters. Wat. Res. 33 (8), pp. 1817-
1826.
SNF FLOERGER. Drinking water [Web document] Available at: www.snf-
group.com/IMG/.../Drinking_Water_E.pd... [Accessed 25.10.2012]
Sopo, R et al., 2002. Environmental impact assessment of peat production, Instructions
for evaluating the effects on nature and neighbor relations of peat production. [Wed
document] The Association of Finnih Peat industry. Available at:
http://www.vapo.fi/filebank/1495-eia_abstract.pdf [accessed 25.10.2012]
Tzoupanos, N, D & Zouboulis, A, I. 2008. Coagulation-flocculation processes in
waste/wastewater treatment. The application of new generation of chemical reagents.
Vaezi, F, Mohagheghian, A. Nouri, J. Eshraghian M, R. Ghasri, A. 2005, Improvement
of NOM removal from water resources by modifying the coagulant vprocess. Iranian J
Env Health Svi Eng, 2 (1), pp. 43-49.
Vieltojarvi, O., 2005. water pollution control methods in peat mining [Wed document]
Finnish Environmental Institute (SYKE). River life. Available at:
http://www.ymparisto.fi/default.asp?node=15984&lan=en [accessed 25.10.2012]
Vieltojarvi, O., 2005. water pollution control methods in peat mining [Wed document]
Finnish Environmental Institute (SYKE). River life. Available at:
http://www.ymparisto.fi/default.asp?node=142279&lan=en [accessed 25.10.2012]
Vigneswaran, S. Visvanathan, C., 1995. Water treatment processes: simple options.
USA: CRC press LLC

63
World Wide Fund for Nature (WWF), 2008. Finland’s position on peat energy. [Wed
document] Available at:
http://www.wwf.fi/wwf/www/uploads/pdf/wwf_fi_position_on_peat_energy_october_2
008_eng.pdf[Accessed 25.10.2012]
Yan, M. et al., 2009. Natural organic matter removal by coagulation: effects of kinetics
and hydraulic power. water science & Technology: Water Supply, 9 (1), pp. 21-30.
Yu, J. Wang, D. Yan, M. Ye, C. Yang, M. Ge, X. 2007. Optimized coagulation of high
alkalinity, low temperature and particle water: pH adjustment and polyelectrolytes as
coagulant aids. Environ Monit assess (2007) 131. pp. 377-386.

64
Appendix 1
The last row on table A, B, C and D shows the average removal percentages at
respective optimum dosages and calculations of the standard deviation.
Table A, - Average % removal at optimum dosage at normal
temperature and pH 6.5 (pAMINE, pDADMAC, PFS)
Parameters pAIMNE pDADMAC PFS Standard Deviation
T. N -45,7 36 39,1 27,7
T. P 88,7 90 96,1 2,3
PO4 90,0 94 97,9 2,3
SS 85,6 87 97,0 3,6
TOC 23,0 38 76,8 16,0
Turb. 93,3 95 95,1 0,6
Colour 83,3 90 95,0 3,4
Fe μ g/l 93,6 94 80,3 4,5
Al μ g/l 89,0 88 88,5 0,4

65
Table B, - Average % removal at optimum dosages at low
temperatures. (pAMINE, pDADMAC, PFS)
Parameters pAMINE pDADMAC PFS Standard Deviation
T. N 12,50 43,75 59,38 13,8
T. P 85,62 80,82 90,41 2,8
PO4 89,13 91,30 88,04 1,0
SS 70,31 67,50 74,06 1,9
TOC 25,81 38,71 79,68 16,2
Turb. 81,62 81,50 86,72 1,7
Colour 76,88 78,75 84,38 2,3
Fe μ g/l 91,08 91,77 65,38 8,7
Al μ g/l 86,08 86,71 88,48 0,7
Table C, - Average % removal at optimum dosages at pH
4.5. (pAMINE, pDADMAC, PFS)
Parameters pAMINE pDADMAC PFS Standard Deviation
T. N -10 10 25 10,1
T. P 69 82 91 6,4
PO4 69 86 90 6,2
SS 82 85 91 2,8
TOC 33 40 63 9,1
Turb. 90 91 92 0,7
Colour 85 88 90 1,4
Fe μ g/l 91 91 47 14,5
Al μ g/l 84 85 91 2,2

66
Table D, - Average % removal at optimum dosages at pH
5.5. (pAMINE, pDADMAC, PFS)
Parameters pAMINE pDADMAC PFS Standard Diviation
T. N -20 10 30 14,5
T. P 86 87 92 1,8
PO4 86 88 90 1,1
SS 86 89 90 1,3
TOC 27 43 72 13,3
Turb. 92 92 96 1,3
Colour 88 88 93 1,7
Fe μ g/l 95 96 27 22,7
Al μ g/l 91 91 91 0,1


![Lecture on Intrinsically conducting polymers on textiles [EN] · Conducting polymers • Intrinsically conducting polymers (ICPs) are π-conjugated organic polymers able to conduct](https://img.pdfslide.us/doc/110x75/5f07a9317e708231d41e19a9/lecture-on-intrinsically-conducting-polymers-on-textiles-en-conducting-polymers.jpg)