Embed Size (px)
Citation preview
THE USE OF NATIONAL INCOME ACCOUNTS FOR LONG- RANGE PLANNING IN JAPAN1
by K. Ohkawa
I. INTRODUCTION: APPRAISAL OF GROWTH POTENTIALS
THB aim of this paper is to describe the uses of national income accounts in the preparation of Japan's 'New Long-Range Economic Plan 1961-70' and to make some personal comments on the methods employed. Though proposals are being made at Government level with a view to the integration of conventional social accounts with input-output tables, financial transactions accounts and national balance sheets by sectors, intensive practical use has so far only been made of national income acco~nts .~ Both short and long-term projections have been made using a national budgeting model, though here we will confine ourselves to a discussion of the latter.
First, a word about the plan and the planning machinery.= The major responsibility rests with the Economic Planning Agency of the Government, which has an advisory body desig- nated the Economic Deliberation Council composed of thirty members, appointed by the Prime Minister, and drawn from industry, banking and the universities. The Council itself set up three committees and seventeen sub-committees to aid it in its work. One of the committees, that of 'Quantitative Ap- proach', was given the task of framing models and appraising growth potentials using a national accounting approach. The general procedures involved were recorded in some detail in the New Long Range Economic Plan, but no document as yet exists which gives a technical account of methodology. The following
'1 am indebted to a number ~Findividnals for their comments and assistance on earlier drafts of this naner. My debts to Professor Harry Oshima and Mr. .. - - ~ ~ - r ~ ~ r - - - - G. K K t e r s are particularly great
*The Economic Planning Agency is resvonsible for the official estimates of national income and wealth. The sanie body has also prcp~red prcliminsry financial transacrions uccounrs and national balance sheers by sectors. The Bank of Jaoan has oublishrd moncv flow statements. Innut-outout tables were oririn- ally ~omuiled'by both the ~Eonomic Planning Aiencv and bv the ~inis t ; of
thisbaper I drew heavily on my'expirience as ~ i r e c t o r of the Economic Researcli InstituteoftheEconnmicPlanning Agencyatthe timewhentheplan wasprepared.
52 INCOME A N D WEALTH: SERIES X
discussion is a personal appraisal and description of the tech- niques employed.
Secondly, by way of introduction we may discuss the nature of the plan. In the f i~st place it is by no means rigid. The f i~st stage consists of an attempt to forecast the rise in real national product which it seems feasible to hope for in the ten-year period - roughly a doubling of the base year total. Implementation of the plan will be left in private hands; but it is hoped that valuable guidance will be given to private individuals in shaping their own future course of action by letting them have an outline of what the economy might look like in ten years' time. Govern- ment action will consist, in part, of the dissemination of advice but in addition it will take various positive steps to create a background against which the economy will be able to develop. In order that this might be achieved Government investment will be directed to various key points. Thus the necessary social overhead capital must be provided, transport must be improved, educational investments will be needed and encouragement will be given to the advancement of science and technology. At the same time various other policy objections not involving direct investment will be pursued. These include the reduction of inequalities between sectors of the economy, the securing of social stability, and the promotion of international trade and economic co-operation. Once the appropriate rate of growth has been forecast the Government may need to review its actions in order to ensure that the underlying conditions for its attainment are satisfactorily provided for. The plan, in short, is a 'real' one for the Government sector, while for the rest of the economy it is no more than a collection of consistent forecasts of the way in which private individuals are expected to react to the stimuli provided by the Government and by the external circumstances. The object of using a framework model is to ensure that the plans of the private and Government sectors will be consistent with one another.
The key problem in framing the plan centres around the difficulty of making a realistic appraisal of the growth potential of the economy in the period under review. In formulating the plan experience gained in two previous attempts has largely con- ditioned our approach.l Both the f is t plan, aimed at economic
Saburo Okita, the Director of the Planning Bureau gives a brief, account, of Japanese planning experience in his mimeographed paper, Economlc Plannlng in Japan (Economic Planning Agency, 1961).
K. OHKAWA 53
self-support in five years, started in 1956, and the New Long Range Plan 1958-62 failed in the sense that the rates of growth written into them proved to be underestimates of the capacity of the economy. The present plan is in the nature of a revision of the second which, in turn, was a revision of the first. In the first attempt the forecasting method consisted of little more than a mechanical extrapolation of trends in productivity per head, allied to expected changes in the active labour force. Little attention was paid to the movement of domestic investment or to the foreign trade position; two factors which were to have important effects on the rate of growth.' The second plan was somewhat more sophisticated, a trial growth rate approach being adopted with three sets of balances, employment, invest- ment-savings and foreign exchange, taken as major constraints. Various growth rates, selected from the range of past trends were then used and their anticipated results were checked against the constraints. Several technical and behaviouristic relation- ships also entered the analy~is.~ When a high growth rate was used two sets of balances, saving-investment and foreign ex- change, appeared out of equilibrium; with a low growth rate the employment situation would deteriorate. The final com- promise choice of 6.5 per cent per annum growth in real national income, as we have seen, turned out to be an underestimate of the potential realized by the economy. This was, in part, caused by favourable changes in the terms of trade. Further- more, an unexpected change appeared in the behaviour of pri- vate investment. The proportion of gross investment to G.N.P. rose to 354 per cent in 1959, which was well above the 28.5 per cent planned for 1962. Judging by the absence of price-increases, ex-ante savings must have risen by a similar amount. Indeed during the period 1953-8 the rate of increase in money value of investment, at 15 per cent per anuum, was higher than that in money value of consumption, at 6.4 per cent. Such developments imply that growth has been unbalanced and that consumption standards are not rising quite so quickly as is thought desirable. It was therefore decided, as a major policy objective, to attempt
'In this respect see Shigeto Tsuru 'Empirical Testing of Macro-Economic Planning in Japan', Keizai Kenky~r (The Economic Review), Vol. 9, No. 1, January 10CP .,*".
?Fur a fuller explanation see K. Ohkawa 'Conditions for rlrc Optimum Gro\\th Rare - An Opemtlonal Formula f ~ r Plan Making' In Ecocodo,,,ic P/a~m;,?g ill Jopm,, Translation scrics No. 6 (Thc h d n n Sraristiosl Insrilute, 1960).
54 INCOME AND WEALTH: SERIES X
to remedy this state of affairs, by attempting to increase the 'investment multiplier' and thereby also slowing down the rise in the capital-output ratio which increased from 1.05 in the boom period 1951-3 to 1.79 in the boom period 1957-60.
Subject to these two strategic assumptions the growth poten- tial for real product was appraised within a range of 6.5-8.0 per cent per annum on the average for the ten years. This, it should be noted, is a flexible target and year to year policy can be adjusted with this overall aim in mind. Such a procedure is thought preferable to the fixing of rigid targets. Though a rate of 7.2 per cent, sufficient to double the national income in the ten years, was adopted for the purpose of disseminating know- ledge ofthe plan, thereal objective is a doubling'inand around ten years'. While the forecasting method is similar to that used in the second plan, involving a trial growth-rate approach, the use of only three balancing constraints is replaced by the use of a fully articulated system of national accounts supplemented by independent considerations of the likely employment situation. Furthermore the aims of balanced growth and the maintenance of a more or less constant capital-output ratio are written into the plan.
n. THE USE OF NATIONAL INCOME ACCOUNTS AS TARGETS
It is a feature of the plan that its objective is expressed in terms of national product. In this section the object is to describe the accounting system which forms the basis of the framework model. Figures for the base and target years will be presented, though none are shown for intermediate years1 It must not be inferred from this, however, that no account is taken of inter- mediate years. In fact, year-to-year programmes are themselves to be constructed with the object of guiding the economy to- wards its long-term objective of a doubled national income.
' For statistical reasons the base selected covered thc 19568 fiscal years and the annual averages of the main economic indices far this period were projected to the tarzcr final year in constant 1958 nriccs. For exarn~le the avcrase G.N.P. in
reason for this is that, though the pian covers the period from 1960, &our& for this real base year ucre ni t avaliable at the time uhen thc plan uas made in 1959-60. The Iatcst full data related to 1958, so that it \\as, in cITcc~, necessary to makc a oro~rction of the 1960 lcvcl of G.N.P. from this. It was cxoectcd that the rate of growth between 1956-8 and 1960 would be much higher thin 7.2 per cent, hence the overall rate from 1956-8 to 1971 would also be above 7.2 per cent.
K. OHKAWA 55
Furthermore, in framing year-to-year plans it is expected that the growth rate will be higher in the first few years of the plan, mainly because it is expected that the labour force will increase more rapidly in the earlier than in the later years. Indeed, for 1961-3 the expected growth rate is of the order of 9 per cent per annum.
In the publication of the plan use is made of a number of major tables in which the official national accounts play an important role. However these major tables do not in themselves form an articulated accounting structure; they are merely con- solidations with alterations and omissions. Thus the five tables Supply Structure (S), Demand Structure (D), Saving-Investment Balance (I), Government Financial Revenues and Payments (G) and International Receipts and Payments with foreign exchange base (F) used in the plan must be related to the accounting system necessary for constructing the framework model.
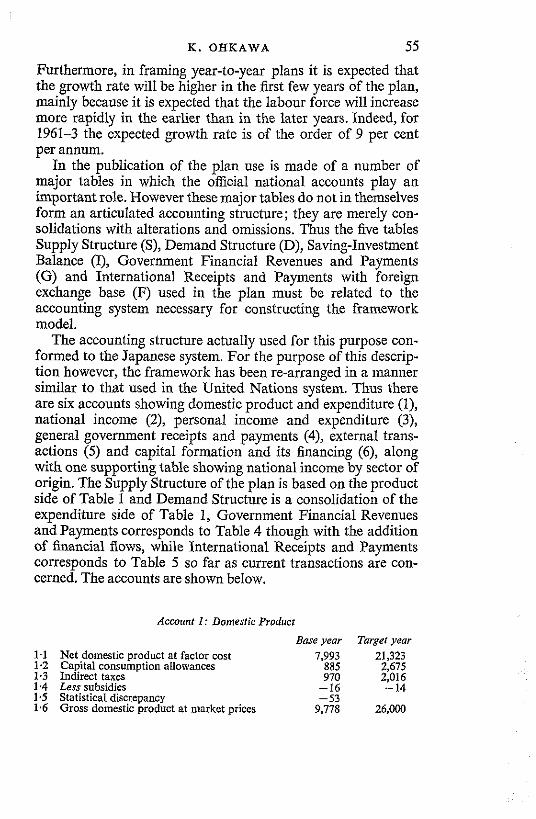
The accounting structure actually used for this purpose con- formed to the Japanese system. For the purpose of this descrip- tion however, the framework has been re-arranged in a manner similar to that used in the United Nations system. Thus there are six accounts showing domestic product and expenditure (I), national income (Z), personal income and expenditure (3), general government receipts and payments (4), external trans- actions (5) and capital formation and its financing (6), along with one supporting table showing national income by sector of origin. The Supply Structure of the plan is based on the product side of Table 1 and Demand Structure is a consolidation of the expenditure side of Table 1, Government Financial Revenues and Payments corresponds to Table 4 though with the addition of linancial flows, while International Receipts and Payments corresponds to Table 5 so far as current transactions are con- cerned. The accounts are shown below.
Account I : Domestic Product
Base year Target year Net domestic product at factor cost Capital consumption allowances Indirect taxes Less subsidies Statistical discrepancy Gross domestic product at market prices
56 INCOME AND WEALTH: SERIES X
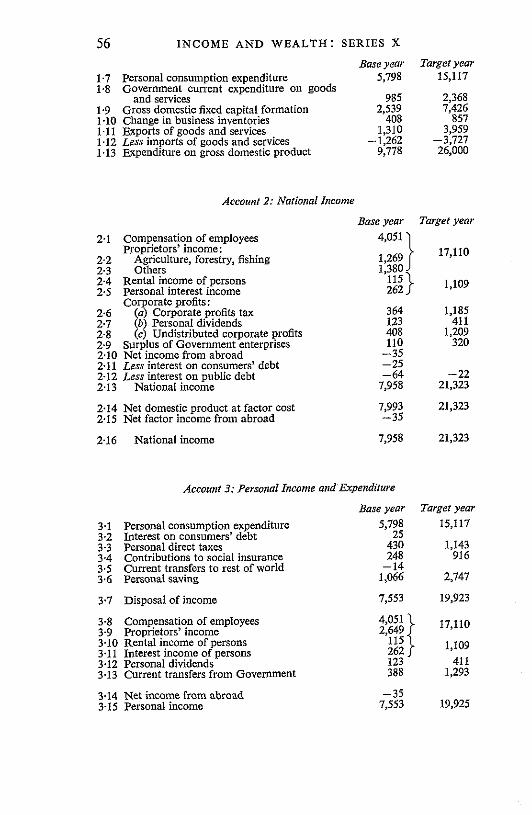
Base year Target year 1.7 Personal consumption expenditure 5;798 15,117 1.8 Government current expenditure on goods
and services 985 2,368 1.9 Gross domestic fixed caoital formation 2,539 7,426 1.10 Change in business inventories 408 857 1.11 Exports of goods and services 1,310 3,959 1.12 Less imports of goods and s e~ i ce s - 1,262 -3,727 1.13 Expenditure on gross domest~c product 9,778 26,000
Accoant 2: National Income
Base year Target year Compensation of employees Proprietors' income:
Amiculture. forestry. fishing
- (i) Cordorate profits tax (b) Prrsonal dlvldends (c) Undistrlbuted corporat~ profits
Surolus or Covcrnmcnt cnrcrorlsea Netincome from abroad - Less interest on consumers' debt Less interest on public debt
National income
2.14 Net domestic product at factor cost 7,993 21,323 2.15 Net factor income from abroad -35
2.16 National income 7,958 21,323
Account 3: Personal Income and Expenditure
Base year Target year
3.7 Disposal of income
3.8 Compensation of employees 3.9 Proprietors' income 3.10 Rental income of persons 3.11 Interest income of persons 3.12 Personal dividends 3.13 Current transfers from Government
3.14 Net income from abroad 3.15 Personal income
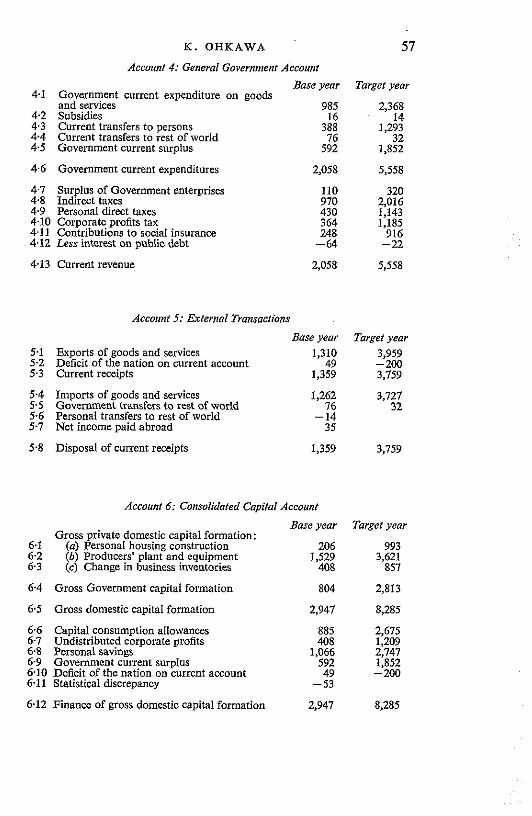
K. OHKAWA 57 Account 4: General Government Account
Base year Target year 4.1 Government current expenditure on goods
and services 985 2,368 4.2 Subsidies 14 4.3 Current transfers to persons 388 4.4 Current transfers to rest of world
l6 1,293 76 32
4.5 Government current surplus 592 1,852
4.6 Government current expenditures 2,058 5,558
4.7 Surplus of Government enterprises 4.8 Indirect taxes
4.13 Current revenue 2,058 5,558
Account 5: External Transactions
Base year Target yeor 5.1 Exports of goods and services 1,310 3,959 5.2 Deficit of the nation on current account 49 - 200 5.3 Current receipts 1,359 3,759
5 4 Imports of goods and services 5 .5 Governn!ent tv~nsfcrs to rest of world 5.6 Personal transfers lo real of world 5.7 Net income paid abroad
5.8 Disposal of current receipts 1,359 3,759
Account 6: Consolidated Capitol Account
Base year Targef year Gross private domestic capital formation:
6.1 (a) Personal housing construction 206 993 6.2 (b) Producers' plant and equipment 1,529 3,621 6.3 (c) CL!ange in business inventories 408 857
6.4 Gross Government capital formation 804 2,813
6.5 Gross domestic capital formation 2,947 8,285
6.6 Capital consumption allowances 885 2,675 6.7 Undistributed corporate profits 408 1,209 6.8 Personal savings 1,066 2,747 6.9 Government current surplus 592 1,852 6.10 Deficit of the nation on current account 49 - 200 6.11 Statistical discrepancy -53
6.12 Finance of gross domestic capital formation 2,947 8,285
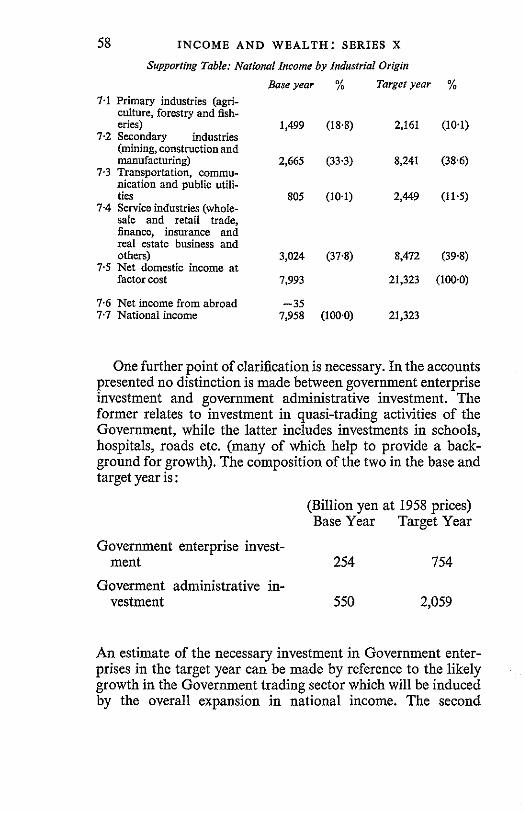
58 INCOME AND WEALTH: SERIES x Supporting Table: National Income by Industrial Origin
Base year % Target year % 7.1 Primary industries (agri-
culture, forestry and fish- eries) 1,499 (18.8) 2,161 (10.1)
7.2 Secondary industries (mining, construction and manufacturing) 2,665 (33.3) 8,241 (38.6)
7.3 Transportation, commu- nication and public utili- ties 805 (10.1) 2,449 (11.5)
7.4 Service industries (whole- sale and retail trade, finance, insurance and real estate business and others) 3,024 (37.8) 8,472 (39.8)
7.5 Net domestic income at factor cost 7,993 21,323 (100.0)
7.6 Net income from abroad -35 7.7 National income 7,958 (100.0) 21,323
One further point of clarification is necessary. In the accounts presented no distinction is made between government enterprise investment and government administrative investment. The former relates to investment in quasi-trading activities of the Government, while the latter includes investments in schools, hospitals, roads etc. (many of which help to provide a back- ground for growth). The composition of the two in the base and target year is:
(Billion yen at 1958 prices) Base Year Target Year
Government enterprise invest- ment 254 754
Goverment administrative in- vestment 550 2,059
An estimate of the necessary investment in Government enter- prises in the target year can be made by reference to the likely growth in the Government trading sector which will be induced by the overall expansion in national income. The second
K. OHKAWA 59
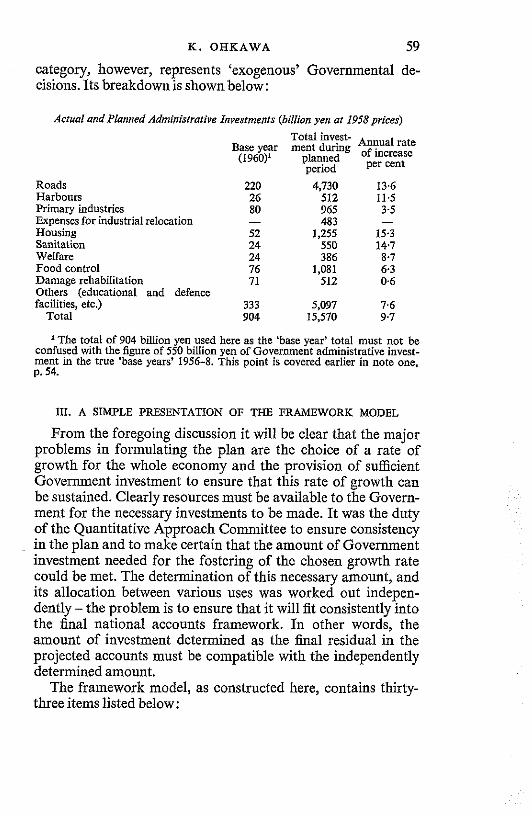
category, however, represents 'exogenous' Governmental de- cisions. Its breakdown is shown below:
Actual and Planned Administrative Investments (billion yen ar 1958 prices) Total invest- Annual rate
Base year ment during of increase (1960)' 9%: per cent
Roads 220 4,730 13.6 Harbours 26 512 11.5 Primary industries 80 965 3.5 Expenses for industrial relocation - 483 - Housing 52 1,255 15.3 Sanitation 24 550 14.7 Welfare 24 386 8.7 Food control 76 1,081 6.3 Damage rehabilitation 71 512 0.6 Others (educational and defence facilities, etc.) 333 5,097 7 .6
Total 904 15,570 9.7
'The total of 904 billion yen used here as the 'base year' total must not be confused with the figure of 550 billion yen of Government adm~nistrative invest- ment in the true 'base years' 1956-8. This point is covered earlier in note one, p. 54.
In. A SIMPLE PRESENTATION OF THE FRAMEWORK MODEL
From the foregoing discussion it will be clear that the major problems in formulating the plan are the choice of a rate of growth for the whole economy and the provision of sufficient Government investment to ensure that this rate of growth can be sustained. Clearly resources must be available to the Govern- ment for the necessary investments to be made. It was the duty of the Quantitative Approach Committee to ensure consistency in the plan and to make certain that the amount of Government investment needed for the fostering of the chosen growth rate could be met. The determination of this necessary amount, and its allocation between various uses was worked out indepen- dently - the problem is to ensure that it will fit consistently into the final national accounts framework. In other words, the amount of investment determined as the h a 1 residual in the projected accounts must be compatible with the independently determined amount.
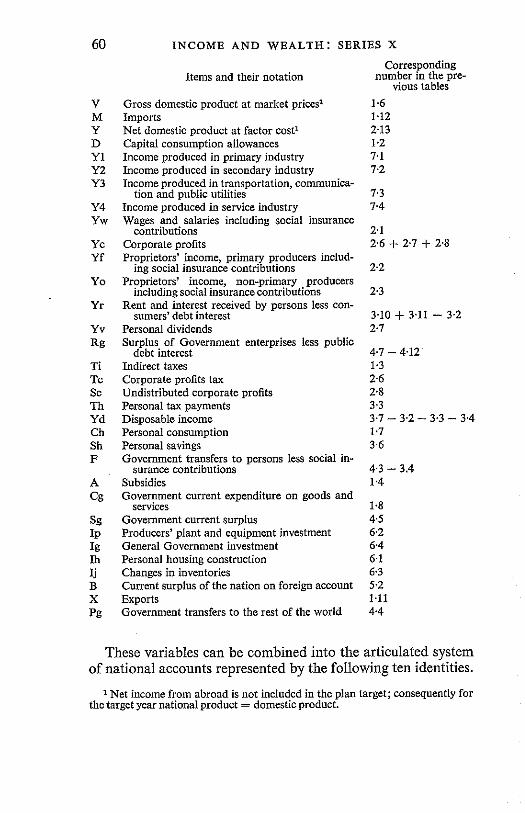
The framework model, as constructed here, contains thirty- three items listed below:
60 INCOME AND WEALTH: SERIES x
Items and their notation Corresponding
number rn the pre- vious tables
V Gross domestic product at market prices1 1.6 M Imports 1.12 Y Net domestic product at factor cost' 2.13 D Capital consumption allowances 1.2 Y1 Income produced in primary industw 7.1 Y2 Income produced in secondary industry 7.2
Income produced in transportation, commuuica- tion and public utilities
Income produced in service industry Wages and salaries including social insurance
contributions Corporate profits Proprietors' income, primary producers includ-
ing social insurance contributions Proprietors' income, non-primary producers
including social insurance contributions Rent and interest received by persons less con-
sumers' debt interest Personal dividends Surplus of Government enterprises less public
debt interest Indirect taxes Corporate profits tax Undistributed corporate profits Personal tax payments Disposable income Personal consumption Personal savings Government transfers to persons less social in-
surance contributions Subsidies Government current expenditure on goods and
services Government current surplus Producers' plant and equipment investment General Government investment Personal housing construction Changes in inventories Current surplus of the nation on foreign account Exports Government transfers to the rest of the wodd
These variables can be combined into the articulated system of national accounts represented by the following ten identities.
' Nct incomc from abroad is nor ~ncluded in the plan larger; consequcnrly for the target year narionalprodocr = domerricproducr.
K . OHKAWA 61
Related tables
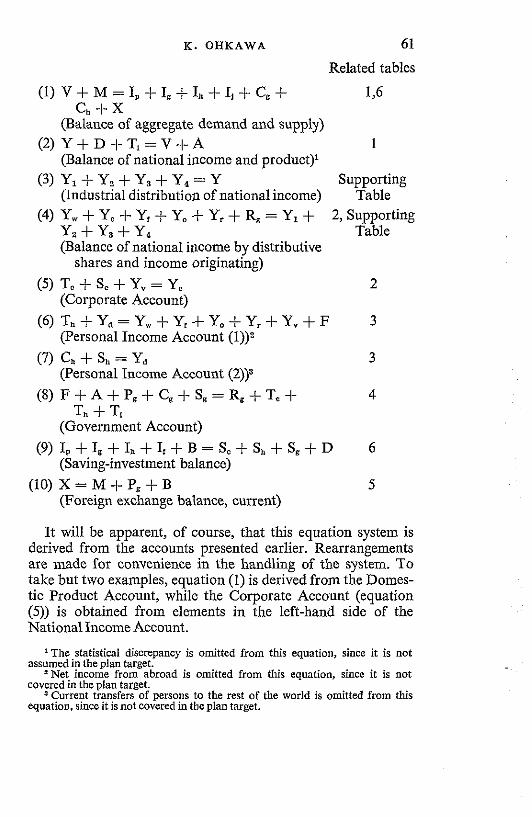
(1) V + M = I, + I, + I, + I, + C, + 1 5 C,. + X
( ~ a g n i e of aggregate demand and supply) (2) Y + D + T , = V + A 1
(Balance of national income and product)' (3) YI f Y, + Y3 + Y, = Y Supporting
(Industrial distribution of national income) Table (4) Yw + Y, + Y, + Yo 3. Y, + R, = Y, + 2, Supporting
y, + y, + Y, Table (Balance of national income by distributive
shares and income originating) (5) Tc + Sc + Y, = Y, 2
(Corporate Account)
(6) Tk + y a = Y, + Y, Yo + Y, + Y, + F 3 (Personal Income Account (1))"
(7) Ch + S, = Y, 3 (Personal Income Account (2))3
(8) F + A + P, + C, + S, = R, + T, + 4 Th + T, - . .
(Government Account)
(9) ID + 1, + 1, + Ix + B = S, + Sh + S, + D 6 (Saving-investment balance)
(10) X = M + P, + B 5 (Foreign exchange balance, current)
It will be apparent, of course, that this equation system is derived from the accounts presented earlier. Rearrangements are made for convenience in the handling of the system. To take but two examples, equation (1) is derived from the Domes- tic Product Account, while the Corporate Account (equation (5)) is obtained from elements in the left-hand side of the National Income Account.
'The statistical discrepancy is omitted from this eauation, since it is not assumed in the plan target'
'Net income from abroad is omitted from this equation, since it is not covered in the plan target.
Current transfers of persons to the rest of the world is omitted from this equation, since it is not covered in the plan target.
62 INCOME AND WEALTH: SERIES X
As a start let us look at the significance of certain of the entries. First, nationalincome (Y) is the major target - so called because there are other minor targets (the sectoral changes) subordinate to it. The variables fall into two groups, major and minor which, in turn, are divided into Government and private categories. A major variable is defined as one which is particu- larly sigdcant in determining the growth rate of the economy, while a minor variable is not so influential. General Govern- ment investment (Ig), investment in producers' plant and equip- ment (Ip) and exports (X) are the three major variables. Further- more Ig is a major 'instrument variable' (i.e. as we saw earlier it is aimed at affecting the growth rate through direct Govern- ment policy); Ip and X are major behavioural variables. Minor variables in the Government sector consist of the revenue items such as taxes (Tc, Th, Ti) and other revenue (Rg) and the expenditure items, current Government consumption (Cg), subsidies (A) and transfer payments (F). These will be deter- mined in accordance with Government policy. Minor private variables can be classified into four groups relating to income produced in each sector, income distributed, savings and con- sumption and investment (Ih and Ij only). These are all be- haviour variables which are to be projected using the technical and behaviouristic relations to be described later, or arrived at as residuals in the appropriate accounts. Imports (M) will be determined using a further behavioural relationship.
We are now in a position to proceed through the equations step by step in order to show that a final determination of Ig can be made. The easiest starting-point is equation (3), showing the sectoral distribution of national income at factor cost.
In forecasting the individual sectoral growth rates a number of factors had to be taken into consideration. First, and most obviously, the possible and desirable changes in the industrial structure had to be examined: in other words, given the target of a doubled national income, which sectors of the economy should contribute most towards it? Expected demand changes in the future and changing technical relationships must there- fore be taken into account. In addition, there is written into the plan the desirability of maintaining a more or less constant capital-output ratio. This must imply that the rates of growth in output in each sector should be balanced by a more or less equal rate of growth of the capital stock of each sector.
K . OHKAWA 63
As a start real income produced in the primary sector (YJ was projected by extrapolation of the past trend, with a slight upward adjustment being added to allow for the effects of Government policies operating on the sector. The rate of growth finally forecast was one of 2.8 per cent per annum. The next step was to combine the Y, and Y, sectors and to work out, by a method of simultaneous solution, the rates of growth in the Y, + Y,, and in the Y, sectors which, given the rate of growth in the primary sector of 2.8 per cent and the overall rate of growth of national income of 7.2 per cent, would satisfy the system. It was also assumed that the growth of capital and out- put in each sector would be equal, while data was available concerning the capital shares of each sector in the base period. The values so arrived at were 8.8 per cent for Y, + Y, and 8.2 per cent for Y,.
These results were then subjected to an independent check. For example, in the Y, sector a group of experts attempted a forecast of the production index for the separate industries involved, bearing in mind likely structural and technical changes, the supply of labour available, and the impact of Government policy. The separate indices were then combined into a conventional overall index of production, which is ex- pected to move at 1.21 times the rate at which incomes in the Y, sector move. This aggregating method gave a result of 9 per cent per annum for the rate of growth in Y,. In view of close agreement with the forecast of 8.8 per cent resulting from the k s t method, no further changes were made in the rates of growth forecast for Y, and Y,, though the rate of growth for Y, was put at 9 per cent per annum.
Having determined each of the sectoral products, it is now possible to move on to equation (4) and to arrive at the pattern of income distribution. A number of supplementary equations are used at this stage:
1. Proprietors' income in the primary sector (Yf) is estimated using a relationship linking it to total income produced (YJ in the sector. We have: Yf = aY, + b, where a = 0.758 and b = 150 billion yen. This relationship, in common with others used in this section was derived from data for the period 1953 to 1958.
2. The sum of employees' compensation (Yw) and corporate
64 INCOME AND WEALTH: SERIES x profits (Yc) is estimated from its relationship to income pro- duced in the non-primary sector (Yn = Y, + Y, + Y;) using the equation: YW + Yc = cYn + d (where c = 0.835, d = 46 billion yen).
To separate Yw and Yc it is further assumed that Yw will account for a stable share of 82.8 per cent of (Yw + Yc), with corporate profits accounting for the remainder.
3. The sum of personal rental income and interest (Yr) was estimated by its past average ratio (r) to national income (Y). This was put at r = 0.052. In a similar way dividends paid to persons (Yv) were estimated using a constant ratio (v) to Yc.
4. Finally the non-primary proprietors income (Yo) was de- rived as the residual in equation (4) : Yo = Y - (Yf + Yw + Yc +Yr +Rg).
It should be noted that Rg (the surplus of Government enter- prises) was determined independently outside the system.
As a result of these operations the twelve variables Y, Y,, Y,, Y,, Y,, Yw, Yc, Yf, Yo, Yv, Yr and Rg have been determined and equations (3) and (4) completed.
Before proceeding to the Personal Income and Corporate Accounts it is convenient to turn first to consider some features of the Government Account (equation (8)). In this case, the planners were presented by the Government with two inequali- ties which had to be observed. In the first place, the size of the budget was to be kept below its proportion (26 per cent) to national income (Y) in the base year. Secondly personal dis- posable income was to be kept at a level below 94 per cent of total personal income through the use of personal taxes (Th). Government current consumption (Cg) and subsidies (A) were to form decreasing proportions of national income, while the proportion of transfer payments (F) was to be increased. The other items (taxes on corporations Tc, and indirect taxes Ti) were also to be adjusted in the light of policy aims, while Rg was determined independently as mentioned earlier and so was Pg. The Government current surplus Sg then appears as the residual to complete equation (8) (though the use of the word 'residual' in this connection is somewhat dubious).
Moving on to equation (6) all of the items in it are now deter-
K . OHKAWA 65
mined apart from disposable income Yd. This clearly appears as a residual, though care is taken, by variation of Th and F, to ensure that it is less than 94 per cent of personal income in total. This value of Yd can then be taken down to equation (7) in order to be used in the determination of personal consumption (Ch). In order to do this the saving of individuals (Sh) is esti- mated at 15.4 per cent of disposable income by using a weighted average of the savings ratios for various types of households to the disposable incomes of each household group. We have:
sh Yd = sw(Yw - Tw) + sf (Yf - Tf) + so (Yo - To).
Here Yw represents wages and salaries of workers, Yf repre- sents proprietors' incomes in the farming sector, and Yo (which includes Yr, personal rent and interest) represents proprietors' income in the non-primary sector. Tw, Tf and To are the taxes paid in each sector - obtained by a careful breakdown of total personal tax payments (Th). The values of 'sw', 'sf' and 'so' used were 12.5 per cent, 6.6 per cent and 31.6 per cent, these being based on the bold assumption that recent sectoral savings ratios will remain unchanged and that variations in 'sh' will only be produced by changes in the relative numbers of different types of households.
It will be apparent too that we now have sufficient informa- tion to complete the corporate account (equation (5)). Yc and Yv have both been estimated, while tax payments (Tc) are determined by Government policy. An estimate of corporate savings (Sc) will therefore appear as a residual in the account.
Attention may now be turned to the methods used in the estimation of imports and exports, two of the major variables in the system. The great difficulty here lies in quantifying the proportion (b) of imports to national income for the target year. It was finally estimated at 16.7 per cent as compared to 14.1 per cent in the base year. The experts engaged on this problem agreed that mechanical entrapolation of past trends was not a satisfactory forecasting technique, owing to the fact that con- flicting forces are likely to be at work. On the one hand the changes in industrial structure which are likely to take place may tend to make the economy less dependent on imported materials, while at the same time the fuller liberalization of external trade will be certain to increase the import proportion. It is hoped that an overall foreign exchange balance will be
66 INCOME AND WEALTH: SERIES x achieved which will be sufficient to cover all of the minor items shown in account 5. Bearing this in mind, a target for the current surplus on foreign trade (B) is set. The necessary exports (X) are then the sum of (M + Pg + B). Though X is not treated as an exogenous variable a useful check on its likely magnitude can be obtained from estimates of the likely growth of world trade during the planned period together with fore- casts of the Japanese share in the total. In this way equation (lo), the foreign trade balance, can be completed in a firm fashion.
Three equations only (I), (2) and (9) now contain elements which must be determined. The unknowns are the four invest- ment items Ip, Ig, Ih, and Ij, capital consumption allowances D and gross national product V. Firstly the ratio of net national product (Y + Ti - A) to gross national product (Y + Ti - A + D) is assumed constant. Knowing the appropriate base- year ratio, it is therefore a simple matter to estimate V and D and to complete equation (2).
The minor private variables, personal housing construction (Ih) and inventory change (Ij) are estimated in the following way. An aim of the plan was to increase Ih rapidly (4.9 times in ten years). In fact, this item is a borderline case between the Government and private sectors - it will depend in part on Government financing, and will be affected by personal dis- posable income, and the extent to which increasing incomes will stimulate private housing investments. On these assumptions the experts working on the sector were able to forecast a value for Ih. Inventory change was assumed to have a certain ratio (j = 0.04) t o G.N.P. and this assumption is s&cient for determining Ij. (This assumption implies that at the end of the period the ratio of inventories to national product will be much lower than it is now.)
The crucial question now centres on the determination of private investment in producers' plant and equipment. It will be remembered that what is, in effect, an independent estimate of Y has been made. In order that this might be achieved a certain investment level will be required. This level might be gauged by using some form of investment function. However, by so doing the 'plan' would be in the nature of a forecast. It is one of the objects of Government policy, however, to give guidance to private investment behaviour by taking direct action through its own investment and administrative leadership, in an attempt to
K. OHKAWA 67
ensure that the planned target is reached. To this end a policy assumption is made regarding the relationship between Ip and Y (i.e. the capital-output ratio). It has already been mentioned that the capital-output ratio should be maintained at the base- year level when measured in average 'net' terms, i.e. that the rates of growth in capital stock and in output should be equal. Naturally there are severe statistical difficulties to be overcome in measuring the total stock of capital, especially as war damage losses make any historical appraisal more or less impossible. However, the results of the Wealth Survey of 1955 provided a useful bench mark which was extended to the base period of the plan by adding the annual increments in gross investment to, and subtracting annual depreciation allowances from, the value of assets in 1955.
Using the symbols Ip, K, G, Y and k to stand for annual net investment in producers' plant and equipment, the capital stock of producer's plant and equipment in the base year, the rate of growth per annum, net national income in the base year, and the base-year capital-output ratio we have:
K= kY I p = K ( l + G)'-K(I + G p - I
= K ( l + G p - ' G . Where nis the number of years from the base year.
All of the variables in the system, with the exception of Ig, are now determined while two equations remain (numbers (1) and (9)) which include the value of Ig. It is a property of the system, however, that the determination of Ig as the residual in both of these will lead to the same result. This follows from the articulated nature of the accounting system from whose ten equations nine determinations of variables can be made. Of the total thirty-three variables, twenty-four were actually de- termined independently of the system, eight were determined from the system prior to the determination of Ig, while the latter emerges as the ninth residual. The fact that its value appears in equations (1) and (9) should provide a check on arithmetical accuracy.
However, on the other hand the required amount of Govern- ment investment (called Ig*) has been independently estimated from the technical point of view. The value derived from the system (Ig) is to be checked by this. In reality Ig* turned out to
1.W.-F
68 INCOME AND WEALTH: SERIES x be considerably higher than Ig at the first approach. In the course of trial and error the amount of Ig* had to be cut down and the amount of Ig increased, though to a lesser extent, in order to arrive at a final solution ensuring that the amount of Government investment thought necessary from the indepen- dent estimate could be met from available resources.
IV. CONCLUDING REMARKS SUGGESTED BY JAPAN'S EXPERIENCE
1. The use of national income accounts for long-range planning is necessary and highly desirable. In particular the articulated nature of the accounts makes possible the testing of the consistency of the plan. In addition, when structural changes are taking place rapidly, as in Japan, and when rela- tively stable behaviouristic relationships based on past experi- ence are difficult to formulate, the use of a simple and non- sensitive framework is required. Little further refinement is possible.
2. Partly in consequence of this it will be noted that the model is 'production dominated'. The major relationships in production, and the likely sectoral changes which may be anti- cipated, are sought outside the accounting framework. In preparing the plan production is estimated first, income distri- bution is then obtained on the basis of income produced in each sector, while final demands are largely based on this pro- jected distribution of income. The reverse course, from demand to production, is weakly represented. In short, there is a flimsy link between the likely pattern of final expenditures and the likely pattern of production. Indeed, the only explicit link arises out of the use of the capital-output ratio as a tool in projecting investment behaviour. In part this weakness is attributable to the nature of long-term planning and to the ditliculties inherent in it. However, it does appear that the checking of the likely sectoral distribution of the final demand for various products occasioned by the rise in real income, against the projected sectoral distribution of production, needs strengthening. In order that this might be done, and to streng- then the formulation of production targets for each industry, the further development of input-output analysis is necessary.
3. The need for developing other accounting measures noted at the start of this paper can be further seen when Government activity is considered. Financial statements are needed here in
K. OHKAWA 69
order to clarify the methods of financing the administrative investments which form the backbone of the plan. These would also be useful, when allied to capital stock data, in further developing the capital account. Outside the strict realm of social accounting there is also a need for sectoral balance tables showing demand and supply of labour. This was actually a featureoftheplan; butfurtherrefinementsappear tobe calledfor.
4. There are certain difficulties inherent in formulating the targets in constant price terms. Using such a method it is virtually impossible to take into account the complications which may result from differential movements in prices. For example, in recent years a rising trend in consumer's prices relative to those of investment goods has become apparent. This is likely to be accentuated in future years, mainly as a result of rising prices of services occasioned by rising labour costs. In addition, the prices of durables are likely to decline relatively as the result of increasing productivity in this sector. Such move- ments immensely complicate the task of working out likely changes in industrial structure, and make the results less reliable than they might otherwise have been. In addition the constant price method may give misleading results. For example in the final tables the proportion of consumers' expenditure to G.N.P. stands at 58.1 per cent for 1970 compared with 59.5 per cent for the base year. In fact, the proportion when measured in 1970 prices is expected to be substantially higher, owing to theexpected increases in the relative prices of consumers' goods and services.
5. Finally, apart from the general reliability of the data, a particular problem arises out of the treatment of the statistical discrepancy in the accounts. As may be seen from Account 6, this amounted to 1.8 per cent of gross saving on the average for the base year. For individual years the figures were 2.6 per cent in 1956, -0.6 per cent in 1957, and -0.7 per cent in 1958. In the target year the discrepancy was naturally zero. In judging the final balance of saving and investment in the plan it should be borne in mind that this discrepancy mostly relates to the residual item of personal savings.
All of these factors point to the need for a strengthening of the social accounting data by the use of input-output tables and financial transactions accounts, for the further study of the sectoral distribution of wealth, and the making of direct esti- mates of the rate of personal savings.