Embed Size (px)
Citation preview
Int. J. Business and Globalisation, Vol. 24, No. 1, 2020 139
Copyright © 2020 Inderscience Enterprises Ltd.
The use of moving average trading rules in Indonesian Stock Market
Dedhy Sulistiawan* and Felizia Arni Rudiawarni Faculty of Business and Economics, EB Building 2nd floor, Jl. Raya Kalirungkut, Surabaya 60293, Indonesia Email: [email protected] Email: [email protected] *Corresponding author
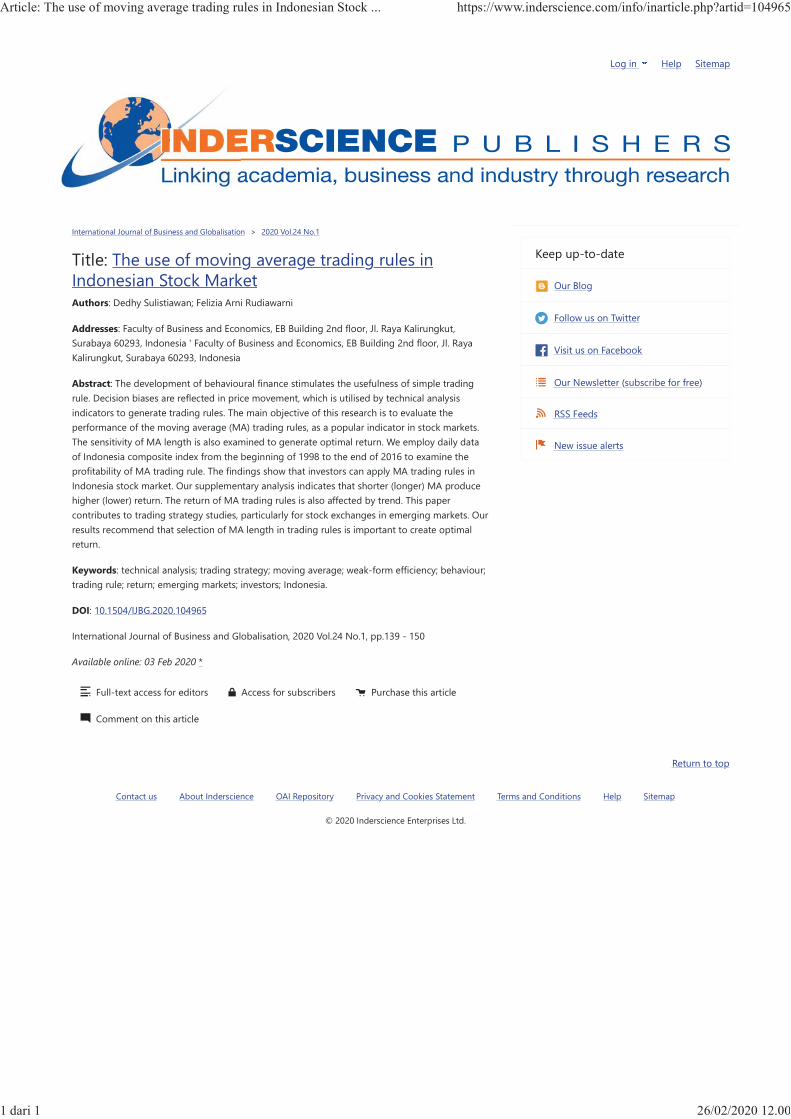
Abstract: The development of behavioural finance stimulates the usefulness of simple trading rule. Decision biases are reflected in price movement, which is utilised by technical analysis indicators to generate trading rules. The main objective of this research is to evaluate the performance of the moving average (MA) trading rules, as a popular indicator in stock markets. The sensitivity of MA length is also examined to generate optimal return. We employ daily data of Indonesia composite index from the beginning of 1998 to the end of 2016 to examine the profitability of MA trading rule. The findings show that investors can apply MA trading rules in Indonesia stock market. Our supplementary analysis indicates that shorter (longer) MA produce higher (lower) return. The return of MA trading rules is also affected by trend. This paper contributes to trading strategy studies, particularly for stock exchanges in emerging markets. Our results recommend that selection of MA length in trading rules is important to create optimal return.
Keywords: technical analysis; trading strategy; moving average; weak-form efficiency; behaviour; trading rule; return; emerging markets; investors; Indonesia.
Reference to this paper should be made as follows: Sulistiawan, D. and Rudiawarni, F.A. (2020) ‘The use of moving average trading rules in Indonesian Stock Market’, Int. J. Business and Globalisation, Vol. 24, No. 1, pp.139–150.
Biographical notes: Dedhy Sulistiawan is an Associate Professor at the Accounting Department University of Surabaya. His research interest is market-based-accounting research and behavioural accounting. Currently, he is the Head of Accounting Department in University of Surabaya. He has published books and articles in international journals.
Felizia Arni Rudiawarni is a Lecturer at the Accounting Department University of Surabaya. She is interested in financial accounting, especially in earnings management. She also published articles in several international journals.
This paper is a revised and expanded version of a paper entitled ‘The use of moving average trading rules in Indonesian Stock Market’ presented at SIBR Conference, Osaka, Japan, 6–7 July 2017.
140 D. Sulistiawan and F.A. Rudiawarni
1 Introduction
The weak form of efficient market theory states that stock prices are efficiently set by rational investors and reflect previous information. Trading strategies using historical price should be unprofitable. Most of text-books in investing support that theory. However, the idea is critiqued by several recent studies that find evidence that simple technical trading strategies can be used for profit (Sweeney, 1988; Brock et al., 1992; Fifield et al., 2005; Nazário et al., 2017). Our study is developed by behavioural finance literatures, instead of efficient market theory. The use of behavioural finance and psychology of financial markets can increase the understanding of how and why the stock price change (Flanegin and Rudd, 2005).
Behavioural finance theory states that investors are not fully rational because of bounded rationality. They tend to employ heuristics judgment, therefore all the information in past prices may not be quickly impounded into current prices. The decision biases may generate patterns in stock-price data. Technicians or chartists employ chart pattern to generate buy and sell signal. Investors need to have certain strategies that can be used to help them make decisions. Strategy is very important and has been used since ancient times to gain a stronger position (Medarac et al., 2016). This also applies in capital markets, that to obtain abnormal returns, investors must have certain strategies. In this study, we explore the use of stock trading strategies.
Investors prepare for changes, because the change or new events that contain information will establish a market reaction. For most people, change challenges and threatens our routines and established practices, but for some people this threat becomes an opportunity (Anderson, 2015). While the changes surround us constantly and continuously, their shape, pattern and formation cannot be known before (Anderson and Atkins, 2001). Technical analysis tries to capture those forms and patterns and uses them to predict future price movements through trading rules.
There are many trading strategies that can generate technical signals. Our study uses moving average (MA) indicators because of several reasons:
1 it is the representation of simple trading rule
2 it is very popular in investment communities.
Our hypothesis is that MA trading rules produce substantial return. In our robustness test, we also use the sensitivity of MA length. That is an important step to generate optimal return based on MA trading rule.
Our research uses Indonesia Stock Market as its object. In Indonesia, the source of capital for big companies is from banking industry. Small entrepreneurs had limited access to banking system, but after 1990, the banking sector was liberalised to increase lending to small firms (Dana, 1999). The development of small firms do not stimulate the growth of public companies. Until the end of 2016, there are only 529 public companies (Indonesian Stock Exchange, 2016). We use Indonesian Stock Market because it represents one of emerging stock markets with low market capitalisation.
The use of technical analysis in this study is considered in accordance with the object under study. One feature of emerging market stock exchanges is that the market is considered inefficient, which gives investors an opportunity to gain superior results. In efficient market, technical analysis does not work because prices already represent all available information. Chartists or technicians have no possibility to produce extra return
The use of moving average trading rules in Indonesian Stock Market 141
in the long-run period. Conversely, in inefficient market, price is more determined by irrational factors that lead to mispricing.
Furthermore, financial information in emerging market is less reliable compare to those of developed market. This condition refers to weak investors’ protection (Leuz et al., 2003) and less governance transparency (Dong and Xue, 2010). Numerous studies suggest that governance will affect financial performance (Ahmad, 2013). However, in countries with less transparency in the implementation of corporate governance, this relationship is difficult to see by investors. So, investors need other sources of information to support their decision in order to attain optimal return. There are many competing information of financial statement. Technical analysis is one of them. Overall, based on previous studies, technical analysis produces higher (lower) return in emerging (developed) market. That condition represents the environment of inefficient markets (Fifield et al., 2005; Millionis and Papanagiotou, 2008; McKenzie, 2007; Ahmed et al., 2000).
We hope that our study gives contribution to:
1 trading strategy researches, especially in emerging markets
2 support the use of behavioural finance theory
3 trading rule for investment communities.
The remainder article is presented as follows. Literature review to establish the concept of MA trading rule. Data and methodology section introduces the dataset. Results and analysis section discusses the empirical results. The last section offers several concluding observations.
2 Literature review
Technical analysis is more popular to investors than professors (Flanegin and Rudd, 2005). Many textbooks on investment and financial management show that academics are sceptical of the technical analysis.
On the other hand, technical analysis has been dominating information in stock market. Most of brokerage firms announce technical analysis commentary on the stock market. Many of the newsletters published by various ‘experts’ are based on technical analysis (Brock et al., 1992). Until now, Yahoo Finance also provides chart based on technical analysis and so do online brokerage firms around the world. Investors face charts daily.
We believe that previous and current stock-price contains partial information of future price movement. Price is determined by investor decision that represents their behaviour. If human behaviours can be partially estimated, then stock price can also be predicted. Our argument is supported by several researches that show the superiority of technical analysis (Sweeney, 1988; Brock et al., 1992).
From international perspective, technical analysis produces better performance when implemented in developing markets. Fifield et al. (2005) present that technical analysis in developing markets generates higher return than that in developed markets. Milionis and Papanagiotou (2008) show that MA trading rule is more useful in Greece market than in US market. Ahmed et al. (2000) also present the same evidence.
142 D. Sulistiawan and F.A. Rudiawarni
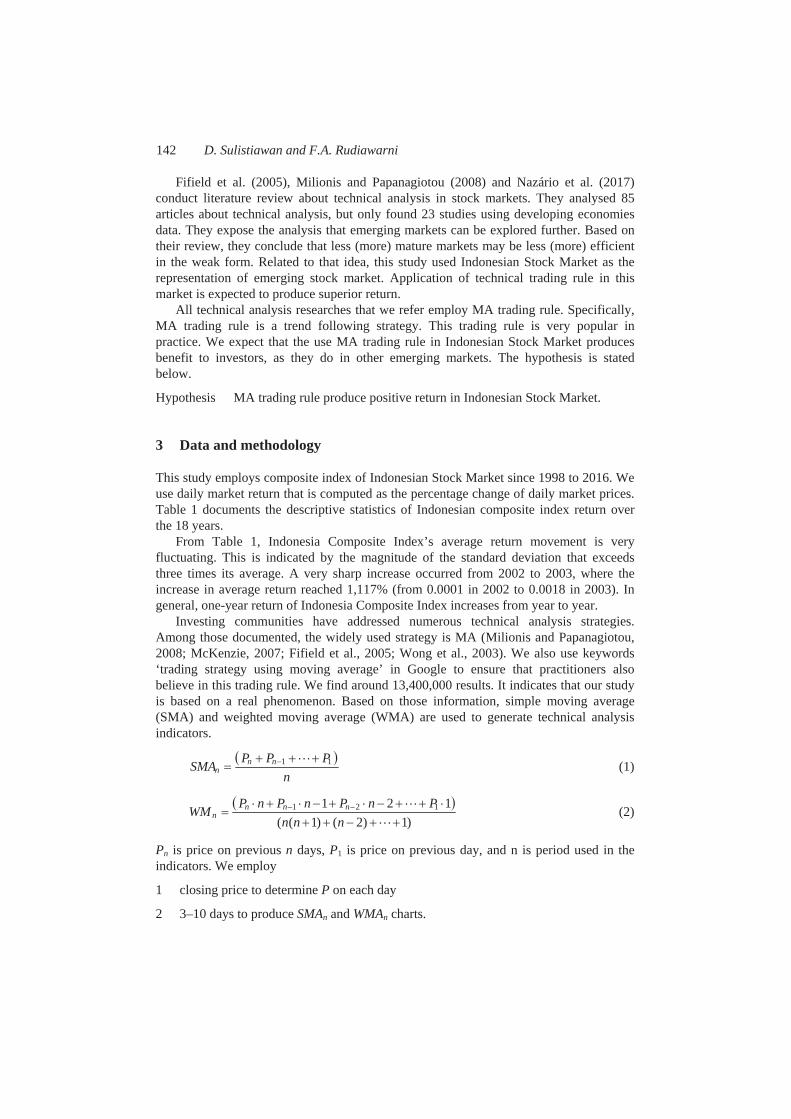
Fifield et al. (2005), Milionis and Papanagiotou (2008) and Nazário et al. (2017) conduct literature review about technical analysis in stock markets. They analysed 85 articles about technical analysis, but only found 23 studies using developing economies data. They expose the analysis that emerging markets can be explored further. Based on their review, they conclude that less (more) mature markets may be less (more) efficient in the weak form. Related to that idea, this study used Indonesian Stock Market as the representation of emerging stock market. Application of technical trading rule in this market is expected to produce superior return.
All technical analysis researches that we refer employ MA trading rule. Specifically, MA trading rule is a trend following strategy. This trading rule is very popular in practice. We expect that the use MA trading rule in Indonesian Stock Market produces benefit to investors, as they do in other emerging markets. The hypothesis is stated below.
Hypothesis MA trading rule produce positive return in Indonesian Stock Market.
3 Data and methodology
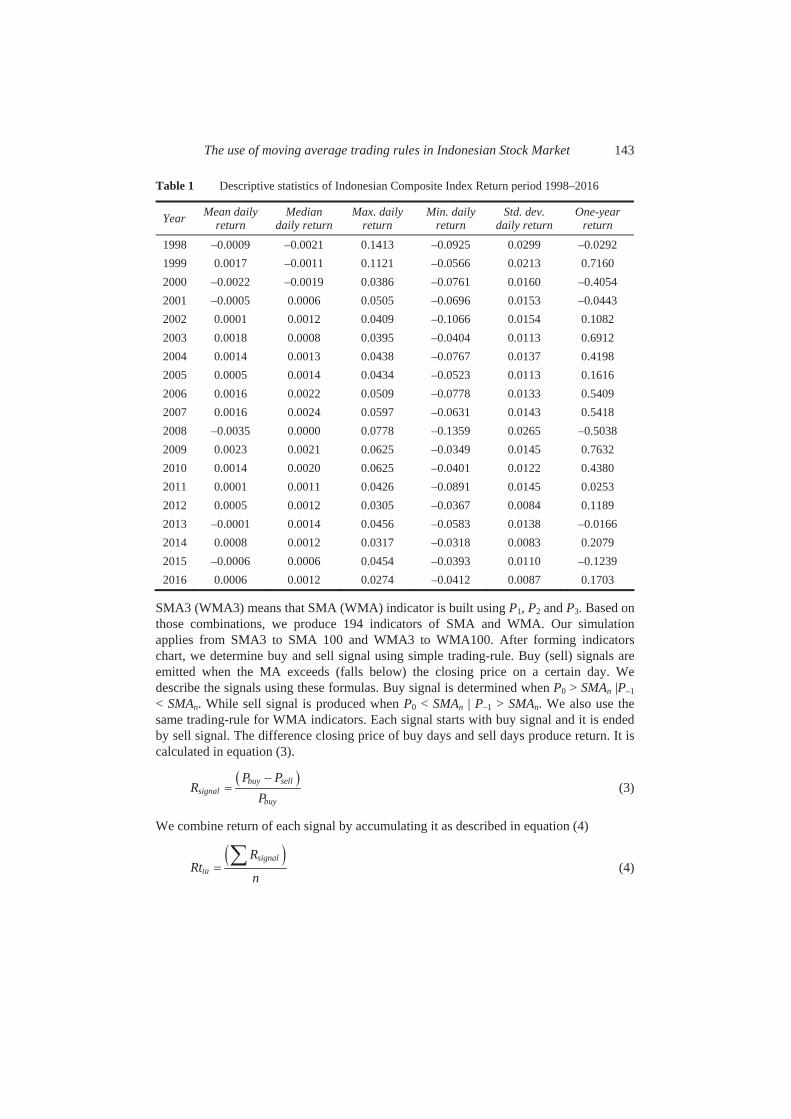
This study employs composite index of Indonesian Stock Market since 1998 to 2016. We use daily market return that is computed as the percentage change of daily market prices. Table 1 documents the descriptive statistics of Indonesian composite index return over the 18 years.
From Table 1, Indonesia Composite Index’s average return movement is very fluctuating. This is indicated by the magnitude of the standard deviation that exceeds three times its average. A very sharp increase occurred from 2002 to 2003, where the increase in average return reached 1,117% (from 0.0001 in 2002 to 0.0018 in 2003). In general, one-year return of Indonesia Composite Index increases from year to year.
Investing communities have addressed numerous technical analysis strategies. Among those documented, the widely used strategy is MA (Milionis and Papanagiotou, 2008; McKenzie, 2007; Fifield et al., 2005; Wong et al., 2003). We also use keywords ‘trading strategy using moving average’ in Google to ensure that practitioners also believe in this trading rule. We find around 13,400,000 results. It indicates that our study is based on a real phenomenon. Based on those information, simple moving average (SMA) and weighted moving average (WMA) are used to generate technical analysis indicators.
1 1n nn
P P PSMAn
(1)
1 2 11 2 1( ( 1) ( 2) 1)
n n nn
P n P n P n PWMn n n
(2)
Pn is price on previous n days, P1 is price on previous day, and n is period used in the indicators. We employ
1 closing price to determine P on each day
2 3–10 days to produce SMAn and WMAn charts.
The use of moving average trading rules in Indonesian Stock Market 143
Table 1 Descriptive statistics of Indonesian Composite Index Return period 1998–2016
Year Mean daily return
Mediandaily return
Max. daily return
Min. daily return
Std. dev. daily return
One-year return
1998 –0.0009 –0.0021 0.1413 –0.0925 0.0299 –0.0292 1999 0.0017 –0.0011 0.1121 –0.0566 0.0213 0.7160 2000 –0.0022 –0.0019 0.0386 –0.0761 0.0160 –0.4054 2001 –0.0005 0.0006 0.0505 –0.0696 0.0153 –0.0443 2002 0.0001 0.0012 0.0409 –0.1066 0.0154 0.1082 2003 0.0018 0.0008 0.0395 –0.0404 0.0113 0.6912 2004 0.0014 0.0013 0.0438 –0.0767 0.0137 0.4198 2005 0.0005 0.0014 0.0434 –0.0523 0.0113 0.1616 2006 0.0016 0.0022 0.0509 –0.0778 0.0133 0.5409 2007 0.0016 0.0024 0.0597 –0.0631 0.0143 0.5418 2008 –0.0035 0.0000 0.0778 –0.1359 0.0265 –0.5038 2009 0.0023 0.0021 0.0625 –0.0349 0.0145 0.7632 2010 0.0014 0.0020 0.0625 –0.0401 0.0122 0.4380 2011 0.0001 0.0011 0.0426 –0.0891 0.0145 0.0253 2012 0.0005 0.0012 0.0305 –0.0367 0.0084 0.1189 2013 –0.0001 0.0014 0.0456 –0.0583 0.0138 –0.0166 2014 0.0008 0.0012 0.0317 –0.0318 0.0083 0.2079 2015 –0.0006 0.0006 0.0454 –0.0393 0.0110 –0.1239 2016 0.0006 0.0012 0.0274 –0.0412 0.0087 0.1703
SMA3 (WMA3) means that SMA (WMA) indicator is built using P1, P2 and P3. Based on those combinations, we produce 194 indicators of SMA and WMA. Our simulation applies from SMA3 to SMA 100 and WMA3 to WMA100. After forming indicators chart, we determine buy and sell signal using simple trading-rule. Buy (sell) signals are emitted when the MA exceeds (falls below) the closing price on a certain day. We describe the signals using these formulas. Buy signal is determined when P0 > SMAn |P–1< SMAn. While sell signal is produced when P0 < SMAn | P–1 > SMAn. We also use the same trading-rule for WMA indicators. Each signal starts with buy signal and it is ended by sell signal. The difference closing price of buy days and sell days produce return. It is calculated in equation (3).
buy sellsignal
buy
P PR
P (3)
We combine return of each signal by accumulating it as described in equation (4)
signalta
RRt
n (4)
144 D. Sulistiawan and F.A. Rudiawarni
This study only uses long strategy, instead of short strategy, because short-selling is prohibited by regulation and that action is not provided by on-line stock trading software in Indonesia. We expect that Rta > 0 which means technical analysis produce profit.
4 Results and analysis
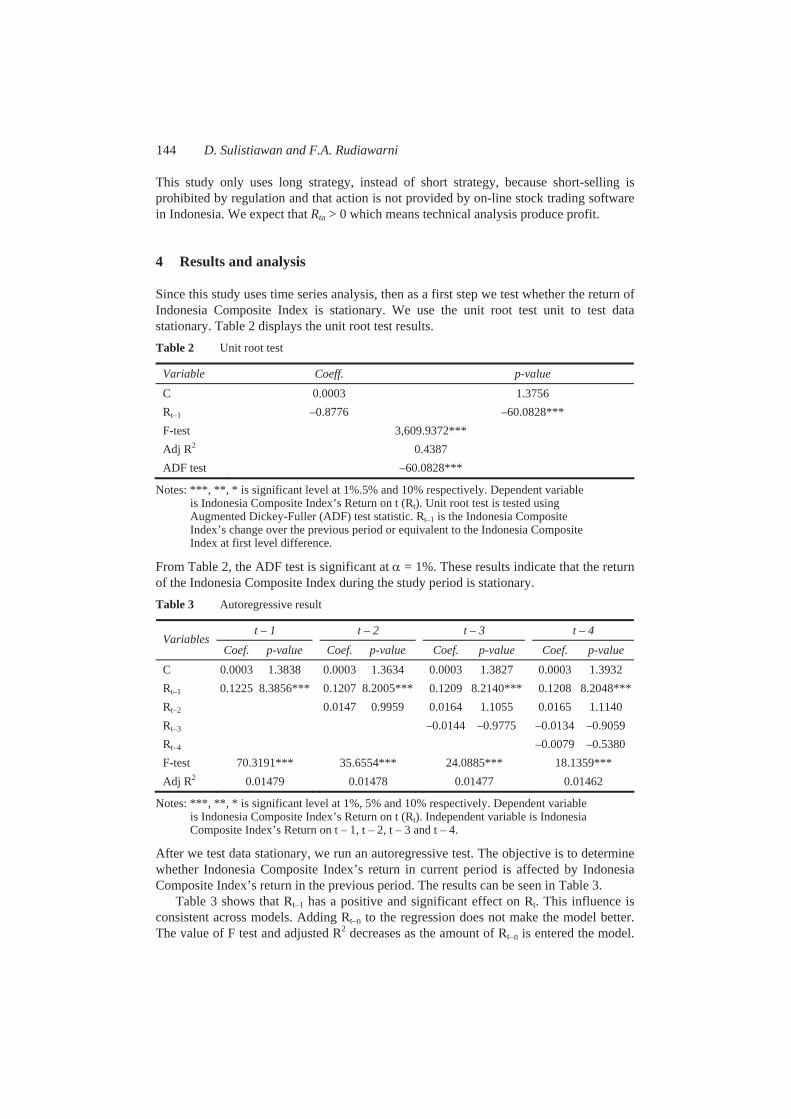
Since this study uses time series analysis, then as a first step we test whether the return of Indonesia Composite Index is stationary. We use the unit root test unit to test data stationary. Table 2 displays the unit root test results. Table 2 Unit root test
Variable Coeff. p-value C 0.0003 1.3756 Rt–1 –0.8776 –60.0828*** F-test 3,609.9372*** Adj R2 0.4387 ADF test –60.0828***
Notes: ***, **, * is significant level at 1%.5% and 10% respectively. Dependent variable is Indonesia Composite Index’s Return on t (Rt). Unit root test is tested using Augmented Dickey-Fuller (ADF) test statistic. Rt–1 is the Indonesia Composite Index’s change over the previous period or equivalent to the Indonesia Composite Index at first level difference.
From Table 2, the ADF test is significant at = 1%. These results indicate that the return of the Indonesia Composite Index during the study period is stationary. Table 3 Autoregressive result
t – 1 t – 2 t – 3 t – 4Variables
Coef. p-value Coef. p-value Coef. p-value Coef. p-value C 0.0003 1.3838 0.0003 1.3634 0.0003 1.3827 0.0003 1.3932 Rt–1 0.1225 8.3856*** 0.1207 8.2005*** 0.1209 8.2140*** 0.1208 8.2048*** Rt–2 0.0147 0.9959 0.0164 1.1055 0.0165 1.1140 Rt–3 –0.0144 –0.9775 –0.0134 –0.9059 Rt–4 –0.0079 –0.5380 F-test 70.3191*** 35.6554*** 24.0885*** 18.1359*** Adj R2 0.01479 0.01478 0.01477 0.01462
Notes: ***, **, * is significant level at 1%, 5% and 10% respectively. Dependent variable is Indonesia Composite Index’s Return on t (Rt). Independent variable is Indonesia Composite Index’s Return on t – 1, t – 2, t – 3 and t – 4.
After we test data stationary, we run an autoregressive test. The objective is to determine whether Indonesia Composite Index’s return in current period is affected by Indonesia Composite Index’s return in the previous period. The results can be seen in Table 3.
Table 3 shows that Rt–1 has a positive and significant effect on Rt. This influence is consistent across models. Adding Rt–n to the regression does not make the model better. The value of F test and adjusted R2 decreases as the amount of Rt–n is entered the model.
The use of moving average trading rules in Indonesian Stock Market 145
So, only Rt–1 has a significant effect on Rt. Generally, in the presence of new events, market will react quickly to this current information (Gunaasih and Nursasmito, 2015). But, in this study, by using these indicators, the current price movement is partially still influenced by previous return, but current return only absorbs previous one-day return. Events before t – 1 do not affect current return. Using the autoregressive technique, the Indonesian market is efficient in weak form. In this paper, we develop the test using MA trading rule to examine the predictive power of historical price.
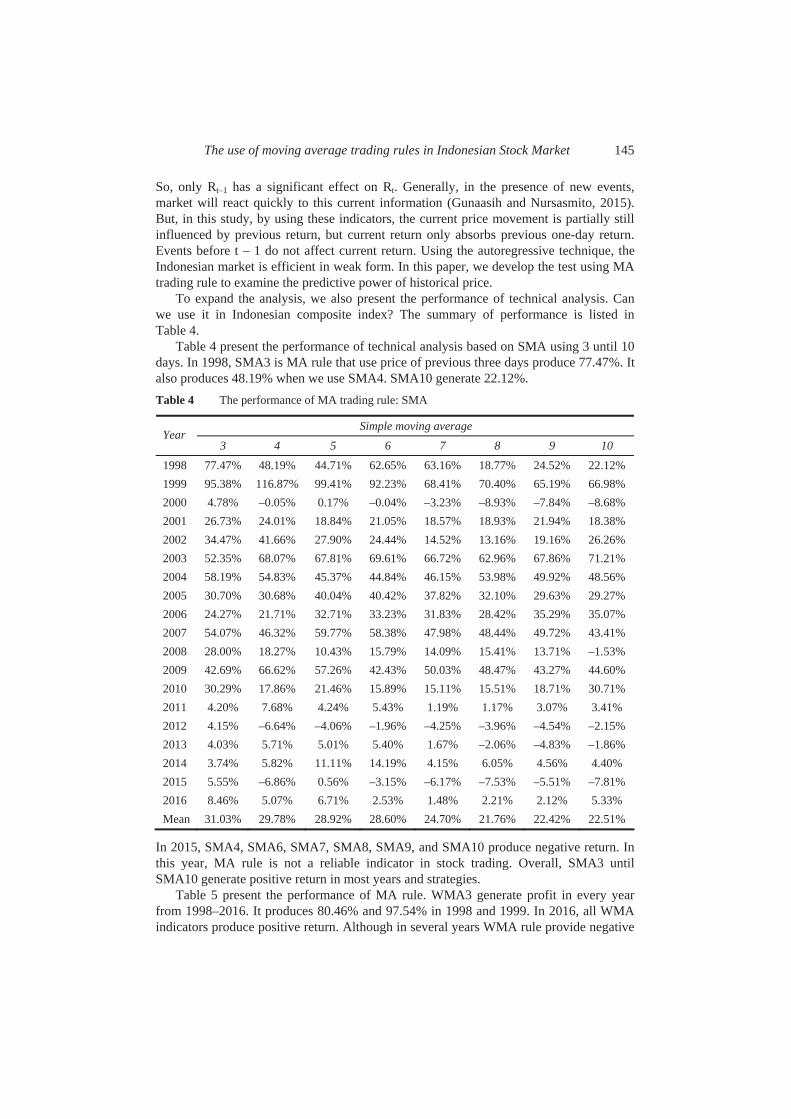
To expand the analysis, we also present the performance of technical analysis. Can we use it in Indonesian composite index? The summary of performance is listed in Table 4.
Table 4 present the performance of technical analysis based on SMA using 3 until 10 days. In 1998, SMA3 is MA rule that use price of previous three days produce 77.47%. It also produces 48.19% when we use SMA4. SMA10 generate 22.12%. Table 4 The performance of MA trading rule: SMA
Simple moving average Year
3 4 5 6 7 8 9 10 1998 77.47% 48.19% 44.71% 62.65% 63.16% 18.77% 24.52% 22.12% 1999 95.38% 116.87% 99.41% 92.23% 68.41% 70.40% 65.19% 66.98% 2000 4.78% –0.05% 0.17% –0.04% –3.23% –8.93% –7.84% –8.68% 2001 26.73% 24.01% 18.84% 21.05% 18.57% 18.93% 21.94% 18.38% 2002 34.47% 41.66% 27.90% 24.44% 14.52% 13.16% 19.16% 26.26% 2003 52.35% 68.07% 67.81% 69.61% 66.72% 62.96% 67.86% 71.21% 2004 58.19% 54.83% 45.37% 44.84% 46.15% 53.98% 49.92% 48.56% 2005 30.70% 30.68% 40.04% 40.42% 37.82% 32.10% 29.63% 29.27% 2006 24.27% 21.71% 32.71% 33.23% 31.83% 28.42% 35.29% 35.07% 2007 54.07% 46.32% 59.77% 58.38% 47.98% 48.44% 49.72% 43.41% 2008 28.00% 18.27% 10.43% 15.79% 14.09% 15.41% 13.71% –1.53% 2009 42.69% 66.62% 57.26% 42.43% 50.03% 48.47% 43.27% 44.60% 2010 30.29% 17.86% 21.46% 15.89% 15.11% 15.51% 18.71% 30.71% 2011 4.20% 7.68% 4.24% 5.43% 1.19% 1.17% 3.07% 3.41% 2012 4.15% –6.64% –4.06% –1.96% –4.25% –3.96% –4.54% –2.15% 2013 4.03% 5.71% 5.01% 5.40% 1.67% –2.06% –4.83% –1.86% 2014 3.74% 5.82% 11.11% 14.19% 4.15% 6.05% 4.56% 4.40% 2015 5.55% –6.86% 0.56% –3.15% –6.17% –7.53% –5.51% –7.81% 2016 8.46% 5.07% 6.71% 2.53% 1.48% 2.21% 2.12% 5.33% Mean 31.03% 29.78% 28.92% 28.60% 24.70% 21.76% 22.42% 22.51%
In 2015, SMA4, SMA6, SMA7, SMA8, SMA9, and SMA10 produce negative return. In this year, MA rule is not a reliable indicator in stock trading. Overall, SMA3 until SMA10 generate positive return in most years and strategies.
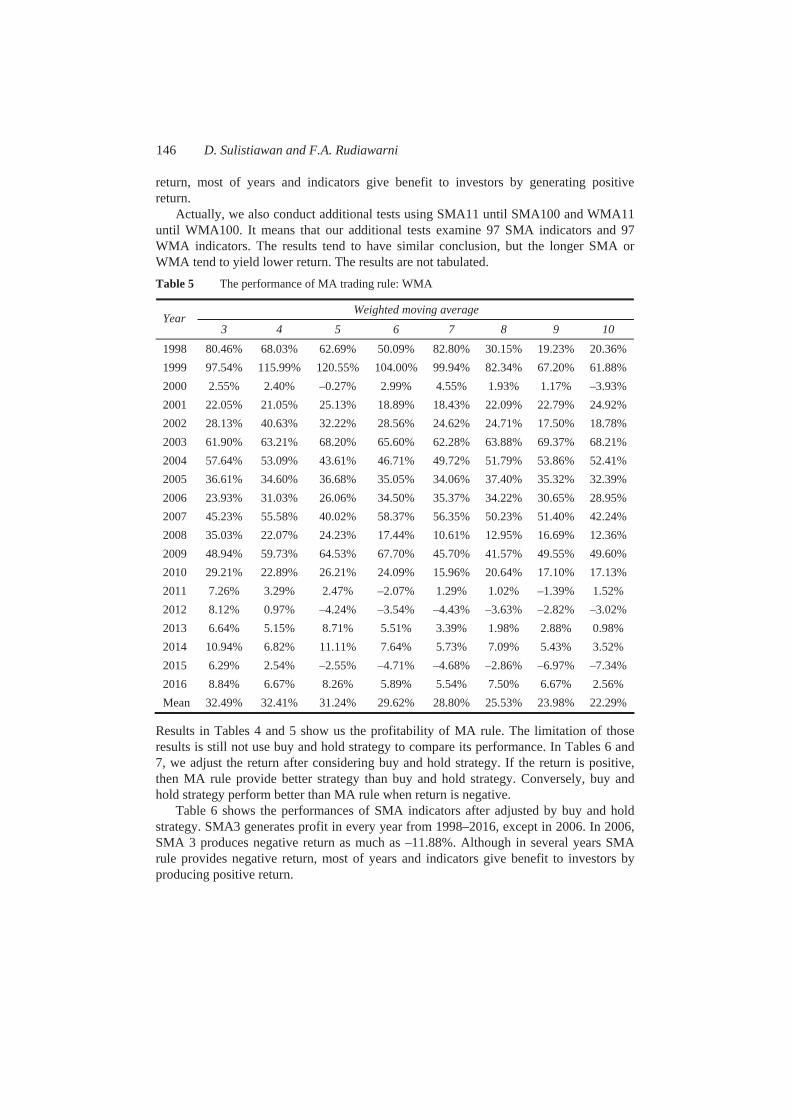
Table 5 present the performance of MA rule. WMA3 generate profit in every year from 1998–2016. It produces 80.46% and 97.54% in 1998 and 1999. In 2016, all WMA indicators produce positive return. Although in several years WMA rule provide negative
146 D. Sulistiawan and F.A. Rudiawarni
return, most of years and indicators give benefit to investors by generating positive return.
Actually, we also conduct additional tests using SMA11 until SMA100 and WMA11 until WMA100. It means that our additional tests examine 97 SMA indicators and 97 WMA indicators. The results tend to have similar conclusion, but the longer SMA or WMA tend to yield lower return. The results are not tabulated. Table 5 The performance of MA trading rule: WMA
Weighted moving average Year
3 4 5 6 7 8 9 10 1998 80.46% 68.03% 62.69% 50.09% 82.80% 30.15% 19.23% 20.36% 1999 97.54% 115.99% 120.55% 104.00% 99.94% 82.34% 67.20% 61.88% 2000 2.55% 2.40% –0.27% 2.99% 4.55% 1.93% 1.17% –3.93% 2001 22.05% 21.05% 25.13% 18.89% 18.43% 22.09% 22.79% 24.92% 2002 28.13% 40.63% 32.22% 28.56% 24.62% 24.71% 17.50% 18.78% 2003 61.90% 63.21% 68.20% 65.60% 62.28% 63.88% 69.37% 68.21% 2004 57.64% 53.09% 43.61% 46.71% 49.72% 51.79% 53.86% 52.41% 2005 36.61% 34.60% 36.68% 35.05% 34.06% 37.40% 35.32% 32.39% 2006 23.93% 31.03% 26.06% 34.50% 35.37% 34.22% 30.65% 28.95% 2007 45.23% 55.58% 40.02% 58.37% 56.35% 50.23% 51.40% 42.24% 2008 35.03% 22.07% 24.23% 17.44% 10.61% 12.95% 16.69% 12.36% 2009 48.94% 59.73% 64.53% 67.70% 45.70% 41.57% 49.55% 49.60% 2010 29.21% 22.89% 26.21% 24.09% 15.96% 20.64% 17.10% 17.13% 2011 7.26% 3.29% 2.47% –2.07% 1.29% 1.02% –1.39% 1.52% 2012 8.12% 0.97% –4.24% –3.54% –4.43% –3.63% –2.82% –3.02% 2013 6.64% 5.15% 8.71% 5.51% 3.39% 1.98% 2.88% 0.98% 2014 10.94% 6.82% 11.11% 7.64% 5.73% 7.09% 5.43% 3.52% 2015 6.29% 2.54% –2.55% –4.71% –4.68% –2.86% –6.97% –7.34% 2016 8.84% 6.67% 8.26% 5.89% 5.54% 7.50% 6.67% 2.56% Mean 32.49% 32.41% 31.24% 29.62% 28.80% 25.53% 23.98% 22.29%
Results in Tables 4 and 5 show us the profitability of MA rule. The limitation of those results is still not use buy and hold strategy to compare its performance. In Tables 6 and 7, we adjust the return after considering buy and hold strategy. If the return is positive, then MA rule provide better strategy than buy and hold strategy. Conversely, buy and hold strategy perform better than MA rule when return is negative.
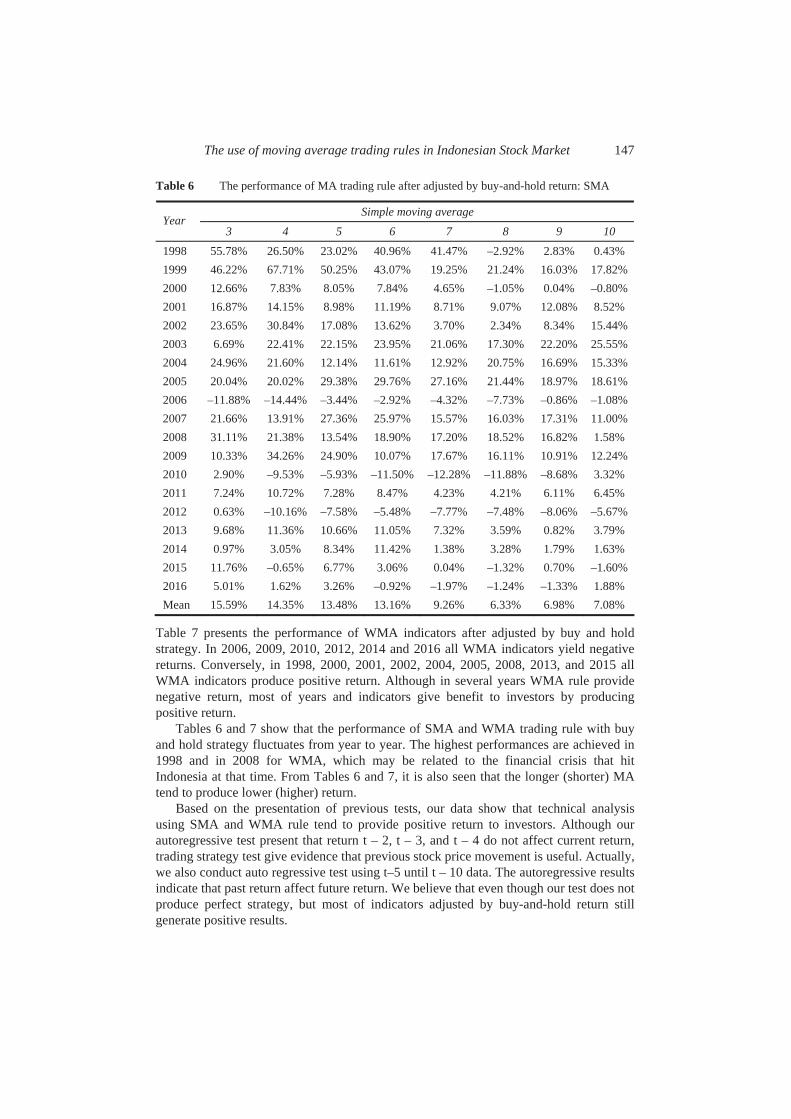
Table 6 shows the performances of SMA indicators after adjusted by buy and hold strategy. SMA3 generates profit in every year from 1998–2016, except in 2006. In 2006, SMA 3 produces negative return as much as –11.88%. Although in several years SMA rule provides negative return, most of years and indicators give benefit to investors by producing positive return.
The use of moving average trading rules in Indonesian Stock Market 147
Table 6 The performance of MA trading rule after adjusted by buy-and-hold return: SMA
Simple moving average Year
3 4 5 6 7 8 9 10 1998 55.78% 26.50% 23.02% 40.96% 41.47% –2.92% 2.83% 0.43% 1999 46.22% 67.71% 50.25% 43.07% 19.25% 21.24% 16.03% 17.82% 2000 12.66% 7.83% 8.05% 7.84% 4.65% –1.05% 0.04% –0.80% 2001 16.87% 14.15% 8.98% 11.19% 8.71% 9.07% 12.08% 8.52% 2002 23.65% 30.84% 17.08% 13.62% 3.70% 2.34% 8.34% 15.44% 2003 6.69% 22.41% 22.15% 23.95% 21.06% 17.30% 22.20% 25.55% 2004 24.96% 21.60% 12.14% 11.61% 12.92% 20.75% 16.69% 15.33% 2005 20.04% 20.02% 29.38% 29.76% 27.16% 21.44% 18.97% 18.61% 2006 –11.88% –14.44% –3.44% –2.92% –4.32% –7.73% –0.86% –1.08% 2007 21.66% 13.91% 27.36% 25.97% 15.57% 16.03% 17.31% 11.00% 2008 31.11% 21.38% 13.54% 18.90% 17.20% 18.52% 16.82% 1.58% 2009 10.33% 34.26% 24.90% 10.07% 17.67% 16.11% 10.91% 12.24% 2010 2.90% –9.53% –5.93% –11.50% –12.28% –11.88% –8.68% 3.32% 2011 7.24% 10.72% 7.28% 8.47% 4.23% 4.21% 6.11% 6.45% 2012 0.63% –10.16% –7.58% –5.48% –7.77% –7.48% –8.06% –5.67% 2013 9.68% 11.36% 10.66% 11.05% 7.32% 3.59% 0.82% 3.79% 2014 0.97% 3.05% 8.34% 11.42% 1.38% 3.28% 1.79% 1.63% 2015 11.76% –0.65% 6.77% 3.06% 0.04% –1.32% 0.70% –1.60% 2016 5.01% 1.62% 3.26% –0.92% –1.97% –1.24% –1.33% 1.88% Mean 15.59% 14.35% 13.48% 13.16% 9.26% 6.33% 6.98% 7.08%
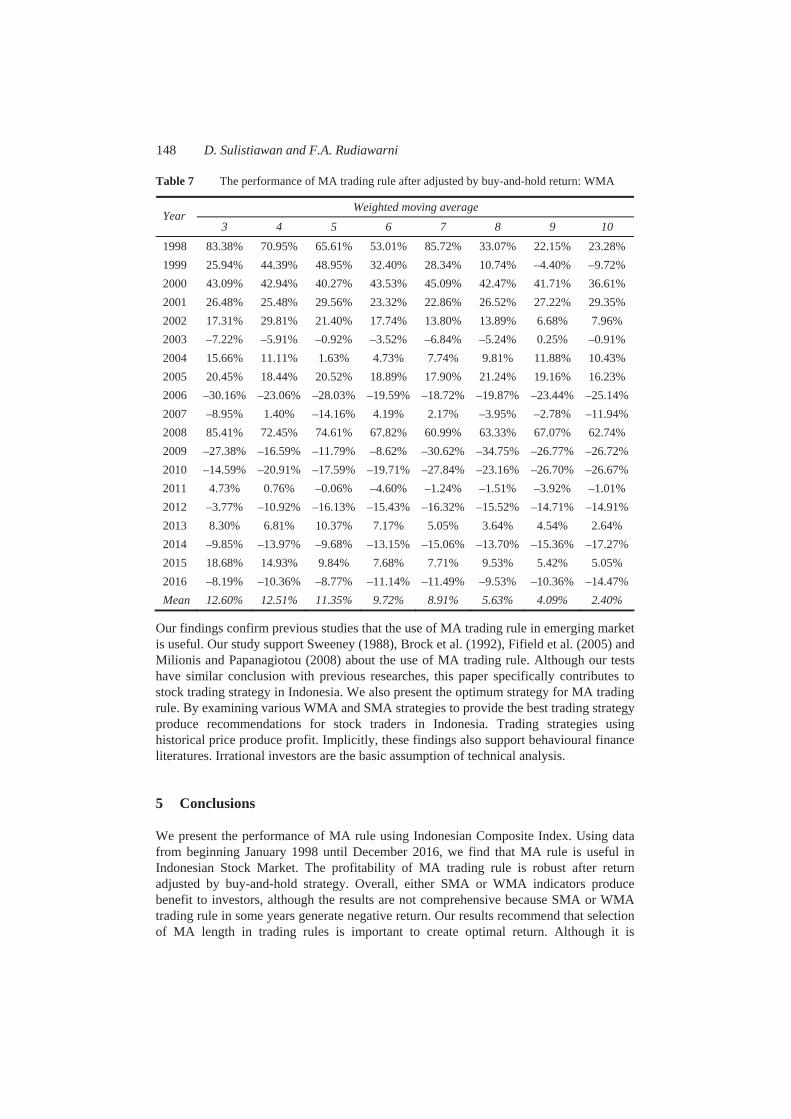
Table 7 presents the performance of WMA indicators after adjusted by buy and hold strategy. In 2006, 2009, 2010, 2012, 2014 and 2016 all WMA indicators yield negative returns. Conversely, in 1998, 2000, 2001, 2002, 2004, 2005, 2008, 2013, and 2015 all WMA indicators produce positive return. Although in several years WMA rule provide negative return, most of years and indicators give benefit to investors by producing positive return.
Tables 6 and 7 show that the performance of SMA and WMA trading rule with buy and hold strategy fluctuates from year to year. The highest performances are achieved in 1998 and in 2008 for WMA, which may be related to the financial crisis that hit Indonesia at that time. From Tables 6 and 7, it is also seen that the longer (shorter) MA tend to produce lower (higher) return.
Based on the presentation of previous tests, our data show that technical analysis using SMA and WMA rule tend to provide positive return to investors. Although our autoregressive test present that return t – 2, t – 3, and t – 4 do not affect current return, trading strategy test give evidence that previous stock price movement is useful. Actually, we also conduct auto regressive test using t–5 until t – 10 data. The autoregressive results indicate that past return affect future return. We believe that even though our test does not produce perfect strategy, but most of indicators adjusted by buy-and-hold return still generate positive results.
148 D. Sulistiawan and F.A. Rudiawarni
Table 7 The performance of MA trading rule after adjusted by buy-and-hold return: WMA
Weighted moving average Year
3 4 5 6 7 8 9 10 1998 83.38% 70.95% 65.61% 53.01% 85.72% 33.07% 22.15% 23.28% 1999 25.94% 44.39% 48.95% 32.40% 28.34% 10.74% –4.40% –9.72% 2000 43.09% 42.94% 40.27% 43.53% 45.09% 42.47% 41.71% 36.61% 2001 26.48% 25.48% 29.56% 23.32% 22.86% 26.52% 27.22% 29.35% 2002 17.31% 29.81% 21.40% 17.74% 13.80% 13.89% 6.68% 7.96% 2003 –7.22% –5.91% –0.92% –3.52% –6.84% –5.24% 0.25% –0.91% 2004 15.66% 11.11% 1.63% 4.73% 7.74% 9.81% 11.88% 10.43% 2005 20.45% 18.44% 20.52% 18.89% 17.90% 21.24% 19.16% 16.23% 2006 –30.16% –23.06% –28.03% –19.59% –18.72% –19.87% –23.44% –25.14% 2007 –8.95% 1.40% –14.16% 4.19% 2.17% –3.95% –2.78% –11.94% 2008 85.41% 72.45% 74.61% 67.82% 60.99% 63.33% 67.07% 62.74% 2009 –27.38% –16.59% –11.79% –8.62% –30.62% –34.75% –26.77% –26.72% 2010 –14.59% –20.91% –17.59% –19.71% –27.84% –23.16% –26.70% –26.67% 2011 4.73% 0.76% –0.06% –4.60% –1.24% –1.51% –3.92% –1.01% 2012 –3.77% –10.92% –16.13% –15.43% –16.32% –15.52% –14.71% –14.91% 2013 8.30% 6.81% 10.37% 7.17% 5.05% 3.64% 4.54% 2.64% 2014 –9.85% –13.97% –9.68% –13.15% –15.06% –13.70% –15.36% –17.27% 2015 18.68% 14.93% 9.84% 7.68% 7.71% 9.53% 5.42% 5.05% 2016 –8.19% –10.36% –8.77% –11.14% –11.49% –9.53% –10.36% –14.47% Mean 12.60% 12.51% 11.35% 9.72% 8.91% 5.63% 4.09% 2.40%
Our findings confirm previous studies that the use of MA trading rule in emerging market is useful. Our study support Sweeney (1988), Brock et al. (1992), Fifield et al. (2005) and Milionis and Papanagiotou (2008) about the use of MA trading rule. Although our tests have similar conclusion with previous researches, this paper specifically contributes to stock trading strategy in Indonesia. We also present the optimum strategy for MA trading rule. By examining various WMA and SMA strategies to provide the best trading strategy produce recommendations for stock traders in Indonesia. Trading strategies using historical price produce profit. Implicitly, these findings also support behavioural finance literatures. Irrational investors are the basic assumption of technical analysis.
5 Conclusions
We present the performance of MA rule using Indonesian Composite Index. Using data from beginning January 1998 until December 2016, we find that MA rule is useful in Indonesian Stock Market. The profitability of MA trading rule is robust after return adjusted by buy-and-hold strategy. Overall, either SMA or WMA indicators produce benefit to investors, although the results are not comprehensive because SMA or WMA trading rule in some years generate negative return. Our results recommend that selection of MA length in trading rules is important to create optimal return. Although it is
The use of moving average trading rules in Indonesian Stock Market 149
untabulated, the findings also show that MA’s performance is decreasing year by year. So there is a tendency that Indonesian market is more efficient in the future. Technical analysis indicators using MA rule tend to produce lower profit after 2010. We also present evidence that longer (shorter) MA tend to produce lower (higher) return.
There are several potential developments of this research in the future. The first, application of MA rule to individual stocks would provide more interesting findings because individual stocks generate more fluctuating price. The second, future studies could analyse the relation between technical analysis performance and firm characteristics.
References Ahmad, G.N. (2013) ‘Analysis of financial distress in Indonesian Stock Exchange’, Review of
Integrative Business and Economics Research, Vol. 2, No. 2, p.521. Ahmed, P., Beck, K. and Goldreyer, E. (2000) ‘Can moving average technical trading strategies
help in volatile and declining markets? A study of some emerging Asian markets’, ManagerialFinance, Vol. 26, No. 6, pp.49–62.
Anderson, A.R. (2015) ‘Conceptualising entrepreneurship as economic ‘explanation’ and the consequent loss of ‘understanding’’, International Journal of Business and Globalisation,Vol. 14, No. 2, pp.145–157.
Anderson, A.R. and Atkins, M.H. (2001) ‘Business strategies for entrepreneurial small firms’, Strategic Change, Vol. 10, No. 6, pp.311–324.
Brock, W., Lakonishok, J. and LeBaron, B. (1992) ‘Simple technical trading rules and the stochastic properties of stock returns’, The Journal of Finance, Vol. 47, No. 5, pp.1731–1764.
Dana, L.P. (1999) Entrepreneurship in Pacific Asia: Past, Present & Future, World Scientific, Singapore.
Dong, M. and Xue, Q. (2010) ‘The effect of governance transparency on earnings response coefficient: evidence from emerging markets’, International Journal of Accounting, Auditing and Performance Evaluation, Vol. 6, Nos. 2–3, pp.158–190.
Fifield, S.G., Power, D.M. and Donald Sinclair, C. (2005) ‘An analysis of trading strategies in eleven European Stock Markets’, The European Journal of Finance, Vol. 11, No. 6, pp.531–548.
Flanegin, F.R. and Rudd, D.P. (2005) ‘Should investments professors join the ‘crowd’’, Managerial Finance, Vol. 31, No. 5, pp.28–37.
Gunaasih, S.A.P.P. and Nursasmito, I. (2015) ‘The evaluation of non-economic events towards the LQ-45 index in Indonesia Stock Exchange by using event study method’, Review of Integrative Business and Economics Research, Vol. 4, No. 2, p.106.
Indonesian Stock Exchange (2016) IDX Fact Book 2016.Leuz, C., Nanda, D. and Wysocki, P.D. (2003) ‘Earnings management and investor protection: an
international comparison’, Journal of Financial Economics, Vol. 69, No. 3, pp.505–527. McKenzie, M.D. (2007) ‘Technical trading rules in emerging markets and the 1997 Asian currency
crises’, Emerging Markets Finance and Trade, Vol. 43, No. 4, pp.46–73. Medarac, H., Vignali, G. and Vignali, C. (2016) ‘Improving relations between business strategy
and marketing tactics’, International Journal of Business and Globalisation, Vol. 16, No. 1, pp.50–65.
Milionis, A. E. and Papanagiotou, E. (2008) ‘On the use of the moving average trading rule to test for weak form efficiency in capital markets’, Economic Notes, Vol. 37, No. 2, pp.181–201.

150 D. Sulistiawan and F.A. Rudiawarni
Nazário, R.T.F., e Silva, J.L., Sobreiro, V.A. and Kimura, H. (2017) ‘A literature review of technical analysis on stock markets’, The Quarterly Review of Economics and Finance,Vol. Vol. 66, pp.115–126.
Sweeney, R.J. (1988) ‘Some new filter rule tests: methods and results’, Journal of Financial and Quantitative Analysis, Vol. 23, No. 3, pp.285–300.
Wong, W.K., Manzur, M. and Chew, B.K. (2003) ‘How rewarding is technical analysis? Evidence from Singapore stock market’, Applied Financial Economics, Vol. 13, No. 7, pp.543–551.

Help SitemapLog in
International Journal of Business and Globalisation (IJBG) Inderscienc... https://www.inderscience.com/jhome.php?jcode=ijbg
1 dari 3 26/02/2020 11.59
Home > International Journal of Business and Globalisation
International Journal of Business andGlobalisation
This journal also publishes Open Access articles
IJBG proposes and fosters discussion on various aspects of business andglobalisation, including the physical environment and poverty.
Editor in ChiefProf. Leo Paul Dana
ISSN online1753-3635
ISSN print1753-3627
12 issues per yearSubscription price
About this journal Editorial board Submitting articles
Topics covered includeInternationalisation of SMEsCross-cultural businessGlobalisation and povertyBusiness ethics in the global environmentEmerging economiesImmigrant minorities in businessIndigenous enterprises and the global economyInternational tourismEco-tourismSustainable developmentEnvironmental degradationThe impact of oil and gasHuman mobility in a globalised worldCompetition in a global economyLocalisation/glocalisation strategies within contemporary globalisation
More on this journal...
•••••••••••••••
Browse issuesVol. 24Vol. 23Vol. 22Vol. 21Vol. 20Vol. 19
More volumes...
More on permissions
IJBG is indexed in:Scopus (Elsevier)Academic OneFile (Gale)cnpLINKer (CNPIEC)Business Collection (Gale)Google Scholar
•••••
Sign up for new issue alerts
Subscribe/buy articles/issues
View sample issue
Latest issue contents as RSS feed
Forthcoming articles
Journal information in easy print format(PDF)
Publishing with Inderscience:ethical guidelines (PDF)
Recommend to a librarian (PDF)
Feedback to Editor
Find related journals
Keep up-to-date
Our Blog
Follow us on Twitter
Visit us on Facebook
Our Newsletter (subscribe for free)
RSS Feeds
New issue alerts
International Journal of Business and Globalisation (IJBG) Inderscienc... https://www.inderscience.com/jhome.php?jcode=ijbg
2 dari 3 26/02/2020 11.59

Contact us About Inderscience OAI Repository Privacy and Cookies Statement Terms and Conditions Help Sitemap
© 2020 Inderscience Enterprises Ltd.
International Journal of Business and Globalisation (IJBG) Inderscienc... https://www.inderscience.com/jhome.php?jcode=ijbg
3 dari 3 26/02/2020 11.59

Help SitemapLog in
International Journal of Business and Globalisation (IJBG) Inderscienc... https://www.inderscience.com/jhome.php?jcode=ijbg
1 dari 3 26/02/2020 12.00
Home > International Journal of Business and Globalisation
International Journal of Business andGlobalisation
This journal also publishes Open Access articles
IJBG proposes and fosters discussion on various aspects of business andglobalisation, including the physical environment and poverty.
Editor in ChiefProf. Leo Paul Dana
ISSN online1753-3635
ISSN print1753-3627
12 issues per yearSubscription price
About this journal Editorial board Submitting articles
Editor in ChiefDana, Leo Paul, Montpellier Business School, France(lp.dana montpellier-bs.com)
Associate EditorsRezaei, Shahamak, Roskilde University, DenmarkSinger, Alan, Appalachian State University, USA
Regional Editor AsiaMisra, Subhas C., IIT Kanpur, India
Regional Editor EuropeLasch, Frank, Groupe Sup de Co Montpellier Business School, France
Editorial Board MembersAlon, Ilan, University of Agder, NorwayAnderson, Alistair R., The Robert Gordon University, UKAnderson, Robert B., University of Regina, CanadaChand, Anand, University of the South Pacific, FijiChew, Soon Beng, Nanyang Technological University, SingaporeCook, Steve, Oregon State University, USADabic, Marina, Nottingham Trent University, UK and University of Zagreb, CroatiaDatta, Saroj Kumar, Galgotias University , IndiaDonia, Enrica, University of Palermo, ItalyElo, Maria, University of Southern Denmark, DenmarkEsposito, Paolo, Eastern Pidmont University, ItalyGaddefors, Johan, University of Gavle, SwedenGuieu, Gilles, Aix-Marseille Université, FranceHall, C. Michael, University of Canterbury, New ZealandHeikkinen, Hannu I., University of Oulu, FinlandHeilbrunn, Sibylle, Kinneret Academic College on the Sea of Galilee, IsraelInal, Gözde, European University of Lefke, CyprusJabłoński, Marek, University of Dąbrowa Górnicza, PolandJaganjac, Jamila, University of Vitez, Bosnia and HerzegovinaKaratas-Ozkan, Mine, University of Southampton, UKKrueger, Jr, Norris, Entrepreneurship Northwest, USALitvin, Stephen W., College of Charleston, USAMärk, Stefan, Salzburg University of Applied Sciences, Austria
•
••
•
•
•••••••••••••••••••••••
Sign up for new issue alerts
Subscribe/buy articles/issues
View sample issue
Latest issue contents as RSS feed
Forthcoming articles
Journal information in easy print format(PDF)
Publishing with Inderscience:ethical guidelines (PDF)
Recommend to a librarian (PDF)
Feedback to Editor
Find related journals
Keep up-to-date
Our Blog
Follow us on Twitter
Visit us on Facebook
Our Newsletter (subscribe for free)
RSS Feeds
New issue alerts
International Journal of Business and Globalisation (IJBG) Inderscienc... https://www.inderscience.com/jhome.php?jcode=ijbg
2 dari 3 26/02/2020 12.00

Contact us About Inderscience OAI Repository Privacy and Cookies Statement Terms and Conditions Help Sitemap
© 2020 Inderscience Enterprises Ltd.
International Journal of Business and Globalisation (IJBG) Inderscienc... https://www.inderscience.com/jhome.php?jcode=ijbg
3 dari 3 26/02/2020 12.00

Help SitemapLog in
International Journal of Business and Globalisation (IJBG) Inderscienc... https://www.inderscience.com/info/inarticletoc.php?jcode=ijbg&year...
1 dari 2 26/02/2020 12.00
Contact us About Inderscience OAI Repository Privacy and Cookies Statement Terms and Conditions Help Sitemap
© 2020 Inderscience Enterprises Ltd.
International Journal of Business and Globalisation > Published issues > 2020 Vol.24 No.1
International Journal of Business andGlobalisation2020 Vol.24 No.1
Book Review
Pages Title and author(s)
1-18 The interplay between institutional factors and experience as determinantsof employment growth in South African SMEsBoris UrbanDOI: 10.1504/IJBG.2020.104954
19-38 Income inequality among entrepreneurs in Ondo State, NigeriaOlubukola Ehinmowo; Christian Harrison; Adewale Isaac OlutumiseDOI: 10.1504/IJBG.2020.104955
39-56 Unravelling the brand 'Patanjali' – study of a flourishing Ayurvedic brand inIndiaYukti Ahuja; Shashi Shekhar; Jigyasa SharmaDOI: 10.1504/IJBG.2020.104956
57-77 An empirical investigation of inequality among the self employed womenentrepreneurs in informal sector in IndiaAnnapurna Dixit; Alok Kumar PandeyDOI: 10.1504/IJBG.2020.104957
78-93 Capital budgeting practices of SME in Baden-Württemberg: findings of anemperical studyBernd Britzelmaier; Ulrike Pöpplow; Lars AndraschkoDOI: 10.1504/IJBG.2020.104958
94-104 A general equilibrium analysis of technological change to cope withenvironmental degradation affecting product pricesAfshin Amiraslany; Amarjit GillDOI: 10.1504/IJBG.2020.104959
105-122 Key financial performance indicators in German family firms: findings of anempirical studyOdile Barbe; Bernd Britzelmaier; Fabian List; Lars AndraschkoDOI: 10.1504/IJBG.2020.104963
123-138 The effect of nutrition information, status quo bias, and loss aversion onthe health of Thais and their consumption behaviour: a behaviouraleconomic approachPeera TangtammarukDOI: 10.1504/IJBG.2020.104964
139-150 The use of moving average trading rules in Indonesian Stock MarketDedhy Sulistiawan; Felizia Arni RudiawarniDOI: 10.1504/IJBG.2020.104965
Sign up for new issue alerts
Subscribe/buy articles/issues
View sample issue
Latest issue contents as RSS feed
Forthcoming articles
Journal information in easy print format(PDF)
Publishing with Inderscience:ethical guidelines (PDF)
Recommend to a librarian (PDF)
Feedback to Editor
Find related journals
Keep up-to-date
Our Blog
Follow us on Twitter
Visit us on Facebook
Our Newsletter (subscribe for free)
RSS Feeds
New issue alerts
Return to top
International Journal of Business and Globalisation (IJBG) Inderscienc... https://www.inderscience.com/info/inarticletoc.php?jcode=ijbg&year...
2 dari 2 26/02/2020 12.00
Contact us About Inderscience OAI Repository Privacy and Cookies Statement Terms and Conditions Help Sitemap
© 2020 Inderscience Enterprises Ltd.
Help SitemapLog in
International Journal of Business and Globalisation > 2020 Vol.24 No.1
Title: The use of moving average trading rules inIndonesian Stock MarketAuthors: Dedhy Sulistiawan; Felizia Arni Rudiawarni
Addresses: Faculty of Business and Economics, EB Building 2nd floor, Jl. Raya Kalirungkut,Surabaya 60293, Indonesia ' Faculty of Business and Economics, EB Building 2nd floor, Jl. RayaKalirungkut, Surabaya 60293, Indonesia
Abstract: The development of behavioural finance stimulates the usefulness of simple tradingrule. Decision biases are reflected in price movement, which is utilised by technical analysisindicators to generate trading rules. The main objective of this research is to evaluate theperformance of the moving average (MA) trading rules, as a popular indicator in stock markets.The sensitivity of MA length is also examined to generate optimal return. We employ daily dataof Indonesia composite index from the beginning of 1998 to the end of 2016 to examine theprofitability of MA trading rule. The findings show that investors can apply MA trading rules inIndonesia stock market. Our supplementary analysis indicates that shorter (longer) MA producehigher (lower) return. The return of MA trading rules is also affected by trend. This papercontributes to trading strategy studies, particularly for stock exchanges in emerging markets. Ourresults recommend that selection of MA length in trading rules is important to create optimalreturn.
Keywords: technical analysis; trading strategy; moving average; weak-form efficiency; behaviour;trading rule; return; emerging markets; investors; Indonesia.
DOI: 10.1504/IJBG.2020.104965
International Journal of Business and Globalisation, 2020 Vol.24 No.1, pp.139 - 150
Available online: 03 Feb 2020 *
Full-text access for editors Access for subscribers Purchase this article
Comment on this article
Keep up-to-date
Our Blog
Follow us on Twitter
Visit us on Facebook
Our Newsletter (subscribe for free)
RSS Feeds
New issue alerts
Return to top
Article: The use of moving average trading rules in Indonesian Stock ... https://www.inderscience.com/info/inarticle.php?artid=104965
1 dari 1 26/02/2020 12.00