Embed Size (px)
Citation preview

THE USE OF MIND MAPPING TECHNIQUE TO IMPROVE
STUDENTS’ SPEAKING ABILITY: AN EXPERIMENTAL
STUDY AT CLASS XI IPA OF SMAN 6 MATARAM
A JOURNAL
Submitted as a Partial Fulfillment of the Requirements for Sarjana Pendidikan
(S.Pd) in English Department Faculty at Teacher, Training and Education faculty
Mataram University
By:
FITRIANA AMALIA
E1D 113 059
ENGLISH EDUCATION PROGRAM
LANGUAGE AND ART DEPARTMENT
FACULTY OF TEACHER TRAINING AND EDUCATION
UNIVERSITY OF MATARAM
2017


THE USE OF MIND MAPPING TECHNIQUE TO IMPROVE STUDENTS’
SPEAKING ABILITY: AN EXPERIMENTAL STUDY AT CLASS XI IPA OF
SMAN 6 MATARAM
FITRIANA AMALIA
E1D 113 059
ABSTRACT
This thesis is aimed to find out the effectiveness of Mind Mapping Technique in
improving the students’ speaking ability at class XI IPA of SMAN 6 Mataram.
This study is an experimental study which was conducted at SMAN 6 Mataram..
The subjects of the study were class XI IPA 1 and XI IPA 2 which consists of 39
and 40 students, this method sampling was called purposive sampling technique.
The data were analyzed by quantitative method The researcher used this method
to solve the students’ problem such as less motivation, afraid of making mistakes
and hard to say something. In collecting the data, three kinds of instruments were
used, those are pre-test, treatment and post-test. The finding showed that, the
experimental group show a better improvement than the control group. The result
of t-table is 1,71, which was higher than the value of t-test at the homogeneity test
of 1,03 at the pre-test and 0,48 at the post-test. The result of normality test of
experimental group in pre-test was 2, 87, then it becomes 7,22 after receiving the
treatment. It indicates that, the speaking ability was increased 4,35. Meanwhile,
the result of normality test of control group in pre-test was 3,23, then it becomes
4,76 without having the treatment. In conclusion, Mind mapping technique was
significantly effective to used in improve the students’ speaking ability at class XI
IPA of SMAN 6 Mataram.
Key words: Speaking Ability, Factors and Students’ Problem
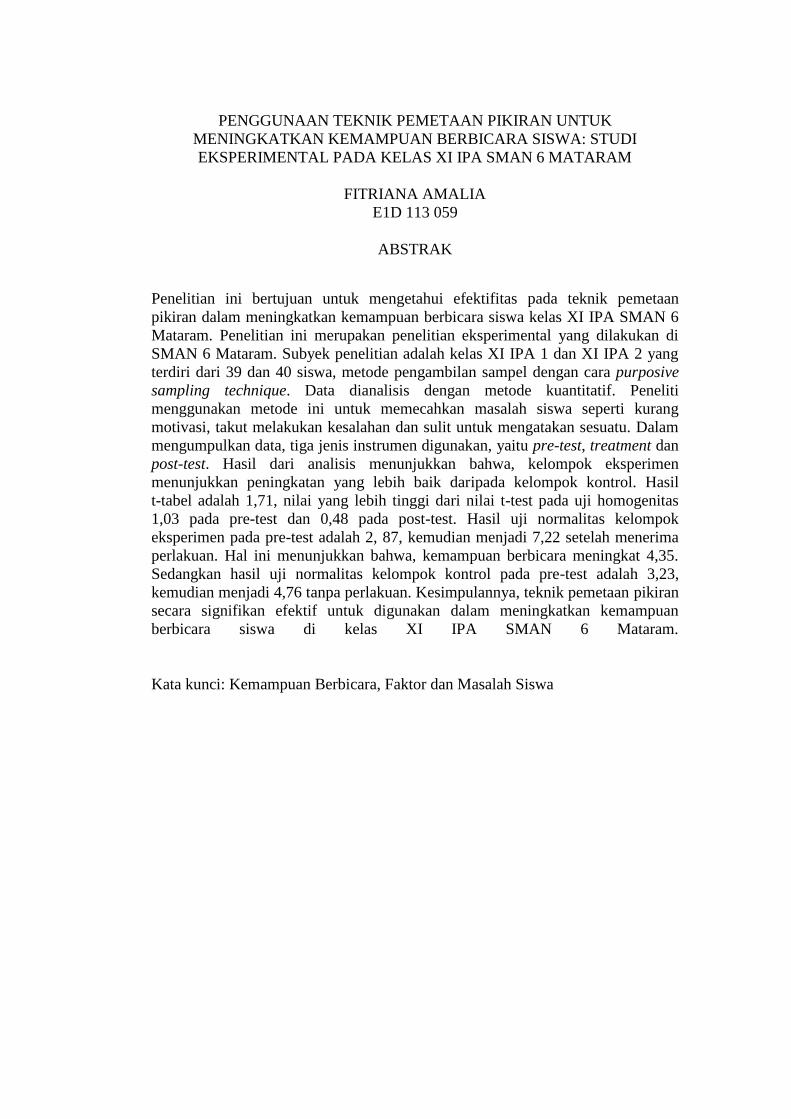
PENGGUNAAN TEKNIK PEMETAAN PIKIRAN UNTUK
MENINGKATKAN KEMAMPUAN BERBICARA SISWA: STUDI
EKSPERIMENTAL PADA KELAS XI IPA SMAN 6 MATARAM
FITRIANA AMALIA
E1D 113 059
ABSTRAK
Penelitian ini bertujuan untuk mengetahui efektifitas pada teknik pemetaan
pikiran dalam meningkatkan kemampuan berbicara siswa kelas XI IPA SMAN 6
Mataram. Penelitian ini merupakan penelitian eksperimental yang dilakukan di
SMAN 6 Mataram. Subyek penelitian adalah kelas XI IPA 1 dan XI IPA 2 yang
terdiri dari 39 dan 40 siswa, metode pengambilan sampel dengan cara purposive
sampling technique. Data dianalisis dengan metode kuantitatif. Peneliti
menggunakan metode ini untuk memecahkan masalah siswa seperti kurang
motivasi, takut melakukan kesalahan dan sulit untuk mengatakan sesuatu. Dalam
mengumpulkan data, tiga jenis instrumen digunakan, yaitu pre-test, treatment dan
post-test. Hasil dari analisis menunjukkan bahwa, kelompok eksperimen
menunjukkan peningkatan yang lebih baik daripada kelompok kontrol. Hasil
t-tabel adalah 1,71, nilai yang lebih tinggi dari nilai t-test pada uji homogenitas
1,03 pada pre-test dan 0,48 pada post-test. Hasil uji normalitas kelompok
eksperimen pada pre-test adalah 2, 87, kemudian menjadi 7,22 setelah menerima
perlakuan. Hal ini menunjukkan bahwa, kemampuan berbicara meningkat 4,35.
Sedangkan hasil uji normalitas kelompok kontrol pada pre-test adalah 3,23,
kemudian menjadi 4,76 tanpa perlakuan. Kesimpulannya, teknik pemetaan pikiran
secara signifikan efektif untuk digunakan dalam meningkatkan kemampuan
berbicara siswa di kelas XI IPA SMAN 6 Mataram.
Kata kunci: Kemampuan Berbicara, Faktor dan Masalah Siswa
1. INTRODUCTION
Language is used by people to express their thoughts, opinions and ideas.
Language is usefull for human life, beside to keep the relationship with each
other, it is also used to express their feeling. It is hard to imagine people
communicate without language. Speaking is one of the four language skills which
should be developed in teaching English. According to Brown (cited in Pebriana:
2015) the term of speaking is an interactive process of constructing meaning that
involves producing, receiving and processing information. For many students,
learning to speak in English is a priority. They may need this skill for a variety of
reasons, such as to exchange the information or to persuade the other people to
believe about what they said.
Speaking is a productive skill in English that consists of two main focuses,
which are fluency and accuracy. According to Srivastava: 2014 (cited in Firliany:
2016) Accuracy refers to the ability of the learners to produce grammatically
correct sentences, in this case the learners should not only know the correct
grammatical rules of the language but also able to speak and write accurately.
Fluency refers to a level of proficiency in communication. It is the ability to
produce written and spoken sentences with easy, efficiency without hesitation.
People need to communicate with the other people to acquire their purpose
in speaking. Therefore, people used the language as a device to express their
thought. Speaking is one of the most important skills that must be mastered after
listening. Someone can deliver a message of one topic to the other people through
the process of sharing and exchanging the information. Speaking would be
success if a person can convey their opinions with a good idea. The process of

speaking included some aspects such as pronunciation, intonation, fluency and
accuracy.
In the observation, the teacher said there are some problems in SMAN 6
Mataram, most of the students were hard to say something. Even though, they had
something in their mind but when they delivered their ideas, they were not
confidence since they were afraid of making mistakes. Lack of vocabulary, and
less motivation in English subject were the reasons. Then, most of the students
were not interested in speaking English, they prefered to used their own mother
tongue than the target language to speak with their friends. Furthermore, the
teacher used conventional method especially to speak during the teaching and
learning process.
Speaking skill was still dominated by the teacher and some invented
students. Teaching speaking conventionally by asking and answering some
questions to the students did not invited the whole students to speak up. Also,
during the teaching and learning process especially in speaking subject, a couple
of students were asked to memorize the dialogue on their textbook and performed
it in front of the classroom. The activity of this classroom was a teacher-centered
because mostly the teacher acted and controlled the students without giving the
opportunity to express and give their opinions.
Based on the problem above, we need to facilitated the students to learn
English easily during the teaching and learning process. The teacher should design
good technique to make the students active and creative in the classroom. One of
the techniques is Mind Mapping technique. Buzan (2005:1) argued that, Mind
Mapping is a very powerful tool for brainstorming, creative thinking, problem

solving and organizing the ideas. By using Mind Mapping, the students
understand more about the map and they would learn to speak better. For
example, the students write the topic in the middle of the paper. Then, it connects
the branch of mind to the central picture. Actually the branches use different ink
colors to make students remember easier about the words and also the color used
to make mind mapping to be more interesting. Later, the students would practice
to speak in front of the classroom based on their mind mapping.
The researcher used Mind Mapping technique to improve students speaking
ability at class XI IPA Of SMAN 6 Mataram. Mind Mapping technique is a
powerful tool for brainstorming, it helped the students to organize the ideas and
of course the students would be able to think creatively, as the result they can
solve their problem in speaking skill. By using Mind Mapping, the students
understand more about the map that they would speak. During the process of data
collection, teacher ask the students to write a topic in the middle of paper. But the
topic here based on pictures in order to help the students in arousing an
imagination to open their mind. After that, the pictures would connnect the branch
of mind to the central picture, the branches used various ink colors to make mind
mapping become more fun and enjoyble. At last, the students would practice to
speak in front of the classroom based on their mind mapping.
Based on the background, the reseacher conducted a research under the
tittle “The Use Of Mind Mapping Technique To Improve Students’ Speaking
Ability : A Study At Class XI IPA Of SMAN 6 MATARAM ”.

2. REVIEW OF RELATED LITERATURE
Human generally used speaking to communicate by each other in daily
interaction. Julis M. Dobsen (cited in Yahya : 2013), speaking is an activity of
interchanging information by spoken words. The information transfered and
interchange between the speaker and the listener through the conversation.
Beside that, speaking is an oral language proficiency and a complex language
skill that involve knowledge and pronunciation, grammar, vocabulary, and
culture. Speaking is also used for many purposes, and each purpose involves
different skill.
According to Brown (2004) speaking is an interactive process of constructing
meaning that involved producing, receiving and processing information. Human
generally used speaking as a mean of communication in daily interaction.
Chaney (cited in Pebriana, 2015), speaking is the process of building and
sharing meaning through the used of verbal and non verbal symbols in a variety of
context. Therefore, at least there are two peoples who are involved in the
conversation in order to be able to interchange the information that could have
built the same uderstanding based on the conversation they talk about. Although
speaking is totally natural, speaking in a language other than our own is anything
but simple.
Nowdays, teaching speaking has been undervalued. The english teacher
taught speaking just as a repetition of drills or memorizing the dialogues.
However, in this era modern the goal of teaching speaking should improve the
students communicative skills. That is the best way for students to express
themselves and learn how to follow the social and culture rules appropriate in
communicative circumstance.
A. The Components Of Speaking
According to Haris (1969) there are several components of speaking that need
to be considered. Those components are :
1. Fluency (Fluently and accurately)
Fluency defined as the ability to speak fluently and accurately. Fluency refers to
the ease and speed of the flow with which sounds, syllabels, words and pharases
are join together when speaking. It mean that, when speaker communicate in a
conversation with the listener, they can reponse well without any difficulties.
2. Accuracy (Grammar and Pronunciation)
Accuracy focus on the used of grammar and pronunciation. Grammar is the
students ability to manipulate the structured and to distinguish appropriate
grammatical form in appropriate one which is needed for students to arrange
correct sentences in the conversation, while pronunciation refers to produce easily
comprehension articulation.
3. Comprehension
Comprehension for oral communication that require a subject to respond the
speaker as well as to initiate it. It means that, someone show their comprehend or
understand well about the topic if that they can answer or express well and
correctly their speaker.
B. Definition Of Mind Mapping
Mind Mapping is the concept which identifies an oral or written text, by the
psychologist Tony Buzan in 1960s. The concept of mind mapping is organizes in
hierarchy from the most general to the most specific concept. By using mind
maapping, we will know where the topic were flow.

On a concept of maps, there are represented by boxes or circles which are
joined with lines are arrows. Buzan (2006) argue that, mind mapping is a
technique of making outline which used to represent words, ideas, tasks or another
link to an arranged radically around central key word or idea by lines and
typically it contains by using words, ideas, short pharases or pictures.
Invented by Buzan (2005:1), mind mapping is a very powerful tool for
brainstorming, creative thinking, problem solving, organizing of ideas and of
course, note taking. Mind mapping as a note taking technique can be used for
almost any subject and done in any language. By using mind maps we can recall
the concept of mapping that we will used to speak.
Buzan (2006) argue that, mind mapping is an easy way to place information
to brain and take the infrmation out from brain, it is creative and effective way to
write and will maap your mind by a simple way. Mind mapping is good for
students, because the more they learn the material, the greater they need to
condense and simplify it in a form that is easy to learn.
C. Mind Mapping Technique
Buzan (cited in Elsifa : 2014) argued that, there are 8 techniques in mind
mapping, those are:
1. Take a piece of white paper in a landscape position.
2. Start by draw a color image in the centre of the paper and write the
keyword with capital letters.
3. Choose a color and draw the main themes of mind map on the thick
branches out from the central image.
4. Add other branches to make another main theme.

5. Make thick and colorful branches around the map.
6. Write basic ideas about the keyword and still use the capital letter.
7. Add an image to all the main branches to represent each key theme and
also use image to visualize every important keyword on your map.
8. Let your mind map be as imaginative as possible.
3. RESEARCH METHOD
a. Research Design
This research was an experimental research which used two group designs
those are : experimental group and control group. Both groups would be given the
same kind of tests but the differences are experimental group would be given a
treatment and control group would not be given a treatment.
In conducting the research, the researcher cooperate with the English
teacher of XI IPA at SMAN 6 MATARAM. The study aims to find out Is Mind
Mapping Technique Effective To Improve The Students’ Speaking Ability.
b. Population and Sample
According to Arikunto (2006:130), population is the whole research
object. The population for this research is class XI IPA of SMAN 6 MATARAM,
who are distributed into 4 classes : XI IPA 1, XI IPA 2, XI IPA 3 and XI IPA 4.
The total numbers of the population are 163 students, based on the data from the
administration office of SMAN 6 MATARAM.
In this research, the researcher used purposive sampling technique. It is a
non-probability sample that selected based on the characteristics of a sample and
the objective of the study. This experimental study required two classes to be the
sample of the study. One is assigned as the experimental group and another is the
control group. The researcher choosed class XI IPA 1 and XI IPA 2 as the sample

of the sudy, because both class have the same characteristics. The researcher uses
class XI IPA 1 as the control group consist of 39 students, while class XI IPA 2 as
the experimental group consist of 40 students.
c. Data Collection Technique
The researcher used some instruments in collecting the data, such as:
1. Pre-Test
First, the researcher gave pre-test for both experimental group and control
group. The test is in oral test, the students were asked to talk about report text and
the topic is animal. Each of them had time to talk about 2-3 minutes. The function
of giving pre-test is to determine the background knowledge of the students about
the topic.
2. Treatment
Second, each group gave the treatment, where the treatment is different.
The experimental group explained about the topic and mind mapping technique.
In contrast to the experimental group, the control group teach the same topic but
it did not used mind mapping technique. The technique used in control group is
scientific approach. There are 5 steps in scientific approach: In Observing, the
researcher raise students’ background of knowledge about the topic and explained
the materials. Then in questioning, the students’ were allowed to ask about the
materials that they did not understand. In experimenting, the students’ were
created their own paragraph based on the researcher explanation. In associating,
they were disscussed about the ideas of each paragraph with their friend. And the
last is in communicating, the students’ were asked to explain about their work in

front of the classroom. The researcher asked the students to speak in front of the
classroom without any specific technique from the researcher.
3. Post-test
In this stage, the oral test gave for both of the groups. The researcher gave
the same test as in pre-test. However, the researcher rearrange the test. The result
of pre-test and post-test in experimental group and control group were calculated
by the researcher and the teacher during the teachning and learning process.
4. The teacher observation sheet
The observations were recorded in every meeting during the implementation
of Mind Mapping technique in teaching and learning process. The purpose of
recording the observations had a clear description of the existing condition in the
classroom and as the sources of reflection for the next meeting. Besides, the
teacher also decided the scores of the student.
4. RESULTS
After collected the data, the pre-test and post-test scores of experimental
group and control group were computed using the formula above. Here was the
result of both groups:
Table 1. pre-test and post-test of experimental group and control group
No
Experimental group Control group
Name pre-test post-test Name pre-test post-test
1 GF 42 58 AD 50 75
2 AF 58 75 AN 33 42
3 AL 50 83 AL 42 58
4 AP 33 58 BQA 67 83
5 AM 50 83 CA 42 67
6 AG 33 58 CL 50 67
7 BQA 75 92 CIK 33 42
8 BQW 50 83 DW 33 42

9 DG 58 92 DE 58 67
10 DV 58 92 DWA 42 58
11 DW 67 83 FR 42 58
12 FB 67 83 DK 58 67
13 FR 42 67 GSA 50 75
14 WN 50 75 GSB 33 42
15 EK 58 75 RAI 42 58
16 WY 42 67 ARY 50 67
17 HS 33 58 SR 67 83
18 IN 75 92 KM 42 58
19 IF 67 83 PWA 75 92
20 IT 75 67 PWW 58 75
21 JN 42 75 ID 33 33
22 HZ 33 58 IDN 67 83
23 ML 67 75 IS 42 58
24 MC 67 75 MG 50 67
25 MA 42 67 MA 58 83
26 KD 50 67 MI 67 75
27 ME 58 75 MR 33 42
28 AY 67 75 NM 50 75
29 YS 75 83 KD 67 83
30 RV 42 67 LK 42 58
31 SJ 50 67 LP 75 92
32 SM 42 67 MS 50 75
33 ST 67 83 PE 33 42
34 SV 58 92 RZ 42 58
35 TN 33 58 RC 50 67
36 TS 50 83 SL 67 83
37 WR 58 75 SN 50 67
38 WS 50 75 SY 58 92
39 WY 58 67 SW 58 75
40 YN 67 83
Sum 2159 2991 Sum 2001 2643
The tabulation above show the score of both groups. It was found that the
mean score of experimental group pre-test was almost similar with control group.
They were 2159 and 2001. It shows that these two groups had almost the same
background of speaking.

After getting and calculating the raw data of both group, the mean score of
post-test of experimental group was 2991. It indicated that the mean score was
increased 832. Meanwhile, the students of control goup were taught without using
mind mapping technique, the mean score of post-test was 2643. It indicated that
the mean score was increased 642 and it is lower than the post-test of
experimental group.
The highest score of pre-test in both group were same, it is 75 and the
lowest score was 33. Then, after giving the treatment, the highest score of post-
test in experimental group was 92 and the lowest score was 58. On the other hand,
the highest score of post-test in control group was 92 but the lowest score was 42.
From this data, it can be concluded that the result of students score in
experimental group was higher than control group.
4.1 The data computation
The data of deviation and square deviation score of both groups are
presented in the tables below :
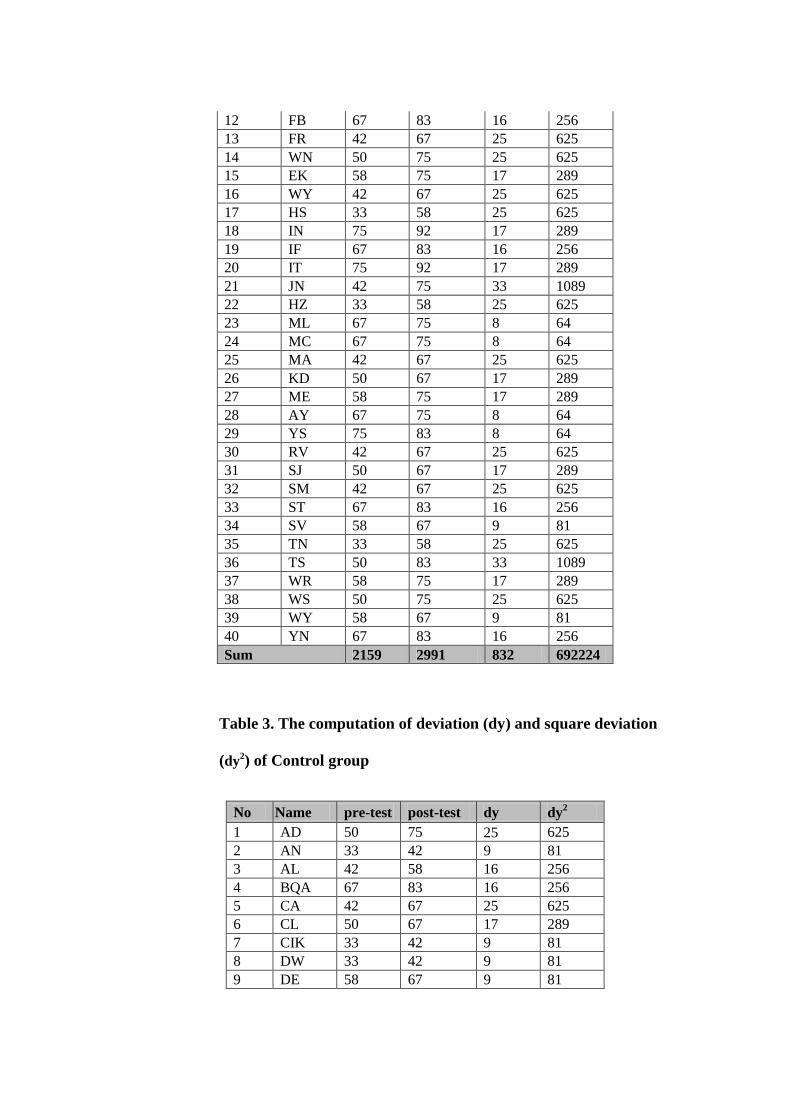
Table 2. The computation of deviation (dx) and square deviation
(dx2) of Experimental group
No Name pre-test post-test dx dx2
1 GF 42 58 16 256
2 AF 58 75 17 289
3 AL 50 83 33 1089
4 AP 33 58 25 625
5 AM 50 83 33 1089
6 AG 33 58 25 625
7 BQA 75 92 17 289
8 BQW 50 83 33 1089
9 DG 58 92 34 1156
10 DV 58 92 34 1156
11 DW 67 83 16 256
12 FB 67 83 16 256
13 FR 42 67 25 625
14 WN 50 75 25 625
15 EK 58 75 17 289
16 WY 42 67 25 625
17 HS 33 58 25 625
18 IN 75 92 17 289
19 IF 67 83 16 256
20 IT 75 92 17 289
21 JN 42 75 33 1089
22 HZ 33 58 25 625
23 ML 67 75 8 64
24 MC 67 75 8 64
25 MA 42 67 25 625
26 KD 50 67 17 289
27 ME 58 75 17 289
28 AY 67 75 8 64
29 YS 75 83 8 64
30 RV 42 67 25 625
31 SJ 50 67 17 289
32 SM 42 67 25 625
33 ST 67 83 16 256
34 SV 58 67 9 81
35 TN 33 58 25 625
36 TS 50 83 33 1089
37 WR 58 75 17 289
38 WS 50 75 25 625
39 WY 58 67 9 81
40 YN 67 83 16 256
Sum 2159 2991 832 692224
Table 3. The computation of deviation (dy) and square deviation
(dy2) of Control group
No Name pre-test post-test dy dy2
1 AD 50 75 25 625
2 AN 33 42 9 81
3 AL 42 58 16 256
4 BQA 67 83 16 256
5 CA 42 67 25 625
6 CL 50 67 17 289
7 CIK 33 42 9 81
8 DW 33 42 9 81
9 DE 58 67 9 81

10 DWA 42 58 16 256
11 FR 42 58 16 256
12 DK 58 67 9 81
13 GSA 50 75 25 625
14 GSB 33 42 9 81
15 RAI 42 58 16 256
16 ARY 50 67 17 289
17 SR 67 83 16 256
18 KM 42 58 16 256
19 PWA 75 92 17 289
20 PWW 58 75 17 289
21 ID 75 92 17 289
22 IDN 67 83 16 256
23 IS 42 58 16 256
24 MG 50 67 17 289
25 MA 58 83 25 625
26 MI 67 75 8 64
27 MR 33 42 9 81
28 NM 50 75 25 625
29 KD 67 83 16 256
30 LK 42 58 16 256
31 LP 75 92 17 289
32 MS 50 75 25 625
33 PE 33 42 9 81
34 RZ 42 58 16 256
35 RC 50 67 17 289
36 SL 67 83 16 256
37 SN 50 67 17 289
38 SY 58 92 34 1156
39 SW 58 75 17 289
Sum 2001 2643 642 11836
The researcher calculated the homogeneity test and normality test for two
groups to find out whether the hypothesis is rejected or accepted. The researcher
devided the analysis into two parts: first is the homogeneity and normality test of
pre-test and last is the homogeneity and normality test of post-test. The result of
those tests could be found in the table below:
Table 4. The result of homogeneity and normality test

PRE-TEST POST-TEST
H
O
M
O
G
E
N
Homogeneity test both of
groups
Homogeneity test both of
groups
1,03 < 1,71 0,48 < 1,71
Normality test of
experimental group
Normality test of
experimental group
2,87 < 11,070 7,22 < 11,070
Normality test of control
group
Normality test of control
group
3,23 < 11,070 4,76 < 11,070
Table 5. The result of hypothesis test
or
We can concluded that, the hypothesis is works.

19
5. Conclusion
According to the statistical analysis of t-test, there was a significant difference
in speaking mastery of two groups. The experimental group show a better
improvement than the control group. The result of t-table is 1,71, which was higher
than the value of t-test at the homogenety test of 1,03 at the pre-test and 0,48 at the
post-test. The result of normality test of experimental group in pre-test was 2, 87,
then it is become 7,22 after got the treatment. It indicates that, the speaking ability
was increase 4,35. Meanwhile, the result of normality test of control group in pre-test
was 3,23, then it is become 4,76 without got the treatment. It indicates that, the
speaking ability of control group did not increase significantly.
Based on the analysis, the Null Hypothesis (Ho): “Mind mapping is not
effective to be used to improve students speaking ability” is rejected, and the
Alternate Hypothesis (Ha): “Mind mapping is effective to be used to improve
students speaking ability” is accepted. Therefore, mind mapping technique is
effective to be used in improve students speaking ability.
.

20
REFERENCES
Arikunto, Suharsimi. 2002. Prosedur Penelitian. Jakarta : PT. Rineka cipta.Accessed
from:https://www.doc/91809892/arikunto-suharsimi-2002-prosedur-
penelitian-suatu-pendekatan-praktek-edisi-revisi-iv-jakarta-rineka-cipta on
14January 2017.
Buzan, Tony. 2005. Mind Map At Work. Jakarta. PT Gramedia Pustaka
Utama.Accessed
from:https://books.google.co.id/books?id=ZQ39rlCiAVYC&pg=PR4&lpg=P
R4&dq=Buzan,+Tony.+2005.+Mind+Map+At+Work.+Jakarta.+PT+Gramedi
a+Pustaka+Utama.&source on 14January 2017.
Buzan, Tony. 2006. Buku Pintar Mind Map. Jakarta. PT Gramedia Pustaka
Utama. Accessed from: http://bukubukusnul.weebly.com/pengembangan-diri/-
buku-pintar-mind-map-oleh-tony-buzan on 18 january 2017.
Davies, Martin.2010. Concept Mapping, Mind Mapping and Argument Mapping:
What Are The Differences And Do They Matter. University of Melbourne,
Parkville, VIC, Australia. _ Springer Science+Business Media B.V. 2010.
Accessed from:
https://www.researchgate.net/publication/225631292_Concept_Mapping_Min
d_Mapping_and_Argument_Mapping_What_are_the_Differences_and_Do_T
hey_Matter on 18 January.
Elsifa, Gaga Afisena. 2014. Teaching Reading Narrative Text Through Applying
Mind Mapping Technique : An Experimental Study At Second Grade Of
SMKN 7 Mataram In Academic Year 2013/2014. Mataram University.
Unpublish Thesis.
Firliany, Yunita Alivia. 2016. The Students Strategies In Improving Speaking Skill:
Comparative Study At The Grade IX Students Of SMPN 6 Mataram In
Academic Year 2014/2016. Mataram University. Unpublish Thesis.
Patel, fay., Mingsheng Li., and Prahalad Sooknanan., 2011. Interculture
communication. Singapore. SAGE Publications Asia-Pacific Pte Ltd.
Pebriana, Hurnia. 2015. Improving Students speaking Skill By Using Story telling
At Class VIII G SMPN 15 Mataram Academic Year 2014/2015. Mataram

21
university. Unpublish thesis.
Rahmasari, Risana. 2014. The Effect Of Using Mind Mapping Technique In
Writing Descriptive Text : An Experimental Study At First Year Students
Of SMKN 1 Mataram In Academic Year 2013/2014. Unpublish thesis.
Riduwan. 2013. Pengantar statistika. Bandung. Alfabeta.
Shastri, Pratima Dave. 2010. Communicative Approach to The Teaching Of
English As A Second Llanguage. Mumbay: Himalaya Publishing House.
Sugiono. 2013. Statistika Untuk Penelitian. Bandung. Alfabeta.
Sujana, I Made. 2016. Integrating A Mind Mapping Technique And
Information Gap Activities In Teaching Academic
Reading In English.Mataram: English Education Department
Faculty of Education, University of Mataram, Lombok, Indonesia.
Yahya, Armazi. 2013: Improving Students Speaking Skills of Class XI IPA 2
SMAN 1 Batukliang academic year 2012/2013 by using fishbowl. Mataram
university. Unpublish thesis.
Yunus. 2015. Implementasi pembelajaran saintifik 5M.Accessed from:
https://www.kompasiana.com/m_yunus/implementasi-pembelajaran-
saintifikon 10 september.
Zulkarnain. 2015. The Effectiveness Of Using Mind Mapping Technique In
Teaching Reading and Writing : An Experimental Research At Second
Grade Of Junior High School Salafiah Darul Falah Pagutan Mataram In
Academic Year 2014/2015. Unpublish thesis.