Embed Size (px)
Citation preview
Transaction
Paper
Background
Heavy liquids have wide use in the laboratoryfor the appraisal of gravity-separationtechniques on ores. The aim is to separate theore samples into a series of fractions accordingto density, establishing the associationbetween the high and low specific gravityminerals. The mineral grains either ‘sink’ or‘float’ in the heavy liquid selected and arerecovered for further analysis.
Organic heavy liquids
Unfortunately, there are only a limited numberof high density (‘heavy’) liquids and thesetend to be more toxic as their densityincreases. The most commonly used heavyliquids in these analyses are volatilehalogenated organic solvents (e.g.diiodomethane, relative density 3.31).
Tetrabromoethane (TBE), having a relativedensity (RD) of 2.96, was commonly used andmay be diluted with white spirit or carbontetrachloride to give a range of densities below2.96. Using such heavy liquids, acetone can beused as a diluent and for washing the organicfrom the separated products. Considerableeffort must be expected in handling volatile,flammable and toxic organic liquids in samplewashing and recovery (recovery of TBE isoften only 90%).
Bromoform (relative density 2.89) may bemixed with carbon tetrachloride (relativedensity 1.58) to give densities in the range1.58–2.89. For densities of up to 3.3,diiodomethane (methylene iodide) is useful,diluted as required with triethylorthophosphane. However, this presentssignificant health and safety hazards.
Mixtures of thallium formate and thalliummalonate were found in the early 1900s byClerici to provide liquids having relativedensities up to 4.0 at 20°C, or 5.0 at 90°C,hence ‘Clerici’s solution’ (Wills, 1997). For thecharacterization of the heavy components ofmineral sand deposits (e.g. anatase RD 3.9,rutile RD 4.2, ilmenite RD 4.4–4.7 and zirconRD 4.6–4.8) there is currently no heavy liquidalternative to Clerici’s solution. Clerici’ssolution is highly toxic and testing is now
The use of low-toxic heavy suspensionsin mineral sands evaluation and zirconfractionationby L. Koroznikova*, C. Klutke*, S. McKnight*, and S. Hall†
Synopsis
This paper outlines a simple methodology for mineral characteri-zation, developed as part of the Australian Mineral IndustryResearch Association (AMIRA) managed research project P777 ‘TheDevelopment of Heavy Suspension Techniques for High DensitySeparations (Replacement of Clerici’s Solution)’. The project wassponsored by De Beers, Rio Tinto and Iluka Resources.
Heavy mineral characterization of samples arising fromexploration, mining or metallurgical processes is frequentlyconducted using laboratory heavy liquid analysis. Unfortunately,there are only a limited number of high density (‘heavy’) liquidsand these tend to be more toxic as their density increases. Low-toxicity inorganic solutions, based on tungsten compounds, havebeen developed that can be utilized at relative densities (RD) up to3.0. Beyond this value organic liquids can be used; however, thispresents significant health and safety hazards. Diiodomethane(methylene iodide) having a relative density of 3.31 is commonlyused. Mixtures of thallium formate and thallium malonate werefound in the early 1900s by Clerici to provide liquids having specificgravities between 4.0 and 5.0. For the characterization of the heavycomponents of mineral sand deposits (e.g. anatase RD 3.9, rutile RD4.2, ilmenite RD 4.4–4.7 and zircon RD 4.6–4.8) there is currently noheavy liquid alternative to Clerici’s solution. Clerici’s solution ishighly toxic and testing is now conducted by few laboratoriesworldwide, with costs reflecting the chemical costs, infrastructurecosts and health and safety regimes (e.g. blood testing of exposedstaff). A simple laboratory technique of density fractionation hasbeen developed, employing suspensions of fine tungsten carbideparticles in lithium heteropolytungstates solutions, that can replaceClerici’s solution in the evaluation of fine mineral sands samples(e.g. -250 +150 microns). The developing methodology that canachieve low-cost, low-toxic separations at relative densities above4.0 is outlined and the comparison of results with Clerici’s solutionpresented. In addition, preliminary work on density fractionation ofzircon samples is presented. Zircon fractionation relates to theirinclusion, radionuclide content and metamictization.
* School of Science and Engineering, University ofBallarat, Australia.
† MIRARCO, Laurentian University, Sudbury, Canada.© The Southern African Institute of Mining and
Metallurgy, 2008. SA ISSN 0038–223X/3.00 +0.00. This paper was first published at the SAIMMConference, Heavy Minerals, 10–14 September2007
25The Journal of The Southern African Institute of Mining and Metallurgy VOLUME 108 REFEREED PAPER JANUARY 2008 ▲
SAIMM_Jan_37-45:Template Journal 2/1/08 9:58 AM Page 25
The use of low-toxic heavy suspensions in mineral sands evaluation and zircon
conducted by few laboratories worldwide, reflecting the highchemical and infrastructure costs, as well as the strict healthand safety regimes required (e.g. blood testing of exposedstaff).
Inorganic heavy liquids
Aqueous solutions of sodium metatungstates have certainadvantages over organic liquids, such as being virtually non-volatile and non-toxic, and densities of up to 3.1 can beachieved.
A new heavy liquid, lithium heteropolytungstates (LST),was introduced for industrial use at the beginning of 1996(www.chem.com.au). Specifically developed as a safe andeffective replacement for bromoform and TBE, LST has lowviscosity and high thermal stability with an expectedoperating density of 2.85 g/ml.
These low-toxicity inorganic solutions, based on tungstencompounds, can be utilized at relative densities (RD) up to3.0. However, beyond this value currently only organicliquids can be used.
Heavy suspensions
In order to achieve separation densities above 3.0 heavysuspensions can be used for float/sink separations.
‘Cargille’ liquids, heavy metal particles dispersed inorganic liquids, have been produced with relative densitiesranging up to 7.5 (Browning, 1961). The use of these liquidswas limited to separation of coarser particle sizes, usuallylarger than 0.6 mm, due to the suspension physicalproperties. The heavy metal particles in Cargille liquids settleslowly and form a soft mass at the bottom of the suspension.Before use, the suspension must be stirred to disperse themetal particles uniformly throughout the liquid. Analternative is the use of mercury-bromoform emulsions (afterBurt and Mills, 1984), which have a maximum relativedensity of 7.0, and can be used successfully on particles assmall as 0.1 mm.
Overbeek (1986) has utilized tetrabromoethane (1,1,2,2-tetrabromoethane) with the addition of ferrosilicon in order toobtain relative densities in the range 3.1 to 4.1.
Rhodes, Miles and Hall (1993) have developed atechnique using finely divided ferrosilicon in solutions ofsodium polytungstate (SPT) for high-density separations.The use of heavy suspensions, comprised of lithiumheteropolytungstates (LST) with ferrosilicon, for sink-floatanalysis has been demonstrated by Eroglu and Stallknecht(2000). Both of these studies used relatively coarse mineralparticle sizes (+1 mm).
Mineral sand mineralogy
Mineral sand resources almost always contain more than onevaluable (and relatively heavy) mineral. Titanium mineralsare found with a large range of titanium contents, giving riseto density variation and often subjective mineralogicaldescriptions. Zircon, the other major mineral sands product,provides its own challenges during resource assessment andmetallurgical test work (Gilman and Hugo, 2003). Companiestend to rely on laboratory heavy liquid separation in theevaluation of samples arising from exploration, mining ormetallurgical processes.
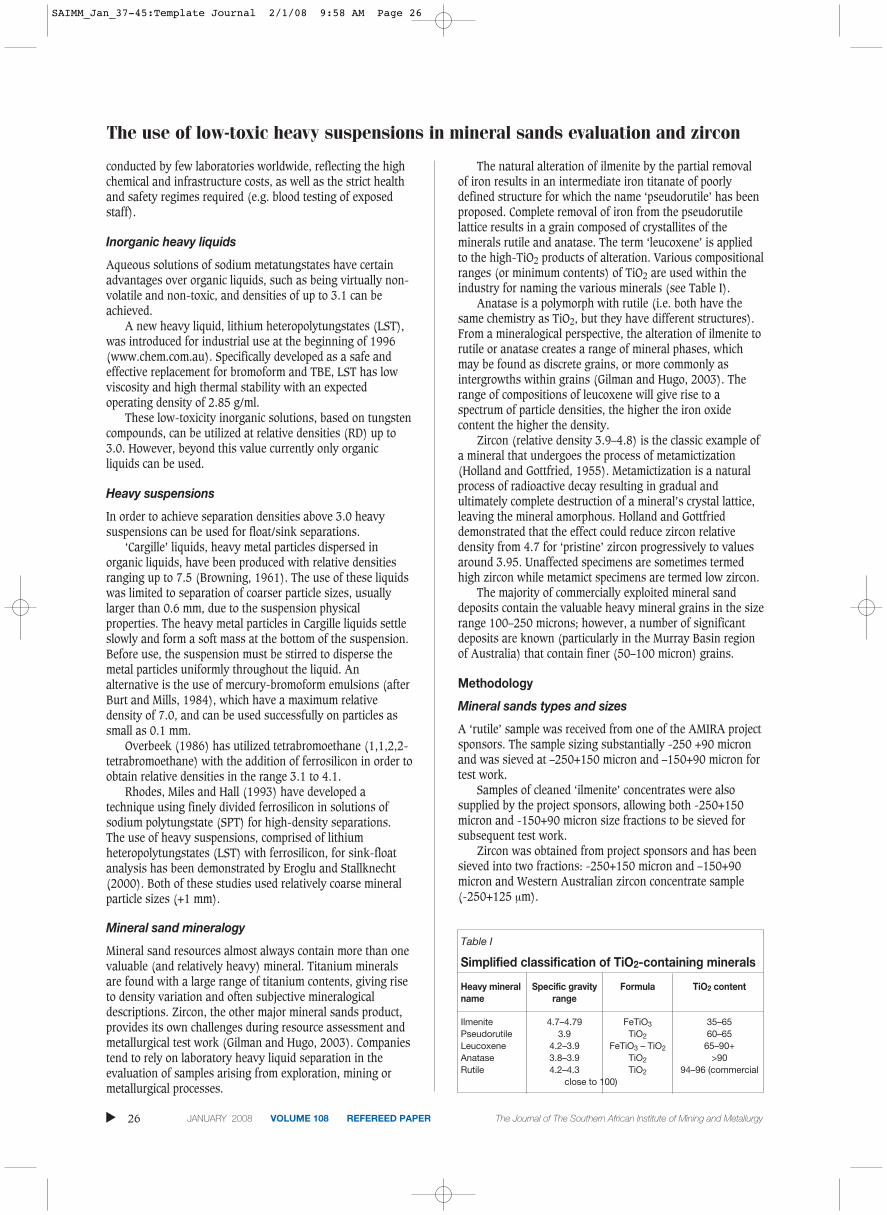
The natural alteration of ilmenite by the partial removalof iron results in an intermediate iron titanate of poorlydefined structure for which the name ‘pseudorutile’ has beenproposed. Complete removal of iron from the pseudorutilelattice results in a grain composed of crystallites of theminerals rutile and anatase. The term ‘leucoxene’ is appliedto the high-TiO2 products of alteration. Various compositionalranges (or minimum contents) of TiO2 are used within theindustry for naming the various minerals (see Table I).
Anatase is a polymorph with rutile (i.e. both have thesame chemistry as TiO2, but they have different structures).From a mineralogical perspective, the alteration of ilmenite torutile or anatase creates a range of mineral phases, whichmay be found as discrete grains, or more commonly asintergrowths within grains (Gilman and Hugo, 2003). Therange of compositions of leucoxene will give rise to aspectrum of particle densities, the higher the iron oxidecontent the higher the density.
Zircon (relative density 3.9–4.8) is the classic example ofa mineral that undergoes the process of metamictization(Holland and Gottfried, 1955). Metamictization is a naturalprocess of radioactive decay resulting in gradual andultimately complete destruction of a mineral’s crystal lattice,leaving the mineral amorphous. Holland and Gottfrieddemonstrated that the effect could reduce zircon relativedensity from 4.7 for ‘pristine’ zircon progressively to valuesaround 3.95. Unaffected specimens are sometimes termedhigh zircon while metamict specimens are termed low zircon.
The majority of commercially exploited mineral sanddeposits contain the valuable heavy mineral grains in the sizerange 100–250 microns; however, a number of significantdeposits are known (particularly in the Murray Basin regionof Australia) that contain finer (50–100 micron) grains.
Methodology
Mineral sands types and sizes
A ‘rutile’ sample was received from one of the AMIRA projectsponsors. The sample sizing substantially -250 +90 micronand was sieved at –250+150 micron and –150+90 micron fortest work.
Samples of cleaned ‘ilmenite’ concentrates were alsosupplied by the project sponsors, allowing both -250+150micron and -150+90 micron size fractions to be sieved forsubsequent test work.
Zircon was obtained from project sponsors and has beensieved into two fractions: -250+150 micron and –150+90micron and Western Australian zircon concentrate sample (-250+125 μm).
▲
26 JANUARY 2008 VOLUME 108 REFEREED PAPER The Journal of The Southern African Institute of Mining and Metallurgy
Table I
Simplified classification of TiO2-containing minerals
Heavy mineral Specific gravity Formula TiO2 contentname range
Ilmenite 4.7–4.79 FeTiO3 35–65Pseudorutile 3.9 TiO2 60–65Leucoxene 4.2–3.9 FeTiO3 – TiO2 65–90+Anatase 3.8–3.9 TiO2 >90Rutile 4.2–4.3 TiO2 94–96 (commercial
close to 100)
SAIMM_Jan_37-45:Template Journal 2/1/08 9:58 AM Page 26
A kyanite sample was received from one of the AMIRAproject sponsors. The sample sizing was substantially in therange -250 +150 micron and was sieved at these sizes fortest work.
Chemicals
Lithium heteropolytungstates (LST) was supplied by CentralChemical Consulting, Perth, Western Australia(www.chem.com.au) with a density 2.85 g/ml and viscosityabout 11 cP. Solutions of a specific density were prepared bydiluting with deionized water or by concentrating byevaporation.
Various tungsten carbide powders were used to generateheavy suspensions; however, the majority of test work wasconducted using a nominal size of 3.3 micron, density 14.85g/cm3 (Table II).
Density measurements
Precise determination of the density of suspension isimportant for accurate sink/float separation. A 50 mlvolumetric flask was used to weigh a known volume of LSTheavy liquid. Density measurements of suspensions werecarried out by weighing a known volume of suspension usinga 1 000 ml cylinder and an FA-2000 electronic balance.Between measurements and tests, the LST and thesuspension samples were covered to prevent evaporation.
Density measurements of mineral sands components andsink/float fractions were determined by using a Pycnometermethod as Australian Standards 1141.6.2 (1996).
Determination of mineralogical composition ofsamples
Float and sink fractions were analysed by optical mineralogyand X-ray diffraction (XRD). Samples were ground in azirconia ring mill for 3 minutes before loading sideways intoXRD cavity mounts. XRD conditions were Siemens D500 X-ray diffractometer, Ni filtered-Cu Kα radiation 40 kV/30 mA,scan rate 1°2θ/min, 0.02° step from 3° to 81°2θ, 1°/1° divand 0.15 mm rec slits. Mineral phases were identified fromthe digitized traces by computer aided search/matches of the2004 ICDD PDF-4 mineral sub-file. Quantitative mineralogyhas been determined using SiroQuantTM version 3 softwarepackage. The results should be considered semi-quantitative.
Float/sink tests with heavy suspensions
Suspensions of tungsten carbide (14.85 relative density) andLST (2.85 relative density) are made up in a 250 ml beaker.A weighed quantity of tungsten carbide is added to therequired volume of LST to obtain the suspension densityrequired in each test condition (refer Table III).
A float/sink test was carried out on a 6 g mineral samplewith size fraction –250+150 μm or –150+90 μm using180–230 ml suspensions of LST and tungsten carbide ofprogressively increasing density (SG 3.45, 3.55, 3.65, 3.75,3.85, 3.95, 4.05, 4.15, 4.25, 4.35, 4.45, 4.55 and 4.65). Thefloat and sink fraction of the mineral sand in eachsuspension was collected, washed with deionized water (250ml) and oven dried to constant weight (at 105°C) beforebeing weighed. This procedure was repeated on a new 6 gsample.
The suspension is agitated for a period of 2 minutes tothoroughly wet and disperse the tungsten carbide particles.The mineral sample to be tested is then added to the beakerand intensely stirred (500 rpm) for 2 minutes.
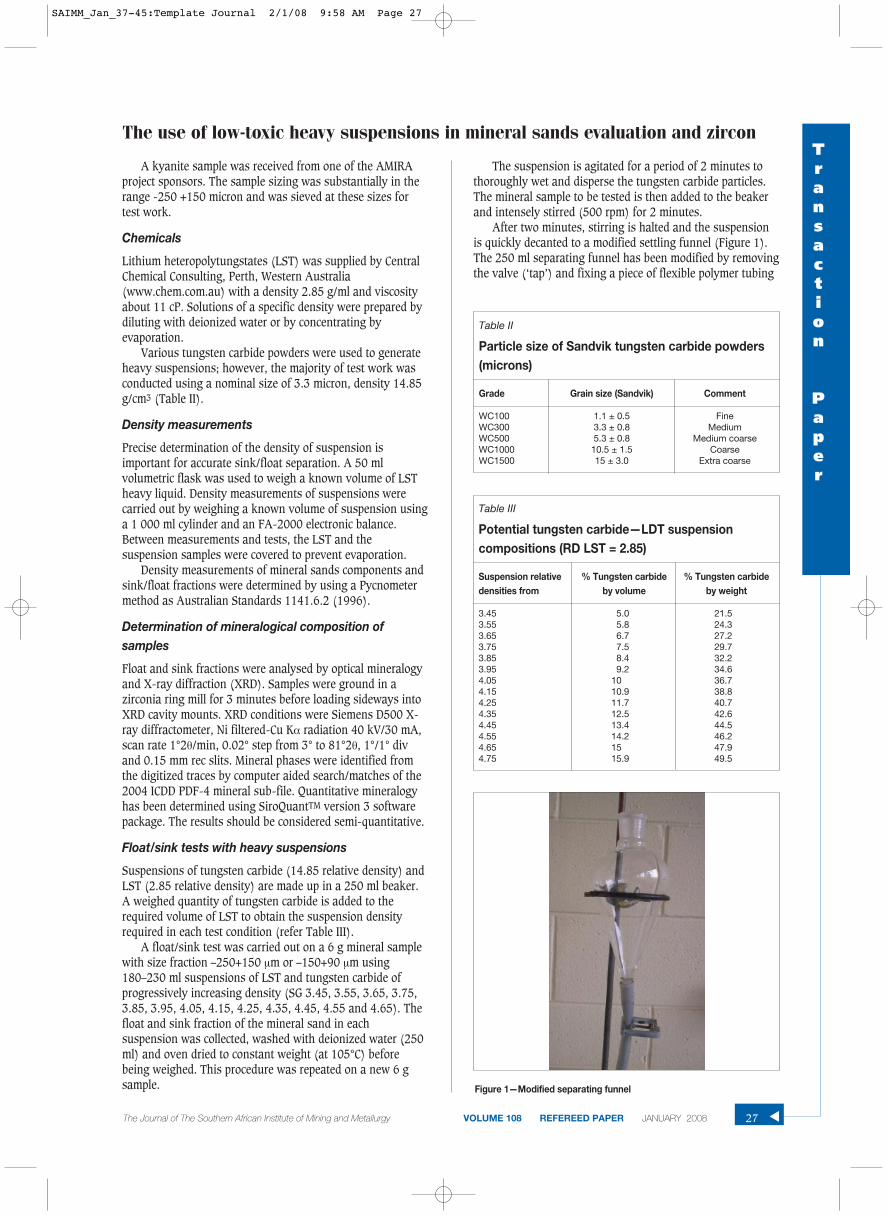
After two minutes, stirring is halted and the suspensionis quickly decanted to a modified settling funnel (Figure 1).The 250 ml separating funnel has been modified by removingthe valve (‘tap’) and fixing a piece of flexible polymer tubing
The use of low-toxic heavy suspensions in mineral sands evaluation and zirconTransaction
Paper
27The Journal of The Southern African Institute of Mining and Metallurgy VOLUME 108 REFEREED PAPER JANUARY 2008 ▲
Table II
Particle size of Sandvik tungsten carbide powders(microns)
Grade Grain size (Sandvik) Comment
WC100 1.1 ± 0.5 FineWC300 3.3 ± 0.8 MediumWC500 5.3 ± 0.8 Medium coarseWC1000 10.5 ± 1.5 CoarseWC1500 15 ± 3.0 Extra coarse
Table III
Potential tungsten carbide—LDT suspensioncompositions (RD LST = 2.85)
Suspension relative % Tungsten carbide % Tungsten carbidedensities from by volume by weight
3.45 5.0 21.53.55 5.8 24.33.65 6.7 27.23.75 7.5 29.73.85 8.4 32.23.95 9.2 34.64.05 10 36.74.15 10.9 38.84.25 11.7 40.74.35 12.5 42.64.45 13.4 44.54.55 14.2 46.24.65 15 47.94.75 15.9 49.5
Figure 1—Modified separating funnel
SAIMM_Jan_37-45:Template Journal 2/1/08 9:58 AM Page 27
The use of low-toxic heavy suspensions in mineral sands evaluation and zircon
to the base of the separating funnel. The polymer tubing issealed with a pinch clip, which is opened to release the sinksfraction at completion of each experiment. In most experi-mentation a ‘separation time’—the time for ‘sinks’ and‘floats’ fractions to separate—of 10 minutes is used. It shouldbe noted that during this time the tungsten carbide alsosettles in the LST, creating a higher density of separationthan that of the initial suspension. A small depth (2–3 mm)of clear LST is typically observed on top of the suspension.The dark opaque suspension makes it difficult to observe thefloat or sink fractions of the mineral samples.
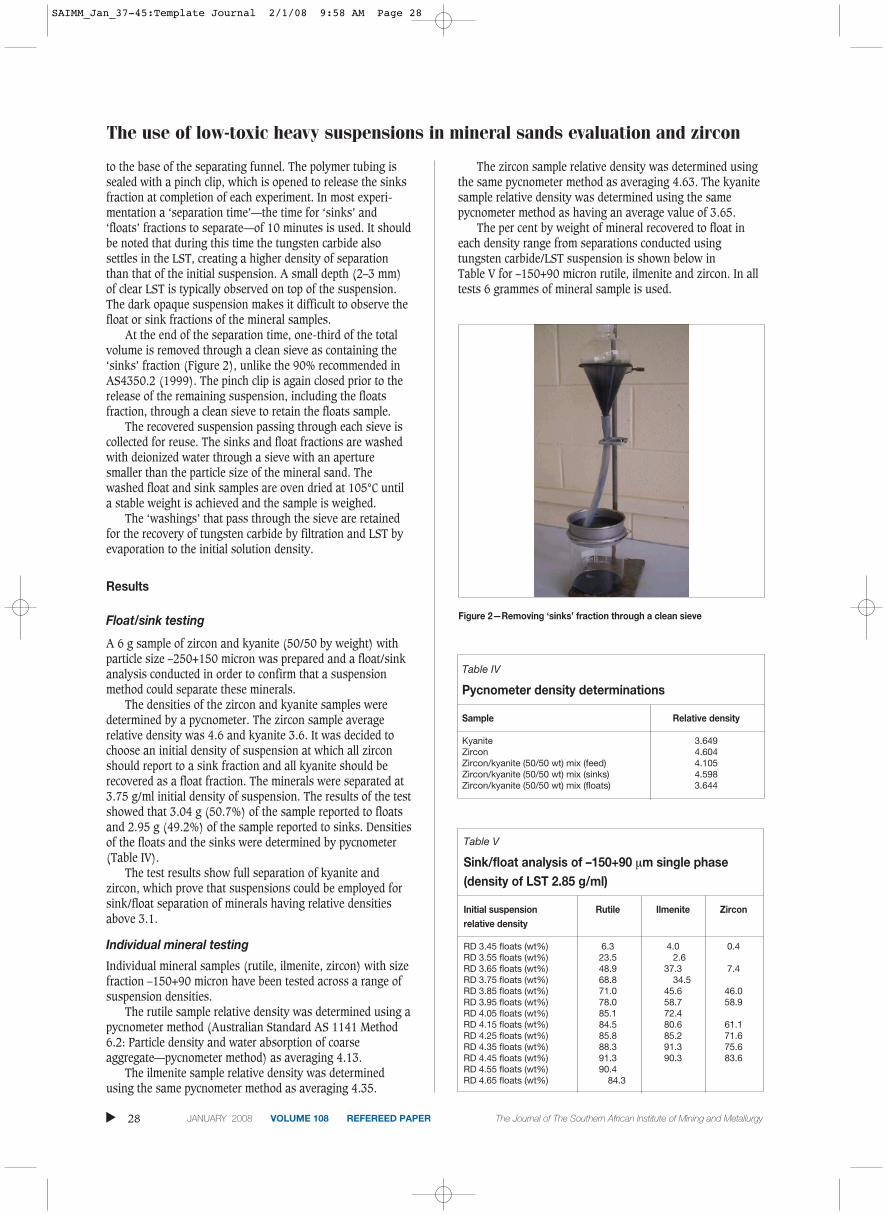
At the end of the separation time, one-third of the totalvolume is removed through a clean sieve as containing the‘sinks’ fraction (Figure 2), unlike the 90% recommended inAS4350.2 (1999). The pinch clip is again closed prior to therelease of the remaining suspension, including the floatsfraction, through a clean sieve to retain the floats sample.
The recovered suspension passing through each sieve iscollected for reuse. The sinks and float fractions are washedwith deionized water through a sieve with an aperturesmaller than the particle size of the mineral sand. Thewashed float and sink samples are oven dried at 105°C untila stable weight is achieved and the sample is weighed.
The ‘washings’ that pass through the sieve are retainedfor the recovery of tungsten carbide by filtration and LST byevaporation to the initial solution density.
Results
Float/sink testing
A 6 g sample of zircon and kyanite (50/50 by weight) withparticle size –250+150 micron was prepared and a float/sinkanalysis conducted in order to confirm that a suspensionmethod could separate these minerals.
The densities of the zircon and kyanite samples weredetermined by a pycnometer. The zircon sample averagerelative density was 4.6 and kyanite 3.6. It was decided tochoose an initial density of suspension at which all zirconshould report to a sink fraction and all kyanite should berecovered as a float fraction. The minerals were separated at3.75 g/ml initial density of suspension. The results of the testshowed that 3.04 g (50.7%) of the sample reported to floatsand 2.95 g (49.2%) of the sample reported to sinks. Densitiesof the floats and the sinks were determined by pycnometer(Table IV).
The test results show full separation of kyanite andzircon, which prove that suspensions could be employed forsink/float separation of minerals having relative densitiesabove 3.1.
Individual mineral testing
Individual mineral samples (rutile, ilmenite, zircon) with sizefraction –150+90 micron have been tested across a range ofsuspension densities.
The rutile sample relative density was determined using apycnometer method (Australian Standard AS 1141 Method6.2: Particle density and water absorption of coarseaggregate—pycnometer method) as averaging 4.13.
The ilmenite sample relative density was determinedusing the same pycnometer method as averaging 4.35.
The zircon sample relative density was determined usingthe same pycnometer method as averaging 4.63. The kyanitesample relative density was determined using the samepycnometer method as having an average value of 3.65.
The per cent by weight of mineral recovered to float ineach density range from separations conducted usingtungsten carbide/LST suspension is shown below in Table V for –150+90 micron rutile, ilmenite and zircon. In alltests 6 grammes of mineral sample is used.
▲
28 JANUARY 2008 VOLUME 108 REFEREED PAPER The Journal of The Southern African Institute of Mining and Metallurgy
Figure 2—Removing ‘sinks’ fraction through a clean sieve
Table IV
Pycnometer density determinations
Sample Relative density
Kyanite 3.649Zircon 4.604Zircon/kyanite (50/50 wt) mix (feed) 4.105Zircon/kyanite (50/50 wt) mix (sinks) 4.598Zircon/kyanite (50/50 wt) mix (floats) 3.644
Table V
Sink/float analysis of –150+90 μm single phase(density of LST 2.85 g/ml)
Initial suspension Rutile Ilmenite Zirconrelative density
RD 3.45 floats (wt%) 6.3 4.0 0.4RD 3.55 floats (wt%) 23.5 2.6RD 3.65 floats (wt%) 48.9 37.3 7.4RD 3.75 floats (wt%) 68.8 34.5RD 3.85 floats (wt%) 71.0 45.6 46.0RD 3.95 floats (wt%) 78.0 58.7 58.9RD 4.05 floats (wt%) 85.1 72.4RD 4.15 floats (wt%) 84.5 80.6 61.1RD 4.25 floats (wt%) 85.8 85.2 71.6RD 4.35 floats (wt%) 88.3 91.3 75.6RD 4.45 floats (wt%) 91.3 90.3 83.6RD 4.55 floats (wt%) 90.4RD 4.65 floats (wt%) 84.3
SAIMM_Jan_37-45:Template Journal 2/1/08 9:58 AM Page 28
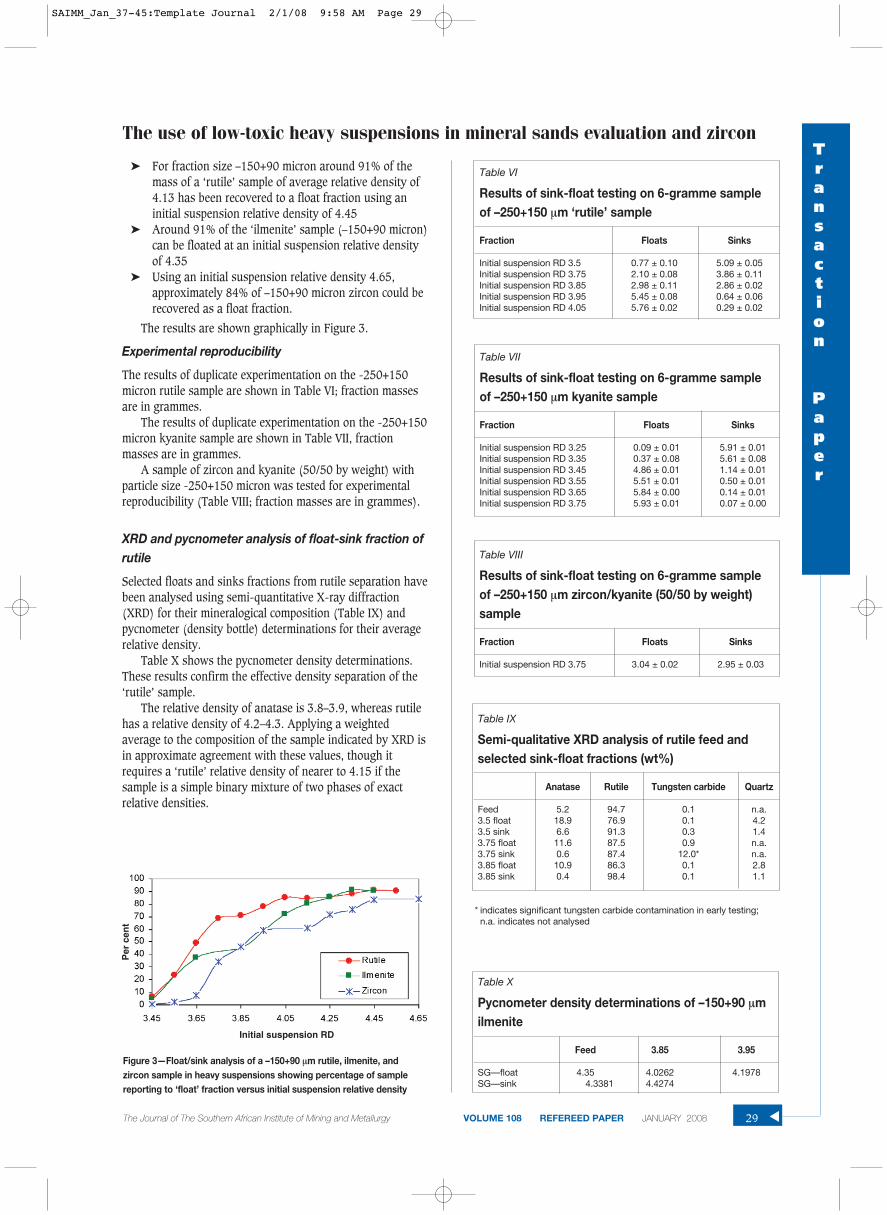
➤ For fraction size –150+90 micron around 91% of themass of a ‘rutile’ sample of average relative density of4.13 has been recovered to a float fraction using aninitial suspension relative density of 4.45
➤ Around 91% of the ‘ilmenite’ sample (–150+90 micron)can be floated at an initial suspension relative densityof 4.35
➤ Using an initial suspension relative density 4.65,approximately 84% of –150+90 micron zircon could berecovered as a float fraction.
The results are shown graphically in Figure 3.
Experimental reproducibility
The results of duplicate experimentation on the -250+150micron rutile sample are shown in Table VI; fraction massesare in grammes.
The results of duplicate experimentation on the -250+150micron kyanite sample are shown in Table VII, fractionmasses are in grammes.
A sample of zircon and kyanite (50/50 by weight) withparticle size -250+150 micron was tested for experimentalreproducibility (Table VIII; fraction masses are in grammes).
XRD and pycnometer analysis of float-sink fraction ofrutile
Selected floats and sinks fractions from rutile separation havebeen analysed using semi-quantitative X-ray diffraction(XRD) for their mineralogical composition (Table IX) andpycnometer (density bottle) determinations for their averagerelative density.
Table X shows the pycnometer density determinations.These results confirm the effective density separation of the‘rutile’ sample.
The relative density of anatase is 3.8–3.9, whereas rutilehas a relative density of 4.2–4.3. Applying a weightedaverage to the composition of the sample indicated by XRD isin approximate agreement with these values, though itrequires a ‘rutile’ relative density of nearer to 4.15 if thesample is a simple binary mixture of two phases of exactrelative densities.
The use of low-toxic heavy suspensions in mineral sands evaluation and zirconTransaction
Paper
The Journal of The Southern African Institute of Mining and Metallurgy VOLUME 108 REFEREED PAPER JANUARY 2008 29 ▲
Figure 3—Float/sink analysis of a –150+90 μm rutile, ilmenite, andzircon sample in heavy suspensions showing percentage of samplereporting to ‘float’ fraction versus initial suspension relative density
Initial suspension RD
Per
cen
t
Table VI
Results of sink-float testing on 6-gramme sample of –250+150 μm ‘rutile’ sample
Fraction Floats Sinks
Initial suspension RD 3.5 0.77 ± 0.10 5.09 ± 0.05Initial suspension RD 3.75 2.10 ± 0.08 3.86 ± 0.11Initial suspension RD 3.85 2.98 ± 0.11 2.86 ± 0.02Initial suspension RD 3.95 5.45 ± 0.08 0.64 ± 0.06Initial suspension RD 4.05 5.76 ± 0.02 0.29 ± 0.02
Table VII
Results of sink-float testing on 6-gramme sample of –250+150 μm kyanite sample
Fraction Floats Sinks
Initial suspension RD 3.25 0.09 ± 0.01 5.91 ± 0.01Initial suspension RD 3.35 0.37 ± 0.08 5.61 ± 0.08Initial suspension RD 3.45 4.86 ± 0.01 1.14 ± 0.01Initial suspension RD 3.55 5.51 ± 0.01 0.50 ± 0.01Initial suspension RD 3.65 5.84 ± 0.00 0.14 ± 0.01Initial suspension RD 3.75 5.93 ± 0.01 0.07 ± 0.00
Table VIII
Results of sink-float testing on 6-gramme sample of –250+150 μm zircon/kyanite (50/50 by weight)sample
Fraction Floats Sinks
Initial suspension RD 3.75 3.04 ± 0.02 2.95 ± 0.03
Table IX
Semi-qualitative XRD analysis of rutile feed andselected sink-float fractions (wt%)
Anatase Rutile Tungsten carbide Quartz
Feed 5.2 94.7 0.1 n.a.3.5 float 18.9 76.9 0.1 4.23.5 sink 6.6 91.3 0.3 1.43.75 float 11.6 87.5 0.9 n.a.3.75 sink 0.6 87.4 12.0* n.a.3.85 float 10.9 86.3 0.1 2.83.85 sink 0.4 98.4 0.1 1.1
* indicates significant tungsten carbide contamination in early testing;n.a. indicates not analysed
Table X
Pycnometer density determinations of –150+90 μmilmenite
Feed 3.85 3.95
SG—float 4.35 4.0262 4.1978SG—sink 4.3381 4.4274
SAIMM_Jan_37-45:Template Journal 2/1/08 9:58 AM Page 29
The use of low-toxic heavy suspensions in mineral sands evaluation and zircon
XRD and optical microscopic analysis of float-sinkfraction of ilmenite
The ilmenite density fractions differ slightly in colour andgive dramatically different XRD traces, indicative of low-Tiand high-Ti mineral compositions.
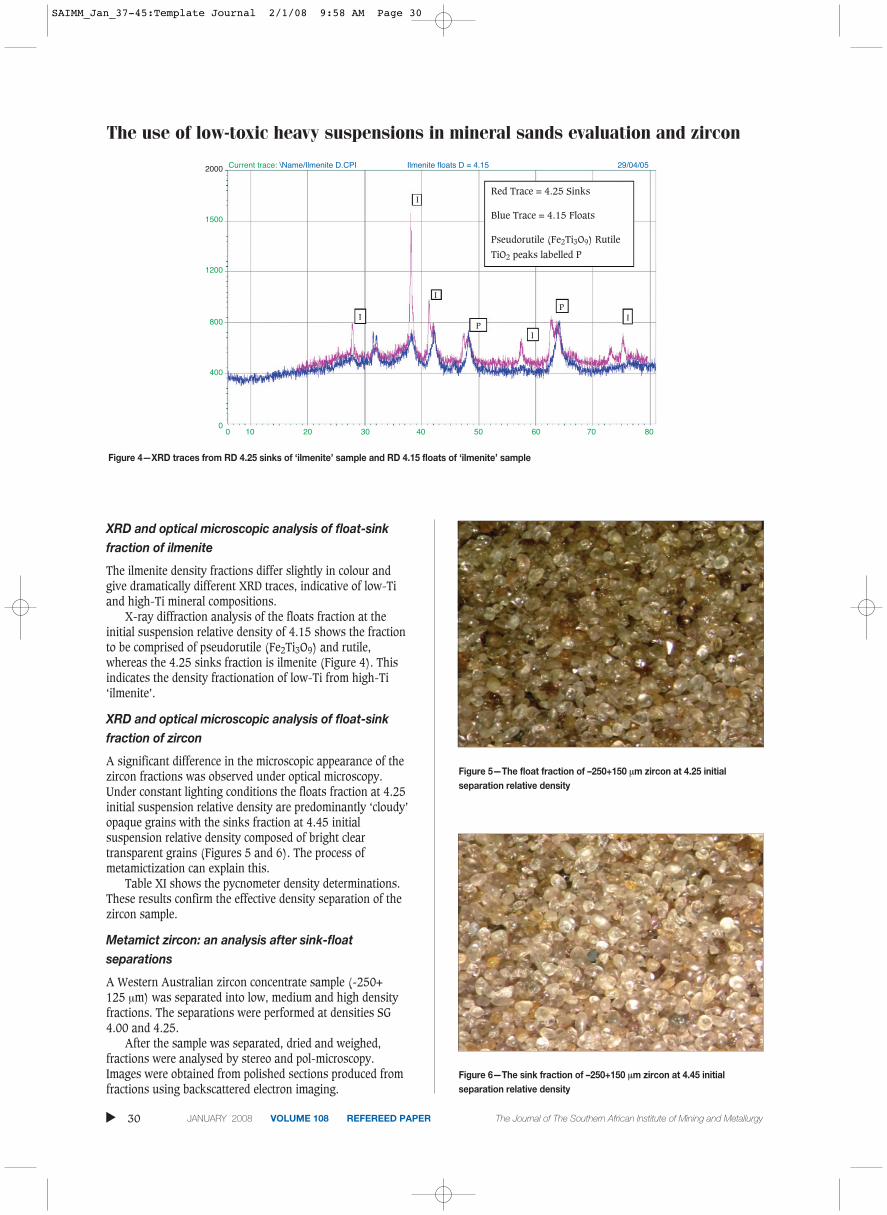
X-ray diffraction analysis of the floats fraction at theinitial suspension relative density of 4.15 shows the fractionto be comprised of pseudorutile (Fe2Ti3O9) and rutile,whereas the 4.25 sinks fraction is ilmenite (Figure 4). Thisindicates the density fractionation of low-Ti from high-Ti‘ilmenite’.
XRD and optical microscopic analysis of float-sinkfraction of zircon
A significant difference in the microscopic appearance of thezircon fractions was observed under optical microscopy.Under constant lighting conditions the floats fraction at 4.25initial suspension relative density are predominantly ‘cloudy’opaque grains with the sinks fraction at 4.45 initialsuspension relative density composed of bright cleartransparent grains (Figures 5 and 6). The process ofmetamictization can explain this.
Table XI shows the pycnometer density determinations.These results confirm the effective density separation of thezircon sample.
Metamict zircon: an analysis after sink-floatseparations
A Western Australian zircon concentrate sample (-250+125 μm) was separated into low, medium and high densityfractions. The separations were performed at densities SG4.00 and 4.25.
After the sample was separated, dried and weighed,fractions were analysed by stereo and pol-microscopy.Images were obtained from polished sections produced fromfractions using backscattered electron imaging.
▲
30 JANUARY 2008 VOLUME 108 REFEREED PAPER The Journal of The Southern African Institute of Mining and Metallurgy
Figure 4—XRD traces from RD 4.25 sinks of ‘ilmenite’ sample and RD 4.15 floats of ‘ilmenite’ sample
0 10 20 30 40 50 60 70 80
Current trace: \Name/Ilmenite D.CPI Ilmenite floats D = 4.15 29/04/05
I
I
I
I
I
Red Trace = 4.25 Sinks
Blue Trace = 4.15 Floats
Pseudorutile (Fe2Ti3O9) Rutile
TiO2 peaks labelled P
P
P
2000
1500
1200
800
400
0
Figure 5—The float fraction of –250+150 μm zircon at 4.25 initialseparation relative density
Figure 6—The sink fraction of –250+150 μm zircon at 4.45 initialseparation relative density
SAIMM_Jan_37-45:Template Journal 2/1/08 9:58 AM Page 30

The procedure for fractionation is shown in Figure 7.
Stereo-microscopic images
As the zircon density increases after the sink-floatseparations it can be seen from the stereo-microscopic images(Figures 8–11) that the grains become clearer and moretransparent.
Holland and Gottfried (1955) demonstrated that the SG ofzircon decreases with increased metamictization. Therefore itis suggested that this zircon sample has undergone moreradioactive decay because of either the age of the sample, orbecause; it contains more actinides than the other zirconsamples tested, which have resulted in significant alterationof its crystal lattice and therefore decreased its density.
Pol-microscopic images
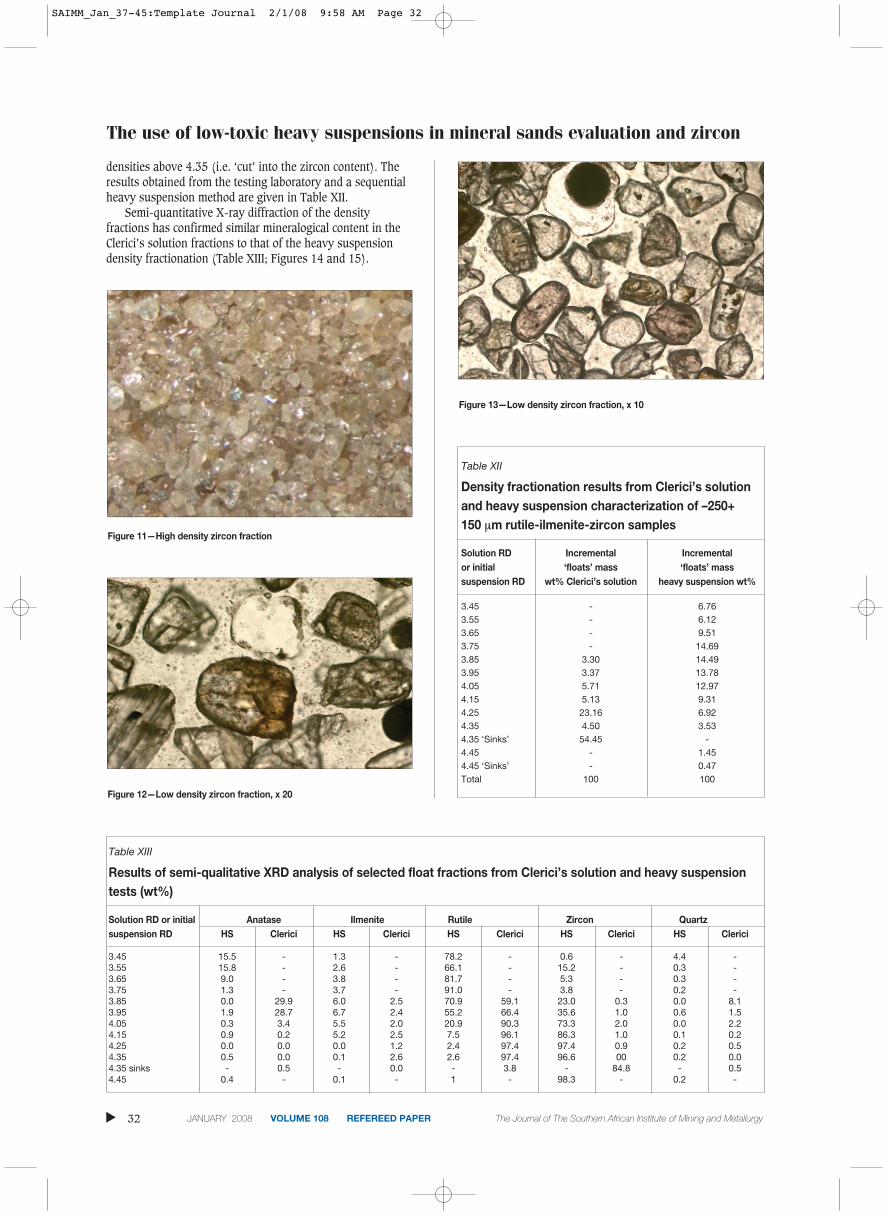
The grains from this Western Australian zircon product tendto be fractured and many grains in the low density fractionshow an orange/brown coloration due to inclusions (Figures12 and 13) while some grains display a pink hue.
Results of comparison of composite samplesequential suspension testing with Clerici’s solution
A 90-gramme sample of –250 +150 micron rutile-ilmenite-zircon (33% of each) was prepared and sent to a commercialtesting laboratory in order to compare heavy suspensionperformance against Clerici’s solution. The laboratory
conducted float/sink tests with the sample over 6 relativedensities at 0.1 increments of Clerici’s solution between 3.85and 4.35. The 4.35 RD solution is the limit of commerciallyavailable testing via this laboratory.
Similar mass fractionation to that achieved in thecommercial laboratory was obtained utilizing the heavysuspension methodology. An additional benefit of thismethodology was being able to fractionate at relative
The use of low-toxic heavy suspensions in mineral sands evaluation and zirconTransaction
Paper
The Journal of The Southern African Institute of Mining and Metallurgy VOLUME 108 REFEREED PAPER JANUARY 2008 31 ▲
Figure 8—Western Australian zircon concentrate
Figure 9—Low density zircon fraction
Figure 10—Medium density zircon fraction
Table XI
Pycnometer density determinations of –150+90 μmzircon
Feed 3.85 3.95
SG—float 4.5962 4.5838 4.5882SG—sink 4.6547 4.6617
Figure 7—Diagram of the Western Australian zircon concentrateseparation
20.0g start
10.31gLow density
fraction
6.59gMedium density
fraction
2.99gHigh density
fraction
9.53g
Floats
Floats
Sinks
Sinks
ρ 4.00
ρ 4.25
SAIMM_Jan_37-45:Template Journal 2/1/08 9:58 AM Page 31
The use of low-toxic heavy suspensions in mineral sands evaluation and zircon
densities above 4.35 (i.e. ‘cut’ into the zircon content). Theresults obtained from the testing laboratory and a sequentialheavy suspension method are given in Table XII.
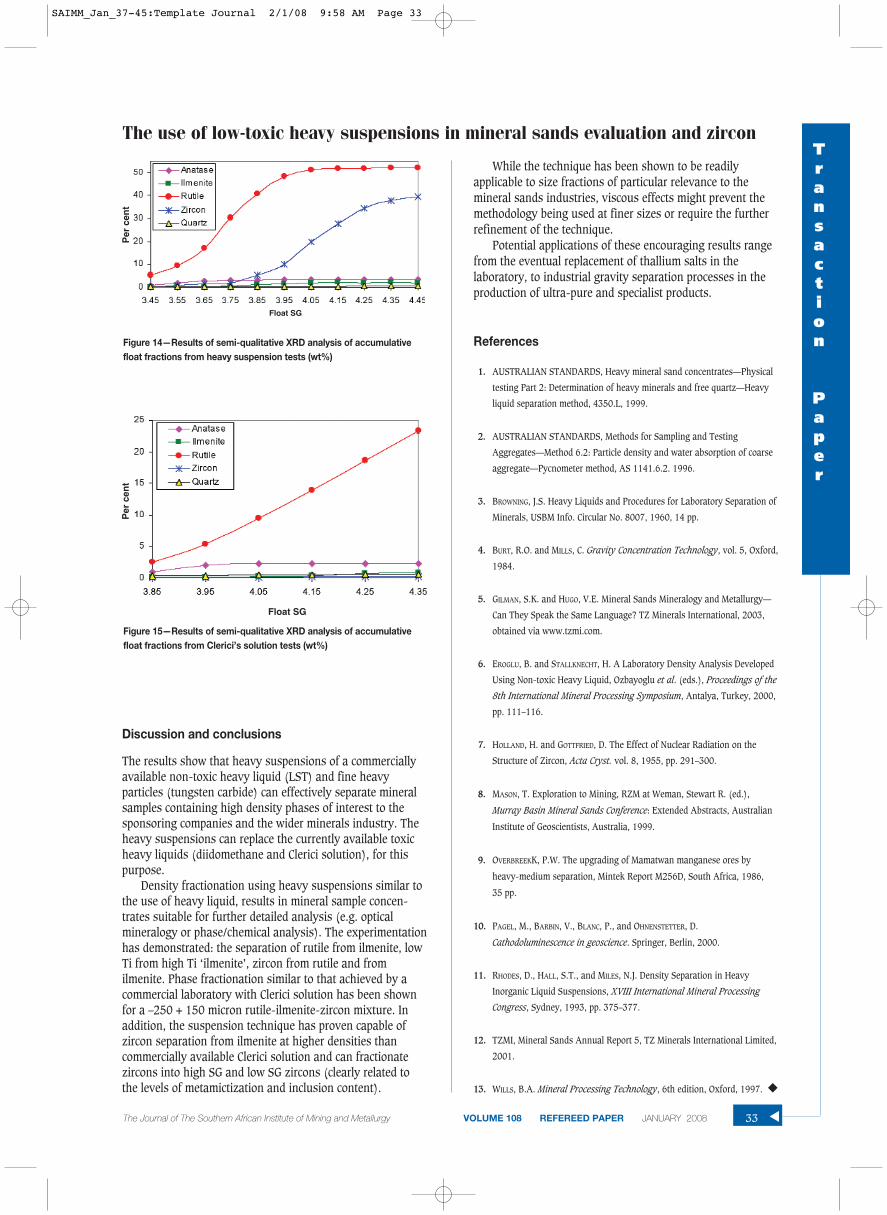
Semi-quantitative X-ray diffraction of the densityfractions has confirmed similar mineralogical content in theClerici’s solution fractions to that of the heavy suspensiondensity fractionation (Table XIII; Figures 14 and 15).
▲
32 JANUARY 2008 VOLUME 108 REFEREED PAPER The Journal of The Southern African Institute of Mining and Metallurgy
Figure 11—High density zircon fraction
Figure 12—Low density zircon fraction, x 20
Figure 13—Low density zircon fraction, x 10
Table XII
Density fractionation results from Clerici’s solutionand heavy suspension characterization of –250+150 μm rutile-ilmenite-zircon samples
Solution RD Incremental Incremental or initial ‘floats’ mass ‘floats’ masssuspension RD wt% Clerici’s solution heavy suspension wt%
3.45 - 6.763.55 - 6.123.65 - 9.513.75 - 14.693.85 3.30 14.493.95 3.37 13.784.05 5.71 12.974.15 5.13 9.314.25 23.16 6.924.35 4.50 3.534.35 ‘Sinks’ 54.45 -4.45 - 1.454.45 ‘Sinks’ - 0.47Total 100 100
Table XIII
Results of semi-qualitative XRD analysis of selected float fractions from Clerici’s solution and heavy suspensiontests (wt%)
Solution RD or initial Anatase Ilmenite Rutile Zircon Quartzsuspension RD HS Clerici HS Clerici HS Clerici HS Clerici HS Clerici
3.45 15.5 - 1.3 - 78.2 - 0.6 - 4.4 -3.55 15.8 - 2.6 - 66.1 - 15.2 - 0.3 -3.65 9.0 - 3.8 - 81.7 - 5.3 - 0.3 -3.75 1.3 - 3.7 - 91.0 - 3.8 - 0.2 -3.85 0.0 29.9 6.0 2.5 70.9 59.1 23.0 0.3 0.0 8.13.95 1.9 28.7 6.7 2.4 55.2 66.4 35.6 1.0 0.6 1.54.05 0.3 3.4 5.5 2.0 20.9 90.3 73.3 2.0 0.0 2.24.15 0.9 0.2 5.2 2.5 7.5 96.1 86.3 1.0 0.1 0.24.25 0.0 0.0 0.0 1.2 2.4 97.4 97.4 0.9 0.2 0.54.35 0.5 0.0 0.1 2.6 2.6 97.4 96.6 00 0.2 0.04.35 sinks - 0.5 - 0.0 - 3.8 - 84.8 - 0.54.45 0.4 - 0.1 - 1 - 98.3 - 0.2 -
SAIMM_Jan_37-45:Template Journal 2/1/08 9:58 AM Page 32
Discussion and conclusions
The results show that heavy suspensions of a commerciallyavailable non-toxic heavy liquid (LST) and fine heavyparticles (tungsten carbide) can effectively separate mineralsamples containing high density phases of interest to thesponsoring companies and the wider minerals industry. Theheavy suspensions can replace the currently available toxicheavy liquids (diidomethane and Clerici solution), for thispurpose.
Density fractionation using heavy suspensions similar tothe use of heavy liquid, results in mineral sample concen-trates suitable for further detailed analysis (e.g. opticalmineralogy or phase/chemical analysis). The experimentationhas demonstrated: the separation of rutile from ilmenite, lowTi from high Ti ‘ilmenite’, zircon from rutile and fromilmenite. Phase fractionation similar to that achieved by acommercial laboratory with Clerici solution has been shownfor a –250 + 150 micron rutile-ilmenite-zircon mixture. Inaddition, the suspension technique has proven capable ofzircon separation from ilmenite at higher densities thancommercially available Clerici solution and can fractionatezircons into high SG and low SG zircons (clearly related tothe levels of metamictization and inclusion content).
While the technique has been shown to be readilyapplicable to size fractions of particular relevance to themineral sands industries, viscous effects might prevent themethodology being used at finer sizes or require the furtherrefinement of the technique.
Potential applications of these encouraging results rangefrom the eventual replacement of thallium salts in thelaboratory, to industrial gravity separation processes in theproduction of ultra-pure and specialist products.
References
1. AUSTRALIAN STANDARDS, Heavy mineral sand concentrates—Physical
testing Part 2: Determination of heavy minerals and free quartz—Heavy
liquid separation method, 4350.L, 1999.
2. AUSTRALIAN STANDARDS, Methods for Sampling and Testing
Aggregates—Method 6.2: Particle density and water absorption of coarse
aggregate—Pycnometer method, AS 1141.6.2. 1996.
3. BROWNING, J.S. Heavy Liquids and Procedures for Laboratory Separation of
Minerals, USBM Info. Circular No. 8007, 1960, 14 pp.
4. BURT, R.O. and MILLS, C. Gravity Concentration Technology, vol. 5, Oxford,
1984.
5. GILMAN, S.K. and HUGO, V.E. Mineral Sands Mineralogy and Metallurgy—
Can They Speak the Same Language? TZ Minerals International, 2003,
obtained via www.tzmi.com.
6. EROGLU, B. and STALLKNECHT, H. A Laboratory Density Analysis Developed
Using Non-toxic Heavy Liquid, Ozbayoglu et al. (eds.), Proceedings of the
8th International Mineral Processing Symposium, Antalya, Turkey, 2000,
pp. 111–116.
7. HOLLAND, H. and GOTTFRIED, D. The Effect of Nuclear Radiation on the
Structure of Zircon, Acta Cryst. vol. 8, 1955, pp. 291–300.
8. MASON, T. Exploration to Mining, RZM at Weman, Stewart R. (ed.),
Murray Basin Mineral Sands Conference: Extended Abstracts, Australian
Institute of Geoscientists, Australia, 1999.
9. OVERBREEKK, P.W. The upgrading of Mamatwan manganese ores by
heavy-medium separation, Mintek Report M256D, South Africa, 1986,
35 pp.
10. PAGEL, M., BARBIN, V., BLANC, P., and OHNENSTETTER, D.
Cathodoluminescence in geoscience. Springer, Berlin, 2000.
11. RHODES, D., HALL, S.T., and MILES, N.J. Density Separation in Heavy
Inorganic Liquid Suspensions, XVIII International Mineral Processing
Congress, Sydney, 1993, pp. 375–377.
12. TZMI, Mineral Sands Annual Report 5, TZ Minerals International Limited,
2001.
13. WILLS, B.A. Mineral Processing Technology, 6th edition, Oxford, 1997. ◆
The use of low-toxic heavy suspensions in mineral sands evaluation and zirconTransaction
Paper
The Journal of The Southern African Institute of Mining and Metallurgy VOLUME 108 REFEREED PAPER JANUARY 2008 33 ▲
Figure 14—Results of semi-qualitative XRD analysis of accumulativefloat fractions from heavy suspension tests (wt%)
Float SG
Per
cen
t
Figure 15—Results of semi-qualitative XRD analysis of accumulativefloat fractions from Clerici’s solution tests (wt%)
Per
cen
t
Float SG
SAIMM_Jan_37-45:Template Journal 2/1/08 9:58 AM Page 33