Embed Size (px)
DESCRIPTION
power cable life cycle cost analysis
Citation preview
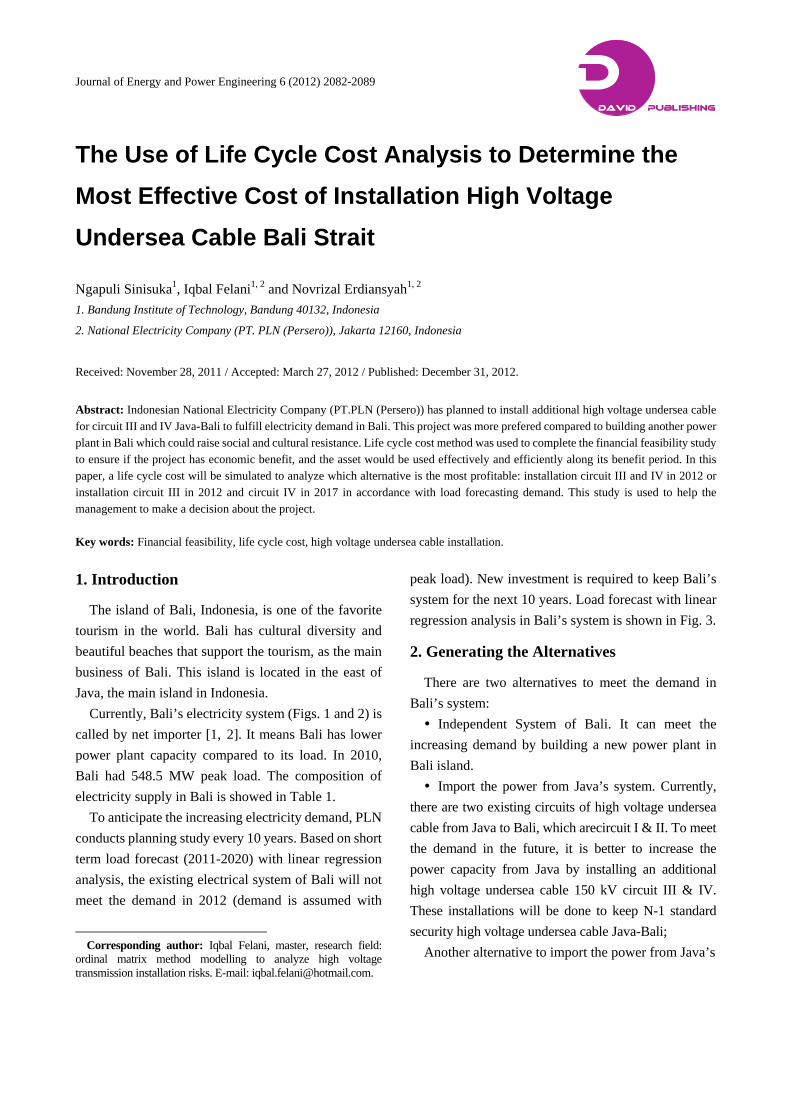
Journal of Energy and Power Engineering 6 (2012) 2082-2089
The Use of Life Cycle Cost Analysis to Determine the
Most Effective Cost of Installation High Voltage
Undersea Cable Bali Strait
Ngapuli Sinisuka1, Iqbal Felani1, 2 and Novrizal Erdiansyah1, 2
1. Bandung Institute of Technology, Bandung 40132, Indonesia
2. National Electricity Company (PT. PLN (Persero)), Jakarta 12160, Indonesia
Received: November 28, 2011 / Accepted: March 27, 2012 / Published: December 31, 2012.
Abstract: Indonesian National Electricity Company (PT.PLN (Persero)) has planned to install additional high voltage undersea cable for circuit III and IV Java-Bali to fulfill electricity demand in Bali. This project was more prefered compared to building another power plant in Bali which could raise social and cultural resistance. Life cycle cost method was used to complete the financial feasibility study to ensure if the project has economic benefit, and the asset would be used effectively and efficiently along its benefit period. In this paper, a life cycle cost will be simulated to analyze which alternative is the most profitable: installation circuit III and IV in 2012 or installation circuit III in 2012 and circuit IV in 2017 in accordance with load forecasting demand. This study is used to help the management to make a decision about the project. Key words: Financial feasibility, life cycle cost, high voltage undersea cable installation.
1. Introduction
The island of Bali, Indonesia, is one of the favorite
tourism in the world. Bali has cultural diversity and
beautiful beaches that support the tourism, as the main
business of Bali. This island is located in the east of
Java, the main island in Indonesia.
Currently, Bali’s electricity system (Figs. 1 and 2) is
called by net importer [1, 2]. It means Bali has lower
power plant capacity compared to its load. In 2010,
Bali had 548.5 MW peak load. The composition of
electricity supply in Bali is showed in Table 1.
To anticipate the increasing electricity demand, PLN
conducts planning study every 10 years. Based on short
term load forecast (2011-2020) with linear regression
analysis, the existing electrical system of Bali will not
meet the demand in 2012 (demand is assumed with
Corresponding author: Iqbal Felani, master, research field:
ordinal matrix method modelling to analyze high voltage transmission installation risks. E-mail: [email protected].
peak load). New investment is required to keep Bali’s
system for the next 10 years. Load forecast with linear
regression analysis in Bali’s system is shown in Fig. 3.
2. Generating the Alternatives
There are two alternatives to meet the demand in
Bali’s system:
Independent System of Bali. It can meet the
increasing demand by building a new power plant in
Bali island.
Import the power from Java’s system. Currently,
there are two existing circuits of high voltage undersea
cable from Java to Bali, which arecircuit I & II. To meet
the demand in the future, it is better to increase the
power capacity from Java by installing an additional
high voltage undersea cable 150 kV circuit III & IV.
These installations will be done to keep N-1 standard
security high voltage undersea cable Java-Bali;
Another alternative to import the power from Java’s
D DAVID PUBLISHING

The Use of Life Cycle Cost Analysis to Determine The Most Effective Cost of Installation High Voltage Undersea Cable Bali Strait
2083
Fig. 1 Java Bali Interconnection.
Fig. 2 Single line diagram configuration [1].
Table 1 Existing electricity supply [2, 3].
No. Power supply Capacity (MW)
BPP (IDR/kWh)
1 PLTG + PLTD Pesanggaran 150 1836.13
2 PLTG Pemaron 96 1941.52
3 PLTG Gilimanuk 130 1790.62
4 Undersea cable (circuit 1 & 2) 220 783.00
Total 596
Fig. 3 Load forecasting 2011-2020.
system can be made by Installing the Java-Bali
crossing extra high voltage 500 kV. Balinese is a society with a very strong culture who
deeply respect in their tradition and cultural heritage.
They oppose the building of a new power plant because
of its pollution, noise and also height of the building.
On the other hand, the supply of energy in Bali island
produced by gas and oil. Therefore, the energy cost per
kilo watt hour especially in Bali system became higher
than Java system and is not economically [1]. Because
of this unique social situation in Bali and the high cost
of production, the first alternative, which is
Independent System of Bali is not prioritized.
While installing Java-Bali crossing extra high
voltage 500 kV needs an extra investment and has a
high risk. The most possible alternative to be
implemented is to install an additional high voltage
undersea cable 150 kV circuit III & IV. The advantage
of this installation is especially for not going against
the Balinese society. Moreover, this installation will
also reduce the expensive power plant operating cost,
so the system can be more efficient.
To implement the alternative, more investment is
needed. So feasibility study to determine advantages
and disadvantages of the project is necessary. With this
study the management could determine the most
effective, efficient, and profitable project to choose.
Some alternatives that could affect the profitability of
undersea cable 150 kV circuit III & IV installation are:
Alternative-1, do nothing. This alternative continues
undersea cable circuit I and II operations with existing
220 MW capacity. This alternative do not need the
investment/acquisition cost, so it would save the
budget. However, it would also reduce the potential
revenue because it would not be able to meet the
demand in the future (ENS (energy not served));
Alternative-2, installs undersea cable 150 kV circuit
III & IV step by step in accordance with increasing
demand projection. In Fig. 2, installation of circuit III
could meet Bali’s demand until 2017. So the second
circuit (circuit IV) would only be required to be
installed in 2017 to meet the Bali’s demand until 2020;
Alternative-3, installs undersea cable 150 kV
circuit III & IV simultaneously in 2012. This
alternative will meet the demand of Bali’s system
until 2020. The operation and maintenance cost would
150 MW
Bali System,Peak Load : 500
MW
Circuit I + II220 MW
96 MWFrom Java System
130 MW
GI.PMRON
2x30 MVA
GI.BTRTI
1x16 MVA
GI.PSGRN
2x30MVA3x60MVA
GI.AMPRA
TR 1x20 MVATR 1x30 MVA
GI. NGARA
GI. GLMNK
PLTG GILIMANUK
2x10MVA 2x15MVA
2x20MVA1x30MVA
UP.BALITR 2x30MVATR 2x20MVA
GI. NSDUA
GI.SANUR
GI.GNYAR
1x30MVA
GI. KAPAL
GI. ASARI
1x10MVA1x30 MVA
Undersea CableJawa-Bali2x110MW
GI.PYANG1x30 MVA
GI.PBIAN
1x60 MVA
2x60MVA
PLTG
1x60MVA 1x60 MVA
1x60 MVA
GI.PKLOD
2011 2012 2013 2014 2015 2016 2017 2018 2019 2020
Peak Load 572 594 617 640 662 685 708 730 753 775
Supply Capacity 596 596 596 596 596 596 596 596 596 596
0
100
200
300
400
500
600
700
800
900
MW
Year
Load Forecasting vs Capacity 2011-2020

The Use of Life Cycle Cost Analysis to Determine The Most Effective Cost of Installation High Voltage Undersea Cable Bali Strait
2084
be more expensive than alternative-2. But within
investment context, it could be more economic with
more advantages. By installing two circuits
simultaneously, it will save rock dumping cost (it is
the highest cost in installation project, which is about
60%-70% from the total project cost). This alternative
could also replace the more expensive power plant’s
operational cost.
The recent evolution of monetary crisis has
substantially affect the funding of the private industrial
sector. To Survive in the present condition and have a
fast recovering, it tries to invest in production plant,
with a limited capital and more especially for the
corresponding electrical installation [4].
To determine the best alternative, LCC (life cycle
cost) method can be used (Fig. 4). LCC helps change
provincial perspectives for business issues with
emphasis on enhancing economic competitiveness by
working for the lowest long term cost of ownership [5,
6]. The objective of life cycle cost analysis is to
choose the most cost effective approach from a series
of alternatives to achieve the lowest long-term cost
ownership [5]. In this paper, life cycle cost method
use 10 years for study period (2011-2020).
3. Developing Life Cycle Cost Model
In this project, the cost breakdown structure will
involve costs in these categories [7]: (1) capital or
investment cost; (2) operation and maintenance cost;
and (3) savings (Fig. 5). Capital or investment costs
comprise of four costs, these are: material costs, civil
construction costs, electrical construction costs and
tranportation, survey & comissioning costs. Operation
and maintenance costs comprise of three costs, these
are: scheduled maintenance costs, unscheduled
maintenance costs and ENS (energy not served). While
saving is assumed as operational substitution between
power plant and high voltage undersea cable which has
lower cost of production.
All of the cost details will be converted to a base cost
of today. In other word, life cycle cost methode will
calculate all of the cost detail in present value.
3.1 Capital/Investment
Investment is the initial cost prepared for material
procurement, civil construction, electrical construction
and transportation, survey & comissionong cost. The
detail of the capital cost listed as shown in Table 2.
3.2 Maintenance
There are two maintenances in undersea cable 150
kV installation, these are scheduled and unscheduled
maintenance. Scheduled maintenance is fixed cost that
has an annually flat cost. While unscheduled
maintenance is a variable cost that depends on outage
condition. It is also an unpredictable event that is dificcult
Fig. 4 Life cycle cost model [5].

The Use of Life Cycle Cost Analysis to Determine The Most Effective Cost of Installation High Voltage Undersea Cable Bali Strait
2085
Fig. 5 Cost breakdown structure.
Table 2 Detail capital cost [2].
Detail work Total costs (US$)
Circuit III Circuit III& IV
Material procurement 5,920.014 12,288.727
Udersea cable 150 kV 300 sq.mm. 4,737.720 9,475.440
XLPE cable 150 kV 300 sq.mm. 757.187 1,514.374
Jointing and termination 310.539 1,116.381
Other materials 114.568 182.532
Civil work 28,123.752 46,811.587
Concrete construction 1,332.887 2,119.409
Rock dumping protection construction 26,754.184 44,590.307
Main hole for XLPE 150 kV cable 2.350 9.645
XLPE cable 150 kV planting 8.349 16.698
Other civil work 25.983 75.529
Electrical work 2,753.842 4,852.698
Undersea cable installation 2,281.630 3,802.717
XLPE cable installation 282.441 564.881
Termination 89.483 178.966
Jointing 95.483 290.391
Other electrical work 4.806 15.742Transportation, survey, and commissioning
451.592
646.987
to determine. Therefore, it is usually determined based
on historical data or statistic. Based on the record of
undersea cable 150 kV circuit I and II, it had unique.
During 2004-2009, there were no internal outages. All
of the outages were external. The outages happened
mostly in the high voltage overhead transmission
connected to the undersea cable. So when one circuit
was experiencing an outage, the other circuit became
trip, and as a consequence the system failed to fulfill N-1
standard security resulting in the power supply from
Java to Bali got disconnected. The record of the outages
during 2004-2009 can be seen in Table 3.
Based on these conditions, life cycle cost methode
used a flat unscheduled costs annually. This policy may
be applied temporary while no outage occured during
2004-2005 [3]. It is possible to change when the
outages occured.
3.3 ENS (Energy Not Saved)
ENS occurs when installed capacity is inadequate to
keep or serve the demand. In other words, it occurs in
power deficit condition. It can be assumed that ENS
will occur during peak load hour. In Indonesia, daily
peak load occurs during for 5 hours, which is from
05:00 PM to 10:00 PM. The difference between
installed capacity and peak load during peak load time
is ENS (energy not served). ENS = (PL – IC) × PL duration (1)
where:
ENS = energy not served (kWh);
PL = peak load (kW);
IC = installed capacity (kW);
PL duration = peak load duration (hour).
ENS means loss of oportunity to get profits. So it is a
financial consequence. In normal condition PLN can
get 76 IDR/kWh for transmission unit [8]. However,
because of ENS, PLN will suffer 76 IDR/kWh × ENS.
This paper is assumed that 1 USD = 9,000 IDR.
3.4 Savings
Currently, the system in Bali is supplied by 63%
local generators with HSD fuel which has an expensive
tariff (Table 1). This local generator tariff is more
expensive compared to the tariff in the system of Java
through high voltage undersea cable 150 kV. Installing
the additional undersea cable 150 kV Java-Bali means
increase the economical value of energy in Bali.
Therefore it could decrease the operating time of local
generators. Using the cheaper tariff means savings.
Savings is the difference between energy price that is
bought a more expensive tariff and the cheaper one. It
can be also assumed that savings will occur during
peak load hour (for 5 hours) because in average load,
the local generators are not fully operating anyway.

The Use of Life Cycle Cost Analysis to Determine The Most Effective Cost of Installation High Voltage Undersea Cable Bali Strait
2086
Table 3 Outage record [3].
Event Duration (Hour)
Year Failure circuit
Power loss (kW)
Malfunction 5.35 2004 I 54.615
Kite thread disturbance 1.15 2007 II 106.476
Kite thread disturbance 0.33 2007 II 106.476
Broken isolator 0.55 2007 I 53.238
Kite thread disturbance 2.20 2007 II 106.476
Lightening 4.88 2009 II 114.607
Total 14.47
However, not all of the generators could be reduced.
Pesanggaran power plant is not permitted to be turned
off because it is located near the load centre, Denpasar
City. So, Gilimanuk power plant is the most possible
power plant which could be reduced operationally
because of its distance from the load center (Fig. 2).
S = (IC – PL) × (Local Tariff – Java Tariff) × PL
duration (2)
where:
S = savings (USD);
Local Tariff = gilimanuk powerplant Tariff (USD);
Java Tariff = system of java tarif (USD).
Alternative-1: In the do nothing case, the cost
breakdown structure will only incur operational and
maintenance costs. There is no investment or capital
costs. The load forecasting (Fig. 3) showed that
existing power capacity will not meet the demand in
the future. Consequently, Bali’s system will become
deficit and some demand or load will not be able to be
served. It means that ENS (energy not served) in
alternative-1 will be more. The more ENS incur, the
more profit will be lost. This ENS will be deemed to be
a part of operational and maintenance cost. In
alternative-1 saving will not occur because of the
energy deficit.
Alternative-2: For the installation of undersea cable
150 kV circuit III & IV step by step. Circuit III will be
installed in 2012 to meet the demand until 2017. Then
circuit IV will be installed in 2017 to meet the demand
until 2020. So in this alternative the investment or
capital cost will incurred twice, in 2012 and 2017. In
this alternative, the cost breakdown structure will incur
cost in these categories: capital costs (twice, in 2012
and in 2017), operation and maintenance costs and
savings. ENS will not incur until 2020. Power import
from Java which has lower price will substitute existing
power plant operational.
Alternative-3: the cost that incur in this alternative is
equal to the costs in alternative-2. In this alternative,
investment cost for circuit III and IV incured
simultaneously, so it will be higher than the first
investment in alternative-2. However, it has more
economic rock dumping cost.
All of the costs that incur along the study period are
calculated based on present value. The alternative
which has the least will be the most effective
alternative [9].
NPV (net present value) is an important economic
measure for projects or equipment taking into account
discount factors and cash flow. The PV (present value)
of an investment is the maximum amount a firm could
pay for the opportunity of making the investment
without being financially handicapped. The NPV (net
present value) is the present value of proceeds minus
present value of outlays. Net present value calculations
start with a interest rate, followed by finding the
present value of the cash proceeds expected from the
investment, then followed by finding the present value
of the outlays: the net of this calculation is the net
present value. Clearly high NPV projects and processes
provide wealth for the stockholders. Cash availability
and strategies aside, when competing projects are
judged for acceptance, the project with the greatest
NPV is usually the winner [10].
The annual costs for each alternative is shown in
Table 4-6. The graph of total cost for each alternative
could be seen in Fig. 6-8.
PV = FV [
] (3)
where:
PV = present value;
FV = future value;
i = interest rate (%);
n = numbers of years.
Total Cost = Capital Cost + O & M Cost – Savings (4)

The Use of Life Cycle Cost Analysis to Determine The Most Effective Cost of Installation High Voltage Undersea Cable Bali Strait
2087
Table 4 Annual cost of alternative-1 (USD).
Alternative-1 2010 2011 2012 2013 2014 2015 2016 2017 2018 2019 2020
0 1 2 3 4 5 6 7 8 9 10
Capital costs 0 0 0 0 0 0 0 0 0 0 0
Material costs
Civil construction costs
Electrical construction costs
Operation and maintenance costs 0 875.297 875.297 1.331.383 1.934.626 2.676.080 3.580.229 4.675.442 5.994.556 7.575.534 9.462.230
Scheduled maintenance costs 248.669 248.669 248.669 248.669 248.669 248.669 248.669 248.669 248.669 248.669
Non scheduled maintenance costs 626.628 626.628 626.628 626.628 626.628 626.628 626.628 626.628 626.628 626.628
Energi not served 0 0 0 456.086 1.059.329 1.800.783 2.704.932 3.800.145 5.119.259 6.700.237 8.586.933
Savings 0 0 0 0 0 0 0 0 0 0 0
Annual savings
Cash flow 0 875.297 875.297 1.331.383 1.934.626 2.676.080 3.580.229 4.675.442 5.994.556 7.575.534 9.462.230
Discount factors @ 12% 1.00 0.89 0.80 0.71 0.64 0.57 0.51 0.45 0.40 0.36 0.32
Present value 0 781.515 697.781 947.652 1.229.480 1.518.480 1.813.855 2.114.933 2.421.100 2.731.814 3.046.585
Net present value 17,303.205
Table 5 Annual cost of alternative-2 (USD).
Alternative-1 2010 2011 2012 2013 2014 2015 2016 2017 2018 2019 2020
0 1 2 3 4 5 6 7 8 9 10
Capital costs 0 0 37.249.201 37.249.201
Material costs 5.920.014 5.920.014
Civil construction costs 28.123.752 28.123.752 Electrical construction costs
2.753.842 2.753.842
Transportation, survey, and commissioning costs
451.529 451.529
Operation and maintenance costs
0 1.312.945 1.312.945 1.312.945 1.312.945 1.312.945 1.312.945 1.312.945 1.312.945 1.312.945 1.312.945
Scheduled maintenance costs
373.004 373.004 373.004 373.004 373.004 373.004 373.004 373.004 373.004 373.004
Non scheduled maintenance costs
939.942 939.942 939.942 939.942 939.942 939.942 939.942 939.942 939.942 939.942
Energi not served 0 0 0 0 0 0 0 0 0 0 0
Savings 0 0 0 15.119.898 13.549.831 8.928.170 4.306.509 15.119.898 15.119.898 12.917.049 8. 295.388
Annual savings 0 15.119.898 13.549.831 8.928.170 4.306.509 15.119.898 15.119.898 12.917.049 8. 295.388
Cash flow 0 1.312.945 38.562.146 -13.806.952 -12.236.885 -7.615.224 -2.993.563 23.442.248 -13.806.952 -11.604.103 -6.982.442
Discount factors @ 12% 100 0.89 0.80 0.71 0.64 0.57 0.51 0.45 0.40 0.36 0.32
Present value 0 1.172.273 30.741.507 -9.827.516 -7.776.762 -4.321.083 -1.516.632 10.604.083 -5.576.397 -4.184.556 -2.248.160
Net present value 7,066.757
The interest rate used in PLN for the last 10 years is
between 10% until 12%. All of LCC calculation in this
paper uses mean interest rate of 12%. To determine the
best alternatives, the cumulative present value (NPV)
of each alternative is compared (Table 7).
This comparison can be seen in Fig. 9 as follows:
From Fig. 9, It can be seen that alternative-1 has
lower cost in the initial of project, but then increasing
in the following years. The growth of the cost in
alternative-1 is caused by increasing ENS besides
operational and maintenance costs. Alternative-2 and
alternative-3 has higher costs in initial project, then
decreases in the next years. The steep cost in initial
project is caused by the capital cost, but it decreases
continuously because of saving.
Based on Fig. 9, it can be summarized that
alternative-3 has the lowest NPV along the 10 years
(2011-2020) period.
5. Sensitivity Analysis
Sensitivity analysis allows study of LCC key
parameters [11]. One factor which increases the
significance of sensitivity analysis is the interest rate
that needs to be used when addressing future life cycle

The Use of Life Cycle Cost Analysis to Determine The Most Effective Cost of Installation High Voltage Undersea Cable Bali Strait
2088
Table 6 Annual cost of alternative-3 (USD).
Alternative-3 2010 2011 2012 2013 2014 2015 2016 2017 2018 2019 2020
0 1 2 3 4 5 6 7 8 9 10
Capital costs 0 0 64.599.999 0 0 0 0 0 0 0 0
Material costs 12.288.727
Civil construction costs 46.811.587 Electrical construction costs
4.852.698
Transportation, survey, and comcommissioning costs
646.987
Operation and maintenance costs
0 1.750.594
1.750.594
1.750.594
1.750.594
1.750.594
1.750.594
1.750.594
1.750.594
1.750.594
1.750.594
Scheduled maintenance costs
497.339 497.339 497.339 497.339 497.339 497.339 497.339 497.339 497.339 497.339
Non scheduled maintenance costs
1.253.2551.253.255
1.253.255
1.253.255
1.253.255
1.253.255
1.253.255
1.253.255
1.253.255
1.253.255
Energi not served 0 0 0 0 0 0 0 0 0 0
Savings 0 0 0 15.119.898 15.119.898 15.119.898 15.119.898 15.119.898 15.119.898 12.917.049 8.295.388
Annual savings 15.119.898 15.119.898 15.119.898 15.119.898 15.119.898 15.119.898 12.917.049 8.295.388
Cash flow 0 1.750.594 66.350.593 -13.369.304 -13.369.304 -13.369.304 -13.369.304 -13.369.304 -13.369.304 -11.166.455 -6.544.794
Discount factors @ 12% 1.00 0.89 0,80 0.71 0.64 0.57 0.51 0.45 0.40 0.36 0.32
Present value 0 1.563.030 52.894.286 -9.516.007 -8.496.434 -7.586.102 -6.773.305 -6.047.594 -5.399.638 -4.026.736 -2.107.248
Net present value 4.504.252
Fig. 6 Total cost of alternative-1.
Fig. 7 Total cost of alternative-2.
Fig. 8 Total cost of alternative-3.
Fig. 9 The comparison of PV cumulative.
Table 7 Comparison of NPV on each alternative.
Alternatives NPV (US$)
Alternative-1 17,303.205
Alternative-2 7,0696.757
Alternative-3 4,504.252
costs. Choosing the right interest rate is not easy,
because it depends for example on the risk-level of the
project, market situation, credit rating of the company
and on many other factors [12].
The interest rate can affect the outcome of a life
cycle cost analysis in that certain alternatives may be
favored by higher or lower interest rate. High interest
rate favor alternatives that stretch out costs over a
period of time, since the future costs are discounted in
relation to the initial cost. A low interest rate favors
0
1.000.000
2.000.000
3.000.000
4.000.000
5.000.000
6.000.000
2010 2011 2012 2013 2014 2015 2016 2017 2018 2019 2020
Costs (US$)
Years
Total Costs Alternative‐1
‐20.000.000
‐10.000.000
0
10.000.000
20.000.000
30.000.000
40.000.000
50.000.000
60.000.000
2011 2012 2013 2014 2015 2016 2017 2018 2019 2020
Costs (US$)
Years
Total Costs Alternative‐2
PV Capital costs PV Operation and Maintenance costs PV Savings PV Alt‐2
‐20.000.000
‐10.000.000
0
10.000.000
20.000.000
30.000.000
40.000.000
50.000.000
60.000.000
1 2 3 4 5 6 7 8 9 10 11
Costs (US$)
Year
PV Capital costs PV Operation and Maintenance costs PV Savings PV Alt‐3
Total Cost Alternative‐3
0
10.000.000
20.000.000
30.000.000
40.000.000
50.000.000
60.000.000
2010 2011 2012 2013 2014 2015 2016 2017 2018 2019 2020
PV Cumulative
(US$)
Year
PV cummulative Alt‐1
PV cummulative Alt‐2
PV cummulative Alt‐3

The Use of Life Cycle Cost Analysis to Determine The Most Effective Cost of Installation High Voltage Undersea Cable Bali Strait
2089
Fig. 10 Sensitivity analysis of interest rate.
high initial cost alternatives since future costs are
added in at almost face value. All costs are treated
equally regardless of an interest rate is equal to zero.
The interest rate will have a minor effect on the
analysis and initial costs will have a larger effect where
alternative strategies have similar maintenance,
rehabilitation, and operating costs [9].
There are some variables related to LCC calculation
that have varying effects such as interest rate and
analysis period. Interest rate is an economic variable so
it is assumed to be more sensitive than others. Fig. 10
shows the NPVs in various interest rates.
Based on Fig. 10, it can be seen that the balancing
point between alternative-2 and 3 is 14% (with goal
seek function, it is found 14.73% exactly), while the
balancing point between alternative-1 and alternative-3
is 23.44%. In case interest rate is lower than 14.73%,
alternative-3 is better, but in the case where interest rate
is higher than 14.73%, alternative-2 is better.
6. Conclusions
In life cycle cost analysis for the project of high
voltage undersea cable installation, the cost breakdown
structure that will incur are these costs: capital cost,
operational and maintenance costs and savings.
The results using life cycle cost method are
markedly affected by interest rate. Low interest rates
favor those alternatives that combine large capital
investments with low maintenance or user costs. High
interest rates favor the reversed combinations.
Based on life cycle cost analysis with 12% interest
rate, alternative-3, which is to install undersea cable
150 kV circuit III & IV simultaneously in 2012, is the
best alternative. Alternative-3 is preferable in the case
where interest rate is below 14.73%.
Acknowledgments
The author thanks to National Electricity Company
(PT. PLN (Persero)) and Bandung Institute of
Technology (ITB) for group discussion, data and
valuable support during this research.
References
[1] N.I. Sinisuka, B.H. Priyadi, Experience in service of submarine power cables 150 kV in Bali Strait, in: JICABLE’99, Paris, France, June 20-24, 1999.
[2] Masterplan Electricity, 2009-2018, PLN, Jakarta, Indonesia, 2009, pp. 40-41.
[3] Java-Bali Transmission and Load Dispatch, East Java and Bali Region, Disturbance Data Report, PLN, Surabaya, Indonesia, 2004-2009.
[4] N.I. Sinisuka, The Use of value Engineering Techniques to Study the Reliability of High Voltage Transmission System in Tropical Country, IEEE, Tokyo, 2002.
[5] W.J. Fabrycky, B.S. Blanchard, Life-Cycle Cost and Economic Analysis, Prentice-Hall Inc, New Jersey, USA, 1991, pp. 136-139, 332-352.
[6] I. Jeromin, J. Backes, G. Balzer, R. Huber, Life Cycle Cost Analysis of Transmission and Distribution Systems, in: CIRED, Prague, Czech Republic, June 8-11, 2009, pp. 1-4.
[7] N.I. Sinisuka, H. Nugraha, Life cycle cost analysis on the operation of coal fired power plant unit #1 330 MW indramayu, West Java, Indonesia, in: Proceedings of 4th Asia-Pacific International Symposium on Advanced Reliability and Maintenance Modeling, New Zealand, 2010, pp. 632-639.
[8] Electricity Cost of Production, Ministry of Energy and Mineral Resources, Jakarta, Indonesia, 2008.
[9] Life Cycle Cost Analysis, Engineering Services Division Value Engineering, Utah Department of Transportation, Washington, D.C, USA, 2007, pp. 1-10.
[10] P. Barringer, D. Weber, Life cycle cost tutorial, in: Fifth International Conference on Process Plant Reliability, Houston, Texas, 1996.
[11] P. Barringer, Download free life cycle cost software [Online], 1996, http://www.barringer1.com.
[12] R.A. Brealey, S.C. Myers, Principles of Corporate Finance, 7th ed., McGraw-Hill, New York, 2003.
‐30.000.000
‐20.000.000
‐10.000.000
0
10.000.000
20.000.000
30.000.000
1 3 5 7 9 11 13 15 17 19 21 23 25 27 29 31 33 35 37 39NPV (US$)
Interest rate (%)
alt_1 alt_2 alt_3