Embed Size (px)
Citation preview

The Use of High Resolution AccurateMass GC/Q-TOF and Chemometricsin the Identification of EnvironmentalPollutants in Wastewater Effluents
Authors
Anthony Gravell and Praveen Kutty
Natural Resources Wales
Llanelli Laboratory
Wales, United Kingdom
Sofia Nieto
Agilent Technologies, Inc.
Santa Clara, CA
USA
Application Note
Environmental
Abstract
A GC/Q-TOF method employing the Agilent 7200 series GC/Q-TOF system and
chemometric analysis tools in Agilent Mass Profiler Professional software has been
used to effectively identify environmental pollutants in complex effluent samples
from multiple wastewater treatment sites and track their transformation during the
treatment process.

2
Introduction
Efforts to characterize the fate of environmental pollutantsduring wastewater treatment are hampered by the largenumber of compounds present in various wastewater streams[1]. Untargeted analysis of pesticides and other environmentalpollutants in wastewaters using gas chromatography/massspectrometry (GC/MS) can benefit from comprehensive EIlibraries available for this technique, such as NIST 14 (containing over 200,000 EI spectra with retention index (RI)values for over 80,000 compounds). However, the highly com-plex chromatograms and very large data sets characteristicfor this workflow represent a substantial analytical challenge[2,3].
While deconvolution of unit mass electron ionization (EI) datafollowed by a mass spectral library search is the most typicalworkflow used for the identification of environmental pollu-tants, this approach does not provide enough confidence incompound identification, especially in case of poor librarymatching. Using the high resolution, accurate mass capability of GC/Q-TOF provides analysts the required toolsfor reliable compound identification.
This application note presents a novel combined untargetedand targeted approach that uses high resolution accuratemass quadrupole-time-of-flight mass spectrometry(Q-TOF MS) to increase the efficacy of identification of largenumbers of unknown compounds in wastewater. Furthermore,chemometric techniques using Agilent Mass ProfilerProfessional (MPP) software are then used for statisticalanalysis and data interpretation to ascertain the fate of environmental pollutants during wastewater treatment.
Experimental
InstrumentsThis study was performed on an Agilent 7890B GC systemcoupled to an Agilent 7200 series GC/Q-TOF system. Theinstrument conditions are listed in Table 1.
Table 1. GC and Mass Spectrometer Conditions
GC run conditions
Column Agilent DB-5 MS Ultra Inert, 30 m × 0.25 mm, 0.25 µm film (p/n 122-5532UI)
Injection volume 1 µL
Split ratio 10:1
Split/Splitless inlet temperature 300 °C
Oven temperature program 70 °C for 2 minutes25 °C/min to 160 °C3 °C/min to 205 °C8 °C/min to 280 °C, 7.5 minutes hold40 °C/min to 325 °C, 2 minutes hold
Carrier gas Helium at 1.5 mL/min constant flow
Transfer line temperature 300 °C
MS conditions
Ionization mode EI
Source temperature 280 °C
Quadrupole temperature 150 °C
Mass range 50 to 600 m/z
Sample preparationSettled primary and final effluent samples from three wastewater treatment works in South Wales, UK, were col-lected over a period of a few days. Five replicates of finaleffluent and primary effluent samples from each of the sites,as well as blanks, were extracted with dichloromethane, andconcentrated to low volume. Internal standard deuteratedphenanthrene (D10) was added to each sample prior to extraction.

3
Data processing and statistical analysisThe data were processed by chromatographic deconvolutionusing the Unknowns Analysis tool in Agilent MassHunterQuantitative Analysis software (version B.07), followed by tentative compound identification by comparison to theNIST 14 mass spectral library. The identification of environ-mental contaminants was further confirmed using the accu-rate mass tools available in the MassHunter QualitativeAnalysis software (version B.07). A set of approximately 200putative contaminants of potential interest was then selectedfrom the list of identified components, and semiquantitationwas performed using MassHunter Quantitative Analysis.
The results from quantitation analysis were subsequentlyimported and processed in the multivariate statistical packageMass Profiler Professional (MPP, version 13) to evaluate thetransformation of environmental pollutants in the wastewatertreatment works. Figure 1 outlines the data analysis workflow.
Results and Discussion
Chromatographic deconvolution, library searchand accurate mass confirmationUsing chromatographic deconvolution and NIST librarysearch, approximately 600 components were tentatively iden-tified in each sample (Figure 2). Compound identity was further confirmed using accurate mass information, relativeisotope abundance information, and MassHunter accuratemass tools, including Molecular Formula Generator (MFG)(Figure 3). Excellent mass accuracy and small isotope abun-dance error facilitated confirmation of tentative hits (Table 2).The data were further processed in MassHunter QuantitativeAnalysis software using peak areas normalized to the internal standard.
Deconvolution Library search Accurate mass confirmation
Visualization in MPP
Quant of targets from deconvolution
Import target list into MPP
Figure 1. Data analysis workflow.
Figure 2. The Unknowns Analysis tool was used to perform deconvolution and the NIST library search. The lower middlepanel shows deconvoluted ions selected for the component. They all have the same peak shape, confirming thatthey all belong to the same component, and thus aiding in its identification (triclosan in this case).

Statistical analysisA target list of putative contaminants of potential interestwas chosen, and the quantitation results were subsequentlyimported into and processed in the multivariate statisticalpackage MPP to evaluate the transformation of pollutants inthe wastewater treatment plants. The data analysis workflowis outlined in Figure 1.
4
Figure 3. Molecular Formula Generator results.
Table 2. Mass and M+1 Molecular Ion Isotope Abundance Error for Some of the Compounds in the Final Effluent of Site 3
Compound Formula Absolute m/z Calculated m/z Mass error for MI* (ppm) M+1 Abundance error (%)
p-Dichlorobenzene C6H4Cl2 145.9684 145.9685 -0.69 0.3
1,2,4-Trithiolane C2H4S3 123.9469 123.947 -0.81 -0.7
2,6-Dichlorophenol C6H4Cl2O 161.963 161.9634 -2.47 -1.2
Benzothiazole C7H5NS 135.0142 135.0137 3.70 -0.1
3,5-Dichloroaniline C6H5Cl2N 160.9795 160.9794 0.62 0.8
Chloroxylenol C8H9ClO 156.0336 156.0336 -0.30 0.7
5-Methylbenzotriazole C7H7N3 133.0636 133.0634 1.00 0.9
2,3,4-Trichloroaniline C6H4Cl3N 194.9404 194.9404 0.02 -1.5
4-Methyl-1H-benzotriazole C7H7N3 133.0634 133.0634 -0.20 -0.5
Crotamiton C13H17NO 203.131 203.1305 2.46 2.2
Benzophenone C13H10O 182.0733 182.0726 3.84 0.1
Tonalide (ANTH) C18H26O 258.1981 258.1978 1.16 0.1
Average 1.44 0.76
*MI = Molecular ion
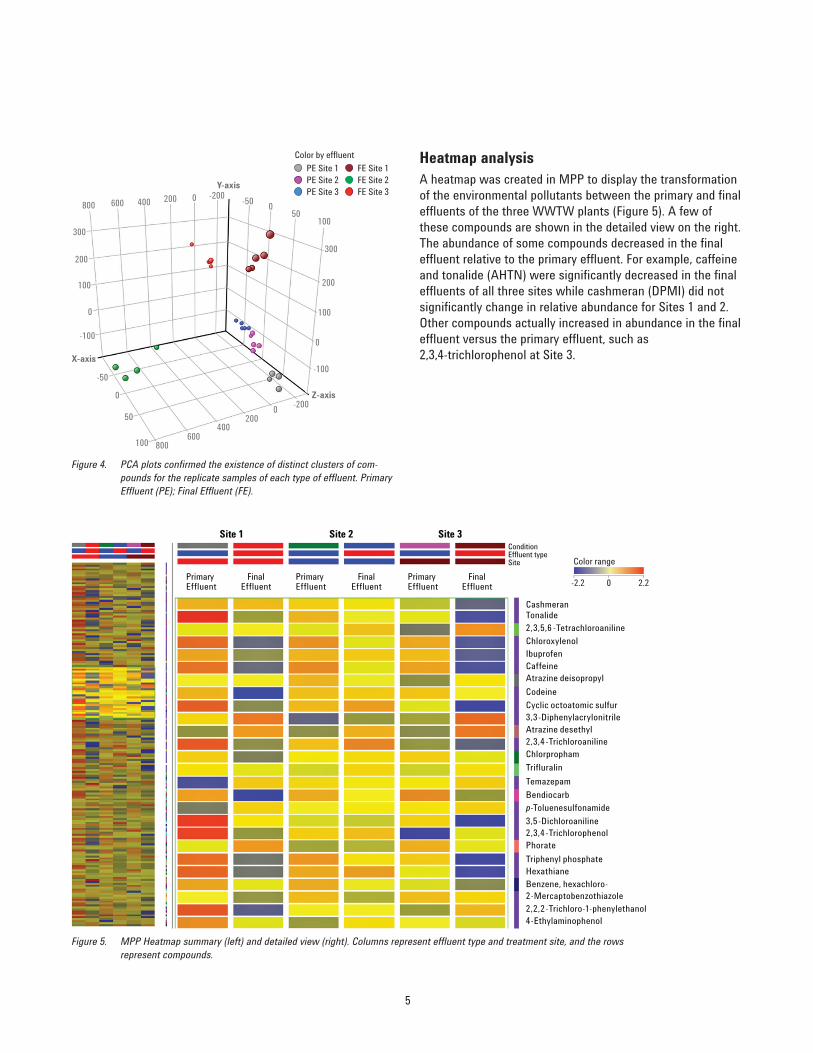
Principal component analysisPrincipal Component Analysis (PCA) is a frequently employedunsupervised multivariate statistical analysis technique fordata dimensionality reduction. PCA analysis revealed distinctdata clusters that represented differences in composition andabundance between all three wastewater treatment plant(WWTW) sites, as well as differences between the primaryand final effluents of each site (Figure 4). The grouping ofdata points along the Z-axis suggests chemical similarity inthe primary effluents for all three sites.
5
Heatmap analysisA heatmap was created in MPP to display the transformationof the environmental pollutants between the primary and finaleffluents of the three WWTW plants (Figure 5). A few ofthese compounds are shown in the detailed view on the right.The abundance of some compounds decreased in the finaleffluent relative to the primary effluent. For example, caffeineand tonalide (AHTN) were significantly decreased in the finaleffluents of all three sites while cashmeran (DPMI) did notsignificantly change in relative abundance for Sites 1 and 2.Other compounds actually increased in abundance in the finaleffluent versus the primary effluent, such as2,3,4-trichlorophenol at Site 3.
Figure 4. PCA plots confirmed the existence of distinct clusters of com-pounds for the replicate samples of each type of effluent. PrimaryEffluent (PE); Final Effluent (FE).
Figure 5. MPP Heatmap summary (left) and detailed view (right). Columns represent effluent type and treatment site, and the rows represent compounds.
800 600 400 200
Y-axis
Z-axis
X-axis
0 -200
800600
400200
0-200
-500
50100
-50
0
50
100
300
200
100
0
-100
300
200
100
-100
0
Color by effluent
FE Site 3PE Site 3
FE Site 1PE Site 1FE Site 2PE Site 2
Site 1 Site 2 Site 3
Primary Effluent
Primary Effluent
Primary Effluent
Final Effluent
Final Effluent
Final Effluent
Cashmeran
ConditionEffluent typeSite
Tonalide2,3,5,6 -Tetrachloroaniline
ChloroxylenolIbuprofenCaffeineAtrazine deisopropyl
Codeine
Cyclic octoatomic sulfur3,3-DiphenylacrylonitrileAtrazine desethyl2,3,4 -TrichloroanilineChlorpropham
Trifluralin
Temazepam
Bendiocarb
p-Toluenesulfonamide
3,5-Dichloroaniline2,3,4 -TrichlorophenolPhorate
Triphenyl phosphateHexathiane
Benzene, hexachloro-2-Mercaptobenzothiazole2,2,2-Trichloro-1-phenylethanol4-Ethylaminophenol
Color range
-2.2 0 2.2

6
K-means clustering analysisThe K-means clustering tool in MPP divides entities (compounds in this case), into groups (clusters) based onsimilarity of their behavior under different conditions (primaryand secondary effluents in this case). K-means clusters areconstructed so that the average behavior (increase ordecrease in abundance measured by degree of fold change) ineach group is distinct from any of the other groups. Figure 6
illustrates this analysis for two groups of compounds ana-lyzed at Site 3. In the left panel, all members of the groupdecrease in abundance in a similar manner in the final effluent with respect to that of the primary effluent.Conversely, all members of the group in the right panelincrease in abundance in a similar manner in the final efflu-ent. In this way, several groups of compounds with similarchanges in abundance were identified.
Figure 6. K-means clustering of two representative groups of compounds from Site 3 that display similar degree offold change in abundance between primary effluent (right side of each graph) and final effluent (left sideof each graph). Some of the compounds present in the left hand cluster are shown in the text box.

7
Venn diagram To visually compare treatment sites with respect to thenumber of shared and unique compounds removed or accu-mulated during the course of the treatment, Venn diagramswere used (Figure 7). For all the treatment sites, the numberof compounds removed from primary effluents (left side ofFigure 7) was larger than the number accumulated.
Conclusions
The combination of gas chromatography, high resolutionQ-TOF mass spectrometry, and chemometrics techniques wassuccessfully used to characterize and identify environmentalpollutants in complex effluent samples from multiple waste-water treatment sites. Data analysis, using both targeted anduntargeted approaches, revealed a number of compounds,including pharmaceuticals, benzothiazole-based corrosioninhibitors and polycyclic musks that were specifically presentin the primary effluents, but were reduced to significantlylower concentrations in final effluents.
The statistical analysis tools in Agilent Mass ProfilerProfessional enabled easy and rapid visualization of theresults using multiple statistical approaches that revealedsimilarities and differences in treatment modalities betweentreatment sites as well as between groups of compounds.This approach can thus facilitate our understanding of theeffectiveness of wastewater treatment for the removal oftrace organic pollutants.
Figure 7. Venn diagrams showing compounds present at significantlyhigher levels in primary effluents as compared to the final efflu-ents (A), and those accumulated in final effluents as compared tothe primary effluents (B). The numbers of compounds shared bymultiple sites are depicted by the overlap in the diagrams.
Compounds reduced in abundance in final effluent
Compounds increased in abundance in final effluent
Site 1
A
B
Site 2
Site 3
Site 1 Site 2
Site 3

www.agilent.com/chem
Agilent shall not be liable for errors contained herein or for incidental or consequentialdamages in connection with the furnishing, performance, or use of this material.
Information, descriptions, and specifications in this publication are subject to changewithout notice.
© Agilent Technologies, Inc., 2015Printed in the USADecember 7, 20155991-6488EN
References
1. T. Portoles, E. Pitarch, F. J. Lopez, J. V. Sancho, F. J.Hernandez. “Methodical approach for the use of GC-TOFMS for screening and confirmation of organic pollutantsin environmental water.” J. Mass Spectrom. 42(9), 1175-85 (2007).
2. T. Portoles, E. Pitarch, F. J. Lopez, F. Hernandez.“Development and validation of a rapid and wide-scopequalitative screening method for detection and identification of organic pollutants in natural water andwastewater by gas chromatography time-of-flight massspectrometry.” J. Chromatogr. A 1218(2), 303-15 (2011).
3. F. Hernandez, T. Portoles, E. Pitarch, F. J. Lopez. “Gaschromatography coupled to high-resolution time-of-flightmass spectrometry to analyze trace-level organic compounds in the environment, food safety and toxicology.” TrAC Trends in Analytical Chemistry 30(2),388-400 (2011).
For More Information
These data represent typical results. For more information onour products and services, visit our Web site atwww.agilent.com/chem.