Embed Size (px)
Citation preview
99
THE USE OF GRADE 380 STEEL FOR TRANSVERSE CONFINING REINFORCEMENT IN COLUMNS F. A. Zahn 1, R. Park2, and M. J. N. Priestley3
ABSTRACT
The results of recent experimental and analytical studies of the stress-strain behaviour of concrete confined by New Zealand manufactured Grade 275 or Grade 38 0 reinforcing steel are presented. F i r s t , the behaviour of three pairs of concentrically loaded reinforced concrete columns containing spirals from either Grade 275 or Grade 38 0 steel are compared, including the stage at which spiral fracture occurred. Second, the results of tests on four reinforced concrete columns containing Grade 38 0 spiral or rectangular hoop reinforcement and subjected to combined axial load and cyclic lateral loading are reported. An analytical study which was conducted to determine the available curvature ductility factor at the stage of fracture of the transverse reinforcement is described. The results are used to give a guideline for the safe use of Grade 38 0 steel as transverse confining reinforcement.
INTRODUCTION
According to the New Zealand concrete design code [ 1 ] , when reinforced concrete columns are not designed with sufficient strength to provide a high degree of protection against plastic hinging, the required quantity of transverse reinforcement to be placed in the potential plastic hinge region of columns should be as follows:
(a) When spirals or circular hoops are used, the volumetric ratio should not be less than the greater of
p s = 0.45 ^ v c
,5 + 1.25 j) f 1 A f c g
or p = 0.12 f 8
c 0.5 + 1.25 L y h f)f' A c g
(1)
(2)
where P should be less than either <j>0.7f'Ae or <j)0.7P , and f , should not exceeS g 4 00 M P a . ° y n
(b) When rectangular hoops with or w.ithout supplementary cross ties are used, the total area of hoop bars and supplementary cross ties in each of the principal directions of the cross section within spacing s, should be not less than the greater or
A . = 0.3s, h" hr9-sh h A 1 c 0.5 + 1.25
or A s h = 0.12s hh" ^ 0 . 5 + 1.25 y h 1 e g
(j)f'A c gJ
(3)
(4)
where P should be less than either $0. 7f 'A or <f)0.7? , and f , should not exceed c ^ 400 MPa. yh
The notation used in Eqs. 1 to 4 is:
area of concrete core of column section measured to outside of peripheral transverse reinforcement gross area of column section A
g f 1
L y h
h"
compressive cylinder strength of concrete yield strength of transverse reinforcement dimension of concrete core of column section measured perpendicular to the direction of the hoop bars considered and to the outside of the peripheral hoop compressive load on column due to gravity and seismic loading ideal axial load compressive strength when eccentricity of load is zero strength reduction factor = 0.9
Assistant Engineer, Ministry of Works and Development, Wellington. Professor and Head of Civil Engineering, University of Canterbury, Christchurch. Professor of Applied Mechanics and Engineering Sciences, University of California, San Diego. (Formerly Reader in Civil Engineering, University of Canterbury, Christchurch) .
Equations 1 to 4 are based on the SEAOC recommendations [2] modified to take into account the effect of axial load level. The modification was based on the results of moment-curvature analyses conducted using idealised stress-strain curves for confined concrete (see for example Refs. 3 and 4) and from column test results (see for example Ref. 5 ) . The greater confinement at higher axial load is necessary because of the greater depth of compressed concrete, and hence the greater dependence
BULLETIN OF THE NEW ZEALAND NATIONAL SOCIETY FOR EARTHQUAKE ENGINEERING, Vol. 20, No. 2, June 1987
100
on the compressed concrete for strength and ductility.
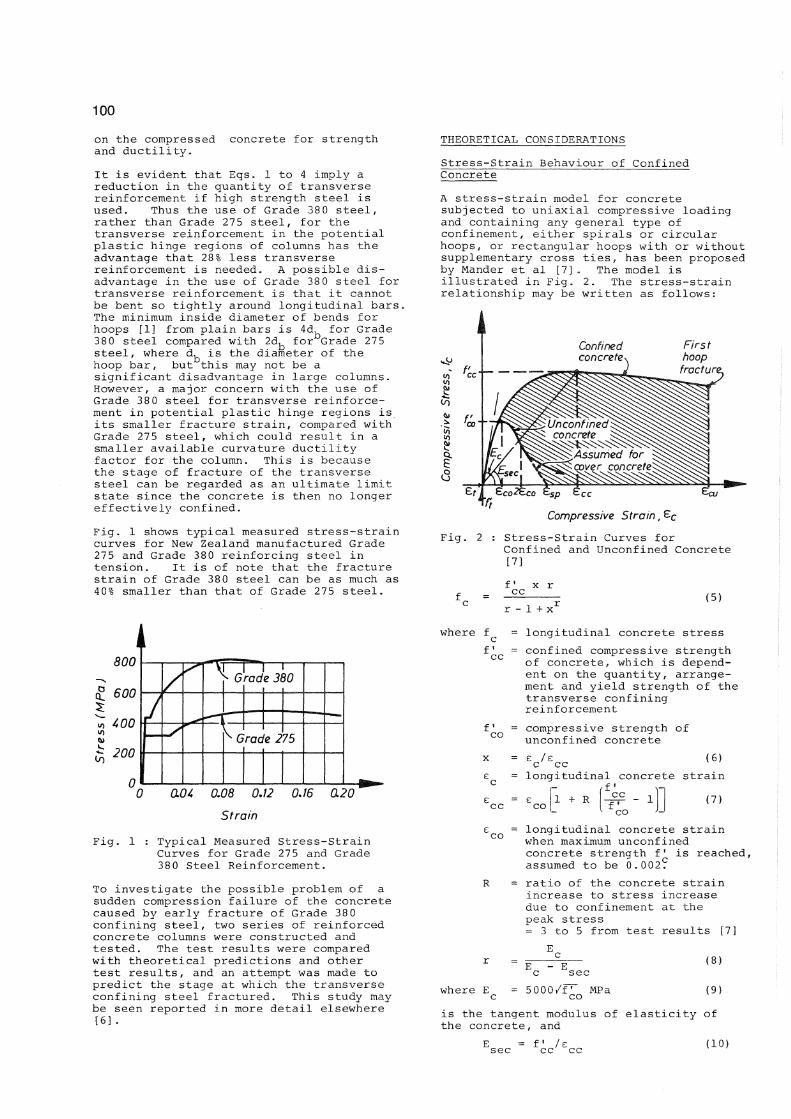
It is evident that Eqs. 1 to 4 imply a reduction in the quantity of transverse reinforcement if high strength steel is used. Thus the use of Grade 380 steel, rather than Grade 275 steel, for the transverse reinforcement in the potential plastic hinge regions of columns has the advantage that 28% less transverse reinforcement is needed. A possible d i s advantage in the use of Grade 38 0 steel for transverse reinforcement is that it cannot be bent so tightly around longitudinal bars. The minimum inside diameter of bends for hoops [1] from plain bars is 4d, for Grade 380 steel compared with 2 d b for Grade 275 steel, where d^ is the diameter of the hoop b a r , but this may not be a significant disadvantage in large columns. However, a major concern with the use of Grade 38 0 steel for transverse reinforcement in potential plastic hinge regions is its smaller fracture strain, compared with Grade 275 steel, which could result in a smaller available curvature ductility factor for the column. This is because the stage of fracture of the transverse steel can be regarded as an ultimate limit state since the concrete is then no longer effectively confined.
Fig. 1 shows typical measured stress-strain curves for New Zealand manufactured Grade 275 and Grade 380 reinforcing steel in tension. It is of note that the fracture strain of Grade 38 0 steel can be as much as 40% smaller than that of Grade 275 steel.
800
D
a. 600
400
1/) 200
/ r
- G rod e3l 30
J J V ^ G raa ̂ 2 75 1
Fig.
0.04 0.08 0.12 0J6 0.20
Strain
Typical Measured Stress-Strain Curves for Grade 275 and Grade 380 Steel Reinforcement.
To investigate the possible problem of a sudden compression failure of the concrete caused by early fracture of Grade 380 confining steel, two series of reinforced concrete columns were constructed and tested. The test results were compared with theoretical predictions and other test results, and an attempt w a s made to predict the stage at which the transverse confining steel fractured. This study may be seen reported in more detail elsewhere [6] .
THEORETICAL CONSIDERATIONS
Stress-Strain Behaviour of Confined Concrete
A stress-strain model for concrete subjected to uniaxial compressive loading and containing any general type of confinement, either spirals or circular hoops, or rectangular hoops with or without supplementary cross ties, has been proposed by Mander et al [ 7 ] . The model is illustrated in Fig. 2. The stress-strain relationship may be written as follows:
Firs t hoop
fracture,
£f 1 ScO^-CO t - s n
Compressive Strain, £c Fig. 2 : Stress-Strain Curves for
Confined and Unconfined Concrete [7]
f x r cc r - 1 + x1
(5)
where f c
f« cc
f 8
CO
X
longitudinal concrete stress confined compressive strength of concrete, which is dependent on the quantity, arrangem e n t and yield strength of the transverse confining reinforcement compressive strength of unconfined concrete
c cc (6) longitudinal concrete strain
ft1
1 + R f c o
(7)
longitudinal concrete strain w h e n maximum unconfined concrete strength f' is reached, assumed to be 0.002. ratio of the concrete strain increase to stress increase due to confinement at the peak stress = 3 to 5 from test results [7]
E
where E 5000/f* MPa
(8)
(9)
is the tangent modulus of elasticity of the concrete, and
= f c c / £ c c (10)

101
To define the stress-strain behaviour of the cover concrete (outside the confined core concrete) the part of the falling branch in the region where e > 2c is assumed to be a straight line whicfi 0
reaches zero stress at the spalling strain e s p "
To determine the confined compressive strength of the concrete, f , Mander et al [7] have proposed a numerical analysis based on an ultimate strength surface criterion for concrete under a general multiaxial state of stress. For concrete confined by a spiral or circular h o o p s , f c c ^ s 9 ^ v e n fry
= 2.254 94 f c o
- 2 1. 254
(11) where f is the effective lateral confining stress applied to the concrete core by the spiral or circular hoop, given by
2A f , k s, d^ h c
(12)
where A = area of spiral or circular s ^ hoop bar
s^ = centre to centre spacing of spiral or circular hoop
d = diameter of spiral or circular c hoop
k = confinement effectiveness e coefficient, which for a spiral is given [7] by <! - JET' / ( 1 - p C c »
c where s' = clear spacing between spiral
bars p = ratio of area of longitudinal
reinforcement to area of core of column section.
Stage of Fracture of the Transverse Reinforcement
The longitudinal concrete compressive strain at the stage when the transverse reinforcem e n t fractures can be regarded as the ultimate compressive strain, since then the concrete is no longer effectively confined [6,7] .
Mander et al [7] have proposed an "energy b a l a n c e 1 method to predict the stage of hoop or spiral bar fracture. The energy balance method reflects the principle that the lateral expansion of the core concrete at large compression strains is passively resisted by the confining steel, which has to follow that expansion, thus absorbing strain energy. A l s o , the longitudinal reinforcement is able to sustain strains higher than the yield strain because the confining steel prevents premature buckling. The increase in strain energy capacity of the compressed concrete and longitudinal reinforcement due to confinement is assumed to be provided by the strain energy capacity of the confining reinforcement as it yields in tension. Hoop or spiral fracture occurs when the strain energy
stored in the compressed concrete and longitudinal steel as a result of the confinement is equal to the strain energy absorption capacity of the confining steel. The strain energy stored in the concrete as a result of confinement is equal to the difference in area between the stress-strain curves for confined and unconfined concrete (the shaded area of Fig. 2) multiplied by the volume of confined concrete. The strain energy stored in the longitudinal steel due to confinement is equal to the area under the stress-strain curve for that steel multiplied by the volume of that steel. The strain energy capacity of the confining steel is equal to the area under the stress-strain curve of the confining steel up to the fracture strain multiplied by the volume of that steel confining the concrete, which assumes that the length of bar considered is uniformly stressed to the fracture strain.
The energy balance equation for a concentrically loaded column can be written as
+ A
• - A c c
e f de c s c
£ f u de c c c
f sf = A b * b e b f s d £ b (13)
where A = area of confined concrete, A g = sum of She areas of longitudinal bars restrained from buckling, A, = area of the transverse bar, e = longitudinal concrete compressive strain, = ultimate longitudinal concrete compressive strain (at fracture of the transverse r e i n f o r c e m e n t ) , = strain in the transverse bar, - fracture strain of transverse bar, £?* = length of transverse bar in unit lengtn of column, f = longitudinal stress in confined concrete at strain e , f u = longitudinal stress in unconfined Soncfete at strain e , = stress in longitudinal reinforcing Bar at strain e , and f f c = stress in transverse bar at sSrain e .
c The areas under the stress-strain curves up to the fracture strain of N e w Zealand manufactured Grade 380 and Grade 275 steel have been found to be approximately equal by Mander et al [7] and that finding was confirmed in this study. This means that the higher stresses and the early strain hardening of Grade 380 steel compensates for its lower fracture strain. Thus the strain energy absorption capacity of a code-designed circular spiral made from Grade 38 0 steel, and providing a given confining stress to the concrete,is smaller by a factor 275/380 than the strain energy absorption capacity of a spiral made from Grade 27 5 steel and providing the same confining stress, because the bar areas (and hence p ) are different by that ratio. Hence according to the energy balance method, the smaller strain energy absorption capacity of the code-designed

102
quantity of Grade 38 0 confining steel in a column should result in a smaller ultimate longitudinal concrete compressive strain (at first fracture of the transverse steel) , compared with a column containing the code-designed quantity of Grade 275 confining steel.
TESTS ON CONCENTRICALLY LOADED SPIRALLY REINFORCED CONCRETE COLUMNS
The Column Units
In order to test the above theoretical considerations three pairs of concentrically loaded spirally reinforced concrete column units of the dimensions shown in Fig. 3 were tested. In each pair of columns the
Four linear potentiometers
16-16 mm dia. bars
13mm cover. to spiral
Steel rods to mount potentiometers
400mm
Fig. 3 : Principal Dimensions, Test Set Up and Instrumentation of Concentrically Loaded Column Units 1 to 6.
spiral reinforcement was from 12 mm diameter Grade 275 plain bar in one column unit and from 10 m m diameter Grade 380 plain bar in the other column u n i t , so that the yield force of the spiral bar A f . was approximately the same for^both units in the pair. The ends of the spiral bar within the length of the spiral were welded in the case of the Grade 275 bar. In the case of the Grade 380 bar the ends within the spiral were spliced over one half turn of spiral and then bent through an angle of at least 100° around a longitudinal bar into the core concrete.
Table 1 summarises the properties of the test units. Each pair of columns was cast together with a third plain concrete
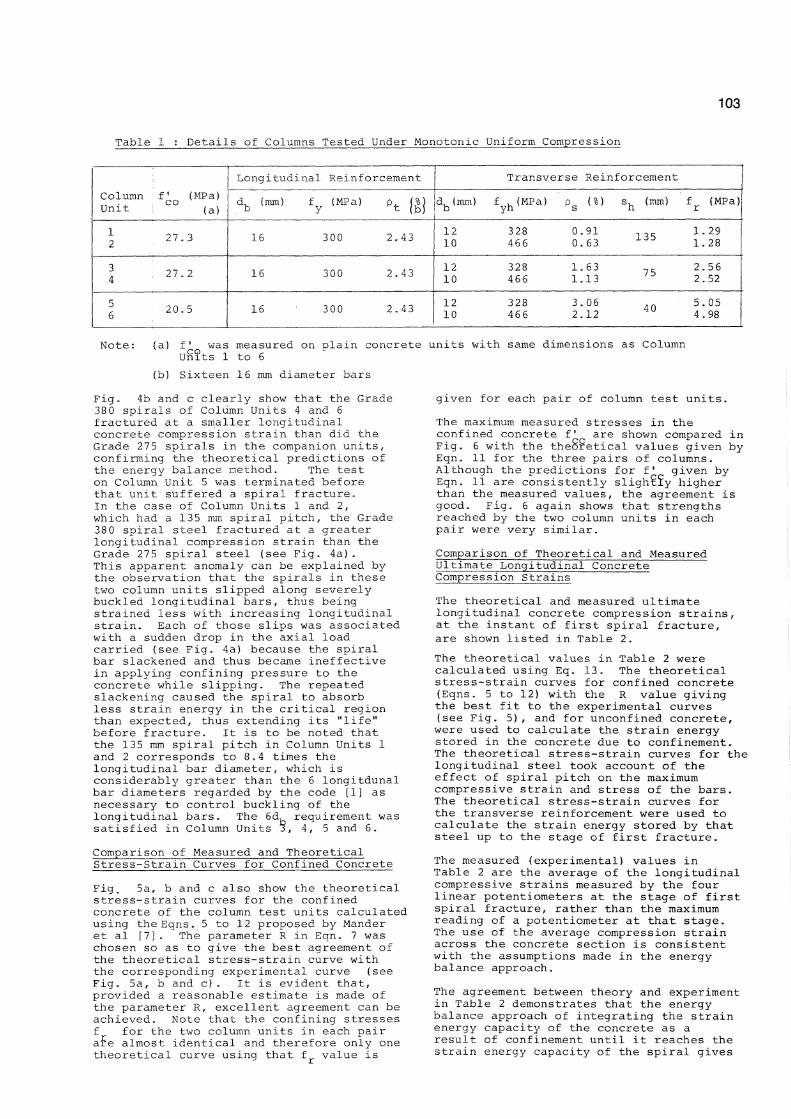
control unit from the same batch of concrete. The control units had the same dimensions as the confined columns. Note that the column units were cast with their longitudinal axis in a horizontal position. The quantity f' in Table 1 is the measured strength of thS°full size control units at about the same age as the confined columns.
Four linear potentiometers, mounted on steel rods embedded in the concrete as shown in Fig. 3, were used to measure the longitudinal strain over a 500 mm gauge length. A 10 MN servo-hydraulically controlled DARTEC testing machine was used to apply the load monotonically at a slow uniform strain rate until fracture of the spiral bar occurred.
Test Results
Fig. 4a, b and c shows the measured axial load-longitudinal strain curves of the three pairs of column u n i t s . The longitudinal strain in these diagrams is defined as the shortening measured by the linear potentiometer that gave the highest reading divided by the gauge length of 500 mm. All three diagrams demonstrate that the two column units in each pair behaved very similarly. This includes the longitudinal strain at which the average of all strain gauges placed on the spiral bar in the central region of the column unit indicated yield of the confining steel (point (a) in the d i a g r a m s ) . For all six columns the point (a) coincided approximately with the maximum load, indicating that the assumption of the transverse steel yielding when calculating the quantity of confining steel is reasonable also for Grade 380 steel. The earlier and more pronounced strain hardening of Grade 380 steel is responsible for the slightly greater axial loads carried in the falling branch region of the load-strain curves of all three column units confined by 10 m m diameter Grade 380 spirals, compared to their companion columns.
Also shown in Fig. 4a, b and c are the estimated axial load - longitudinal strain curves for the longitudinal steel and the unconfined cover concrete. The cover concrete becomes ineffective at a strain e of approximately 0.006 because of extensive crushing. Note that because of the closely spaced spiral bars in Column Units 3, 4, 5 and 6, the longitudinal bars were able to strain-harden in those units. The calculated sum of the loads carried by the longitudinal steel and the cover concrete was subtracted from the total load carried by the column unit and the remainder divided by the core area of concrete in order to obtain the experimental longitudinal stress-strain curves for the confined concrete. The curves so calculated are shown in Fig. 5a, b and c for the three pairs of column units. The concrete compressive stresses have been normalised by dividing by the measured strength f' of the corresponding full size control c o
units. It is evident from Fig. 5 that the measured stress-strain curves for the confined concrete of the column units making a pair are very similar.
103
Table 1 : Details of Columns Tested Under Monotonia Uniform Compression
Longitudinal Reinforcement Transverse Reinforcement Column Unit
' f 8
CO (MPa)
(a) d^ (mm) f (MPa) d, (mm)
D f , (MPa) yh p s (%) s^ (mm) f
r (MPa)
1 2 27 . 3 16 300 2.43 12
10 328 466
0. 0.
91 63 135 1
1 29 28
3 4 27. 2 16 300 2.43 12
10 328 466
1. 1.
63 13 75 2
2 56 52
5 6 20. 5 16 300 2.43 12
10 328 466
3. 2.
06 12 40 5
4 05 98
N o t e : (a) f * was measured on plain concrete units with same dimensions as Column Units 1 to 6
(b) Sixteen 16 mm diameter bars
Fig. 4b and c clearly show that the Grade 380 spirals of Column Units 4 and 6 fractured at a smaller longitudinal concrete compression strain than did the Grade 275 spirals in the companion u n i t s , confirming the theoretical predictions of the energy balance method. The test on Column Unit 5 was terminated before that unit suffered a spiral fracture. In the case of Column Units 1 and 2, which had a 135 mm spiral pitch, the Grade 380 spiral steel fractured at a greater longitudinal compression strain than the Grade 275 spiral steel (see Fig. 4 a ) . This apparent anomaly can be explained by the observation that the spirals in these two column units slipped along severely buckled longitudinal b a r s , thus being strained less with increasing longitudinal strain. Each of those slips was associated with a sudden drop in the axial load carried (see Fig. 4a) because the spiral bar slackened and thus became ineffective in applying confining pressure to the concrete while slipping. The repeated slackening caused the spiral to absorb less strain energy in the critical region than expected, thus extending its "life" before fracture. It is to be noted that the 135 mm spiral pitch in Column Units 1 and 2 corresponds to 8.4 times the longitudinal bar diameter, which is considerably greater than the 6 longitdunal bar diameters regarded by the code [1] as necessary to control buckling of the longitudinal b a r s . The 6d, requirement was satisfied in Column Units 3, 4, 5 and 6.
Comparison of Measured and Theoretical Stress-Strain Curves for Confined Concrete
Fig. 5a, b and c also show the theoretical stress-strain curves for the confined concrete of the column test units calculated using the Eqns. 5 to 12 proposed by Mander et al [7]. The parameter R in Eqn. 7 was chosen so as to give the best agreement of the theoretical stress-strain curve with the corresponding experimental curve (see Fig. 5a, b and c ) . It is evident that, provided a reasonable estimate is made of the parameter R, excellent agreement can be achieved. Note that the confining stresses f for the two column units in each pair are almost identical and therefore only one theoretical curve using that f r value is
given for each pair of column test u n i t s .
The maximum measured stresses in the confined concrete f' are shown compared in Fig. 6 with the theoretical values given by Eqn. 11 for the three pairs of columns. Although the predictions for f' given by Eqn. 11 are consistently sligh?Jy higher than the measured values, the agreement is good. Fig. 6 again shows that strengths reached by the two column units in each pair were very similar.
Comparison of Theoretical and Measured Ultimate Longitudinal Concrete Compression Strains
The theoretical and measured ultimate longitudinal concrete compression strains, at the instant of first spiral fracture, are shown listed in Table 2.
The theoretical values in Table 2 w e r e calculated using Eq. 13. The theoretical stress-strain curves for confined concrete (Eqns. 5 to 12) with the R value giving the best fit to the experimental curves (see Fig. 5 ) , and for unconfined concrete, were used to calculate the strain energy stored in the concrete due to confinement. The theoretical stress-strain curves for the longitudinal steel took account of the effect of spiral pitch on the maximum compressive strain and stress of the bars. The theoretical stress-strain curves for the transverse reinforcement w e r e used to calculate the strain energy stored by that steel up to the stage of first fracture.
The measured (experimental) values in Table 2 are the average of the longitudinal compressive strains measured by the four linear potentiometers at the stage of first spiral fracture, rather than the maximum reading of a potentiometer at that stage. The u s e of the average compression strain across the concrete section is consistent with the assumptions made in the energy balance approach.
The agreement between theory and experiment in Table 2 demonstrates that the energy balance approach of integrating the strain energy capacity of the concrete as a result of confinement until it reaches the strain energy capacity of the spiral gives

104
Strain (maximum of all potentiometers)
(a) Column Units 1 and 2 With Spiral Pitch of 135 mm
a : ove of spiral strain gauges indicate yielding b : all spiral strain gauges indicate yielding
Total load on
Strain (maximum of all potentiometers I
(b) Column Units 3 and 4 With Spiral Pitch of 75 mm
5000
1000
3000
2000
1000 -
Spiral. dD - 12 mm fyh = 328MPa
Spiral. dD - 10 mm
fyn = C66MPa
^Longitudinal bars
Hoop fracture
a: ave of spiral strain gauges indicate yielding b oil spiral strain gouges indicate yielding
Test terminated at £=0.089
Cover concrete
J_ _L 0 0.01 0.02 0.03 0.0C 0.05 0.06 0.07 ~
Stroin (maximum of all potentiometers}
(c) Column Units 5 and 6 With Spiral Pitch of 40 mm
Fig. 4 : Measured Axial Load-Longitudinal Strain Curves for Spirally Reinforced Column Units.

105
Strain (maximum of oil potentiometers)
(a) Column Units 1 and 2 With Spiral Pitch of 135 mm
Strain (max/mum of alt potentiometers}
(b) Column Units 3 and 4 With Spiral Pitch of 75 m m
Strain (maximum of all potentiometers}
(c) Column Units 5 and 6 With Spiral Pitch of 40 mm
Fig. 5 : Experimental and Theoretical Normalized Longitudinal Stress-Strain Curves for the Confined Concrete of the Spirally Reinforced Concentrically Loaded Column Units (Full curves are experimental and dashed curves are t h e o r e t i c a l ) .

106
For experiment « fyh z 166 MPa x fyn =328 MP a
fr/frn
Fig. 6 : Experimental and Theoretical Strength of Confined Concrete Plotted Versus Confining Stress
Table 2:Monotonic Compression Tests: Experimental and Theoretical Ultimate Longitudinal Concrete Compression Strains
Column Unit
e theory cu (a)
£ e x p cu (b)
£ e x p cu theory cu
1 0 .0468 0.051 1.09
2 0 .0289 0.059 2.04
3 0 . 0461 0.052 1.13
4 0 . 0315 0. 038 1.21
5 0 . 0691 . >0.071 (c)
>1.03
6 0 .0488 0.052 1.07
N o t e s : (a) Found using stress-strain model and energy balance method of Mander et al [7]
(b) Found as average of longitudinal strain measured by all four potentiometers
(c) The test was terminated before the spiral fractured.
a reasonably accurate yet conservative method for predicting the ultimate longitudinal concrete compressive strain of columns subjected to more or less uniform compression.
A s already noted, the Grade 38 0 spirals fractured at a smaller longitudinal concrete compression strain than did the Grade 275 spirals in the companion u n i t s , except in the case of Units 5 and 6 with the 135 mm spiral pitch in which the spirals slipped along the longitudinal reinforcement.
TESTS ON REINFORCED CONCRETE COLUMNS CONFINED BY GRADE 38 0 TRANSVERSE STEEL UNDER COMBINED AXIAL LOAD AND CYCLIC LATERAL LOADS
The Column Units
In order to investigate the effect on the available ultimate curvature of the reduced ultimate longitudinal compressive strain of concrete confined by a proportionally smaller quantity of Grade 38 0 steel, four columns were tested under combined axial and cyclic lateral loading.
Two columns had 400 mm octagonal cross sections with spiral reinforcement. Two columns had 400 mm square cross sections with a square perimeter hoop and two rectangular overlapping interior hoops making each set of transverse reinforcement. The column cross sections are shown in Fig. 7. All transverse reinforcement was from 10 mm diameter Grade 380 plain bar. The ends of the spiral bar within the spirals were spliced for one-half a turn and then bent through an angle of at least 100° around a longitudinal bar into the core concrete. The ends of the hoop bars were bent at least 135° around the longitudinal bar into the core concrete. Table 3 gives further details of the four column u n i t s .
Test Procedure
Fig. 8a shows the principal dimensions and the test set up. A constant axial compression load was applied by the servo-hydraulically controlled DARTEC testing machine through roller bearings welded to steel plates at the column e n d s , while a reversible hydraulic jack applied a cyclically varying lateral load to a stub at mid-height of the column u n i t s . Each half column thus had a moment distribution similar to that in a bridge or building column between the adjoining members (for example, a pile cap or beam) and the point of contraflexure in the column. The loads acting on the columns are shown in Fig. 8b. The lateral load was displacement controlled and two cycles each at a displacement ductility factor u = A / A = ± 2 , ± 4, ± 6 and sometimes ± 8 were applied, as schematically shown in Fig. 9, where A = maximum imposed lateral displacement and A = lateral displacement at first yi elS. defi ned as the lateral displacement measured at 0.75 of the theoretical strength multiplied by 1.33. That i s , the first yield displacement was found by linearly extrapolating the cracked section elastic stiffness up to the theoretical flexural strength.
Fig. 10 shows the instrumentation of the column units. The lateral displacement of the central stub was measured by three linear potentiometers against a fixed reference frame. In m o s t column units the plastic rotation first commenced either above or below the central stub and the further plastic rotations tended to concentrate in the plastic hinge region that had formed first in that loading direction. This resulted in a rotation of the central stub which could be measured by the difference in the potentiometer

107
16'16mm dia. reinforcing bars
Circular spiral. 10mm dia. Grade 380
I 400mm
12-16mm dia. reinforcing barss
Direction of lateral load
f—
p—
• J Hoops, 10mm dia. Grade 380
400 mm
13mm
Units 7 and 8 Units 9 and 10
Fig. 7 : Cross Sections of Column Units Tested Under Combined Axial Load and Cyclic Lateral Loading.
WO
roller
(a) Principal Dimensions and Test (b) Loads Acting on the Column Units Set Up
Fig. 8 i Columns Tested Under Combined Axial Load and Cyclic Lateral Loading.

Fig. 11 : Column Deformations Due to Unsymmetrical Plastic Hinging.

109
Table 3 : Details of Reinforced Concrete Column Units Tested Under Combined Axial and Cyclic Lateral Loading
Column Units
Cross Section Shape
fa) f 8
c P e
Longitudinal Reinforcement
Transverse Reinforcement ^ Column Units
Cross Section Shape
(MPa)
f'A c g d b
(mm)
f Y
(MPa)
p t %
d b (mm)
f Y h (jypa)
s, i p h | K s (mm) | %
p provided s^ p N Z S 3 1 0 1 { C ) H s
f r
(MPa)
f (d) r
f 1
CO
7 Octagonal 32.3 0.13 16 337 2. 43 10 466 135!0.61 i
1.11 1.26 0. 046
8 Octagonal 27.0 0.58 16 337 2.43 10 466 7511.09 1.28 2.50 0.109
9 Square 28. 3 0.23 16 440 1.51 10 466 117 1.56 1. 29 2.20 0. 091
10 Square 40.1 0.39 16 440 1.51 10 466 92 jl.99 0.92 3.03 0.089
Notes: (a) 28 day strength of 100 mm diameter by 200 m m cylinders. (b) Placed over length of potential plastic hinge region of 400 mm for Units 7 and
9, and 600 mm for Units 8 and 1 0 . Spacing of transverse reinforcement was increased outside these regions.
(c) Using measured steel and concrete strengths and <j> = 1 in NZS 3101 equations. (d) f' is the in situ strength of the concrete and was taken as 0.85f' .
readings. Fig. 11 illustrates this situation. In order to find the "true" horizontal displacement of each half length of column, referred to as the equivalent cantilever displacement, the quantity 6h has to be added to or subtracted from the horizontal displacement A measured by the centre potentiometer. The angle 0 is equal to the measured rotation of the central stub.
The curvatures in the plastic hinge regions above and below the central stub of the column units were measured by pairs of linear potentiometers mounted on steel rods passing through the column, as shown in Fig. 1 0 . The data measured by those potentiometers could also be used to calculate the longitudinal concrete compression strains in the extreme fibres of the cross section.
Test Results
F i g s . 1 2 , 1 3 , 14 and 15 show plots of the hysteresis loops of the column moments measured at the central stub versus the equivalent cantilever displacement for the Column Units 7, 8, 9 and 10. In the case of Column Units 7 and 9 the plastic hinging concentrated above the central stub for both directions of lateral loading. In the case of Column Unit 8 the plastic hinging concentrated above the central stub for positive lateral loading and below the central stub for negative lateral loading, and vice versa for Column Unit 10.
The theoretical flexural strengths for the four column u n i t s , calculated using the ACI method [ 8 ] , which is similar to the New Zealand concrete design code method [ 1 ] , assuming a strength reduction factor cf> = 1 and using the measured strengths of the steel and concrete, are listed in Table 4. The maximum experimental moments measured at the faces of the central stub in each loading direction are also shown in Table 4. It is evident that all columns exceeded
their respective theoretical strengths. The difference between the theoretical and experimental flexural strengths is due to the theoretical approach of the code neglecting to take into account the additional strength due to strain hardening of the longitudinal reinforcement after yield and the enhancement in the concrete compressive strength due to confinement. Refined theoretical methods are available to take these factors into account, for example Refs. 3-7, 9.
The measured hysteresis loops shown in Figs. 1 2 , 1 3 , 14 and 15 indicate very good stability and energy dissipation characteristics. The performance of these four columns with Grade 38 0 transverse reinforcement is equally as good as demonstrated by four columns with Grade 275 transverse reinforcement, but otherwise similar, tested previously by Ang et al [10].
The maximum equivalent cantilever displacement ductility factors reached before the measured flexural capacity had reduced to 8 0% of the maximum measured flexural strength were at least 9 for Units 7 and 8 and at least 8 for Units 9 and 1 0 .
The strength degradation in octagonal Column Unit 7 at large displacement ductility factors was caused by severe buckling of the longitudinal b a r s . The spiral pitch in that column was 135 mm which is 8.4 times the longitudinal bar diameter and hence effective control of bar buckling was not possible at large deformations. However, spiral fracture did not occur during the test of Unit 7, but two longitudinal bars eventually fractured at an equivalent cantilever displacement ductility factor of 1 1 .
In the case of octagonal Column Unit 8 at an equivalent cantilever displacement ductility factor of 14 the spiral fractured in the top plastic hinge region,

110
Fig. 12 : Moment-Equivalent Cantilever Displacement Hysteresis Loops for Top Half of Column Unit 7.
6
half column Fig. 13 : Moment-Equivalent Cantilever Displacement Hysteresis Loops for Bottom and
Top Halves of Column Unit 8.

111
Fig. 14 ; Moment-Equivalent Cantilever Displacement Hysteresis Loops for Top Half of Column Unit 9.
UNIT 10
Moment of top face of stub vs. equivalent displacement of top half column
W 60 80 -120 -100 A bottom <mm>
Moment at bottom face of stub vs. equivalent displacement of bottom half column
Concentration of plastic rotation in bottom hinge for positive loading
20 W 60 A topi mm)
Concentration of plastic rotation in top hinge for negative loading
Fig. 15 : Moment-Equivalent Cantilever Displacement Hysteresis Loops for Bottom and Top Halves of Column Unit 1 0 .

112
Table 4 : Experimental and Theoretical Moments for Column Units Tested Under Combined Axial Load and Cyclic Lateral Loading
Unit Experimental (kNm) Theoretical (kNm) M max
M max
(a) M A C I ( b )
M AC I
7 + 234 - 222 215 + 1. 09 - 1 . 03
8 + 318 - 285 210 + 1. 51 - 1 .36
9 + 336 - 311 283 + 1.19 - 1 .10
10 + 430 - 420 374 + 1.15 - 1 .12
N o t e s : (a) maximum experimental moment at face of central stub in each loading direction
(b) using measured material strengths and taking <j) = 1.0
putting an end to the useful life of that column. The corresponding core concrete compressive strain on the outside of the concrete core,calculated from curvature measurements, at that instant was in excess of 0.09. Buckling of longitudinal bars did not occur prematurely since the spiral spacing was 4.7 times the longitudinal bar diameter. The distribution of curvatures in the vicinity of the central stub of Column Unit 8, measured at central stub displacement ductility factors y = 1, 2, 4 and 6 are shown in Fig. 16. The extreme concentrations of plastic rotation, responsible for the big difference between the top and bottom half column displacem e n t s , are clearly evident in that diagram.
In the case of square Column Units 9 and 10, hoop fractures did not occur although longitudinal concrete compressive strains of up to 0.06 were measured on the outside of the concrete core. The spacing of the hoops in Column Unit 9 was 7.3 times the longitudinal bar diameter and severe bar buckling occurred at lateral displacements greater than about 8 0 mm, similar to Column Unit 7. The smaller spacing of hoops in Column Unit 10 of 5.8 times the longitudinal bar diameter meant that bar buckling did not occur prematurely.
Analytical Investigation of the Curvature Ductility Factors at the Stage of Fracture of the Transverse Reinforcement
While the "energy balance" method [7] was found to result in satisfactory accuracy when predicting the ultimate longitudinal concrete compression strain of columns subjected to nearly uniform compression, the prediction of the ultimate curvature of columns under combined axial compression and cyclic flexure poses some difficulties. This is mainly because only part of the column section is in compression and because of the cyclic variation of the neutral axis depth and the longitudinal strain at the centroid of the section.
A computer program for the cyclic moment-curvature analysis of reinforced concrete columns, written by Mander [7], was used to analyse the column units tested,
particularly Column Unit 8. The computer program includes an algorithm for integrating the strain energy input to the transverse confining steel of columns with a cyclically varying strain gradient. It was of interest to check the ability of that algorithm to predict the stage of spiral fracture of Column Unit 8 during the curvature history imposed on the columns in the tests. It was found that the analysis overestimated the strain energy input to the spiral by about a factor of 3, thus predicting a fracture of the spiral at a much earlier point in the cyclic curvature history than actually observed in the test. A similar finding was made from a comparison with two other spirally reinforced test units reported in Refs. 5 and 10 .
As a result the algorithm in the computer program was improved by calibrating it using the results from those comparisons. The strain energy input to the confining steel calculated by the program was divided by a factor of 2, which was the average of the factors found from the comparison with the test results of the three columns analysed. The program was then used to analyse a range of column cross sections with different axial compression loads and quantities of transverse steel, assuming an imposed curvature history of four symmetrical cycles to peak curvature ductility factor of d> /d> - ± 2 0 , where <b = the u v u maximum curvature reached and <J> = curvature at first yield. Column* sections with either Grade 380 or Grade 275 transverse confining steel were analysed.
The study showed that columns with axial compressive load ratios P /f'A ^ 0.35, and with a quantity of confining steel at least equal to that calculated using Eqns. 1 to 4 for the particular f h value, could sustain four cycles to a curvature ductility factor of ± 20 without fracture of the transverse reinforcement or excessive flexural strength deterioration, regardless of whether Grade 27 5 or Grade 380 confining steel was used.

113
For columns with P /f^A > 0.35, the analyses indicated t h a t g fracture of transverse reinforcement may occur before the end of four cycles to a curvature ductility of ± 20. Hence although the modified algorithm for the strain energy in the confining steel used in the program could still be regarded as conservative (that is, although divided by a factor of 2, the strain energy input in the confining steel is probably still o v e r e s t i m a t e d ) , it is evident from this study that when P e / f ' A > 0.35 care should be taken when uling She quantity of Grade 38 0 confining steel for columns calculated according to Eqn s . 1 to 4. The study also provided a simple solution to this problem. It was found that for columns with P e / f \ A > 0.35, in order to maintain a similar marefin of safety against fracture for Grade 275 and Grade 380 transverse confining reinforcem e n t , the term f , in Eqns. 1 to 4 should be replaced by 2¥§/f , / 2 7 5 . In effect this means that in E^ns. 1 to 4 when Grade 275 confining steel is used f ^ remains at 27 5 M P a , but wh e n Grade 38 0 confining steel is used f , should be taken as 275/380/275 =
CONCLUSIONS
1. Tests conducted on six reinforced concrete columns subjected to uniform monotonic compression loading, with spiral reinforcement from either Grade 275 or Grade 380 steel, demonstrated that the longitudinal stress-strain relation for the confined concrete is identical if the.
confining pressure is the same. That i s , the quantity of Grade 38 0 spiral steel required to produce the same confinement is smaller, being 275/3 80 times the quantity of Grade 275 spiral steel, as is assumed in the equations recommended by the New Zealand concrete design code. However the tests also confirmed the prediction of the "energy balance" method that the ultimate longitudinal concrete compression strain of code-designed columns, when first fracture of the spiral steel occurs,is reduced if Grade 380 spiral steel is used instead of Grade 27 5 spiral steel. This is because the reduced quantity of Grade 38 0 spiral steel has a smaller capacity to absorb strain energy from the core concrete.
2. Tests conducted on four reinforced concrete columns subjected to combined axial compression and cyclic lateral loading, with transverse reinforcement from either Grade 38 0 steel spirals or rectangular h o o p s , showed that the ultimate curvatures available at the plastic hinge sections were only affected by this smaller capacity to absorb strain energy when the axial load was relatively high. Based on data from these and other column tests, and on theoretical cyclic m o m e n t -curvature analyses, it was found that columns containing the quantity of Grade 38 0 confining steel recommended by the New Zealand concrete design code could achieve an imposed curvature history of four symmetrical cycles to a curvature ductility factor of ± 20 without fracture of the transverse reinforcement if the axial load

114
level P /f'A was not greater than about 0.35. e F o r columns with P /f'A > 0.35, to
e e g maintain a similar safety against fracture for Grade 275 and Grade 380 transverse reinforcement, the term f ^ in the code equations for confining s¥eel should be replaced by 2 7 5 / f y h / 2 7 5 . ACKNOWLEDGEMENT S
This study was conducted by Dr. F.A. Zahn during his PhD research at the University of Canterbury under the supervision of Professor R. Park and Dr. M.J.N. Priestley. Thanks are due to the Road Research Unit of the National Roads Board, the Ministry of Works and Development and the University of Canterbury for financial support during this project.
REFERENCES
[1] "Code of Practice for the Design of Concrete Structures NZS 3101 Part 1: 19 8 2 " and "Commentary on the Design of Concrete Structures NZS 3101 Part 2: 1 9 8 2 " , Standards Association of New Zealand, Wellington, 1982.
[2] "Recommended Lateral Force Requirements and Commentary", Seismology Committee, Structural Engineers Association of California, San Francisco, 1975.
[3] Park, R. and Paulay, T., "Reinforced Concrete Structures", John Wiley, New York, 1975, p.769.
[4] Park, R. and Leslie, P.D., "Curvature Ductility of Circular Reinforced Concrete Columns Confined by the ACI Spiral", 6th Australasian Conference on the Mechanics of Structures and Materials, Vol. 1 : Technical Papers, Christchurch, New Zealand, August 1977, pp.342-349.
[5] Park, R., Priestley, M.J.N., G i l l , W.D. and Potangaroa, R.T., "Ductility and Strength of Reinforced Concrete Columns With Spirals or Hoops Under Seismic Loading", Proceedings of 7th World Conference on Earthquake Engineering, V o l . 7, Istanbul, September 198 0, pp.15-22.
[6] Zahn, F.A., Park, R. and Priestley, M.J.N., "Design of Reinforced Concrete Bridge Columns for Strength and Ductility", Research Report 8 6 - 7 , Department of Civil Engineering, University of Canterbury, March 198 6, p.330 plus appendices.
[7] Mander, J.B., Priestley, M.J.N, and Park, R., "Seismic Design of Bridge P i e r s " , Research Report 8 4 - 2 , Department of Civil Engineering, University of Canterbury, February 198 4, p.442 plus appendices.
[8] "Building Code Requirements for Reinforced Concrete, ACI 318-83", American Concrete Institute, Detroit, 1983.
sh
sp
[9] Priestley, M.J.N, and Park, R., "Strength and Ductility of Bridge Substructures", Bulletin 7 1 , Road Research U n i t , National Roads Board, Wellington, 1984, p.120.
[10] Ang Beng G h e e , Priestley, M.J.N, and Park, R., "Ductility of Reinforced Concrete Bridge Piers Under Seismic Loading", Department of Civil Engineering, University of Canterbury, 1981, p.109 plus appendices.
NOTATION
area of transverse bar area of concrete core of column measured to the outside of the perimeter hoop or spiral gross area of concrete section of column total area of longitudinal reinforcement total area of rectangular hoops and supplementary cross ties in one direction of the column cross section within hoop spacing s^ area of spiral bar reinforcing bar diameter diameter of confined concrete core of a circular or octagonal column measured to the centre line of the spiral or circular hoop initial Young's modulus of elasticity for concrete longitudinal stress in confined or unconfined concrete longitudinal stress in confined concrete longitudinal stress in unconfined concrete compressive strength of concrete determined from 200 m m high x 100 mm diameter cylinders strength of confined concrete
= in situ unconfined concrete strength of test unit
= effective lateral confining pressure on concrete
= stress in longitudinal reinforcing bar
= stress in transverse reinforcing bar = yield strength of longitudinal
reinforcement yield strength of transverse reinforcement height from point of contraflexure to middle of central stub of column unit dimension of concrete core of column section measured perpendicular to the direction of the hoop bars considered and to the outside of the perimeter hoop confinement effectiveness coefficient length of transverse bar in unit length of column
f 8
c
fcc

115