Embed Size (px)
Citation preview
Hydrological Sciences–Journal–des Sciences Hydrologiques, 49(1) February 2004
Open for discussion until 1 August 2004
143
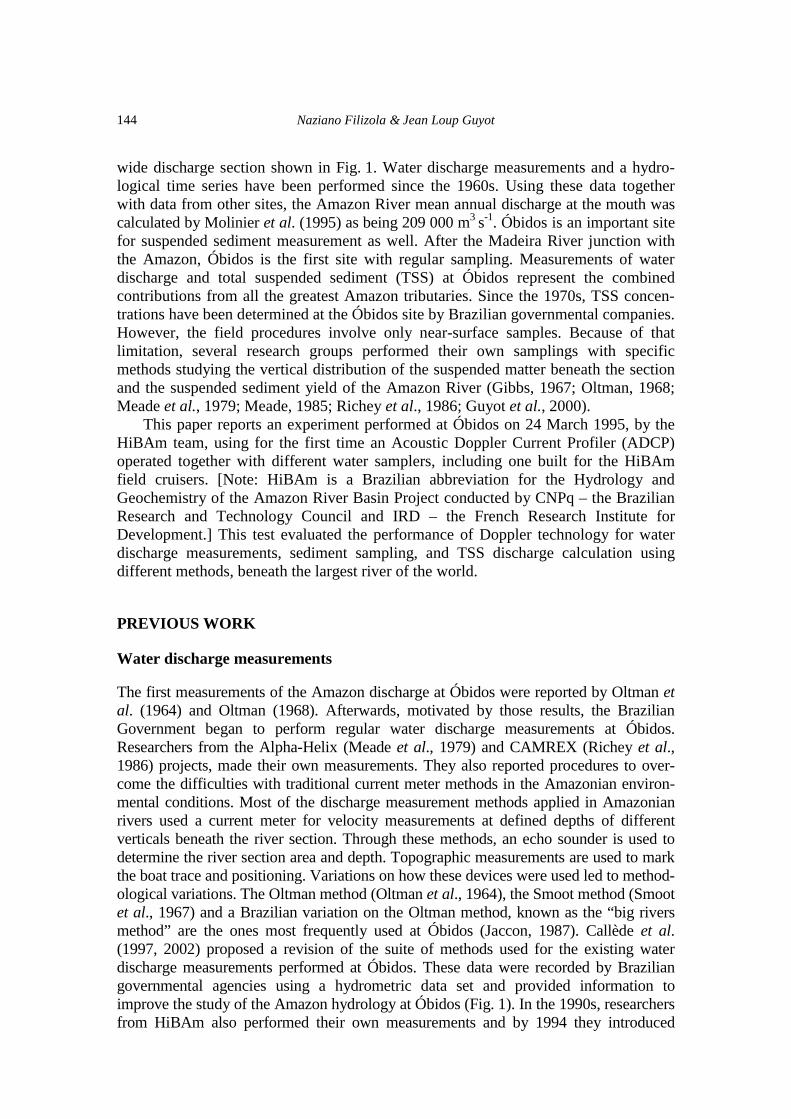
The use of Doppler technology for suspended sediment discharge determination in the River Amazon NAZIANO FILIZOLA Bolsista CAPES, Brasília, DF, Brazil and IRD – UMR LMTG, Université Paul Sabatier, F-31000 Toulouse, France [email protected] JEAN LOUP GUYOT IRD – UMR LMTG, Université Paul Sabatier, F-31000 Toulouse, France Abstract An experiment on water discharge gauging and suspended sediment sampling performed in the Amazon River basin on 24 March 1995, during a rising-water period is described. The experiment involved different devices, including an Acoustic Doppler Current Profiler (ADCP) for water discharge measurements. From the different samplers used, one specially built for the HiBAm project was tested successfully. An attempted use of the relationship between the ADCP signal and the total suspended sediment (TSS) was performed for sediment yield calculations. Different calculation methods were used with the TSS data obtained by the samplers and the results are discussed. The mean water discharge (Q) and TSS sediment yield (Qs) results were 172 400 m3 s-1 and 3.15 × 10⁶ t day-1, respectively. A relationship between the Qs value at depth and the surface Qs value is also proposed. Key words suspended sediment; hydrology; Amazon basin; Brazil
L’utilisation des techniques Doppler pour la détermination du transport solide de l’Amazone Résumé Dans cet article, nous décrivons une expérience de jaugeage des débits et d’échantillonnage des matières en suspension effectuée dans le bassin du fleuve Amazone, le 24 mars 1995, durant une période de montée des eaux. Nous avons utilisé différents outils, notamment un ADCP (Acoustic Doppler Current Profiler) pour mesurer les débits. L’un des échantillonneurs utilisés, mis au point dans le cadre du projet HiBAm, a été testé avec succès. Pour calculer la production de sédiments, nous avons tenté d’utiliser la relation qui existe entre le signal de l’ADCP et la charge totale de matières en suspension (MES). Différentes méthodes de calcul ont été appliquées aux données de MES obtenues avec les échantillonneurs, et les résultats sont discutés ici. Le débit moyen (Q) et la production moyenne de MES (Qs) obtenus sont respectivement de 172 400 m3 s-1 et de 3.15 × 10⁶ t jour-1. Une relation entre les valeurs de Qs en profondeur et en surface est également proposée. Mots clefs matière en suspension; hydrologie; bassin de l’Amazone; Brésil
INTRODUCTION The Amazon River basin is 6 × 10⁶ km2 in area. At Óbidos, a city of ~40 000 inhabitants on the Amazon, ~800 km from the mouth, there is a hydrometric station which controls almost 80% (4.8 × 10⁶ km2) of the total Amazon River basin area, and also 80% (163 000 m3 s-1) of its total water discharge, being the highest discharge value in the world. Water levels at Óbidos have been measured since 1903. However, there were occasional interruptions due to installation of new gauges at different times (Callède et al., 1997). This paper refers to the three Óbidos gauge sites and the 2300-m
Naziano Filizola & Jean Loup Guyot
144
wide discharge section shown in Fig. 1. Water discharge measurements and a hydro-logical time series have been performed since the 1960s. Using these data together with data from other sites, the Amazon River mean annual discharge at the mouth was calculated by Molinier et al. (1995) as being 209 000 m3 s-1. Óbidos is an important site for suspended sediment measurement as well. After the Madeira River junction with the Amazon, Óbidos is the first site with regular sampling. Measurements of water discharge and total suspended sediment (TSS) at Óbidos represent the combined contributions from all the greatest Amazon tributaries. Since the 1970s, TSS concen-trations have been determined at the Óbidos site by Brazilian governmental companies. However, the field procedures involve only near-surface samples. Because of that limitation, several research groups performed their own samplings with specific methods studying the vertical distribution of the suspended matter beneath the section and the suspended sediment yield of the Amazon River (Gibbs, 1967; Oltman, 1968; Meade et al., 1979; Meade, 1985; Richey et al., 1986; Guyot et al., 2000). This paper reports an experiment performed at Óbidos on 24 March 1995, by the HiBAm team, using for the first time an Acoustic Doppler Current Profiler (ADCP) operated together with different water samplers, including one built for the HiBAm field cruisers. [Note: HiBAm is a Brazilian abbreviation for the Hydrology and Geochemistry of the Amazon River Basin Project conducted by CNPq – the Brazilian Research and Technology Council and IRD – the French Research Institute for Development.] This test evaluated the performance of Doppler technology for water discharge measurements, sediment sampling, and TSS discharge calculation using different methods, beneath the largest river of the world. PREVIOUS WORK Water discharge measurements The first measurements of the Amazon discharge at Óbidos were reported by Oltman et al. (1964) and Oltman (1968). Afterwards, motivated by those results, the Brazilian Government began to perform regular water discharge measurements at Óbidos. Researchers from the Alpha-Helix (Meade et al., 1979) and CAMREX (Richey et al., 1986) projects, made their own measurements. They also reported procedures to over-come the difficulties with traditional current meter methods in the Amazonian environ-mental conditions. Most of the discharge measurement methods applied in Amazonian rivers used a current meter for velocity measurements at defined depths of different verticals beneath the river section. Through these methods, an echo sounder is used to determine the river section area and depth. Topographic measurements are used to mark the boat trace and positioning. Variations on how these devices were used led to method-ological variations. The Oltman method (Oltman et al., 1964), the Smoot method (Smoot et al., 1967) and a Brazilian variation on the Oltman method, known as the “big rivers method” are the ones most frequently used at Óbidos (Jaccon, 1987). Callède et al. (1997, 2002) proposed a revision of the suite of methods used for the existing water discharge measurements performed at Óbidos. These data were recorded by Brazilian governmental agencies using a hydrometric data set and provided information to improve the study of the Amazon hydrology at Óbidos (Fig. 1). In the 1990s, researchers from HiBAm also performed their own measurements and by 1994 they introduced
Purús
Ma
de
ira
Tapajós
Ja
pu
r áNe
gr o
Branco
I çá
So
l im
õe
s
Th
e A
ma
zo
n
Xingu
080°
00'0
0"07
0°00
'00"
W06
0°00
'00"
050°
00'0
0"W
20°0
0'00"
S
10°0
0'00"
S
00°0
0'00"
090
0Kil
omete
rs
#Y
Óbi
dos
080°
00'0
0"05
0°00
'00"
W06
0°00
'00"
070°
00'0
0"W
00°0
0'00"
10°0
0'00"
S
20°0
0'00"
S
The
city
of
Ó
bido
s
The
Riv
er A
maz
on a
t Óbi
dos
The
Am
azon
Fi
g. 1
The
Riv
er A
maz
on a
t Óbi
dos
with
the
thre
e ga
ugin
g st
atio
ns, o
ne a
t the
city
har
bour
, one
ups
tream
at t
he te
lem
etric
sta
tion
and
anot
her
at th
e di
scha
rge
mea
sure
men
t sec
tion.
Use of Doppler technology for suspended sediment discharge determination 145
Naziano Filizola & Jean Loup Guyot
146
Doppler technology, with good results, as a way to improve the water discharge measurements (Guyot et al., 1998). The ADCP provided a new input to the Óbidos data series. With that system, the area, the velocity and the boat trace and positioning determinations are incorporated into the same equipment. The old time-consuming methods (more than 12 h) can be replaced by a half-hour procedure. TSS discharge experiments at Óbidos Gibbs (1967) was the first to publish a study including suspended-sediment sample concentrations for the River Amazon. However, most of the samples were collected near the water surface. After Gibbs, Oltman (1968) published the results of some suspended-sediment sampling procedures, carried out during reconnaissance investigations of the Amazon River’s discharge and water quality. In his report, Oltman reveals that suspended-sediment samples were taken with a point sampler (US P-61), equipped with a 4.8 mm intake nozzle and an electronically controlled intake and closure valve, which were properly used at various depths in selected vertical profiles. Schmidt (1972) reported that, during one year (1969–1970), he collected a series of monthly samples always at the same point on the Amazon mainstream. However, Schmidt worked with samples collected from the river surface and without discharge data. Meade et al. (1979) collected samples for the Alpha Helix Project at several points during the 1976 and 1977 high-water seasons, from the Amazon River mainstream between Iquitos (Peru) and the Amazon River mouth (Brazil), and also from the lower reaches of most of its major tributaries. The suspended sediment was collected to depth by a point sampler or by a depth-integrating sampler, and sometimes near the surface, with a bucket or with a bottle dipped into the river. The point-integrating sampler used was a US P-63 (Guy & Norman, 1976) adapted to the Amazonian rivers’ environmental conditions. The depth-integrating sampler used was a special unit developed by the US Geological Survey consisting of a streamlined nose cone fitted with standard sampling nozzles and fastened to a frame which holds a 7.5-litre plastic jug. The concentrations where determined by weighing the sediment caught on sieves and membrane filters. From 1982 to 1984, researchers on the Carbon in the Amazon River Experiment (CAMREX) project collected a series of samples, as reported by Meade (1985). Such samples were depth-integrated composites and two basic strategies were used to obtain them. Monthly sampling was carried out at the same point as reported by Schmidt (op. cit.), but with a water discharge determination (Richey et al., 1986) and field cruisers (four times a year) including high- and low-water periods. For sampling, Meade (1985) used a collapsible-bag sampler adapted with a nozzle being tapered to ensure isokinetic sampling. The sampling procedure was basically the equal-width-increment or the equal-transit-rate method described by Guy & Norman (1976). To process the samples, they used Millipore type (HA, 0.45 µm) filters for frontal filtration. METHODS Discharge measurements For this experiment, a 300 kHz ADCP with Transect software, both from RD Instruments, was used. The ADCP uses the Doppler effect by transmitting sound at a
Use of Doppler technology for suspended sediment discharge determination
147
fixed frequency and listening to the echoes returning from sound scatterers in the water (RD Instruments, 1996). These sound scatterers are small particles, in suspension, that reflect the sound back to the ADCP. This backscatter is used by the ADCP to calculate the water discharge. To do this, it divides the river section into numerous virtual cells with a pre-defined area, configured by the user according to environmental conditions, where the equipment measures current velocities. The ADCP also gives the bottom section profile with depth measurements, length, current direction and backscatter signal values. The software enables one to follow the gauging procedures in real time, and to export raw data to be compared with other parameters obtained over the section. Additional information about ADCP techniques and data corrections is given in Simpson & Oltman (1993) and Callède et al. (2000). For this experiment at Óbidos, four water discharge measurements were carried out; two were achieved from the right to the left bank and two from the left to the right bank. The boat trace was oriented by targets installed on the river banks as a reference, as the ADCP software calculates and indicates it in real-time as well. The final discharge value was calculated using the mean value and the moving bottom error correction method proposed by Callède et al. (2000). Sampling procedures Three types of sampler were used: I an 8-litre collapsible bag sampler, like that used by Meade (1985); II a Brazilian model, like the US P-63 in shape, but adapted to Amazonian
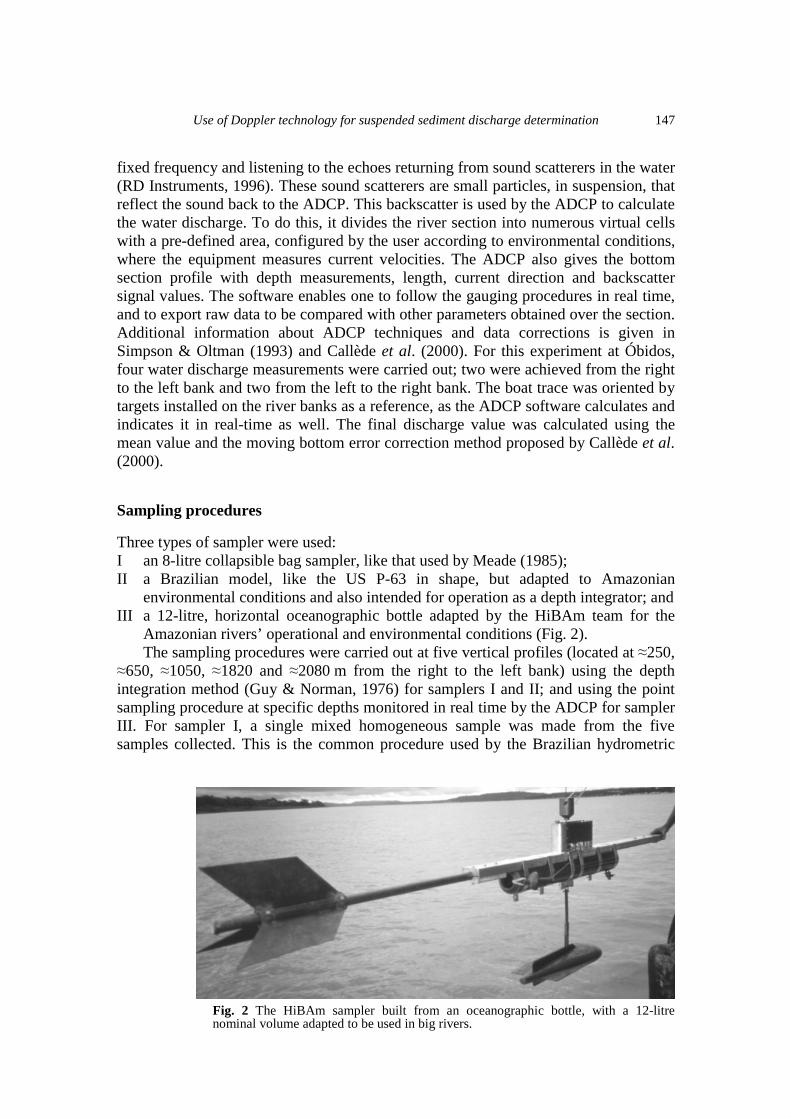
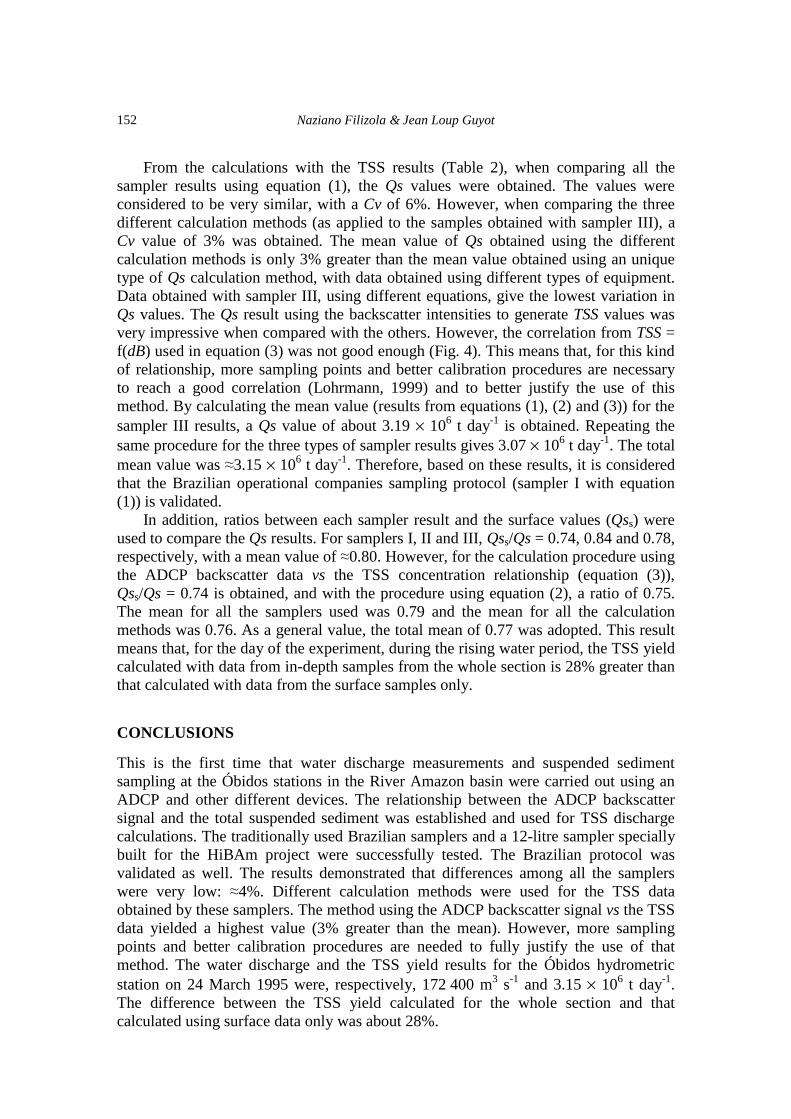
environmental conditions and also intended for operation as a depth integrator; and III a 12-litre, horizontal oceanographic bottle adapted by the HiBAm team for the
Amazonian rivers’ operational and environmental conditions (Fig. 2). The sampling procedures were carried out at five vertical profiles (located at ≈250, ≈650, ≈1050, ≈1820 and ≈2080 m from the right to the left bank) using the depth integration method (Guy & Norman, 1976) for samplers I and II; and using the point sampling procedure at specific depths monitored in real time by the ADCP for sampler III. For sampler I, a single mixed homogeneous sample was made from the five samples collected. This is the common procedure used by the Brazilian hydrometric
Fig. 2 The HiBAm sampler built from an oceanographic bottle, with a 12-litre nominal volume adapted to be used in big rivers.
Naziano Filizola & Jean Loup Guyot
148
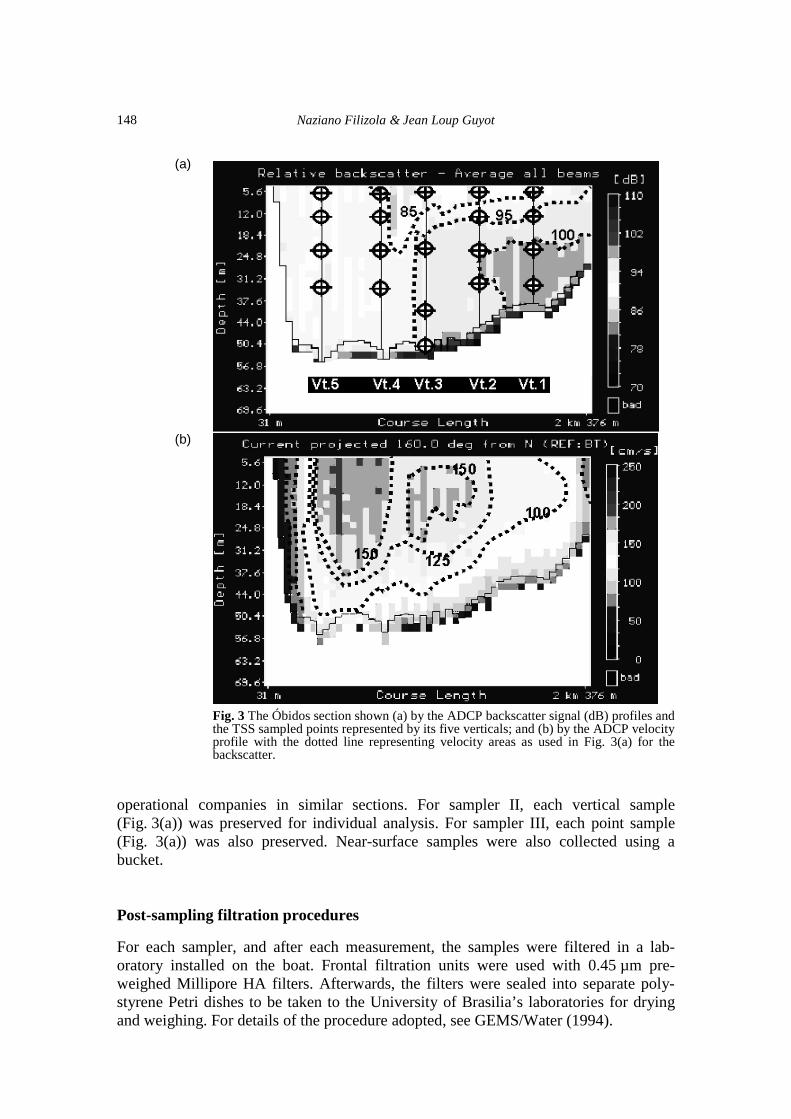
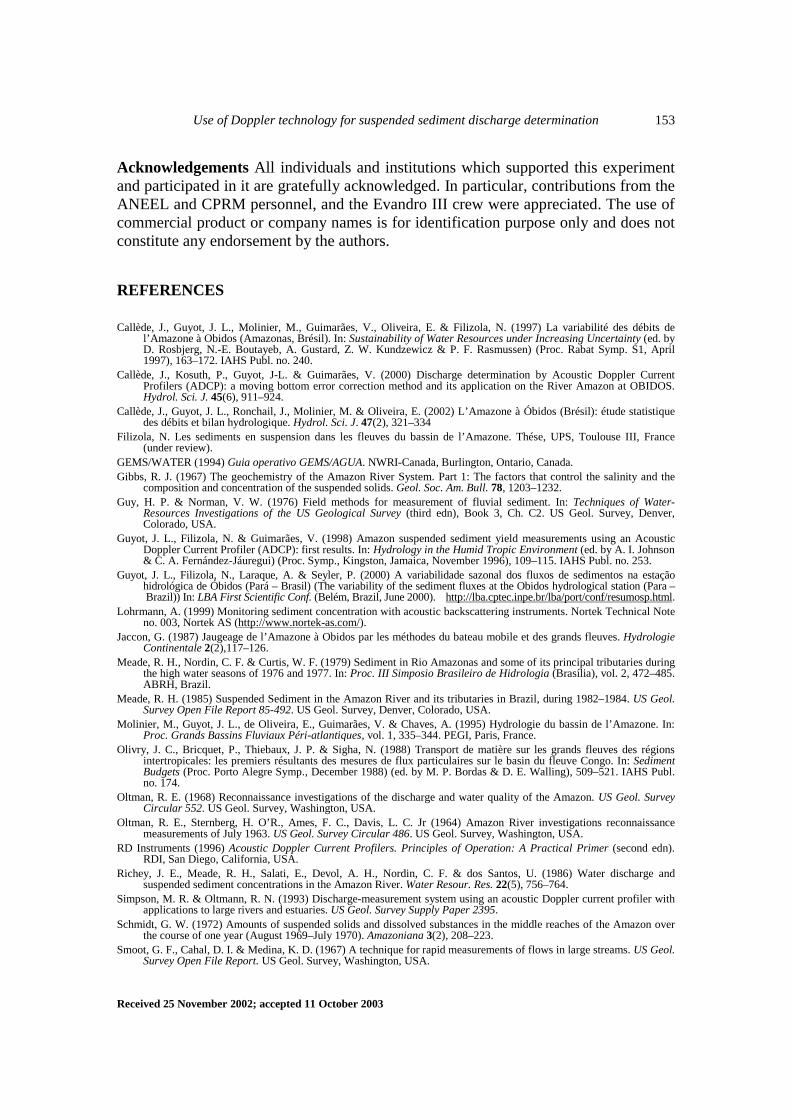
Fig. 3 The Óbidos section shown (a) by the ADCP backscatter signal (dB) profiles and the TSS sampled points represented by its five verticals; and (b) by the ADCP velocity profile with the dotted line representing velocity areas as used in Fig. 3(a) for the backscatter.
operational companies in similar sections. For sampler II, each vertical sample (Fig. 3(a)) was preserved for individual analysis. For sampler III, each point sample (Fig. 3(a)) was also preserved. Near-surface samples were also collected using a bucket. Post-sampling filtration procedures For each sampler, and after each measurement, the samples were filtered in a lab-oratory installed on the boat. Frontal filtration units were used with 0.45 µm pre-weighed Millipore HA filters. Afterwards, the filters were sealed into separate poly-styrene Petri dishes to be taken to the University of Brasilia’s laboratories for drying and weighing. For details of the procedure adopted, see GEMS/Water (1994).
(b)
(a)
Use of Doppler technology for suspended sediment discharge determination
149
TSS yield calculation Using the water discharge and the TSS concentrations, suspended solids discharge calculations were carried out as follows: For the mean TSS discharge calculations, involving all the samplers, the following equation was used:
Qs = Q[TSS] c (1) where Qs is the total suspended sediment discharge calculated for each set of samples from each device, Q is the mean of the four ADCP discharge measurements, [TSS] is the mean of all the suspended sediment concentrations obtained over the section by each sampler, and c is the conversion factor to obtain t day-1. The TSS discharge was also obtained by calculating the water velocity at each TSS collection point, using the ADCP velocity data as described below:
� � ⋅=L P
plVTSSQs0 0
dd
(2)
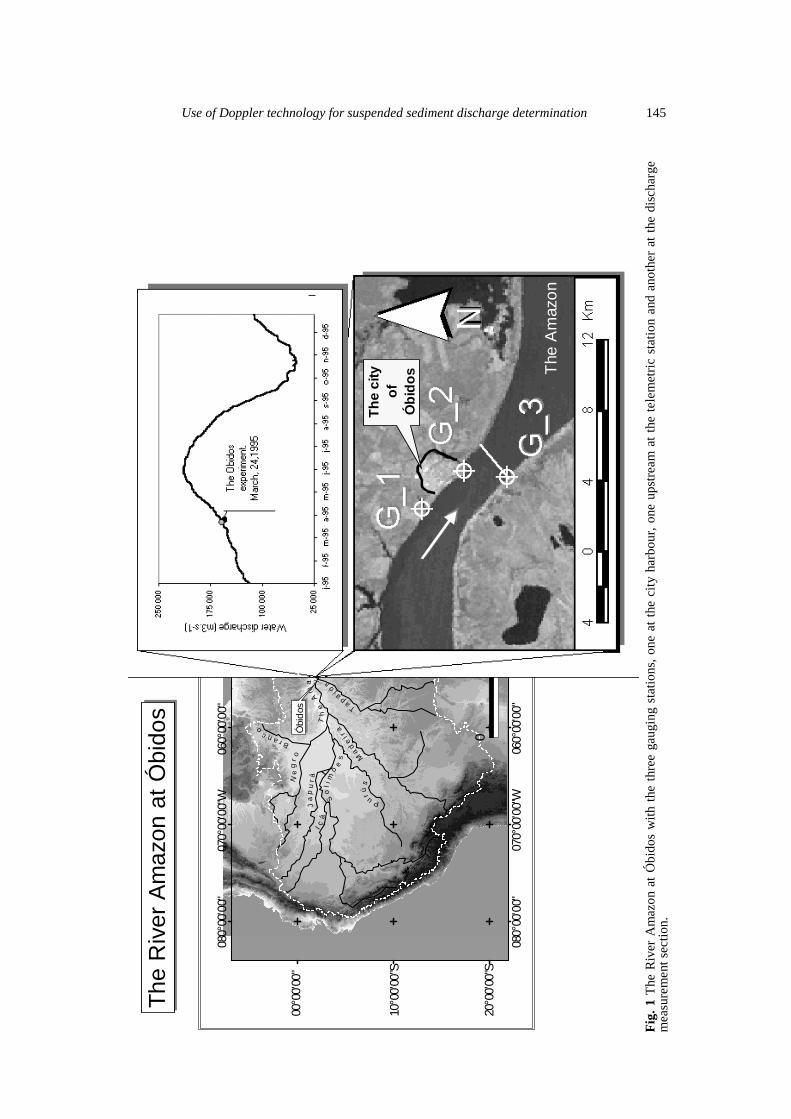
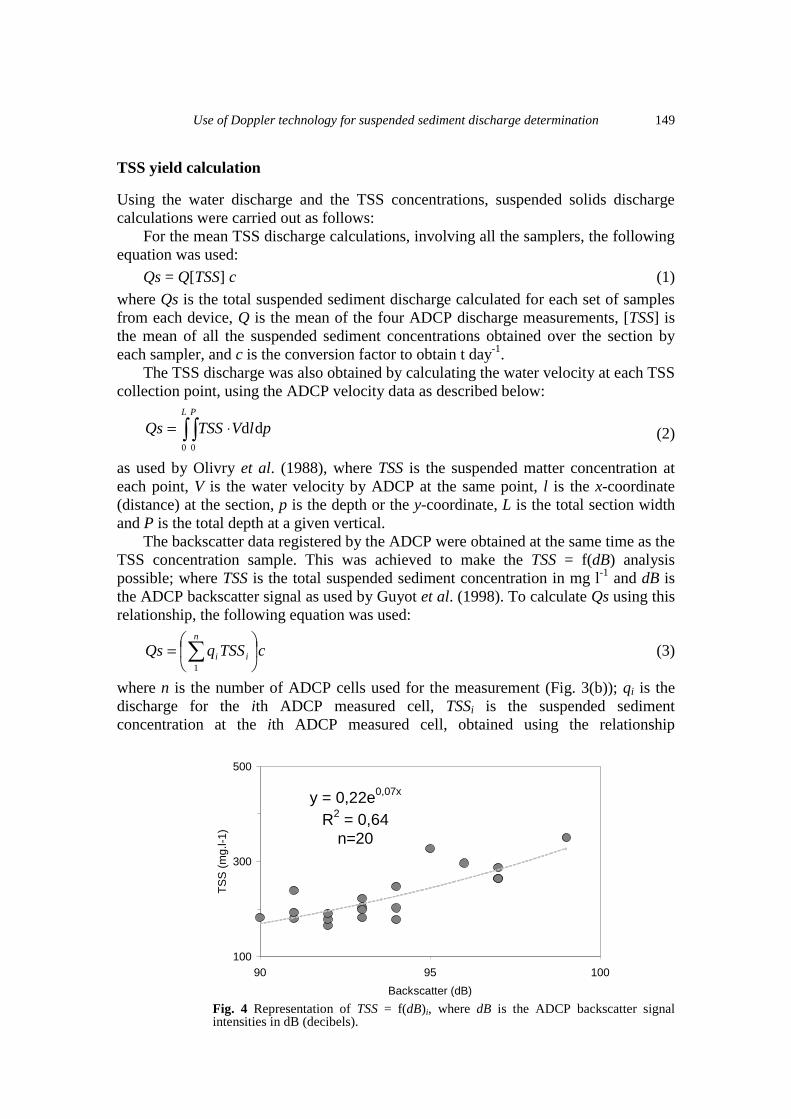
as used by Olivry et al. (1988), where TSS is the suspended matter concentration at each point, V is the water velocity by ADCP at the same point, l is the x-coordinate (distance) at the section, p is the depth or the y-coordinate, L is the total section width and P is the total depth at a given vertical. The backscatter data registered by the ADCP were obtained at the same time as the TSS concentration sample. This was achieved to make the TSS = f(dB) analysis possible; where TSS is the total suspended sediment concentration in mg l-1 and dB is the ADCP backscatter signal as used by Guyot et al. (1998). To calculate Qs using this relationship, the following equation was used:
cTSSqQsn
ii ��
���
�= �1
(3)
where n is the number of ADCP cells used for the measurement (Fig. 3(b)); qi is the discharge for the ith ADCP measured cell, TSSi is the suspended sediment concentration at the ith ADCP measured cell, obtained using the relationship
y = 0,22e0,07x
R2 = 0,64n=20
100
300
500
90 95 100Backscatter (dB)
TSS
(mg.
l-1)
Fig. 4 Representation of TSS = f(dB)i, where dB is the ADCP backscatter signal intensities in dB (decibels).
Naziano Filizola & Jean Loup Guyot
150
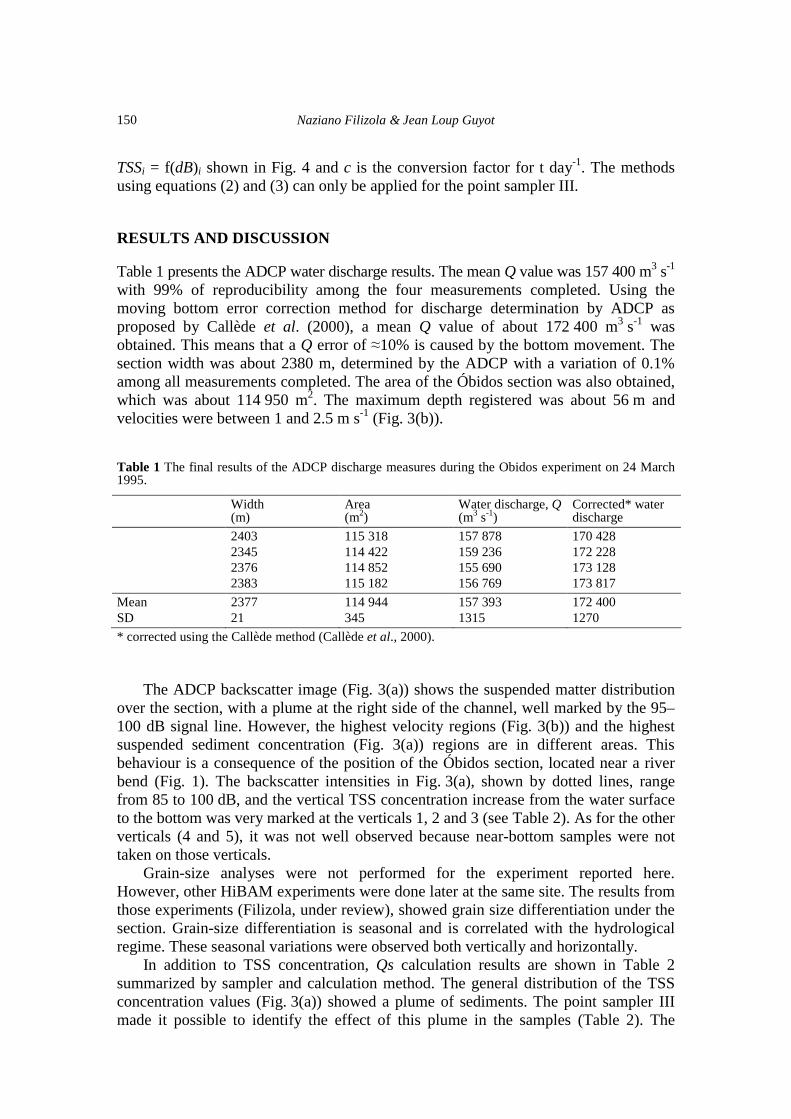
TSSi = f(dB)i shown in Fig. 4 and c is the conversion factor for t day-1. The methods using equations (2) and (3) can only be applied for the point sampler III. RESULTS AND DISCUSSION Table 1 presents the ADCP water discharge results. The mean Q value was 157 400 m3 s-1 with 99% of reproducibility among the four measurements completed. Using the moving bottom error correction method for discharge determination by ADCP as proposed by Callède et al. (2000), a mean Q value of about 172 400 m3 s-1 was obtained. This means that a Q error of ≈10% is caused by the bottom movement. The section width was about 2380 m, determined by the ADCP with a variation of 0.1% among all measurements completed. The area of the Óbidos section was also obtained, which was about 114 950 m2. The maximum depth registered was about 56 m and velocities were between 1 and 2.5 m s-1 (Fig. 3(b)). Table 1 The final results of the ADCP discharge measures during the Obidos experiment on 24 March 1995.
Width (m)
Area (m2)
Water discharge, Q (m3 s-1)
Corrected* water discharge
2403 115 318 157 878 170 428 2345 114 422 159 236 172 228 2376 114 852 155 690 173 128 2383 115 182 156 769 173 817 Mean 2377 114 944 157 393 172 400 SD 21 345 1315 1270 * corrected using the Callède method (Callède et al., 2000). The ADCP backscatter image (Fig. 3(a)) shows the suspended matter distribution over the section, with a plume at the right side of the channel, well marked by the 95–100 dB signal line. However, the highest velocity regions (Fig. 3(b)) and the highest suspended sediment concentration (Fig. 3(a)) regions are in different areas. This behaviour is a consequence of the position of the Óbidos section, located near a river bend (Fig. 1). The backscatter intensities in Fig. 3(a), shown by dotted lines, range from 85 to 100 dB, and the vertical TSS concentration increase from the water surface to the bottom was very marked at the verticals 1, 2 and 3 (see Table 2). As for the other verticals (4 and 5), it was not well observed because near-bottom samples were not taken on those verticals. Grain-size analyses were not performed for the experiment reported here. However, other HiBAM experiments were done later at the same site. The results from those experiments (Filizola, under review), showed grain size differentiation under the section. Grain-size differentiation is seasonal and is correlated with the hydrological regime. These seasonal variations were observed both vertically and horizontally. In addition to TSS concentration, Qs calculation results are shown in Table 2 summarized by sampler and calculation method. The general distribution of the TSS concentration values (Fig. 3(a)) showed a plume of sediments. The point sampler III made it possible to identify the effect of this plume in the samples (Table 2). The
Use of Doppler technology for suspended sediment discharge determination
151
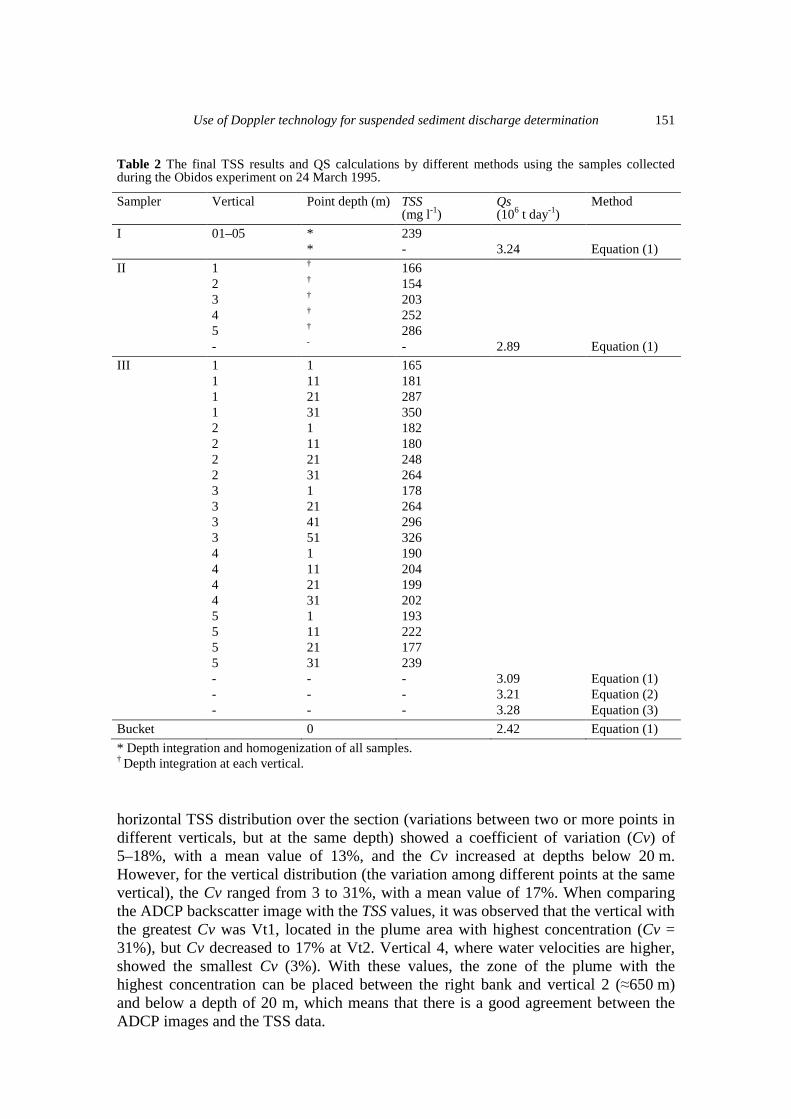
Table 2 The final TSS results and QS calculations by different methods using the samples collected during the Obidos experiment on 24 March 1995.
Sampler Vertical Point depth (m) TSS (mg l-1)
Qs (106 t day-1)
Method
I 01–05 * 239 * - 3.24 Equation (1) II 1 † 166 2 † 154 3 † 203 4 † 252 5 † 286 - - - 2.89 Equation (1) III 1 1 165 1 11 181 1 21 287 1 31 350 2 1 182 2 11 180 2 21 248 2 31 264 3 1 178 3 21 264 3 41 296 3 51 326 4 1 190 4 11 204 4 21 199 4 31 202 5 1 193 5 11 222 5 21 177 5 31 239 - - - 3.09 Equation (1) - - - 3.21 Equation (2) - - - 3.28 Equation (3) Bucket 0 2.42 Equation (1) * Depth integration and homogenization of all samples. † Depth integration at each vertical.
horizontal TSS distribution over the section (variations between two or more points in different verticals, but at the same depth) showed a coefficient of variation (Cv) of 5–18%, with a mean value of 13%, and the Cv increased at depths below 20 m. However, for the vertical distribution (the variation among different points at the same vertical), the Cv ranged from 3 to 31%, with a mean value of 17%. When comparing the ADCP backscatter image with the TSS values, it was observed that the vertical with the greatest Cv was Vt1, located in the plume area with highest concentration (Cv = 31%), but Cv decreased to 17% at Vt2. Vertical 4, where water velocities are higher, showed the smallest Cv (3%). With these values, the zone of the plume with the highest concentration can be placed between the right bank and vertical 2 (≈650 m) and below a depth of 20 m, which means that there is a good agreement between the ADCP images and the TSS data.
Naziano Filizola & Jean Loup Guyot
152
From the calculations with the TSS results (Table 2), when comparing all the sampler results using equation (1), the Qs values were obtained. The values were considered to be very similar, with a Cv of 6%. However, when comparing the three different calculation methods (as applied to the samples obtained with sampler III), a Cv value of 3% was obtained. The mean value of Qs obtained using the different calculation methods is only 3% greater than the mean value obtained using an unique type of Qs calculation method, with data obtained using different types of equipment. Data obtained with sampler III, using different equations, give the lowest variation in Qs values. The Qs result using the backscatter intensities to generate TSS values was very impressive when compared with the others. However, the correlation from TSS = f(dB) used in equation (3) was not good enough (Fig. 4). This means that, for this kind of relationship, more sampling points and better calibration procedures are necessary to reach a good correlation (Lohrmann, 1999) and to better justify the use of this method. By calculating the mean value (results from equations (1), (2) and (3)) for the sampler III results, a Qs value of about 3.19 × 10⁶ t day-1 is obtained. Repeating the same procedure for the three types of sampler results gives 3.07 × 10⁶ t day-1. The total mean value was ≈3.15 × 10⁶ t day-1. Therefore, based on these results, it is considered that the Brazilian operational companies sampling protocol (sampler I with equation (1)) is validated. In addition, ratios between each sampler result and the surface values (Qss) were used to compare the Qs results. For samplers I, II and III, Qss/Qs = 0.74, 0.84 and 0.78, respectively, with a mean value of ≈0.80. However, for the calculation procedure using the ADCP backscatter data vs the TSS concentration relationship (equation (3)), Qss/Qs = 0.74 is obtained, and with the procedure using equation (2), a ratio of 0.75. The mean for all the samplers used was 0.79 and the mean for all the calculation methods was 0.76. As a general value, the total mean of 0.77 was adopted. This result means that, for the day of the experiment, during the rising water period, the TSS yield calculated with data from in-depth samples from the whole section is 28% greater than that calculated with data from the surface samples only. CONCLUSIONS This is the first time that water discharge measurements and suspended sediment sampling at the Óbidos stations in the River Amazon basin were carried out using an ADCP and other different devices. The relationship between the ADCP backscatter signal and the total suspended sediment was established and used for TSS discharge calculations. The traditionally used Brazilian samplers and a 12-litre sampler specially built for the HiBAm project were successfully tested. The Brazilian protocol was validated as well. The results demonstrated that differences among all the samplers were very low: ≈4%. Different calculation methods were used for the TSS data obtained by these samplers. The method using the ADCP backscatter signal vs the TSS data yielded a highest value (3% greater than the mean). However, more sampling points and better calibration procedures are needed to fully justify the use of that method. The water discharge and the TSS yield results for the Óbidos hydrometric station on 24 March 1995 were, respectively, 172 400 m3 s-1 and 3.15 × 10⁶ t day-1. The difference between the TSS yield calculated for the whole section and that calculated using surface data only was about 28%.
Use of Doppler technology for suspended sediment discharge determination
153
Acknowledgements All individuals and institutions which supported this experiment and participated in it are gratefully acknowledged. In particular, contributions from the ANEEL and CPRM personnel, and the Evandro III crew were appreciated. The use of commercial product or company names is for identification purpose only and does not constitute any endorsement by the authors. REFERENCES Callède, J., Guyot, J. L., Molinier, M., Guimarães, V., Oliveira, E. & Filizola, N. (1997) La variabilité des débits de
l’Amazone à Obidos (Amazonas, Brésil). In: Sustainability of Water Resources under Increasing Uncertainty (ed. by D. Rosbjerg, N.-E. Boutayeb, A. Gustard, Z. W. Kundzewicz & P. F. Rasmussen) (Proc. Rabat Symp. S1, April 1997), 163–172. IAHS Publ. no. 240.
Callède, J., Kosuth, P., Guyot, J-L. & Guimarães, V. (2000) Discharge determination by Acoustic Doppler Current Profilers (ADCP): a moving bottom error correction method and its application on the River Amazon at OBIDOS. Hydrol. Sci. J. 45(6), 911–924.
Callède, J., Guyot, J. L., Ronchail, J., Molinier, M. & Oliveira, E. (2002) L’Amazone à Óbidos (Brésil): étude statistique des débits et bilan hydrologique. Hydrol. Sci. J. 47(2), 321–334
Filizola, N. Les sediments en suspension dans les fleuves du bassin de l’Amazone. Thése, UPS, Toulouse III, France (under review).
GEMS/WATER (1994) Guia operativo GEMS/AGUA. NWRI-Canada, Burlington, Ontario, Canada. Gibbs, R. J. (1967) The geochemistry of the Amazon River System. Part 1: The factors that control the salinity and the
composition and concentration of the suspended solids. Geol. Soc. Am. Bull. 78, 1203–1232. Guy, H. P. & Norman, V. W. (1976) Field methods for measurement of fluvial sediment. In: Techniques of Water-
Resources Investigations of the US Geological Survey (third edn), Book 3, Ch. C2. US Geol. Survey, Denver, Colorado, USA.
Guyot, J. L., Filizola, N. & Guimarães, V. (1998) Amazon suspended sediment yield measurements using an Acoustic Doppler Current Profiler (ADCP): first results. In: Hydrology in the Humid Tropic Environment (ed. by A. I. Johnson & C. A. Fernández-Jáuregui) (Proc. Symp., Kingston, Jamaica, November 1996), 109–115. IAHS Publ. no. 253.
Guyot, J. L., Filizola, N., Laraque, A. & Seyler, P. (2000) A variabilidade sazonal dos fluxos de sedimentos na estação hidrológica de Óbidos (Pará – Brasil) (The variability of the sediment fluxes at the Obidos hydrological station (Para – Brazil)) In: LBA First Scientific Conf. (Belém, Brazil, June 2000). http://lba.cptec.inpe.br/lba/port/conf/resumosp.html.
Lohrmann, A. (1999) Monitoring sediment concentration with acoustic backscattering instruments. Nortek Technical Note no. 003, Nortek AS (http://www.nortek-as.com/).
Jaccon, G. (1987) Jaugeage de l’Amazone à Obidos par les méthodes du bateau mobile et des grands fleuves. Hydrologie Continentale 2(2),117–126.
Meade, R. H., Nordin, C. F. & Curtis, W. F. (1979) Sediment in Rio Amazonas and some of its principal tributaries during the high water seasons of 1976 and 1977. In: Proc. III Simposio Brasileiro de Hidrologia (Brasília), vol. 2, 472–485. ABRH, Brazil.
Meade, R. H. (1985) Suspended Sediment in the Amazon River and its tributaries in Brazil, during 1982–1984. US Geol. Survey Open File Report 85-492. US Geol. Survey, Denver, Colorado, USA.
Molinier, M., Guyot, J. L., de Oliveira, E., Guimarães, V. & Chaves, A. (1995) Hydrologie du bassin de l’Amazone. In: Proc. Grands Bassins Fluviaux Péri-atlantiques, vol. 1, 335–344. PEGI, Paris, France.
Olivry, J. C., Bricquet, P., Thiebaux, J. P. & Sigha, N. (1988) Transport de matière sur les grands fleuves des régions intertropicales: les premiers résultants des mesures de flux particulaires sur le basin du fleuve Congo. In: Sediment Budgets (Proc. Porto Alegre Symp., December 1988) (ed. by M. P. Bordas & D. E. Walling), 509–521. IAHS Publ. no. 174.
Oltman, R. E. (1968) Reconnaissance investigations of the discharge and water quality of the Amazon. US Geol. Survey Circular 552. US Geol. Survey, Washington, USA.
Oltman, R. E., Sternberg, H. O’R., Ames, F. C., Davis, L. C. Jr (1964) Amazon River investigations reconnaissance measurements of July 1963. US Geol. Survey Circular 486. US Geol. Survey, Washington, USA.
RD Instruments (1996) Acoustic Doppler Current Profilers. Principles of Operation: A Practical Primer (second edn). RDI, San Diego, California, USA.
Richey, J. E., Meade, R. H., Salati, E., Devol, A. H., Nordin, C. F. & dos Santos, U. (1986) Water discharge and suspended sediment concentrations in the Amazon River. Water Resour. Res. 22(5), 756–764.
Simpson, M. R. & Oltmann, R. N. (1993) Discharge-measurement system using an acoustic Doppler current profiler with applications to large rivers and estuaries. US Geol. Survey Supply Paper 2395.
Schmidt, G. W. (1972) Amounts of suspended solids and dissolved substances in the middle reaches of the Amazon over the course of one year (August 1969–July 1970). Amazoniana 3(2), 208–223.
Smoot, G. F., Cahal, D. I. & Medina, K. D. (1967) A technique for rapid measurements of flows in large streams. US Geol. Survey Open File Report. US Geol. Survey, Washington, USA.
Received 25 November 2002; accepted 11 October 2003