Embed Size (px)
Citation preview
International Review of Law and Economics 26 (2006) 88–103
The use of consumption taxes to re-launchgreen tax reforms
Johan Albrecht ∗
Ghent University, Hoveniersberg 24, 9000 Ghent, Belgium
Abstract
Between 1995 and 2001, the share of green tax revenues in the EU-15 GDP slightly declined.This is a surprising evolution but there are, however, strong economic efficiency arguments to setenvironmental taxes at low levels, and hence below the Pigovian or marginal pollution damage level.This paper presents an alternative to re-launch the debate on green tax reform in Europe; consumptiontaxes that are differentiated according to the environmental impact of products. Given the long traditionof consumption taxes in Europe, this instrument requires less institutional innovations than emissiontaxes. We show that a pragmatic classification of products in a sustainable and hence low VAT categorycan strongly limit the economic costs of the tax reform while the price reduction for green productscan limit undesirable distributional consequences.© 2006 Elsevier Inc. All rights reserved.
JEL classification: H23; Q28
Keywords: Environmental taxes; Double dividend; Value added taxes
1. Introduction
In the latest decades many European governments declared to implement ambitious greentax reforms. Economic incentives make use of powerful market forces. Environmental taxespenalise the production and consumption of ‘bads’ while generating revenues that can offsetexisting taxes on ‘goods’ like labour. Higher prices for energy, wastes and environmental
∗ Tel.: +32 9 264 35 10; fax: +32 9 264 35 99.E-mail address: [email protected].
0144-8188/$ – see front matter © 2006 Elsevier Inc. All rights reserved.doi:10.1016/j.irle.2006.05.007
J. Albrecht / International Review of Law and Economics 26 (2006) 88–103 89
damages provide clear incentives for consumers and producers to search for technologiesthat can minimize or eliminate the environmental penalties. Compared to technical environ-mental regulation or the command-and-control approach, economic instruments can deliverstatic and dynamic efficiency gains (Royal Society, 2002; Tietenberg, 2003). An ecologicaltax reform is also the least bureaucratic, the least intrusive and arguably the most powerfulinstrument to make environmentally technologies more attractive (von Weizsacker, Lovins,and Lovins, 1997). This paper deals with the modest progress in the use of environmentaltaxes in Europe. As an alternative to existing energy and pollution taxes, a scheme withenvironmentally differentiated consumption taxes is presented.
2. The use of environmental taxes
Most European countries have a long tradition with respect to environmental taxes.Between 1980 and 2001, total environmental tax revenues in the European Union (EU-15)increased from 55 billion Euro to 238 billion Euro. The share of environmental taxes in totalrevenues from taxes and social contributions increased from 5.8% in 1980 to 6.5% in 2001.Since 1980, the share of environmental taxes in GDP first increased from 2.2 to 2.8% in 1995,to slightly fall back to 2.7% in 2001 (Eurostat, 2003a). The importance of environmentaltax revenues varies significantly across countries. Expressed as a share of GDP in 2001,environmental tax revenues are highest in Denmark (4.7%) and the Netherlands (3.8%).The relative importance of environmental taxes is lowest in France (2%) and Spain (2.2%).
Energy taxes are by far the most significant, representing more than three quarters ofenvironmental tax receipts in 2001. Energy taxes are high in most European countries –up to 80% of the final price for leaded and unleaded petrol – but could not prevent thatthe price of most energy products was stable in real terms between 1985 and 1996 (EEA,2001). Not surprisingly, the incentive from these energy taxes to save energy has been verymodest. Transport taxes account for 21% of total tax revenues (Eurostat, 2003a). Despitethe rhetoric about applying the Polluter Pays Principle (PPP), the relative importance oftaxes on pollution and resource use has been more or less stable over the last 10 years.
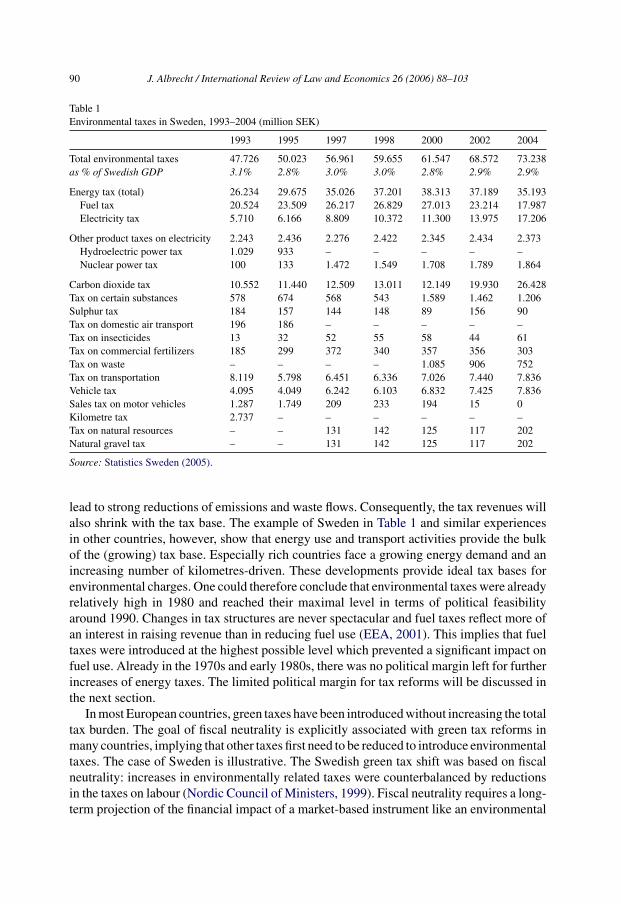
Table 1 gives an overview of the composition and evolution of environmental tax revenuesin Sweden between 1993 and 2004. In this pioneering country – Sweden is one of thefew countries with taxes on carbon and sulphur dioxide and with a general tax on naturalresources – the share of environmental taxes in GDP did fall from 3.1% in 1993 to 2.9% in2004.
In Sweden, the energy-related environmental taxes amount to 88% of total environmentaltax revenues. Table 1 shows that especially the tax on carbon dioxide emissions did lead tostrongly increasing tax revenues. Revenues from general transportation taxes did fall backin the recent years.
The reduced share of environmental revenues in GDP suggests that environmental taxesonly play a marginal role and that ambitious green taxation reforms have not yet beenimplemented. Environmental NGOs use this conclusion to ask for more ambitious greentax reforms. Environmental taxes can, however, be installed with the purpose to changebehaviour or with the purpose to collect revenues. With the former or regulatory taxes,decision makers will be influenced in their ecologically relevant behaviour and this can
90 J. Albrecht / International Review of Law and Economics 26 (2006) 88–103
Table 1Environmental taxes in Sweden, 1993–2004 (million SEK)
1993 1995 1997 1998 2000 2002 2004
Total environmental taxes 47.726 50.023 56.961 59.655 61.547 68.572 73.238as % of Swedish GDP 3.1% 2.8% 3.0% 3.0% 2.8% 2.9% 2.9%
Energy tax (total) 26.234 29.675 35.026 37.201 38.313 37.189 35.193Fuel tax 20.524 23.509 26.217 26.829 27.013 23.214 17.987Electricity tax 5.710 6.166 8.809 10.372 11.300 13.975 17.206
Other product taxes on electricity 2.243 2.436 2.276 2.422 2.345 2.434 2.373Hydroelectric power tax 1.029 933 – – – – –Nuclear power tax 100 133 1.472 1.549 1.708 1.789 1.864
Carbon dioxide tax 10.552 11.440 12.509 13.011 12.149 19.930 26.428Tax on certain substances 578 674 568 543 1.589 1.462 1.206Sulphur tax 184 157 144 148 89 156 90Tax on domestic air transport 196 186 – – – – –Tax on insecticides 13 32 52 55 58 44 61Tax on commercial fertilizers 185 299 372 340 357 356 303Tax on waste – – – – 1.085 906 752Tax on transportation 8.119 5.798 6.451 6.336 7.026 7.440 7.836Vehicle tax 4.095 4.049 6.242 6.103 6.832 7.425 7.836Sales tax on motor vehicles 1.287 1.749 209 233 194 15 0Kilometre tax 2.737 – – – – – –Tax on natural resources – – 131 142 125 117 202Natural gravel tax – – 131 142 125 117 202
Source: Statistics Sweden (2005).
lead to strong reductions of emissions and waste flows. Consequently, the tax revenues willalso shrink with the tax base. The example of Sweden in Table 1 and similar experiencesin other countries, however, show that energy use and transport activities provide the bulkof the (growing) tax base. Especially rich countries face a growing energy demand and anincreasing number of kilometres-driven. These developments provide ideal tax bases forenvironmental charges. One could therefore conclude that environmental taxes were alreadyrelatively high in 1980 and reached their maximal level in terms of political feasibilityaround 1990. Changes in tax structures are never spectacular and fuel taxes reflect more ofan interest in raising revenue than in reducing fuel use (EEA, 2001). This implies that fueltaxes were introduced at the highest possible level which prevented a significant impact onfuel use. Already in the 1970s and early 1980s, there was no political margin left for furtherincreases of energy taxes. The limited political margin for tax reforms will be discussed inthe next section.
In most European countries, green taxes have been introduced without increasing the totaltax burden. The goal of fiscal neutrality is explicitly associated with green tax reforms inmany countries, implying that other taxes first need to be reduced to introduce environmentaltaxes. The case of Sweden is illustrative. The Swedish green tax shift was based on fiscalneutrality: increases in environmentally related taxes were counterbalanced by reductionsin the taxes on labour (Nordic Council of Ministers, 1999). Fiscal neutrality requires a long-term projection of the financial impact of a market-based instrument like an environmental
J. Albrecht / International Review of Law and Economics 26 (2006) 88–103 91
tax. The chosen environmental tax level should ensure new and stable tax revenues tocompensate income tax reductions. This is a rather bureaucratic exercise but it can beessential to gain political support for the tax reform. Furthermore, budget considerationsdetermine the possibility of income tax reductions.
3. Green tax reforms and the double dividend
Several European countries declared to use the environmental tax revenues to reducelabour taxes. Environmental taxes would lead to a double dividend of less pollution andhigher employment growth from lower labour taxes. This tax reform would especiallyimprove the international competitiveness of industries that are relatively intensive in labour.In the EU-15, the average implicit tax rate1 on labour did fall from 37.5% in 1995 to37% in 2001. Labour income was most heavily taxed in 2001 in Sweden (49.1%), Finland(44.2%), Belgium (43.8%) and France (43.3%). Not surprisingly, some of these countries arecharacterised by persistent high unemployment figures and low activity rates, especially forolder people. Over the same period, the implicit tax rate on consumption did fall from 20.6 to20.4% while the implicit tax rate on capital increased from 24.5 to 29.8% (Eurostat, 2003b).
3.1. The economic cost of environmental taxes
In a perfect world, environmental taxes equal to the marginal social cost of pollutiondo internalize harmful externalities. The recent decline of the share of green taxes in GDPindicates that the political project of a green tax reform seems to be locked in stalemate.This can eventually be attributed to concerns about the economic costs of ‘getting the pricesright’. Environmental taxes lower the after-tax wages in the economy and hence distort thefunctioning of labour markets just like new taxes on wages. In addition, environmental taxeson consumer goods distort the choice among alternative commodities. New environmentaltaxes interact with existing taxes that already distorted economic decisions (Bovenberg& De Mooij, 1994). In his overview on the ‘double dividend’ Goulder (1995) comes tothe conclusion that for most green tax reforms negative tax interaction effects are largerthan positive revenue-recycling effects, ‘so that, overall, a revenue-neutral carbon tax islikely to involve positive costs in a second-best setting’. Given the difficulties of valuingthe ecological benefits from pollution reductions, a strong double dividend with net welfaregains would motivate policymakers to go ahead with green tax reforms. Goulder (1995)furthermore stresses that removing unusually costly existing taxes should not depend onthe introduction of new environmental taxes.
3.2. Low taxes to limit efficiency losses?
Bovenberg and Goulder (1996) elaborate the efficiency arguments to install environmen-tal taxes at levels strongly below the marginal environmental damage. Environmental taxes
1 Implicit tax rates (ITR) measure the effective average tax burden on different types of economic income oractivities. The ITR expresses aggregate tax revenues as a percentage of the potential tax base for each field.
92 J. Albrecht / International Review of Law and Economics 26 (2006) 88–103
decrease the labour supply if the uncompensated wage elasticity of labour supply is positive.The erosion of the base of the labour tax is a first-order welfare loss of the environmentaltaxes, leading to a total welfare cost that exceeds the benefits from the avoided pollution. Toequate marginal welfare costs and marginal environmental benefits from emissions reduc-tion, the optimal environmental tax must be set below the marginal social benefits or thePigovian rate. With a numerical simulation for the US economy that includes the presenceof distortionary taxes and realistic policy constraints like the inability to frequently altertax rates, Bovenberg and Goulder (1996) show that optimal carbon tax rates may even benegative. Since most European countries have already high income and consumption taxes,these existing distortions together with rigid bureaucratic structures that prefer command-and-control above market-based approaches, seem to suggest that low environmental taxrates and hence revenues can be optimal from an efficiency perspective. This efficiencyargument is rarely mentioned in debates on green tax reform because the primary goalremains the reduction of specific emissions (not necessarily at welfare-maximizing levels).
4. Stable environmental taxes
For Paul Krugman the idea of pollution taxes is one of those iconic positions that com-mands the assent of every economist. ‘The Great Green Tax Shift’ is supported by goodscience and good economics, as well as by good intentions. But in the US, a green taxreform is a complete political non-starter because it runs up against the three Is, namelyignorance, interests and ideology (Krugman, 1999). In Europe, the three Is can have anotherinterpretation but next to the efficiency arguments in Section 3 there are many other expla-nations for the stable and the seemingly marginal role of environmental taxes over the last20 years. In this section, a brief and partial overview is presented.
4.1. Pigou’s solution, optimal taxes and the taxation base
Taxes require a taxation base that can be measured. Energy taxes are indirect environ-mental taxes. The use of fossil fuels for electricity production and other purposes contributesto environmental stresses and a direct environmental tax would target the released emis-sions. There are, however, only a few European countries with taxes on sulphur dioxide(SO2) and nitrogen oxide (NOX), the pollutants causing acid rain. There are no countrieswith taxes on carbon monoxide (CO) or on volatile organic compounds (VOC), both gasesreleased at combustion. In Norway, Sweden and Denmark the sulphur taxes are basicallyproduct taxes where the fuel is taxed at the time of combustion or sales. The sulphur chargesare later refunded according to the sulphur extracted and preserved during combustion orduring industrial processes (Nordic Council of Ministers, 1999). In contrast, the US sys-tems of SO2 and NOX emissions trading attach a direct price penalty to these emissions. Inmost countries, carbon dioxide (CO2) emissions are also taxed indirectly. Fortunately, theEuropean CO2 emissions scheme that started in 2005 will directly attach market prices topreviously unpriced greenhouse gas emissions.
In what most economists describe as the Pigouvian tradition, environmental taxes shouldbe used to reduce the external effects from production to the optimal economic level at which
J. Albrecht / International Review of Law and Economics 26 (2006) 88–103 93
further reductions of externalities create net-welfare losses for society. This scheme withenvironmental taxes equal to marginal environmental damages clearly depends on multipleinformation flows and information processing abilities. The future ecological damage by agreenhouse gas such as CO2 is, however, very difficult to estimate so the applied carbontaxes are by definition arbitrary and do not lead to Pareto-optimal allocations. Similarvaluation and tax setting problems are related to SO2 and NOX taxes. While emphasizedby opponents of environmental taxes, this imperfect approach should not be consideredas a practical argument against the use of environmental taxes. It is not even a theoreticalargument. In his famous The Economics of Welfare, Pigou (1920) never stated the principlesfor calculating the externality taxes. Hence, the textbook goal of welfare maximisationthrough environmental taxes can be converted to a more pragmatic attitude for policymaking.Pigou himself even assumed that in real life administrative costs of externality taxes couldoutweigh the benefits from externality reduction. He was also critical of the bureaucracy andopenly sceptical of the abilities of local authorities to undertake effective market intervention(Andersen, 1994). The real goal of Pigouvian taxes is to gradually correct market forceseven when the negative externalities cannot be properly valued. From this perspective, itis better to install modest environmental taxes now than to wait several decades before theoptimal tax level can be determined with certainty.
Next to indirect taxes on CO2, SO2 and NOX, there are hardly pollution taxes in Europesimply because emissions of toxic pollutants are not widely measured. Europe has noinformation system like the US Toxic Release Inventory (TRI). Since 1987, this publiclyavailable Environmental Protection Agency (EPA) database collects and publishes annualinformation on toxic chemical releases and waste management activities by covered industrygroups as well as federal facilities. EPA has issued rules to bring the number of chemicalsincluded in the TRI to approximately 650 (EPA, 2003). Only recently, some Europeancountries try to establish a similar inventory system.
The general problem of the taxation base illustrates that implementing a comprehensivegreen taxation policy requires initial investments that make it possible to expand the taxationbase over time. This aspect of environmental policy implementation often seems to beneglected. Tax reforms that make use of existing tax bases such as value added taxes (VAT)or other consumption taxes therefore offer important advantages.
4.2. Government failure and implementation problems
Environmental policy is often presented as a typical case of government failure. In thepast, considerable resources have been wasted on expensive and highly ineffective measureslike problem-displacing high-stack policies (Andersen, 1994). In this tradition, Janicke(1990) sees the modern welfare state as misregulated rather than overregulated. Bureaucratsas well as industry prefer standardised routine approaches that prevent surprises. End-of-pipe technologies provide a typical example of an expensive but ineffective solution basedon the willingness of society to spend money on pollution control. More complex solutionssuch as prevention are deliberately neglected because neither bureaucrats nor industry canbenefit from it. Bureaucrats want to control high budgets and high administrative throughputwhile some industries just wants to sell expensive end-of-pipe technology. Since Buchananand Tullock (1975) argued that established firms will prefer output controls over taxes, the
94 J. Albrecht / International Review of Law and Economics 26 (2006) 88–103
benefits that existing industries can derive from tailor-made technical regulation did enterthe analysis of the limited success of environmental taxes. With regulation that limits totaloutput or environmental pressures, existing firms face no threat from potential competitors.With a non-discriminating system of environmental taxes, new competitors can enter themarket by paying the same pollution taxes as the existing firms.
Andersen (1994) concludes that it is government intervention, rather than its absence, thathas produced so many of the world’s environmental problems. In this political environment,the chances of implementing effective environmental taxes are limited. Optimal taxes needto be differentiated according to the different pollutants, the mix of pollutants, the sourcesof pollution and their location, the amount of pollution and the timing of the pollution.In the ideal world, taxes should be introduced at a low level and then gradually increasedto minimize adjustment costs and to enforce the incentives to alter behaviour. Obviously,there is no standard routine to install environmental taxes and this is a major disadvantage.Decisions about the use of economic instruments have to be taken by the same politicalsystem that created part of the environmental problems we currently face.
5. The alternative of consumption taxes
Since total consumption currently represents around 70% of GDP in the richest OECDcountries, consumption taxes have the advantage of an enormous taxation base. A green taxreform could therefore also be based on existing consumption taxes instead of direct pol-lution taxes. Although the environmental impact of different consumption goods stronglydiffers, there are only a few countries with some consumption taxes that are differenti-ated according to their environmental impact. The total environmental impact of a productcan be assessed with tools like Life Cycle Analysis (LCA). Outcomes from LCA stronglydepend on the current knowledge about the eco-toxicity of emitted substances during pro-duction, consumption and the end of the product use. Although the results from a LCA canbe incomplete, consumption taxes according to the environmental stresses created by theproduct could be introduced as part of a green tax reform.
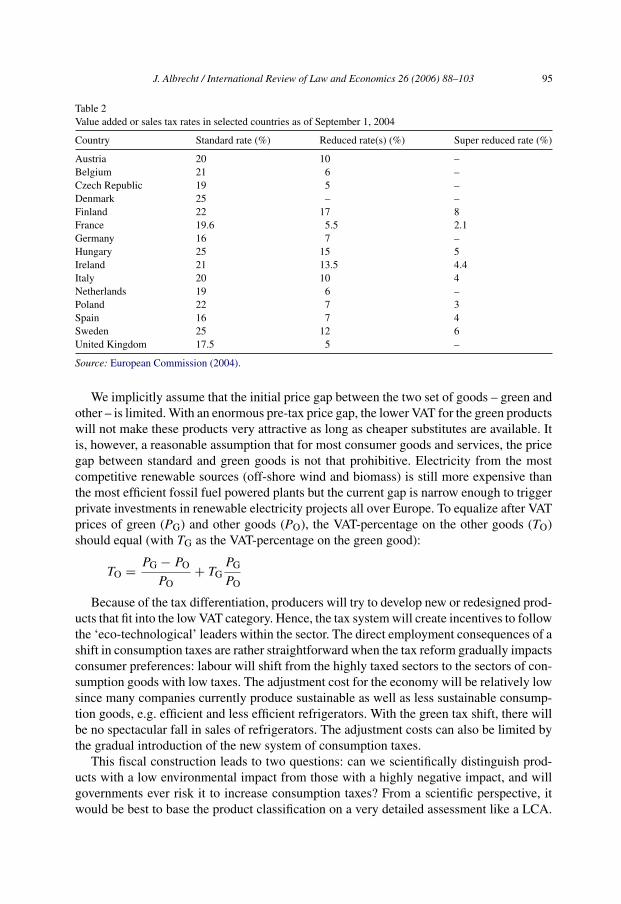
Table 2 presents national value added or sales taxes for a selection of European countries.Standard rates vary from 16 to 25%. Most countries have reduced rates for specific purposes(foodstuff, construction activities, etc.). In a country like the United States, there is nonational sales tax but many States have a (low) sales tax. In the countries with the highestvalue added tax rates, total VAT revenues can amount to 20% of GDP.
The use of the (super) reduced VAT rates for goods and services with desirable eco-logical consequences is the essence of this proposal for a green VAT reform. When alldeveloped countries gradually bring value added taxes to a high level (e.g. a VAT of30%) for consumption goods with a highly negative environmental impact, but install amuch lower taxation rates for consumption goods with a limited negative environmentalimpact (e.g. a VAT of 15%), aggregated consumption can be modestly reduced in the shortrun but will become more sustainable over time. The introduction of higher consump-tion taxes on important product categories can reduce aggregated demand if disposableincome remains fixed. But a reduction of other consumption taxes will limit the reduction ofdemand.
J. Albrecht / International Review of Law and Economics 26 (2006) 88–103 95
Table 2Value added or sales tax rates in selected countries as of September 1, 2004
Country Standard rate (%) Reduced rate(s) (%) Super reduced rate (%)
Austria 20 10 –Belgium 21 6 –Czech Republic 19 5 –Denmark 25 – –Finland 22 17 8France 19.6 5.5 2.1Germany 16 7 –Hungary 25 15 5Ireland 21 13.5 4.4Italy 20 10 4Netherlands 19 6 –Poland 22 7 3Spain 16 7 4Sweden 25 12 6United Kingdom 17.5 5 –
Source: European Commission (2004).
We implicitly assume that the initial price gap between the two set of goods – green andother – is limited. With an enormous pre-tax price gap, the lower VAT for the green productswill not make these products very attractive as long as cheaper substitutes are available. Itis, however, a reasonable assumption that for most consumer goods and services, the pricegap between standard and green goods is not that prohibitive. Electricity from the mostcompetitive renewable sources (off-shore wind and biomass) is still more expensive thanthe most efficient fossil fuel powered plants but the current gap is narrow enough to triggerprivate investments in renewable electricity projects all over Europe. To equalize after VATprices of green (PG) and other goods (PO), the VAT-percentage on the other goods (TO)should equal (with TG as the VAT-percentage on the green good):
TO = PG − PO
PO+ TG
PG
PO
Because of the tax differentiation, producers will try to develop new or redesigned prod-ucts that fit into the low VAT category. Hence, the tax system will create incentives to followthe ‘eco-technological’ leaders within the sector. The direct employment consequences of ashift in consumption taxes are rather straightforward when the tax reform gradually impactsconsumer preferences: labour will shift from the highly taxed sectors to the sectors of con-sumption goods with low taxes. The adjustment cost for the economy will be relatively lowsince many companies currently produce sustainable as well as less sustainable consump-tion goods, e.g. efficient and less efficient refrigerators. With the green tax shift, there willbe no spectacular fall in sales of refrigerators. The adjustment costs can also be limited bythe gradual introduction of the new system of consumption taxes.
This fiscal construction leads to two questions: can we scientifically distinguish prod-ucts with a low environmental impact from those with a highly negative impact, and willgovernments ever risk it to increase consumption taxes? From a scientific perspective, itwould be best to base the product classification on a very detailed assessment like a LCA.
96 J. Albrecht / International Review of Law and Economics 26 (2006) 88–103
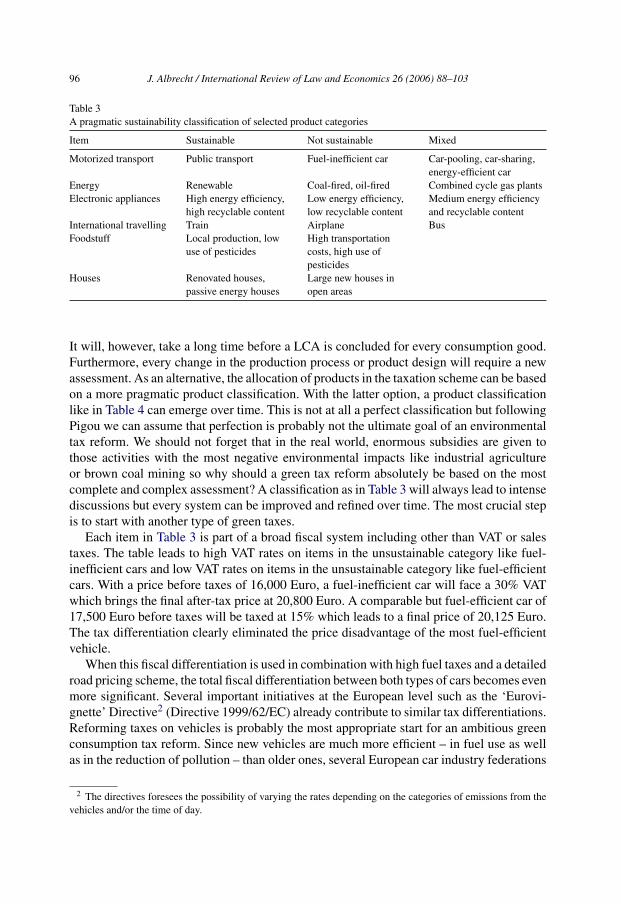
Table 3A pragmatic sustainability classification of selected product categories
Item Sustainable Not sustainable Mixed
Motorized transport Public transport Fuel-inefficient car Car-pooling, car-sharing,energy-efficient car
Energy Renewable Coal-fired, oil-fired Combined cycle gas plantsElectronic appliances High energy efficiency,
high recyclable contentLow energy efficiency,low recyclable content
Medium energy efficiencyand recyclable content
International travelling Train Airplane BusFoodstuff Local production, low
use of pesticidesHigh transportationcosts, high use ofpesticides
Houses Renovated houses,passive energy houses
Large new houses inopen areas
It will, however, take a long time before a LCA is concluded for every consumption good.Furthermore, every change in the production process or product design will require a newassessment. As an alternative, the allocation of products in the taxation scheme can be basedon a more pragmatic product classification. With the latter option, a product classificationlike in Table 4 can emerge over time. This is not at all a perfect classification but followingPigou we can assume that perfection is probably not the ultimate goal of an environmentaltax reform. We should not forget that in the real world, enormous subsidies are given tothose activities with the most negative environmental impacts like industrial agricultureor brown coal mining so why should a green tax reform absolutely be based on the mostcomplete and complex assessment? A classification as in Table 3 will always lead to intensediscussions but every system can be improved and refined over time. The most crucial stepis to start with another type of green taxes.
Each item in Table 3 is part of a broad fiscal system including other than VAT or salestaxes. The table leads to high VAT rates on items in the unsustainable category like fuel-inefficient cars and low VAT rates on items in the unsustainable category like fuel-efficientcars. With a price before taxes of 16,000 Euro, a fuel-inefficient car will face a 30% VATwhich brings the final after-tax price at 20,800 Euro. A comparable but fuel-efficient car of17,500 Euro before taxes will be taxed at 15% which leads to a final price of 20,125 Euro.The tax differentiation clearly eliminated the price disadvantage of the most fuel-efficientvehicle.
When this fiscal differentiation is used in combination with high fuel taxes and a detailedroad pricing scheme, the total fiscal differentiation between both types of cars becomes evenmore significant. Several important initiatives at the European level such as the ‘Eurovi-gnette’ Directive2 (Directive 1999/62/EC) already contribute to similar tax differentiations.Reforming taxes on vehicles is probably the most appropriate start for an ambitious greenconsumption tax reform. Since new vehicles are much more efficient – in fuel use as wellas in the reduction of pollution – than older ones, several European car industry federations
2 The directives foresees the possibility of varying the rates depending on the categories of emissions from thevehicles and/or the time of day.
J. Albrecht / International Review of Law and Economics 26 (2006) 88–103 97
explicitly ask for fiscal measures that make new vehicles more attractive in comparison toold vehicles. Febiac – the Federation of the Belgian Car Industries – repeatedly pleadedfor high taxes on the most polluting vehicles and lower taxes on the most efficient vehicles(Febiac, 2003).
Current VAT rates on new vehicles range from 15% in Luxembourg to 25% in Sweden.As the European Commission is in favour of a gradual harmonisation of vehicle taxes,a green reform is an attractive option that will strongly be supported by industry. Theambitious UK climate strategy plan with a 60% reduction target for greenhouse gas by theyear 2050 is also endorsed by British industrial groups (DTI, 2003). The possible coalitionsbetween government and big industry offer excellent opportunities for policymakers topresent environmental protection programs as win-win situations for society (Albrecht,2002).
This brings us to the question whether governments ever will transform the existing envi-ronmental taxes. The answer is simple: it will be extremely difficult but a necessity. Newtechnologies alone will not limit the environmental impact of current production and con-sumption flows. Selected price incentives will accelerate the diffusion of new technologiesand create rewarding markets for sustainable products.
6. The economic efficiency of consumption taxes
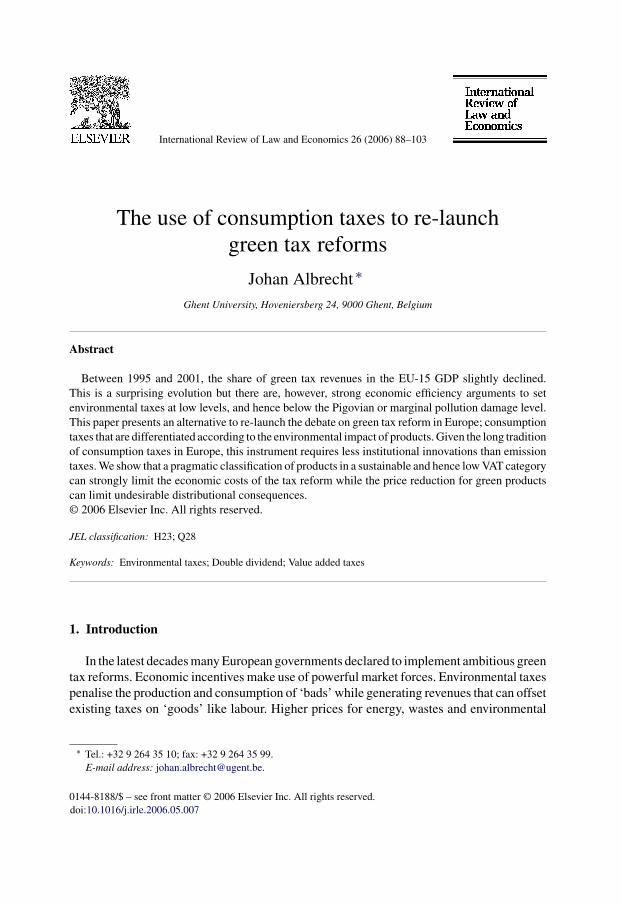
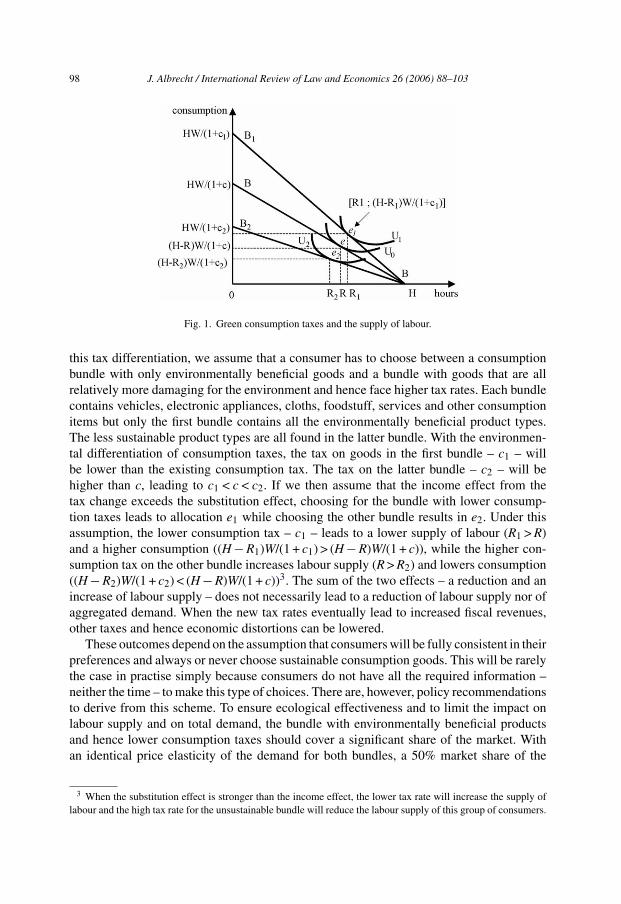
Taxes distort economic decisions. In a world without distortions, economic actors makeoptimal decisions with respect to their supply of labour and their choice between currentand future consumption. Income taxes reduce the relative price of leisure what can lead toa reduction of the labour supply. Depending on the characteristics of the labour market, theintroduction of a proportional income tax can reduce total productive income, productionand GDP. Higher consumption taxes do not reduce net wages but also make consumptionmore expensive relative to leisure. So in a simple model with only leisure and consumption,both taxes have a similar but not identical impact on the relative price of leisure and thesupply of labour. In Fig. 1, the impact on labour supply of a change in existing consumptiontaxes is illustrated. The economic actor in the analysis has H hours to divide over leisure andworking. For each hour of work, a unit wage W is received. W is the slope of the budget lineBB. Total income is spent on consumption and the unit price of consumption is 1. Beforeany consumption tax is installed, maximal consumption is HW with all the available hoursused to work.
In this simple scheme, there is already a general consumption tax like a VAT. Thisunique consumption tax rate is denoted as c. HW/(1 + c) is the maximal consumption withthe existing consumption taxes. With the consumption tax c, the individual will take Rhours of leisure and will work H − R hours. The optimal allocation with a consumptionequal to (H − R)W/(1 + c) is indicated by point e on the initial indifference curve U0.This allocation is, however, distorted since without the consumption tax, the individualcould reach a higher utility level. In the former sections, an environmentally differenti-ated consumption tax has been proposed. Products with a lower environmental impactcould benefit from lower consumption taxes while consumption taxes for more environ-mentally damaging products should be increased. To illustrate the efficiency effects of
98 J. Albrecht / International Review of Law and Economics 26 (2006) 88–103
Fig. 1. Green consumption taxes and the supply of labour.
this tax differentiation, we assume that a consumer has to choose between a consumptionbundle with only environmentally beneficial goods and a bundle with goods that are allrelatively more damaging for the environment and hence face higher tax rates. Each bundlecontains vehicles, electronic appliances, cloths, foodstuff, services and other consumptionitems but only the first bundle contains all the environmentally beneficial product types.The less sustainable product types are all found in the latter bundle. With the environmen-tal differentiation of consumption taxes, the tax on goods in the first bundle – c1 – willbe lower than the existing consumption tax. The tax on the latter bundle – c2 – will behigher than c, leading to c1 < c < c2. If we then assume that the income effect from thetax change exceeds the substitution effect, choosing for the bundle with lower consump-tion taxes leads to allocation e1 while choosing the other bundle results in e2. Under thisassumption, the lower consumption tax – c1 – leads to a lower supply of labour (R1 > R)and a higher consumption ((H − R1)W/(1 + c1) > (H − R)W/(1 + c)), while the higher con-sumption tax on the other bundle increases labour supply (R > R2) and lowers consumption((H − R2)W/(1 + c2) < (H − R)W/(1 + c))3. The sum of the two effects – a reduction and anincrease of labour supply – does not necessarily lead to a reduction of labour supply nor ofaggregated demand. When the new tax rates eventually lead to increased fiscal revenues,other taxes and hence economic distortions can be lowered.
These outcomes depend on the assumption that consumers will be fully consistent in theirpreferences and always or never choose sustainable consumption goods. This will be rarelythe case in practise simply because consumers do not have all the required information –neither the time – to make this type of choices. There are, however, policy recommendationsto derive from this scheme. To ensure ecological effectiveness and to limit the impact onlabour supply and on total demand, the bundle with environmentally beneficial productsand hence lower consumption taxes should cover a significant share of the market. Withan identical price elasticity of the demand for both bundles, a 50% market share of the
3 When the substitution effect is stronger than the income effect, the lower tax rate will increase the supply oflabour and the high tax rate for the unsustainable bundle will reduce the labour supply of this group of consumers.
J. Albrecht / International Review of Law and Economics 26 (2006) 88–103 99
sustainable bundle and no adjustment costs will lead to no change in total demand. Topredict the outcome of the consumption tax reform, we also need to consider the preciseformat of the introduced differentiation.
As it is highly improbable that all the environmentally beneficial products currentlyrepresent a large market share at the start of the tax reform, the decision to classify aproduct as green should initially be based on not too strict parameters (as in Table 3).Once markets respond to the tax differentiation, the standards can be toughened. Finally,this scheme illustrates that environmentally differentiated consumption taxes are especiallyattractive for countries with already high consumption taxes. For countries with very lowor no consumption taxes, only efficiency losses can be expected from environmental taxes.
7. Implementation issues
7.1. Differentiated consumer taxes and the European VAT directive
Since Council Directive (77/388/EEC) of 17 May 1977 on the harmonisation of the lawsof the Member States relating to turnover taxes, the EU VAT regulation is in a transitionalphase. Since January 2001, the goal of this harmonization effort is to fix value added taxes at apercentage not less than 15% from 2001 to 2005. However, the reduced rates in Table 2 showthat VAT rates below 15% are still frequently used in the EU-15. Hence, the minimal VATrate applies for the standard rate. Furthermore, several countries obtained the permissionto apply measures derogating from the VAT Directive. Some of these measures are evenmotivated by environmental concerns. Sweden can use a lower electricity value added tax– the standard rate is 25% – in the North where electricity consumption is on average25% higher than elsewhere in the country. The lower tax level should, however, ensurethat the incentive effect of taxation to increase energy efficiency is maintained (OfficialJournal, 2005). With respect to the proposed consumer tax differentiation, the highest taxrate should become the standard tax rate and exceed 15%. Sustainable products shouldthen be taxed at the reduced rate. An alternative is that sustainable goods will be taxed at15% and unsustainable goods at a much higher rate (e.g. 30%). Because of the Europeanharmonisation efforts, individual European countries will not be able to free-ride on othernations’ efforts to promote sustainable products with VAT reforms.
7.2. Private consumption as the engine of economic growth
Private consumption has always been the engine of economic growth. Consumption playsa pivotal role in economic life and for everyone’s welfare but unfortunately, the share ofsustainable consumption goods and services in total consumption remains low (EEA, 2001).The actual environmental impact of the bulk of consumption goods is still unsustainable.This is not a big surprise given the non-existence of correct prices for natural services.
Maintaining economic growth is the absolute priority for most governments. The lastworldwide economic slowdown is a complex phenomenon but the most obvious way toescape from it in rich countries is by stimulating private consumption. Basic empiricalanalysis indeed confirms that increasing private consumption is the most valid option to
100 J. Albrecht / International Review of Law and Economics 26 (2006) 88–103
Table 4Real GDP growth and its driving factors in the OECD (1986–2002)
Correlation between annual real GDP growth in OECD countries andReal total domestic demand 0.977Real private consumption expenditures 0.873Real public consumption expenditures 0.063Real total gross fixed capital formation 0.911Real exports of goods and services 0.757Real imports of goods and services 0.893
Note: own calculations based on the Statistical Annex tables from OECD Economic Outlook No. 73.
restore economic growth in the short run. Table 4 presents correlation coefficients betweenreal GDP growth per year from 1986 to 2002 in OECD countries and the annual growth ofvarious components of GDP. Growth in real private consumption and total gross fixed capitalformation are the most important factors to explain economic growth. This is not a surprisegiven the high share of consumption in GDP. There is also a high correlation betweeneconomic growth and real imports of goods and services. Public consumption expendituresare clearly of less importance for restoring economic growth. As the gross fixed capitalformation depends on important long-term investment decisions, the only option to stimulateeconomic growth in the short run is provided by measures to increase private consumption.
Table 4 explains the repeated calls by most political leaders to increase consumption andcapital expenditures. In many countries, measures to make consumption more attractive havebeen taken or are considered. Tax packages to allocate more purchasing power to consumersthat are assumed to spend most – like families with young children – or reductions of con-sumption taxes are typical instruments for this purpose. In a comment on the recent 18 billionEuro tax reforms in Germany that possibly could save average wage-earners around 10%taxes, Chancellor Gerhard Schroeder declared that ‘ten percent less taxes means ten percentmore consumption (BBC News, 2003).’ Given the unsustainable nature of current consump-tion and production flows, this call for more consumption is difficult to reconcile with ambi-tious declarations on sustainable development. Consequently, proposals for a VAT reformthat risk to significantly reduce total consumption risk to be rejected by pro-growth orientedpolicymakers. Detailed assessments of the price elasticity of demand for important productcategories are essential to determine a politically acceptable differentiation of VAT rates.
7.3. Consumption taxes and equity concerns
Enthusiasm for environmental tax reforms is usually tempered by concerns over equity.Since low-income households spend a relatively larger share of their income on consump-tion, a general increase of consumption taxes will impact these households stronger thanhigh-income households. The empirical research on distributive consequences of environ-mental tax shifts is not conclusive. Asensio, Matas, and Raymond (2003) use micro datafrom the Spanish Household Budget Survey of 1990/91 to conclude that petrol taxation isnot regressive since the share of petrol expenditures is increasing with income for the lowestincome deciles. The share of petrol consumption in total household consumption is highestfor the households in the fifth income decile (i.e. close to 4.2% in 1990/91). The poorest aswell as the richest Spanish households spend close to 3% of their income on petrol. Appar-
J. Albrecht / International Review of Law and Economics 26 (2006) 88–103 101
ently, increased petrol taxes will especially hit the Spanish middle class. Research on theregressive nature of environmental taxes faces several constraints. Annual income statisticspresent only information on the official economy while the size of the shadow economy incountries like Greece, Italy, Spain and Belgium is estimated between 20 and 30% of theirGDP (Schneider, 2000). There are only a few countries with an estimated shadow economybelow 10% of reported GDP (Austria, the US and Switzerland). An intriguing question isof course which income categories gain most from unreported economic activities. Sincelow-skill shadow activities like house maintenance, construction and gardening constitutea significant part of the shadow economy, low-income households can have a higher thanreported income. A subsequent discussion relates to the use of annual household incomeor lifetime income. Since income changes are often transitory, rather stable expenditureson consumption indicate that households base their behaviour on a permanent or lifetimeincome. In the empirical literature, lifetime income is frequently estimated by educationlevels. Grouping households by annual income will include many people in the low-incomecategories who may not belong there on the basis of their lifetime income. Hence wealthyretired persons or students with excellent prospects but a low income will consume muchmore than poor people who have always been poor. Walls and Hanson (1999) show that withthe use of lifetime income environmental tax shifts are hardly regressive, if regressive at all.
With the different consumption taxes for the two bundles, the tax proposal elaborated inSection 6 will not have regressive consequences when low-income households can afford thebundle with the low consumption tax rates. Only when the after-tax price of the sustainablebundle (with the low consumption tax) remains significantly higher than the after-tax priceof the other bundle, there is a risk that the tax reform will have regressive consequences.Hence, the tax difference between the two bundles should be large enough to more or lessequalize before-tax price differences. Finally, consumers all need to collect and processinformation on new market prices and this can take some time. Consumers need to be awareof the sustainable products on the markets before they can change their behaviour. Especiallypeople with limited access to market information will need a long transition period
8. Conclusions
Several European governments declared to shift the fiscal burden from labour to pollutionbut the share of green tax revenues in the EU-15 GDP slightly declined between 1995 and2001. This is a surprising evolution. There are, however, strong economic efficiency argu-ments to set environmental taxes at low levels, and hence below the Pigovian or marginalpollution damage level. Other explanations for the limited importance of environmental taxreforms relate to the limited taxation base, government failure and implementation prob-lems. The paper presents an alternative for the green tax reform; consumption taxes canbe differentiated according to the environmental impact of products. Given the long tradi-tion of consumption taxes in Europe, this instrument requires less institutional innovations.Compared to the existing uniform consumption tax or standard VAT, green products shouldbe promoted by installing a lower consumption tax while environmentally damaging prod-ucts should be taxed at higher rates. We show that a pragmatic classification of productsin a sustainable and hence low VAT category does not need to restrict total consumption.
102 J. Albrecht / International Review of Law and Economics 26 (2006) 88–103
Producers will gradually shift production factors from the high to the low VAT productcategories. The economic costs of the VAT reform in terms of reduced supply of labour willdepend on the ability to expand the share of low VAT products in total consumption. Whenlow VAT green products cover around half of the total market, the impact on labour supplycan be modest or even positive. The green VAT reform can easily fit into the European VATharmonisation process and the price reduction for green products can limit undesirable dis-tributional consequences. Finally, policymakers will hesitate to implement tax reforms thateventually lower total consumption. A detailed assessment of price elasticities is needed todetermine the optimal VAT differentiation.
References
Albrecht, J. (2002). Environmental issue entrepreneurship: A Schumpeterian perspective. FUTURES, 34(7),649–661.
Andersen, M. S. (1994). Governance by green taxes. Making pollution prevention pay. Manchester: ManchesterUniversity Press.
Asensio, J., Matas, A., & Raymond, J. (2003). Petrol consumption and redistributive effects of its taxation inSpain. Transportation Research A: Policy and Practice, 37(1), 49–69.
BBC News. (2003). Germany bets on tax cuts (http://news.bbc.co.uk/go/pr/fr/-/1/hi/business/3029676.stm, pub-lished: 2003/06/30).
Bovenberg, A. L., & De Mooij, R. A. (1994). Environmental levies and distortionary taxation. American EconomicReview, 94(4), 1085–1089.
Bovenberg, A. L., & Goulder, L. H. (1996). Optimal environmental taxation in the presence of other taxes:General-equilibrium analyses. American Economic Review, 86(4), 985–1000.
Buchanan, J. M., & Tullock, G. (1975). Polluters’ profits and political response: Direct controls versus taxes.American Economic Review, 65(1), 139–147.
DTI. (2003). Energy White Paper ‘Our Energy Future—Creating a Low Carbon Economy’ (http://www2.dti.gov.uk/energy/whitepaper/).
EPA. (2003). What is the Toxics Release Inventory (TRI) program? (http://www.epa.gov/tri/whatis.htm, pagevisited September 8, 2003).
European Commission. (2004). VAT Rates Applied in the Member States of the European Commission (DGTaxation and Customs Union, DOC/2008/2004-EN).
European Environment Agency. (2001). Environmental Assessment Report 2001 (EEA: Copenhagen).Eurostat. (2003a). Environmental taxes in the European Union. First signs of a relative ‘green tax shift’. Statistics
in focus. Environment and Energy, 1980–2001, Theme 8-9/2003.Eurostat. (2003b). A modest decline in the EU overall tax burden since. Eurostat News Release, 67/2003–13 June
2003.Febiac. (2003). De emissies en het energieverbruik door het wegverkeer in Belgie, 1980–2020 (www.febiac.be).Goulder, L. H. (1995). Environmental taxation and the double dividend: A reader’s guide. International Tax and
Public Finance, 2, 157–183.Janicke, M. (1990). State failure. The impotence of politics in industrial society. Cambridge: Polity Press.Krugman, P. (1999). The accidental theorist and other dispatches from the dismal science. London: Penguin
Books.Nordic Council of Ministers. (1999). The use of economic instruments in Nordic Environmental Policy 1997–1998.
Copenhagen: Nordic Council of Ministers.Official Journal. (2005). 2005/231/EC: Council Decision of 7 March 2005 authorising Sweden to apply a reduced
rate of taxation to electricity consumed by households and service sector companies situated in certainareas in the north of Sweden in accordance with Article 19 of Directive 2003/96/EC. L 072, 18/03/2005,27–28.
Pigou, A. C. (1920). The economics of welfare. London: MacMillan.

J. Albrecht / International Review of Law and Economics 26 (2006) 88–103 103
Royal Society. (2002). Economic instruments for the reduction of carbon dioxide emissions. Policy document26/02. London: Royal Society.
Schneider, F. (2000). Dimension of the shadow economy. The Independent Review, V(1), 81–91.Statistics Sweden. (2005). Environmental taxes in Sweden 1993–2004 (http://www.scb.se/templates/
tableOrChart 39451.asp).Tietenberg, T. (2003). Environmental and natural resource economics (6th ed.). Boston: Addison Wesley.von Weizsacker, E., Lovins, A. B., & Lovins, L. H. (1997). Factor four. Doubling wealth—Halving resource use.
London: Earthscan.Walls, M., & Hanson, J. (1999). Distributional aspects of an environmental tax shift: The case of motor vehicle
emissions taxes. National Tax Journal, 52(1), 53–65.