Embed Size (px)
Citation preview

“QuahLyonsParish˙MMNP” — 2012/10/9 — 21:50 — page 53 — #1i
i
i
i
i
i
i
i
Math. Model. Nat. Phenom.
Vol. 7, No. 5, 2012, pp. 53–64
DOI: 10.1051/mmnp/20127505
The Use of CFSE-like Dyes for Measuring
Lymphocyte Proliferation: Experimental
Considerations and Biological Variables
B.J.C. Quah1, A.B. Lyons2, C.R. Parish1 ∗
1 Department of Immunology, John Curtin School of Medical Research, Australian National University,Canberra, ACT, 2601, Australia
2 School of Medicine, University of Tasmania, Hobart, Tasmania, Australia
Abstract. The measurement of CFSE dilution by flow cytometry is a powerful experimentaltool to measure lymphocyte proliferation. CFSE fluorescence precisely halves after each celldivision in a highly predictable manner and is thus highly amenable to mathematical modelling.However, there are several biological and experimental conditions that can affect the qualityof the proliferation data generated, which may be important to consider when modelling dyedilution data sets. Here we overview several of these variables including the type of fluorescentdye used to monitor cell division, dye labelling methodology, lymphocyte subset differences, invitro versus in vivo experimental assays, cell autofluorescence, and dye transfer between cells.
Keywords and phrases: Cell proliferation, CFSE, Flow cytometry
Mathematics Subject Classification: 92-02, 92C37, 92C99, 97M60
1. Introduction
CFSE dilution is one of the most commonly used measures of lymphocyte proliferation in immunologicalstudies. The use of CFSE in measuring lymphocyte proliferation began with our studies using thefluorescent dye in lymphocyte migration analyses in mouse models [1]. CFSE was ideally suited forthis application, labelling cells with a very bright stable fluorescence that had very minimal fluorescencevariation throughout the labelled cell population and had low cell toxicity. After adoptive transferinto mice CFSE-labelled lymphocytes could therefore be identified quite discretely from host cells usingflow cytometry over long periods of time. Bruce Lyons, repeating similar migration experiments in ourlaboratory, fortuitously noted that CFSE-labelled B cells transferred into very young mice appeared toundergo serial halving of dye fluorescence intensity, indicative of cell proliferation [2, 3]. Indeed, Lyonsand Parish went on to confirm, using Hoechst fluorescence quenching by BrDU, that daughter cells ina dividing CFSE-labelled population of lymphocytes had received half the amount of CFSE from theirparent cells [2].
In hindsight, the same key attributes of CFSE that make it an ideal cell tracking dye in in vivomigration assays also make it ideal for proliferation analysis. The high fluorescence that can be achieved
∗Corresponding author. E-mail: [email protected]
c© EDP Sciences, 2012
Article published by EDP Sciences and available at http://www.mmnp-journal.org or http://dx.doi.org/10.1051/mmnp/20127505

“QuahLyonsParish˙MMNP” — 2012/10/9 — 21:50 — page 54 — #2i
i
i
i
i
i
i
i
B.J.C. Quah, A.B. Lyons, C.R. Parish CFSE-like dyes for measuring lymphocyte proliferation
Figure 1. CFSE-dilution as a measure of lymphocyte proliferation. Spleencells from mice were labelled with 40µM of CFSE in RPMI1640 medium supplementedwith 10% FCS and cells stimulated with multiple mitogens [7] in in vitro culture for 4days and T cells (CD90.2+) analysed by flow cytometry for CFSE dilution. In addition,unstimulated CFSE-labelled T cells and unlabelled T cells were also cultured for 4 daysto monitor undivided cell fluorescence and cell autofluorescence.
with CFSE-labelled cells means that it takes several rounds of division before the dye dilutes to theequivalence of cell autofluorescence, allowing several divisions to be detected. The minimal variation indye labelling of lymphocytes (lymphocytes labelled with CFSE can have a fluorescence standard deviationof 25% or less than the mean fluorescence intensity across a broad range of fluorescence levels) coupledwith high and uniform stability of labelling across a broad range of fluorescence intensities results in eachcell division being associated with a discrete shift in the level of fluorescence. In addition, to maximisefluorescent peak resolution it is possible to pre-sort cells to have a very narrow CV of CFSE fluorescencebefore initiation of division [4]. Although there have been reports that CFSE labelling can be toxic forcells [5, 6], when cells are labelled in appropriate buffers cell toxicity is very low [5,7]. A typical divisionhistogram of mouse T cells, using current CFSE cell-labelling methodologies [7–9], is depicted in Figure1. This figure highlights the highly uniform fluorescent labelling that results in discrete divisions beingachievable with CFSE and also shows the importance of including non-activated CFSE-labelled cells andunlabelled cells to monitor undivided cell fluorescence and cell autofluorescence which indicate the extentof dye dilution/division number that is possible for any given assay. It should be noted, however, that inthe example shown in Figure 1 the fluorescence of the non-activated CFSE-labelled cells is slightly higherthan the fluorescence of the non-dividing cells in the proliferating population. This difference varies fromexperiment to experiment for reasons that are unclear, although the data shown in Figure 1 represents anextreme example of this phenomenon. Nevertheless, it is an important variable that should be consideredwhen mathematically modelling CFSE proliferation data.
54
“QuahLyonsParish˙MMNP” — 2012/10/9 — 21:50 — page 55 — #3i
i
i
i
i
i
i
i
B.J.C. Quah, A.B. Lyons, C.R. Parish CFSE-like dyes for measuring lymphocyte proliferation
The application of CFSE to cell division studies has now been used for a number of species other thanmouse and human, such as teleosts [10]. In addition, cells other than lymphocytes have been shownto be amenable to CFSE analysis, such as hemopoietic stem cells [4], myeloid leukemic progenitors [11]and bacteria [12]. A major application has been the analysis of cell differentiation, which has shownthat for both B and T lymphocytes, there is a clear link between cell cycle number and acquisition ofdifferentiation markers, such as cell surface molecules and secreted cytokines [13–15]. Other studies havealso shown that CFSE analysis can be performed using cell nuclei prepared from dividing lymphocytes,allowing analysis of the nuclear transcription factors that control division and differentiation [16]. Inaddition to lymphocyte behaviour in immune processes, CFSE analysis has also been used to examinethe modification of lymphocyte division by drugs targeting cell kinases [17–19].
Since CFSE fluorescence precisely halves after each cell division in a highly predictable manner [7] dataobtained from CFSE proliferation assays is highly amenable to mathematical modelling [19–27]. From abiological point of view, mathematical models offer a way to examine how the immune response developsin a temporal and quantitative way. It may be useful in predicting the success of an immune responsebased on key correlates of lymphocyte development such as the extent of lymphocyte subset proliferation.Furthermore, the use of modeling to predict distinct CFSE-based division peaks from experimental datathat has poorly resolved division profiles can help to correlate phenotypes more precisely with the divisionhistory of cells.
There are several biological and experimental conditions we have noted over the years that can affectthe quality of the proliferation data generated and, consequently, may be important to consider whenmodelling dye dilution data sets. These biological and experimental variables became more apparent whenadditional, CFSE-like, fluorescent dyes became available to monitor lymphocyte proliferation. Here weoverview several of these variables including the type of fluorescent dye used to monitor cell division, dyelabelling methodology, lymphocyte subset differences, in vitro versus in vivo experimental assays, cellautofluorescence, and dye transfer between cells.
2. Fluorescent dyes used to measure lymphocyte proliferation
The reason CFSE has such outstanding cell labelling properties is essentially due to two key chemicalattributes of the dye [5, 7]. The first is the two acetate groups that allow the dye to readily crossthe plasma membrane of cells, but are subsequently enzymatically removed by intracellular esterases.This cleavage has two effects: the dye becomes much less membrane permeant and thus accumulatesrapidly within the cell and the dye becomes highly fluorescent. The net result is a rapid accumulationof fluorescent CFSE molecules within viable cells giving a high level of cell fluorescence. The second keychemical attribute of the dye is the succinimidyl group of CFSE that is responsible for the retention ofthe fluorescent dye within cells, the amine reactive succinimidyl group covalently attaching the dye tocellular proteins. Since many proteins within the cell are long lived, the covalent attachment of the dyeresults in stably fluorescent cells, with high turnover proteins that are CFSE labelled being eliminatedby catabolism within the first 24 hours after labelling.
While many fluorescent dyes have been used as an alternative to CFSE in experimental assays, the mostsuccessful of these alternate dyes are those that have similar chemical properties to CFSE. These includeSNARF-1 (Life Technologies), also an esterase activated succinimidyl containing dye, with relativelybroad emission properties (∼550 nm–750 nm; i.e., across the PE and PerCP channels) and excited by a488 nm laser; DDAO-SE (Life Technologies), a succinimidyl containing dye that has an emission peak at∼657 nm (equivalent to APC) and is excited by a 633 nm laser; Cell Proliferation Dye eFluor 670 (CPD,ebioscience), an amine reactive dye that like DDAO-SE has an emission peak equivalent to APC andis excited by a 633 nm laser; and CellTrace Violet (CTV, Life Technologies), which is also an esteraseactivated succinimidyl containing dye, that has an emission peak at ∼455 nm (equivalent to Pacific Blue)and is excited by a 405 nm laser.
In addition, there are several other dyes chemically quite distinct from CFSE that have been usedwith reasonable success for cell proliferation analyses. A notable example is the lipophilic dyes, such as
55
“QuahLyonsParish˙MMNP” — 2012/10/9 — 21:50 — page 56 — #4i
i
i
i
i
i
i
i
B.J.C. Quah, A.B. Lyons, C.R. Parish CFSE-like dyes for measuring lymphocyte proliferation
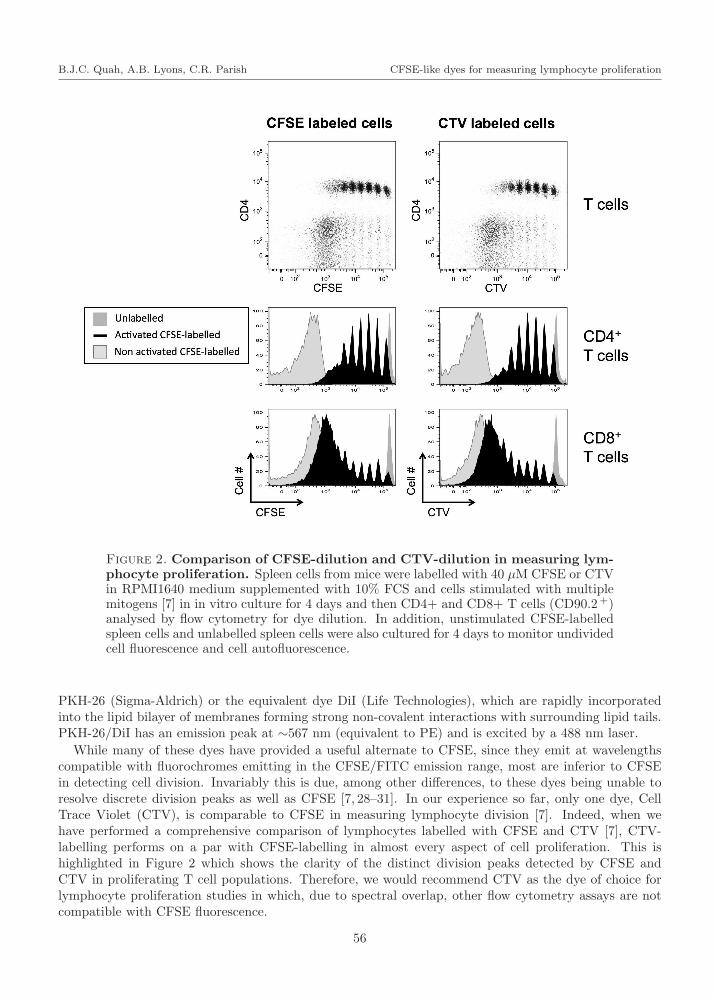
Figure 2. Comparison of CFSE-dilution and CTV-dilution in measuring lym-phocyte proliferation. Spleen cells from mice were labelled with 40 µM CFSE or CTVin RPMI1640 medium supplemented with 10% FCS and cells stimulated with multiplemitogens [7] in in vitro culture for 4 days and then CD4+ and CD8+ T cells (CD90.2+)analysed by flow cytometry for dye dilution. In addition, unstimulated CFSE-labelledspleen cells and unlabelled spleen cells were also cultured for 4 days to monitor undividedcell fluorescence and cell autofluorescence.
PKH-26 (Sigma-Aldrich) or the equivalent dye DiI (Life Technologies), which are rapidly incorporatedinto the lipid bilayer of membranes forming strong non-covalent interactions with surrounding lipid tails.PKH-26/DiI has an emission peak at ∼567 nm (equivalent to PE) and is excited by a 488 nm laser.
While many of these dyes have provided a useful alternate to CFSE, since they emit at wavelengthscompatible with fluorochromes emitting in the CFSE/FITC emission range, most are inferior to CFSEin detecting cell division. Invariably this is due, among other differences, to these dyes being unable toresolve discrete division peaks as well as CFSE [7, 28–31]. In our experience so far, only one dye, CellTrace Violet (CTV), is comparable to CFSE in measuring lymphocyte division [7]. Indeed, when wehave performed a comprehensive comparison of lymphocytes labelled with CFSE and CTV [7], CTV-labelling performs on a par with CFSE-labelling in almost every aspect of cell proliferation. This ishighlighted in Figure 2 which shows the clarity of the distinct division peaks detected by CFSE andCTV in proliferating T cell populations. Therefore, we would recommend CTV as the dye of choice forlymphocyte proliferation studies in which, due to spectral overlap, other flow cytometry assays are notcompatible with CFSE fluorescence.
56
“QuahLyonsParish˙MMNP” — 2012/10/9 — 21:50 — page 57 — #5i
i
i
i
i
i
i
i
B.J.C. Quah, A.B. Lyons, C.R. Parish CFSE-like dyes for measuring lymphocyte proliferation
3. Lymphocyte dye labelling methods and analytical consideration
The methodology used to label lymphocytes with proliferation-measuring dyes can have a severe impacton the fluorescence variability and viability of labelled cells as well as the number of possible divisionsdetectable. In this section we overview several important technical considerations when labelling cellswith dyes like CFSE and CTV.
3.1. Dye preparation
Since CFSE and CTV will react upon exposure to aqueous solutions it is essential that stock solutionsare prepared in anhydrous DMSO. Aliquots (both powder and solution) that are stored below roomtemperature should be brought to room temperature before exposure to air to avoid water condensationoccurring and reacting with the dye.
3.2. Dye concentration
The concentration of dye used to label lymphocytes will determine the fluorescence level of the labelledcells are and therefore how many divisions can be resolved. In the case of CFSE and CTV, there is alinear relationship between the concentration of the dye used and the fluorescence intensity of the labelledcells [32–36]. The dye concentration used is ultimately limited by the amount of spectral “spill over” thatoccurs into spectrally adjacent detectors of the flow cytometer (since this “spill over” increases with dyefluorescence intensity) and also the cellular toxicity that can be associated with higher dye concentrations[5,6]. Toxicity becomes less limiting when high levels of reactive amino groups are present in the labellingbuffer ([7] see below). Our current labelling protocols involve exposing cells to dye concentrations rangingfrom 10 to 80µM, these labelling conditions resulting in optimum proliferation peak resolution, with upto 10 to 12 divisions being detectable at higher dye loading concentrations [7].
3.3. Technique of mixing cells with dye
Since CFSE and CTV rapidly accumulate within cells upon dye exposure, it is critical that the dye ismixed throughout the cell suspension as quickly as possible to ensure homogeneous cell labelling. Indeed,to achieve low variance of fluorescent peaks in cell proliferation assays initial uniform labelling of cellpopulations is essential. There are several techniques described to accomplish this [5, 9], with uniformlabelling being quite easily achieved by vortexing the cells whilst adding the concentrated dye to a 1–2ml suspension of cells.
3.4. Length of cell-dye incubation
Labelling of lymphocytes with CFSE and CTV essentially reaches saturation levels after 5 min incubationof the dyes with cells at 20 ◦C.
3.5. Cell concentration
It is possible to label lymphocyte suspensions ranging in concentration from 1 × 10⁶–1 × 10⁸ cells/mland any cellular toxicity associated with lower cell concentrations can be overcome by adding moleculescontaining free amino groups to the labelling buffer (see below).
3.6. Labelling volume
Typically lymphocyte labelling is performed with cell suspensions of 1-2 ml, as this volume allows for therapid mixing of the dye throughout the cell suspension.
57

“QuahLyonsParish˙MMNP” — 2012/10/9 — 21:50 — page 58 — #6i
i
i
i
i
i
i
i
B.J.C. Quah, A.B. Lyons, C.R. Parish CFSE-like dyes for measuring lymphocyte proliferation
3.7. Labelling buffer
Several studies have shown that CFSE labelling can be toxic for cells [5,6], not just in terms of cell deathbut also in terms of cell function. For example, apparent cell viability can be unaffected by the labellingprocedure but the ability of the cells to proliferate can be seriously compromised. This problem can beeasily overcome by labelling cells in tissue culture medium containing high concentrations of protein, themedium and protein providing a high concentration of free amino groups in the labelling solution. It isthought that the free amino groups prevent extracellular CFSE from over-labelling cell surface proteinsand interfering with cell proliferation [5,7]. We currently use RPMI1640 tissue culture medium containing10% foetal calf serum (FCS) as the labelling solution to limit the toxicity of the labelling procedure [7].
3.8. Washing
Typically, after labelling lymphocytes with CFSE and CTV, to remove excess dye the cells are washedthree times by centrifugation with medium containing high protein content.
3.9. Spectral spill over of brightly labelled cells
The fluorescence intensity of dye-labelled cells declines significantly in the first few days following labellingbut particularly during the first 24 hours. Although this change does not affect the ability to track cellproliferation, as the fluorescence decrease is proportionally uniform across all division peaks, the highlevel of fluorescence achievable with CFSE and CTV means there can be significant spectral “spill over”of fluorescence into spectrally adjacent detector channels of flow cytometers, particularly within thesefirst few days. This is particularly notable for CFSE “spill over” into the PE detector and CTV spill overinto the Pacific Orange detector of flow cytometers and is, therefore, something that should be taken intoconsideration when designing experiments that require very brightly labelled cells.
With these technical considerations taken into account and appropriate methods used to label lym-phocyte with CFSE and CTV, cell proliferation experiments can easily detect 8 divisions (i.e., 9 distinctfluorescence peaks) at relatively high resolution (Figure 3) and can potentially resolve additional divisionsbefore interference from cell autofluorescence.
4. Experimental and biological variables that can affect cell division resolution
Under identical experimental conditions, replicate samples of lymphocytes labelled with CFSE or CTVgenerate highly reproducible proliferation profiles (Figure 4). However, it should be noted that in vitrocell proliferation assays are acutely sensitive to starting cell concentrations, as cell density can profoundlyinfluence initiation of proliferation. Furthermore, despite using rigorous procedures to label lymphocyteswith CFSE and CTV, invariably the resolution of cell division peaks detected by these two dyes tends todecrease as cell division number increases, suggesting that other factors apart from the labelling techniqueplay a role in division resolution. Indeed, over the years we have noted several experimental and biologicalvariables that can impact on cell dye fluorescence and, therefore, represent potential considerations whenanalysing dye dilution data sets.
4.1. Lymphocyte subset differences
When unfractionated populations of lymphocytes from different lymphoid organs are labelled with CFSE,CTV or Cell Proliferation Dye eFluor 670 (CPD) we have noted that lymphocyte subsets within thesepopulations label with different fluorescence intensities [7]. Most notably, B cells tend to label with higherlevels of CPD and CTV than T cells (Figure 5a, left panels). This finding highlights the importance ofdefining lymphocyte subsets with labelled monoclonal antibodies to delineate target populations preciselyin order to achieve the least fluorescence variance of dye labelled cells and, therefore, the best divisionresolution using the fluorescent dyes. We have also observed that in general, B cells tend to have poorerdivision resolution than T cells, with the variance of fluorescent division peaks being significantly broaderwith B cells compared to T cells (this is highlighted in Figure 5a, right panels). The reason for this
58

“QuahLyonsParish˙MMNP” — 2012/10/9 — 21:50 — page 59 — #7i
i
i
i
i
i
i
i
B.J.C. Quah, A.B. Lyons, C.R. Parish CFSE-like dyes for measuring lymphocyte proliferation
Figure 3. High level CFSE-labelling can measure >8 lymphocyte divisions.Spleen cells from T cell receptor (TCR) transgenic mice were labelled with 80µM CFSEin RPMI1640 medium supplemented with 10% FCS and stimulated with specific antigen[7] in an in vivo assay for 4 days and CD8+ T cells analysed by flow cytometry for dyedilution. In addition, unstimulated CFSE-labelled CD8+ T cells and unlabelled CD8+T cells were used to monitor undivided cell fluorescence and cell autofluorescence.
59

“QuahLyonsParish˙MMNP” — 2012/10/9 — 21:50 — page 60 — #8i
i
i
i
i
i
i
i
B.J.C. Quah, A.B. Lyons, C.R. Parish CFSE-like dyes for measuring lymphocyte proliferation
Figure 4. Reproducibility of CFSE and CTV-generated division profiles.Spleen cells from mice were split in to 8 identical aliquots and 4 separate aliquots la-belled with 10µM of CFSE and the remaining 4 aliquots labelled with 10µM CTV inRPMI1640 medium supplemented with 10% FCS. Each of the 8 dye-labelled spleen cellsamples were cultured independently with or without multiple mitogens [7] in vitro for3 days and B cells, CD4+ T cells and CD8+ T cells analysed by flow cytometry fordye dilution. a: Replicate samples of B cells, CD4+ T cells and CD8+ T cells fromspleen cell cultures were assessed for CFSE or CTV fluorescence intensity after 3 daysculture. Data shows low variability in division profiles between intra-dye and inter-dyereplicates. b: % of cells in each division peak within each dye-labelled cell subset acrossall replicates from data depicted in a. Data shows low variability in the proportion ofcells detected in each cell division detected between intra-dye and inter-dye replicates.c: Mean fluorescence intensity (MFI) of CFSE or CTV in cell subset replicates in un-stimulated spleen cells from data depicted in a showing low variability in fluorescence ofreplicate samples labelled with each dye.
60

“QuahLyonsParish˙MMNP” — 2012/10/9 — 21:50 — page 61 — #9i
i
i
i
i
i
i
i
B.J.C. Quah, A.B. Lyons, C.R. Parish CFSE-like dyes for measuring lymphocyte proliferation
appears to be, at least in part, due to the capacity of B cells to take up dye from surrounding dye-labelled cells to a greater degree than T cells, which results in an increase in division peak variance andconsequently decreased division resolution [7] (see dye transfer below).
4.2. In vitro versus in vivo assays
Fluorescent dye-labelled lymphocytes can be used to initiate both in vitro and in vivo experiments fromthe same sample, and the cell fluorescence profiles of dividing cell populations are identical in bothexperimental formats [34]. Divided cells can be monitored in vivo for extended periods of time anddifferences in division behaviour, location and survival between lymphocyte subsets monitored [33, 37].However, the resolution of cell division fluorescent peaks is generally better in in vivo assays compared toin vitro assays, particularly when comparing B cell division profiles [7]. We suspect that this difference isa consequence of dye transfer between cells altering division peak fluorescence variance, since dye transferwould be more pronounced in in vitro cultures than in an in vivo setting. Such an effect would result influorescence variance and hence division resolution being better in in vivo assays.
4.3. Cell autofluorescence
The variance of cell autofluorescence is not uniform across all spectral channels of a flow cytometer. Inparticular, autofluorescence of cells detected in the channels used for CPD and CTV measurement hasbroader variance than the autofluorescence of cells in the channel used for CFSE detection [7] (Figure5b). We have found that this variance in autofluorescence correlates with the poorer resolution of fluo-rescent division peaks at later cell divisions, suggesting that as the fluorescence intensity of proliferatingdye-labelled cells approaches cell autofluorescence levels they will be influenced more by their autoflu-orescence variability. An additional consideration here is that when cells are activated they tend tobecome more autofluorescent than non-activated cells, particularly in the CTV detecting channel, whichcan compromise the ability of CTV to detect later cell divisions [7] (Figure 5b). These effects of cell aut-ofluorescence on division peak resolution can be reduced by increasing the initial fluorescence intensityof the dye labelled cells by using higher dye concentrations, which allows more divisions to be discretelyobserved before cell fluorescence approaches autofluorescence levels [7] (Figure 5a, right panels).
4.4. Dye transfer
Most fluorescent dyes have some ability to transfer to surrounding cells even after extensive washingof labelled lymphocytes. This appears to be due to both dye-specific and cell intrinsic properties. Forexample, we have observed that CPD transfers more than CFSE and CFSE transfers more than CTVbetween dye labelled and unlabelled lymphocytes [7] (Figure 5c). We have also observed that B cells tendto acquire more dye from surrounding dye-labelled cells compared to T cells [7] (Figure 5c). It shouldbe noted that B cells are known to transfer cell components more readily to bystander cells than T cells,particularly when they are activated [38,39].
5. Concluding remarks
Vital fluorescent dyes, such as CFSE and CTV, provide excellent tools to assess and mathematicallymodel lymphocyte proliferation. In order to obtain the optimum results with dye-dilution proliferationassays and associated mathematical modelling of the data generated, several experimental and biologicalparameters should be taken into account. Methodologically, lymphocyte populations should be labelledas quickly as possible with high concentrations (10–80µM) of the fluorescent dyes in a labelling mediumthat yields uniformly brightly labelled cells with minimal dye toxicity issues. With current standardflow cytometers, this will result in an initial fluorescence intensity of undivided cells that is capableof detecting up to 12 cell divisions before the dilution of the dye reaches cell autofluorescence levels.Lymphocyte subsets should be delineated as specifically as possible when analysing dye-dilution datato overcome subset differences in dye uptake. Ideally, in order to accurately gauge the background
61

“QuahLyonsParish˙MMNP” — 2012/10/9 — 21:50 — page 62 — #10
i
i
i
i
i
i
i
i
B.J.C. Quah, A.B. Lyons, C.R. Parish CFSE-like dyes for measuring lymphocyte proliferation
Figure 5. Factors contributing to the resolution of fluorescent division peakswith different fluorescent dyes. Spleen cells from mice were labelled with 0–40µM ofCFSE, CTV and/or CPD in RPMI1640 medium supplemented with 10% FCS, culturedwith or without multiple mitogens [7] in vitro for 1-4 days and T cells and B cellsanalysed by flow cytometry for fluorescent properties. a, left panels: Unstimulated Tand B cells were simultaneously co-labelled with all three fluorescent dyes and subsetdifferences in dye fluorescence intensity assessed. a, right panels: T and B cells labelledwith 10, 20 and 40µM CFSE and stimulated in vitro for 4 days were assessed for CFSEfluorescence intensity, the data showing subset differences in division peak resolution andincreased resolution of later cell division peaks with higher initial CFSE dye labellingconcentrations. b: Autofluorescence of activated and non-activated T and B cells. c:CFSE, CTV and CPD transfer from dye-labelled lymphocytes (donors) to unlabelled Tand B cells (recipients) during in vitro culture.
autofluorescence that dividing cells will reach after multiple cell divisions, activated unlabelled cells shouldbe used as the autofluorescence control, since these cells often exhibit higher levels of autofluorescencethan non-activated or resting lymphocytes. While controlling these technical variables will help optimisethe detection of lymphocyte cell divisions, they will only have a limited effect on other biological andexperimental parameters that can influence cell division resolution, such as the spontaneous transfer offluorescent dyes to bystander cells, intrinsic lymphocyte subset variability and inherent differences in thecell division data obtained from in vitro versus in vivo experiments.
Acknowledgements. This work was supported by a Project Grant to BQ and CP and a Program Grant to CPfrom the National Health and Medical Research Council (NHMRC) of Australia. We wish to thank HarpreetVohra and Michael Devoy for their excellent maintenance of the JCSMR FACS laboratory.
References
[1] S.A. Weston, C.R. Parish. New fluorescent dyes for lymphocyte migration studies. Analysis by flow cytometry andfluorescence microscopy. J Immunol Methods, 133 (1990), no. 1, 87–97.
[2] A.B. Lyons, C.R. Parish. Determination of lymphocyte division by flow cytometry. J Immunol Methods, 171 (1994)no. 1, 131–7.
[3] A.B. Lyons. Divided we stand: tracking cell proliferation with carboxyfluorescein diacetate succinimidyl ester. ImmunolCell Biol, 77 (1999), no. 6 , 509–15.
62
“QuahLyonsParish˙MMNP” — 2012/10/9 — 21:50 — page 63 — #11
i
i
i
i
i
i
i
i
B.J.C. Quah, A.B. Lyons, C.R. Parish CFSE-like dyes for measuring lymphocyte proliferation
[4] R.E. Nordon, S.S. Ginsberg, C.J. Eaves. High-resolution cell division tracking demonstrates the FLt3-ligand-dependenceof human marrow CD34+CD38- cell production in vitro. Br J Haematol, 98 (1997), no. 3, 528–39.
[5] C.R. Parish, M.H. Glidden, B.J. Quah, H.S. Warren. Use of the intracellular fluorescent dye CFSE to monitor lym-phocyte migration and proliferation. Curr Protoc Immunol, 84 (2009), 4.9.1–4.9.13.
[6] J. Lastovicka, V. Budinsky, R. Spisek, J. Bartunkova. Assessment of lymphocyte proliferation: CFSE kills dividingcells and modulates expression of activation markers. Cell Immunol, 256 (2009), no. 1-2, 79–85.
[7] B.J. Quah, C.R. Parish. New and improved methods for measuring lymphocyte proliferation in vitro and in vivo usingCFSE-like fluorescent dyes. J Immunol Methods, 379 (2012), no. 1-2, 1–14.
[8] B.J. Quah, H.S. Warren, C.R. Parish. Monitoring lymphocyte proliferation in vitro and in vivo with the intracellularfluorescent dye carboxyfluorescein diacetate succinimidyl ester. Nat Protoc, 2 (2007), no. 9, 2049–56.
[9] B.J. Quah, C.R. Parish. The use of carboxyfluorescein diacetate succinimidyl ester (CFSE) to monitor lymphocyteproliferation. Journal of visualized experiments : JoVE, 44 (2010).
[10] R.N. Morrison, A.B. Lyons, B.F. Nowak, J.D. Hayball. Snapper (Pagrus auratus) leucocyte proliferation is synergisti-cally enhanced by simultaneous stimulation with LPS and PHA. Fish Shellfish Immunol, 16 (2004), no. 3, 307–19.
[11] T. Holyoake, X. Jiang, C. Eaves, A. Eaves. Isolation of a highly quiescent subpopulation of primitive leukemic cells inchronic myeloid leukemia. Blood, 94 (1999), no. 6, 2056–64.
[12] J.E. Ueckert, G. Nebe von-Caron, A.P. Bos, P.F. ter Steeg. Flow cytometric analysis of Lactobacillus plantarum tomonitor lag times, cell division and injury. Lett Appl Microbiol, 25 (1997), no. 4, 295–9.
[13] P.D. Hodgkin, J.H. Lee, A.B. Lyons. B cell differentiation and isotype switching is related to division cycle number. JExp Med, 184 (1996), no. 1, 277–81.
[14] A.V. Gett, P.D. Hodgkin. Cell division regulates the T cell cytokine repertoire, revealing a mechanism underlyingimmune class regulation. Proc Natl Acad Sci U S A, 95 (1998), no. 16, 9488–93.
[15] J. Hasbold, A.B. Lyons, M.R. Kehry, P.D. Hodgkin. Cell division number regulates IgG1 and IgE switching of B cellsfollowing stimulation by CD40 ligand and IL-4. Eur J Immunol, 28 (1998), no. 3, 1040–51.
[16] J. Hasbold, P.D. Hodgkin. Flow cytometric cell division tracking using nuclei. Cytometry, 40 (2000), no. 3, 230–7.
[17] S. Blake, T.P. Hughes, G. Mayrhofer, A.B. Lyons. The Src/ABL kinase inhibitor dasatinib (BMS-354825) inhibitsfunction of normal human T-lymphocytes in vitro. Clin Immunol, 127 (2008), no. 3, 330–9.
[18] S.J. Blake, A.B. Lyons, T.P. Hughes. Nilotinib inhibits the Src-family kinase LCK and T-cell function in vitro. J CellMol Med, 13 (2009), no. 3, 599–601.
[19] C.K. Fraser, S.J. Blake, K.R. Diener, A.B. Lyons, M.P. Brown, T.P. Hughes, J.D. Hayball. Dasatinib inhibits recom-binant viral antigen-specific murine CD4+ and CD8+ T-cell responses and NK-cell cytolytic activity in vitro and invivo. Exp Hematol, 37 (2009), no. 2, 256–65.
[20] R.E. Nordon, M. Nakamura, C. Ramirez, R. Odell. Analysis of growth kinetics by division tracking. Immunol Cell Biol,77 (1999), no. 6, 523–9.
[21] R.J. De Boer, V.V. Ganusov, D. Milutinovic, P.D. Hodgkin, A.S. Perelson. Estimating lymphocyte division and deathrates from CFSE data. Bull Math Biol, 68 (2006), no. 5, 1011–31.
[22] E.D. Hawkins, M. Hommel, M.L. Turner, F.L. Battye, J.F. Markham, P.D. Hodgkin. Measuring lymphocyte prolifera-tion, survival and differentiation using CFSE time-series data. Nat Protoc, 2 (2007), no. 9, 2057–67.
[23] R.E. Nordon, K.H. Ko, R. Odell, T. Schroeder. Multi-type branching models to describe cell differentiation programs.J Theor Biol, 277 (2011), no. 1, 7–18.
[24] H.Y. Lee, E. Hawkins, M.S. Zand, T. Mosmann, H. Wu, P.D. Hodgkin, A.S. Perelson. Interpreting CFSE obtaineddivision histories of B cells in vitro with Smith-Martin and cyton type models. Bull Math Biol, 71 (2009), no. 7,1649–70.
[25] S.J. Blake, T.P. Hughes, A.B. Lyons. Drug-interaction studies evaluating T-cell proliferation reveal distinct activity ofdasatinib and imatinib in combination with cyclosporine A. Exp Hematol, (2012).
[26] H.T. Banks, K.L. Sutton, W.C. Thompson, G. Bocharov, M. Doumic, T. Schenkel, J. Argilaguet, S. Giest, C. Peligero,A. Meyerhans. A new model for the estimation of cell proliferation dynamics using CFSE data. J Immunol Methods,373 (2011), no. 1-2, 143-60.
[27] H.T. Banks, K.L. Sutton, W.C. Thompson, G. Bocharov, D. Roose, T. Schenkel, A. Meyerhans. Estimation of cellproliferation dynamics using CFSE data. Bull Math Biol, 73 (2011), no. 1, 116–50.
[28] C.R. Parish. Fluorescent dyes for lymphocyte migration and proliferation studies. Immunol Cell Biol, 77 (1999), no. 6,499–508.
[29] R. Zeng, R. Spolski, E. Casas, W. Zhu, D.E. Levy, W.J. Leonard. The molecular basis of IL-21-mediated proliferation.Blood, 109 (2007), no. 10, 4135–42.
[30] P.K. Wallace, J.D. Tario, Jr., J.L. Fisher, S.S. Wallace, M.S. Ernstoff, K.A. Muirhead. Tracking antigen-driven re-sponses by flow cytometry: monitoring proliferation by dye dilution. Cytometry, Part A, 73 (2008), no. 11, 1019–34.
[31] Y. Singh, J. Dyson, O.A. Garden. Use of SNARF-1 to measure murine T cell proliferation in vitro and its applicationin a novel regulatory T cell suppression assay. Immunol Letters, 140 (2011), no. 1-2, 21–9.
[32] D.A. Fulcher, A.B. Lyons, S.L. Korn, M.C. Cook, C. Koleda, C. Parish, B. Fazekas de St Groth, A. Basten. The fateof self-reactive B cells depends primarily on the degree of antigen receptor engagement and availability of T cell help.J Exp Med, 183 (1996), no. 5, 2313–28.
[33] A.B. Lyons. Pertussis toxin pretreatment alters the in vivo cell division behaviour and survival of B lymphocytes afterintravenous transfer. Immunol Cell Biol, 75 (1997), no. 1, 7–12.
63

“QuahLyonsParish˙MMNP” — 2012/10/9 — 21:50 — page 64 — #12i
i
i
i
i
i
i
i
B.J.C. Quah, A.B. Lyons, C.R. Parish CFSE-like dyes for measuring lymphocyte proliferation
[34] A.B. Lyons. Analysing cell division in vivo and in vitro using flow cytometric measurement of CFSE dye dilution. JImmunol Methods, 243 (2000), no. 1-2, 147–54.
[35] A.B. Lyons., J. Hasbold, P.D. Hodgkin. Flow cytometric analysis of cell division history using dilution of carboxyflu-orescein diacetate succinimidyl ester, a stably integrated fluorescent probe. Method Cell Biol, 63 (2001), 375–98.
[36] A.B. Lyons, K.V. Doherty. Flow cytometric analysis of cell division by dye dilution. Current protocols in cytometry,(2004), Chapter 9: Unit 9 11.
[37] A.B. Lyons, M. Watkins, C.C. Simpson, H. Konrad Muller. Modulation of lymphocyte migration to the murine spleenafter marginal zone macrophage phagocytosis of blood-borne particulate material. Immunol Invest, 35 (2006), no. 1,75–92.
[38] B.J. Quah, V.P. Barlow, V. McPhun, K.I. Matthaei, M.D. Hulett, C.R. Parish. Bystander B cells rapidly acquireantigen receptors from activated B cells by membrane transfer. Proc Natl Acad Sci U S A, 105 (2008), no. 11, 4259–64.
[39] G. Chaudhri, B.J. Quah, Y. Wang, A.H. Tan, J. Zhou, G. Karupiah, C.R. Parish. T cell receptor sharing by cytotoxicT lymphocytes facilitates efficient virus control. Proc Natl Acad Sci U S A, 106 (2009), no. 35, 14984–14989.
64


![[E. J. Mishan, Euston Quah] Cost Benefit Analysis(Bookos.org)](https://img.pdfslide.us/doc/110x75/55cf99a0550346d0339e5b71/e-j-mishan-euston-quah-cost-benefit-analysisbookosorg.jpg)