Embed Size (px)
Citation preview
The Use of an Internal Locus of Control Scale as a Predictor of Exercise
Adherence in Children Ages 6-12
by
Holly J. Aguila
A Thesis Presented in Partial Fulfillment of the Requirements for the Degree
Master of Science
Approved April 2012 by the Graduate Supervisory Committee:
Jack Chisum, Chair
Larry Woodruff Kathy Campbell
ARIZONA STATE UNIVERSITY
May 2012
i
ABSTRACT
The U.S. Surgeon General has recommended that all Americans engage in
regular physical activity throughout the lifespan as a way to maintain and improve
health and reduce the risk of developing cardiovascular disease, diabetes, obesity,
or other chronic conditions. The recommendation for children is a minimum of
60 minutes of moderate and intense physical activity everyday. As children enter
adolescence their level of physical activity often decreases; and active adults were
typically active adolescents. More than 50% of adults that begin a physical
activity program discontinue the behavior within 9 months. Interventions to
increase physical activity have looked at self-esteem and self-efficacy. Locus of
control (LOC) is a concept that people either view their own behavior as
influencing the events around them (internal) or other events controlling their fate
or destiny (external). This study looked at locus of control as a predictor of
exercise adherence and future exercise patterns in children ages 6-12 in Mesa,
AZ. Locus of control as measured by the Child Nowicki-Strickland Internal
External (CNSIE) scale differed by gender and by physical activity group at
school at post-intervention. Self-reported physical activity as measured by the
Physical Activity Questionnaire for Older Children (PAQ-C) showed differences
in physical activity (PA) levels by gender for baseline school PA, by age group
for baseline non-school PA, by gender and age group for post-intervention school
PA, and by gender only for post-intervention non-school PA. A secondary
objective was to assess if the Think Healthy About Nutrition and eXercise
(THANX) after school program influenced participants’ LOC or PA patterns.
ii
This study found that the THANX program had no effect on LOC or PA level at
any time point.
iii
DEDICATION
This thesis is dedicated to my husband, Jaime, and to my children, Ben and
Eliana. Thank you all for the sacrifices you made so that I could pursue new
interests and opportunities. May you always be happy, healthy and active. I love
you.
iv
ACKNOWLEDGEMENTS
This thesis would not have been possible without the ongoing guidance
and support of many people over the past four years.
First and foremost, I am eternally grateful to Dr. Jack Chisum, who
mentored me along the way and recognized talents in me that I did not realize I
had.
Larry Woodruff advised me throughout my residence in the Master’s
program and taught me the importance of happiness and stress management.
Dr. Kathy Campbell pushed me to stop procrastinating and just get it done,
and she came through for me at the end when I doubted I could.
Dr. Richard Hector assisted me with the statistical analyses and taught me
that the data and subjects that we get are what we have to work with.
Julie Rice and Sue Callahan were always ready to answer my questions
and truly keep the department running smoothly.
Many graduate students in the EXW program have come and gone during
my time here. I cherish the time we spent together and appreciate the support and
friendship you extended to me: Quita, Lisa, Kate, Amanda, Shannon, Janelle,
Dana, Michelle, Darith, Nivi, and Dharini.
v
TABLE OF CONTENTS
Page
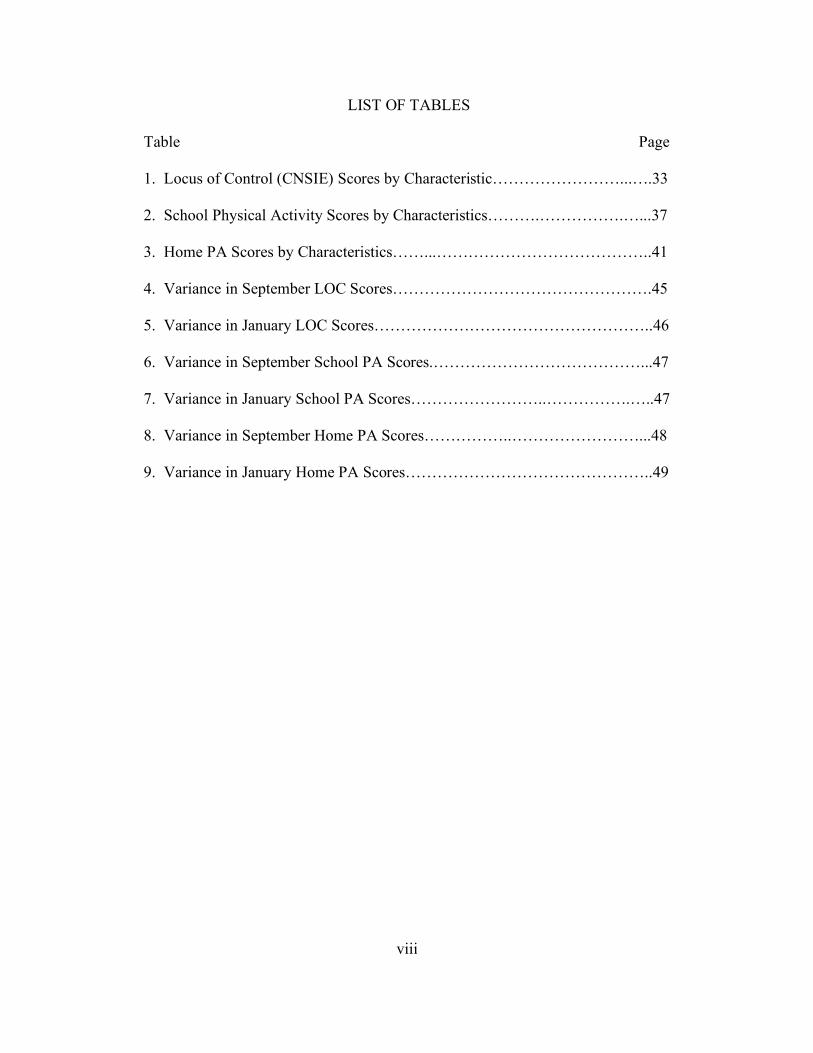
LIST OF TABLES………………………………………………………...……viii
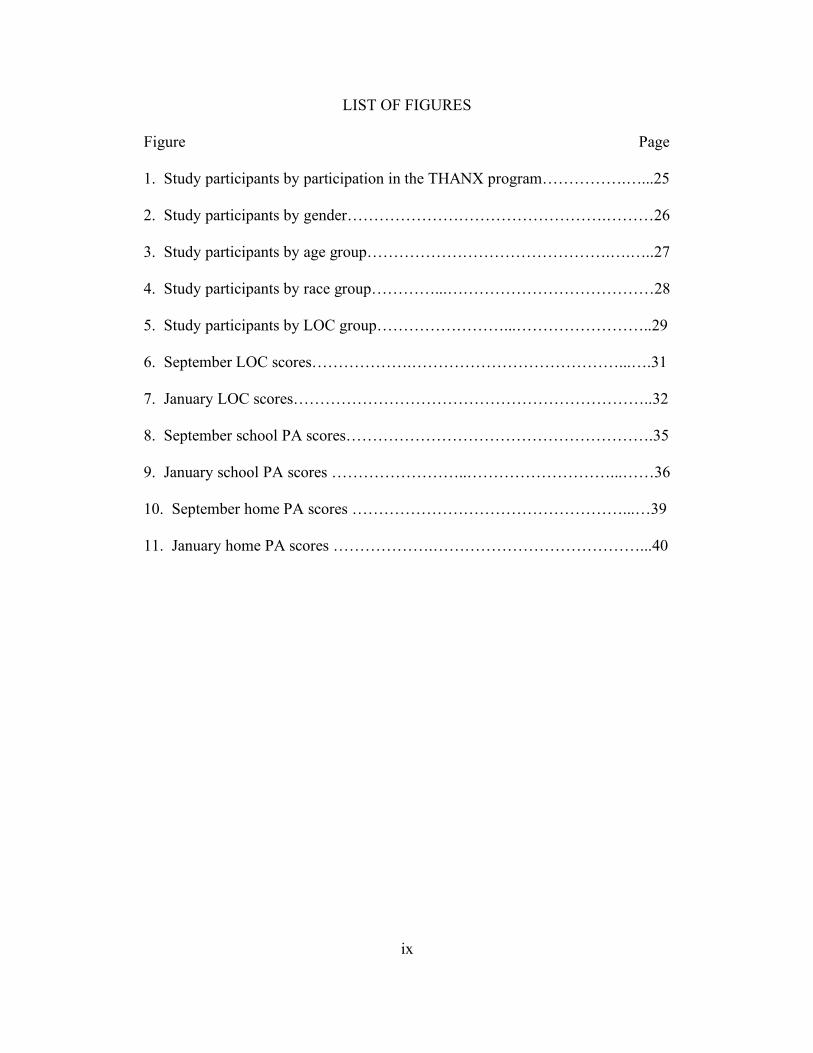
LIST OF FIGURES…………………………………………………………...….ix
CHAPTER
INTRODUCTION…………………………………………………….…..1
Overview………………………………………………..…………1
Research Aim and Hypotheses……………………………………2
Definition of Terms………………………………………………..2
Delimitations………………………………………………………3
Limitations………………………………………………………...4
2 REVIEW OF LITERATURE………………………………………..……5
Exercise Adherence……………………………………………….5
Childhood Inactivity………………………………………………8
Self-Esteem………………………………………………………12
Self-Motivation………….……………………………………….15
Self-Efficacy…………….……………………………………….15
Locus of Control………………………………………………....16
Instruments to Measure Physical Activity……………………….18
3 METHODS…………………………………………………………...….20
Participants and Study Design…………………………………...20
Child Nowicki-Strickland Internal-External (CNSIE) Locus of
Control Scale……………………………………………..21
vi
CHAPTER Page
Physical Activity Questionnaire – Child (PAQ-C)………………21
Protocol Procedures – CNSIE and PAQ-C Questionnaires……...22
Statistical Analysis……………………………………………….22
4 RESULTS………………………………………………………………..25
Demographics……………………………………………………25
Locus of Control (LOC)………………………………………….30
Physical Activity Level at School………………………………..34
Physical Activity Level at Home………………………………...37
Changes in Physical Activity Level at School…………………...41
Changes in Physical Activity Level at Home……………………42
Changes in Locus of Control Group……………………………..43
Changes in Locus of Control…………………………………….44
Regression Analysis……………………………………………...44
5 DISCUSSION……………………………………………………………50
6 CONCLUSIONS & APPLICATIONS…………………………………..54
REFERENCES
APPENDIX
A IRB APPROVAL………………………………………………………...66
B PARENTAL CONSENT FORM: ENGLISH……………………………68
C PARENTAL CONSENT FORM: SPANISH…………………………...70
D CHILD ASSENT FORM………………………………………………...72
E FLOW CHART…………………………………………………………..74
vii
APPENDIX Page
F CNSIE – ENGLISH……………………………………………………...76
G CNSIE – SPANISH……………………………………………………...79
H PAQ-C (ENGLISH)……………………………………………………...82
I PAQ-C (SPANISH)……………………………………………………...87
viii
LIST OF TABLES
Table Page
1. Locus of Control (CNSIE) Scores by Characteristic……………………...….33
2. School Physical Activity Scores by Characteristics……….…………….…...37
3. Home PA Scores by Characteristics……...…………………………………..41
4. Variance in September LOC Scores………………………………………….45
5. Variance in January LOC Scores……………………………………………..46
6. Variance in September School PA Scores.…………………………………...47
7. Variance in January School PA Scores……………………..…………….…..47
8. Variance in September Home PA Scores……………..……………………...48
9. Variance in January Home PA Scores………………………………………..49
ix
LIST OF FIGURES
Figure Page
1. Study participants by participation in the THANX program…………….…...25
2. Study participants by gender………………………………………….………26
3. Study participants by age group……………………………………….….…..27
4. Study participants by race group…………...…………………………………28
5. Study participants by LOC group……………………...……………………..29
6. September LOC scores……………….…………………………………...….31
7. January LOC scores…………………………………………………………..32
8. September school PA scores………………………………………………….35
9. January school PA scores ……………………..………………………...……36
10. September home PA scores ……………………………………………...…39
11. January home PA scores ……………….…………………………………...40
1
CHAPTER 1
INTRODUCTION
Overview
Health benefits and risk reductions associated with an active lifestyle have
led the U. S. Surgeon General to recommend regular exercise throughout the
lifespan. In spite of this recommendation, participation in, and adherence to
regular physical activity in childhood, adolescence, and adulthood remains low
(Dishman & Buckworth 1996; 1997). Research has shown that physically active
children tend to be physically active adults (Janssen, Katzmarzyk, Boyce,
Vereecken, Mulvihill, & Roberts,2005; Kjonniksen, Torsheim, & Wold, 2008) so
increasing physical activity in childhood could lead to improved health at all ages,
as the active behavior should continue throughout life throughout the lifespan.
There is a positive relationship between self-efficacy and physical activity
levels, so one way to increase PA levels is to increase one’s self-efficacy for
living an active lifestyle (Booth, Owen, Bauman, Clavisi, & Leslie, 2000; Clark &
Nothwehr, 1999; Sternfeld, Ainsworth, & Quesenberry, 1999; Sullum, Clark, &
King, 2000; Bungum, Orsak, & Chang, 1997; Dishman & Ikes, 1981; Dishman,
Ickes, & Morgan, 1980; Gale, Eckhoff, Mogel, & Rodnick, 1984). Self-efficacy is
one’s confidence in his or her ability to successfully engage in a behavior. A
construct closely associated with self-efficacy is that of locus of control, which
states that people either see themselves as in control of their lives (internal) or that
outside forces and fate control their destinies (external) (Rotter, 1966; Trost,
Owen, Bauman, Sallis, & Brown, 2002). Although the locus of control construct
2
is heavily utilized in social and health psychology to examine adherence, it
remains underutilized in exercise and wellness research. Therefore,
understanding the relationship between locus of control and the prediction of
exercise adherence may facilitate intervention programs to reduce sedentary
behavior at all stages of the lifespan.
Research Aim and Hypotheses
The primary objective of this study is to examine the relationship between
internal locus of control and exercise adherence in a population of children ages
6-12 enrolled at Sequoia Elementary School in Mesa, Arizona. It is hypothesized
that subjects with a greater internal locus of control will exhibit increased PA
patterns and participate to a greater extent in future exercise and that subjects with
a more external locus of control will be less active and less likely to engage in
future exercise. A secondary objective is to examine whether voluntary
participation in the Think Healthy About Nutrition and eXercise (THANX) after-
school program influenced students’ internal locus of control and physical activity
behaviors. It is hypothesized that students that participate in the THANX
program will show an increase in both internal locus of control and in physical
activity.
Definition of Terms
Physical Activity (PA): Bodily movement produced by the contraction of
skeletal muscles that results in a substantial increase over resting energy
expenditure (USDHHS, 2008).
3
Exercise: PA consisting of planned, structured, and repetitive bodily
movements that improve or maintain one or more components of physical fitness
(USDHHS, 2008).
Locus of control: A construct from Julian B. Rotter’s (1966) social
learning theory of personality that individuals believe that they are in control of
what happens to them, or that what happens to them is a function of chance, fate,
or luck.
Child Nowicki-Strickland Internal-External Scale (CNSIE): A 40-item
questionnaire requiring yes or no answers used to assess locus of control
measuring internal versus external forces (Nowicki & Strickland, 1973).
Self-efficacy: The personal belief in one’s ability to perform or
accomplish a specific task or activity.
Self-motivation: The personal initiative an individual utilizes to start or
continue an activity or behavior.
Self-esteem: A general regard for one’s overall worth.
Delimitations
Study participants were comprised of a convenience sample of students at
Sequoia Elementary School in Mesa, Arizona. One hundred sixteen boys and
girls in grades 3 through 6 participated in the study. All participants had a signed
parental consent form and a signed child assent form. All participants were able
to read written, or understand spoken English or Spanish. One quarter of the
participants were enrolled in the Think Healthy About Nutrition and eXercise
(THANX) after school program, a free program for kindergarten through 6th grade
4
students created by Health Choice Arizona to improve children’s quality of life by
providing the resources, education, and support to increase their daily PA and
nutritional awareness. This adult-supervised program took place every Monday
through Thursday at Sequoia Elementary School from 3:00 p.m. – 5:15 p.m. The
comparison group was comprised of Sequoia students that did not participate in
the THANX program.
Limitations
All participants were enrolled at Sequoia Elementary School in Mesa,
Arizona; therefore, the results may not be generalizable for other populations.
The sample size is fairly small limiting the ability to apply the results to the
population at large.
5
CHAPTER 2
REVIEW OF LITERATURE
Exercise Adherence
The U.S. Surgeon General has recommended that engaging in regular
physical activity is a healthy behavior throughout the lifespan, as this reduces the
risk of many chronic diseases and adverse health outcomes, including obesity,
cardiovascular disease, and diabetes (USDHHS, 2010). The recommended
amount of physical activity (PA) in which all healthy adults should engage is at
least 150 minutes of moderate-intensity activity per week. Activities of moderate-
intensity include, but are not limited to, brisk walking, water aerobics, gardening,
bicycling on flat terrain, and dancing; it is an intensity in which the heart rate is
elevated, however a person does not get out of breath quickly, can carry on a
conversation, and may not perspire. For adults who wish to engage in more
vigorous physical activity such as running or jogging, riding a bike faster than 10
miles per hour, aerobic dancing (such as in a “step” or “cardio” exercise class),
swimming laps, or other activities in which a person’s heart rate is elevated such
that he or she is out of breath to the point of being unable to say more than a few
words at a time, the recommended amount of activity is at least 75 minutes per
week. It is possible to “mix and match” the intensity and duration of the activity
in order to reach this total weekly level of activity. In other words, the
recommendations can be met by engaging in both moderate- and vigorous-
activity, and it can vary day by day or week by week. Additionally, if finding 20
or 30 consecutive minutes in which to exercise on a given day is not possible or
6
practical, the time can be accumulated by engaging in intermittent physical
activity consisting of multiple bouts each day of at least 10 minutes each. The
Surgeon General has also stipulated that even in the event that a person does not
engage in the full recommended amount of weekly activity, any additional PA
that is done above resting levels will result in health benefits. These guidelines
are a minimum to help reduce the risks of chronic disease, and any activity above
and beyond these minimum amounts in intensity, frequency, or duration provides
additional health benefits (USDHHS, 2008).
The guidelines also recommend including resistance exercises at least 2
non- consecutive days each week to strengthen the muscles of the hips, legs, arms,
chest, back, abdomen, and shoulders, and flexibility exercises at least 2 days each
week to maintain and improve range of motion. Adults over age 65 should follow
the key guidelines for all adults, plus include exercises that maintain or improve
balance, particularly if they are at risk for falling. Children and adolescents
should acquire 1 hour or more of daily physical activity. Most of these 60
minutes should be aerobic in nature of either moderate- or vigorous- intensity;
usually this activity occurs in short bursts and may not be consecutive. A portion
of the 60 daily minutes should include vigorous-intensity activity, muscle-
strengthening activities, and bone-strengthening activities each at least 3 days per
week. All activities for children should be age-appropriate and enjoyable to
encourage and foster a love for play and movement, as children continue
enjoyable behaviors into adolescence, and adolescents continue them into
7
adulthood. For all age groups, physical activities should be enjoyable and offer
variety (USDHHS, 2008).
However, despite these recommendations and the proven health benefits
associated with PA, only 41% of American adults are actually meeting or
exceeding the Surgeon General’s recommended amount of 150 minutes weekly of
moderate-intensity physical activity, and 37% is not physically active at all
(Schoenborn & Stommel, 2011). Studies show that activity levels decline from
childhood to adolescence and in fact only 17% of students in grades 9-12 meet the
recommendation of at least 60 minutes of activity daily and only 30% participate
in daily physical education (CDC, 2010; CFLRI, 2006; Troiano, Berrigan, Dodd,
Masse, Tilert, & McDowell, 2008). In a longitudinal study, only 4.4% of 15-29
year olds met the recommendations at least 5 days per week as adults if they were
active adolescents, and only 3.6% of adults met the recommendation if they were
inactive teenagers (Gordon-Larsen, Nelson, & Popkin, 2004). Engaging in PA in
childhood is the best predictor of whether an individual will be active as an
adolescent and later as an adult (Kjonniksen et al., 2008). Interventions to
increase PA levels in the adult population have a 50% drop out rate at 6 months
(Dishman & Buckworth, 1996; 1997). These attrition levels indicate that although
individuals are able to change their behavior, they are unable to sustain the active
behavior for the long term, even when aware of the benefits that PA provides.
Clearly there are other psychological mechanisms at work that are not recognized
or understood when designing PA interventions.
8
Childhood Inactivity
Sedentary behavior in childhood and adolescence is on the rise. Many
youth no longer ride their bikes around their neighborhoods, play at the local
park, or even walk to school or the bus stop. The “built environment” of our
society and culture has made active transport undesirable, impractical and often
even dangerous. Many areas have no sidewalks, bike paths, cross walks, or stop
lights, so even children that would like to walk or ride their bike to school are
forbidden doing so by their parents for reasons of safety. Additionally, pressure
on teachers and principals to improve standardized test scores and meet and
exceed state and national standards in the core subjects of reading, writing, and
math, coupled with school budget cuts have all but eliminated time for recess and
playground supervision (Center for Education Policy, 2007). Despite studies that
show that PA actually improves students’ academic performance and allows
children to focus and concentrate on their lessons, administrators siphon precious
minutes in the school day and school year from P.E. and recess and redirect them
to “time on task” and “seat time” spent studying the core subjects in an effort to
avoid being classified as a lower achieving school which can ultimately result in
funding cuts and punitive actions taken against the administration and teachers.
In addition to the reduced time in school dedicated to PA, outside of
school hours only 39% of children ages 9-13 participated in organized PA, and
only 77% reported any leisure-time PA at all (CDC, 2004). Time out of school is
increasingly spent driving from one place to another, watching television, playing
video games, texting, and surfing the internet on devices such as computers,
9
cellular telephones, and tablets rather than playing with other children in a natural
outdoor setting free of these modern technological tools. In fact, school-age
children spend more than 5 hours per day in front of screens, roughly the same
amount of time that they spend in the classroom (Jordan, 2010). Many studies
show that screen time activities replace PA and thus increases overweight and
obesity (Hume, Singh, Brug, van Mechelen, & Chinapaw (2008); however
Eisennman, Bartee, Smith, Welk, & Fu (2008) found children with low amounts
of screen time did not necessarily have greater PA levels and thus did not have a
decreased risk of being overweight or obese.
Given all of the reasons that children are inactive, perhaps the greatest risk
factor associated with this sedentary behavior in children and adolescence is
overweight and obesity (Andersen, Crespo, Bartlett, Cheskin, & Pratt, 1998;
Eisenmann et al., 2008; Rey-Lopez, Vicente-Rodriguez, Biosca & Moreno, 2008),
which increase the incidence risk of co-morbidities (Tortolero, Goff, Nichaman,
Labarthe, Grunbaum & Hanis, 1997; Freedman, Serdula, Srinivasan & Berenson,
1999; Dietz, 1998; Weiss & Kaufman, 2008) including obesity into adulthood
(Must, Jacques, Dallal, Bajema & Dietz , 1992). Although children usually do not
develop chronic diseases such as cardiovascular disease, hypertension, diabetes,
or osteoporosis during childhood, the risk factors for these diseases begin to
develop during this time and can only be avoided by participating in regular PA
(Biddle, Gorely, & Stensel, 2004). Physically active youth have greater
cardiorespiratory fitness, stronger muscles, lower body fatness, stronger bones,
and less anxiety and depression than their inactive peers. A lack of fitness results
10
in many children showing early signs of cardiovascular risk factors such as excess
weight, higher blood cholesterol levels, type 2 diabetes and metabolic syndrome.
Health benefits of engaging in regular PA during childhood and adolescence
include healthy weight regulation (Kimm, Glynn, Obarzanek, Kriska, Daniels,
Barton et al., 2005), proper growth of bones and tissues (Biddle et al., 2004), and
a reduced risk of several chronic diseases (Hurtig-Wennloef, Ruiz, & Harro,
2007; Warburton, Nicol, & Bredin, 2006).
The “built environment” contributes to the increase in sedentary behavior
as it makes active transport less attractive. Environmental changes including the
“built environment”, reduced time and space for outdoor recreation, neighborhood
crime, traffic, or lack of street lighting have prevented children from being able to
walk and play safely outdoors as a means of daily exercise (Sallis, Conway,
Prochaska, McKenzie, Marshall & Brown, 2001). With the increase in open
enrollment and charter schools, many children no longer live in the same
neighborhood as their schools, and must be driven to and from school rather than
engaging in the active transport activities of walking or bicycle riding to go to
school.
Starting PA behaviors at a young age yields the greatest overall health
gains (Janssen et al., 2005). Research shows that physically active children
become active adults (Pate, Baranowski, Dowda & Trost, 1996). The relationship
between sedentary behavior and chronic disease has been demonstrated in adults
(Booth, Laye, Lees, Rector, & Thyfault, 2008; Katzmarzyk, Church, Craig, &
Bouchard, 2009; Owen, Healy, Matthews, & Dunstan, 2010) and children
11
(Ekelund, Brage, Froberg, Harro, Anderssen, Sardinha, et al., 2006; Mark &
Janssen, 2008; Sardinha, Andersen, Anderssen, Quiterio, Ornelas, Froberg., et al.,
2008).
In spite of studies showing a positive correlation between PA in childhood
and adolescence and strong academic achievement (Taras, 2005; Trudeau &
Shephard, 2008) and favorable mental health outcomes (Biddle, Gorely, &
Stensel , 2004). National and state policies mandating improvement in
standardized test scores have resulted in increased time in core academic subjects
and thus have created a barrier to PA promotion, as recess and physical education
programs during the school day have been reduced or eliminated altogether
(Metzler, 2002; Graham, Wilkins, Westfall, Parker, Fraser, & Tembo, 2002).
Only 8% of elementary schools provide daily opportunities for PA or the weekly
equivalent of 150 minutes for children to engage in PA at school. Research
suggests that the rate of academic learning is enhanced in physically active
students, thereby invalidating school boards’ claims that physical education be
denied due to lack of available curricular time (Shephard, 1997). When engaging
in PA, the brain “wakes up” with increased blood flow to the brain improving the
connections the neurons can make with one another, resulting in heightened
senses, better focus and mood, decreased stress and fidgety behaviors, and
increased motivation, invigoration and ability to concentrate (Ratey, 2008).
This coupled with a greater overall intake of nutrients compared to a
sedentary student, the association between psychomotor and cognitive
development, an outlet to relieve boredom facilitating the ability to focus and pay
12
attention to instruction later in the day, or enhanced self-esteem are all plausible
reasons that PA could improve academic achievement. Self-esteem may be
increased by improved motor skills or changes in body build induced by the PA,
and children with higher self-esteem tend to be higher achievers in school,
although the directionality of this tendency is unclear (Baumeister, Campbell,
Krueger, & Vohs, 2003). Gentile, Twenge, and Campbell (2010) found that self-
esteem assessments may have reached a ceiling, as 51% of participants are now
scoring 35 and over (with 40 being perfect self-esteem), and therefore that
existing self-esteem inventories may need to be revised. It is in this context that
LOC may be a better measure.
Given that children spend most of their day at school, schools are an
excellent place to teach and demonstrate positive PA behaviors while teachers and
students interact (Baranowski, Mendlein, Resnicow, Frank, Cullen, &
Baranowski, 2000; McKenzie, LaMaster, Sallis, & Marshall, 1999). Moreover,
research shows that children who are inactive in school continue to be inactive
outside of school, signifying a need for programmed activities both during and
after school hours (CDC, 2000; Dale, Corbin, & Dale, 2000; Dietz, 2001).
Self-Esteem
Self-esteem is one’s positive or negative regard for his or her overall
worth. Researchers have used this concept to predict outcomes such as academic
achievement, exercise behavior, and psychological well-being (Marsh, 1986). An
increased emphasis on self-worth in American culture and perceived competence
since 1980 has led to both children and college students scoring higher on the
13
Coopersmith Self-Esteem Inventory (SEI) and Rosenberg Self-Esteem scale
(RSE) respectively. College students’ responses to the RSE increased from 1968
to 1994 despite their decreased competency during the same period as measured
by mean SAT scores, reduced physical activity levels, and increased stress. In
fact, by 2008, 18% of the students that took the RSE scored a perfect 40, and 51%
scored 35 or higher. These high scores for self-esteem indicate that the RSE may
have reached a ceiling and the scale may need to be reworked in order to fully
capture the highest possible degree of self-esteem that one can have (Gentile et
al., 2010). They may also indicate that self-esteem is not an accurate predictor of
performance.
Despite the huge increases in self-esteem during the last 30+ years, there
is no evidence that societal problems or issues that should be tied to self-esteem
have improved. For example, SAT and GRE scores are at historical lows, so
much in fact that the SAT was re-normed in 1995. This happened while grade
inflation became rampant with the proportion of A’s increasing and C’s
decreasing (Dey, Astin, & Korn, 1992; Holtz, 1995). Another competency is
appearance-related: Americans have become increasingly heavier while the media
has simultaneously portrayed unrealistic thinness in women and muscle definition
in men. Therefore, although our objective competencies of academic
achievement and physical appearance have decreased, our subjective perceptions
of our competencies have increased thus increasing our self-esteem (Twenge &
Campbell, 2001). This could either suggest that a different measure may be a
more accurate way to assess self-esteem, as students have clearly “learned” how
14
to answer the questions, or that better psychological indicators and/or predictors
are needed.
Given the positive relationship between childhood exercise and adult
exercise patterns, investigation into factors that influence youth participation in
exercise is vital for public health experts to develop interventions and strategies
designed to address, increase and maintain voluntary participation in PA
throughout the life span. A range of demographic, psychological, behavioral,
social, environmental, and PA characteristic variables are associated with exercise
adherence (Bauman, Sallis, Dzewaltowski, & Owen, 2002; Trost, Owen, Bauman,
Sallis, & Brown , 2002). Two consistently strong positive psychological
correlates of PA are self-efficacy and self-motivation (Trost, et al., 2002). Unlike
self-esteem, which is moderated by extrinsic forces, self-efficacy (SE) is intrinsic
and posits that one is able to solve problems and set and achieve goals. Self-
efficacy is linked to a similar construct, self-motivation, or the personal initiative
an individual utilizes to start or continue an activity. Therefore, one’s self-efficacy
will influence the motivation and lead to action, thereby increasing self-esteem.
Just as there is a positive relationship between increased self-efficacy and
increased levels of PA (Booth et al., 2000; Clark & Nothwehr, 1999; Sternfeld, et
al., 1999; Sullum et al., 2000), there is a positive correlation between increased
self-motivation and increased attendance (Bungum et al., 1997; Dishman & Ikes,
1981; Dishman et al., 1980; Gale et al., 1984).
15
Self-Motivation Self-Motivation (SM) is the personal initiative an individual utilizes to
start or continue an activity or behavior. When someone is considering changing
a behavior, they must have a reason for wanting to do so. In the area of health
and wellness, key behavior change strategies are eating less, exercising more,
losing weight, managing stress, and smoking cessation. Often the motivation
behind the change is one of vanity, as we want to “look” better, whether for an
upcoming event, or simply to please others. These are extrinsic motivators. What
is interesting about SM is that if the impetus for the initial behavior change
wanes, one must re-evaluate if there is another motivation pushing us to change.
In the absence of self-motivation, people return to their previous, “comfortable”,
“normal” behavior. In a sense, if one is changing for himself or herself, the
motivation is intrinsic and likely to continue, but if he or she is changing for
someone else, the motivation is extrinsic and the behavior change is likely only
temporary.
Self-Efficacy
Self-Efficacy (SE) is one’s confidence in his own ability to perform or
accomplish a specific task or activity (Bandura, 1991). The important thing to
keep in mind with SE is that it is behavior specific. In other words, someone may
have low SE for running a mile, however he may have high SE for climbing a
mountain. SE can be learned in a variety of ways. Breaking large tasks down
into achievable steps and setting goals to accomplish them is one way that SE can
increase. Another way is through vicarious learning: watching similar others
16
complete the task gives one pause to consider the possibility of also being able to
complete the task. SE is often confused with self-esteem. While someone with
high self-esteem may in fact have high SE in some activities, it is likely that there
are activities or tasks for which someone with high self-esteem may have low SE.
In fact, it is also probable that having high SE in many activities will boost one’s
self-esteem.
Locus of Control
Locus of control (LOC) is the way that someone views their ability to
control their life and the things that happen to them. A person with a strong
internal LOC has a perception that they control their own destiny, that their
situation is largely determined by the effort that they put in, whereas a person
with an external LOC perceives that their fate is determined by circumstances
beyond their control. Generally speaking, children have a more external LOC,
and as we grow older our LOC becomes more internal. This is largely due to the
fact that people have a greater ability to influence things going on in their lives as
they age, and they have more choices available to them. One’s LOC is an
indicator of how they view the world and their role in determining how their life
will unfold. Usually a strong internal LOC is an important attitude to have for
people who want to be successful. These people tend to be self-motivated, work
harder, and persevere longer in order to get what they want. Research has shown
that “internals” tend to be happier, less depressed, and less stressed than
“externals”. It is possible for people to change their LOC to become more
internal by setting realistic and achievable goals and working towards them. This
17
builds self-confidence and ultimately allows a person to see that they are in
control of their own life.
Perceived control and general expectations regarding whether outcomes
are controlled by one’s behavior or other external forces is a construct closely
associated with self-efficacy (Rotter, 1966). Perceived control emerged from
research on locus of control, which underlies Rotter’s social learning theory of
personality. It is theorized that an internal locus of control (LOC) supports self-
directed courses of action (self-motivation), whereas an external locus of control
should discourage them. Those exhibiting a higher internal locus of control
should therefore possess greater self-efficacy and self-motivation to exercise.
Although the locus of control construct is heavily utilized in social and health
psychology to examine adherence, it remains underutilized in exercise and
wellness research.
Sherman (1984) conducted a longitudinal and cross-sectional study that
showed internality is a function of age with 8-year olds being more external and
12 year olds being more internal. The longitudinal portion of the study showed
that as children age, they become more internal.
The Nowicki-Strickland Locus of Control Scale (CNSIE) has been used to
assess LOC differences by race, age, and gender. Tyler and Holsinger (1975)
found that American Indians were more external than whites and that older
children were more internal than younger children. Finlayson and Rourke (1978)
found that perceived locus of control is related to motivation, but they were
unable to conclude whether perceived LOC is related to treatment outcome.
18
Kong and Shen (2011) wanted to explain whether LOC could be temporarily
activated through message framing; they found that by manipulating LOC
messages, subjects could actually respond in ways contrary to their actual LOC.
Barling (1979) found a curvilinear relationship between verbal ability and
the reliability of the Nowicki-Strickland Locus of Control Scale. This could be a
confounding variable in the reliability of the CNSIE. He believed that the verbal
proficiency required of subjects for the CNSIE created ambiguity on some of the
items and that this may have reduced the consistency of the responses. Another
explanation provided was that implicit demand characteristics were more salient
for children with above-average verbal IQs as they were significantly more
internally oriented than their less verbally proficient counterparts.
Instruments to Measure Physical Activity
Chinapaw, Mokkink, van Poppel, van Mechelen, & Terwee (2010)
published a review article on Physical Activity Questionnaires for youths. The
researchers concluded that a reasonable “gold standard” for measuring PA in
children does not exist, and that no instrument available had both acceptable
reliability and validity.
Biddle, Gorely, Pearson, & Bull (2011) conducted an assessment of self-
reported physical activity instruments in young people for population
surveillance. In 437 papers using physical activity assessment instruments, 89
physical activity measures were identified, and 20 received detailed assessment.
The 3 instruments that received support from the majority of the expert panel
19
included the Physical Activity Questionnaire for Children/Adolescents, the Youth
Risk Behavior Surveillance Survey, and the Teen Health Survey.
The Physical Activity Questionnaire for Older Children (PAQ-C) assesses
the physical activity behaviors of children aged 8-14 during school, after school,
during lunch, during recess, and over the weekend during the previous week. The
10 question pencil and paper survey asks if the student engaged in an activity
during the previous 7 days, and if so how often, with choices ranging from not at
all to 5 or more times. A 5-point Likert-type scale is used to score each item, and
an overall score is determined by the mean of each scored item. Higher scores
reflect greater levels of PA (Crimi, Hensley, & Finn 2009). The PAQ-C has
moderately high validity as reported by Kowalski, Crocker, & Faulkner (1997)
and test-retest reliability and internal consistency values. The low cost test is
widely used in research to assess habitual moderate- to vigorous- intensity PA in
both large and small populations. The survey was developed for use in the
Saskatchewan Pediatric Bone Mineral Accrual Study (Trost et al., 2002). As
many of the questions on the PAQ-C ask about activities and behaviors at recess,
during lunch, during P.E., right after school, in the evening, and on the weekend,
the questionnaire has validity if used during the school year, but not during the
summer break (Biddle et al., 2011). A modified version of this assessment is the
Physical Activity Questionnaire for Adolescents, and is used for children ages 14-
20. The PAQ-A has similar validity and reliability.
20
CHAPTER 3
METHODS
Participants and Study Design
This study was conducted with 116 children that attend Sequoia
Elementary School in Mesa, Arizona. All 225 students in grades 3 through 6
received a parental consent form explaining the study included in their weekly
homework packets. Students that returned a signed parental consent (n=120)
form were given a child assent form, and students that signed the assent form
were enrolled in the study. The Institutional Review Board of Arizona State
University approved this study. Thirty-six of the participants were enrolled in the
THANX after school program, therefore the study is a quasi-experimental
nonequivalent group design. The pre-test of the two questionnaires was given on
September 26-27, 2011 to determine baseline data, and the same questionnaires
were repeated on January 23-24, 2012 as a post-test. Subjects completed the
Physical Activity Questionnaire for Children (PAQ-C) about their participation in
PA over the prior week, and the Child Nowicki Strickland Internal External scale
(CNSIE). Both questionnaires were completed during the students’ 40-minute
weekly health class. Parental consent forms were signed and returned the week
prior to baseline testing, and child assent forms were completed the day of
baseline testing. Due to the demographics of the population, all forms and
surveys were available in English and Spanish. Although 10% of the parental
consent forms were completed in Spanish, only one student completed the
21
Spanish language questionnaires in September. In January, this student
completed the questionnaires in English.
Child Nowicki-Strickland Internal-External (CNSIE) Locus of Control Scale
The Child Nowicki-Strickland Internal-External Scale (CNSIE) is a 40-
item questionnaire requiring yes or no answers used to assess locus of control as a
generalized expectancy of control measuring internal versus external forces. The
CNSIE has been used since 1969 to assess a child’s perception of a connection
between his or her actions and their consequences. The test is appropriate for
children aged 9-18. This test has been validated repeatedly for internal
consistency and test-retest reliability.
Physical Activity Questionnaire -- Child (PAQ-C)
The PAQ-C is a 7-day recall questionnaire designed for children aged 8-
14 and intended to measure moderate-to-vigorous physical activity. It requires
respondents to check boxes according to the frequency with which they
participated in the activity over the last 7 days. The frequency scale ranges are 0
times, 1-2 times, 3-4 times, 5-6 times and 7 times or more during the previous
week. Questions are asked about PA in P.E. classes, during recess and lunch
time, immediately after school, in the evenings, and on the last weekend. For
these items, responses for activity levels during physical education class, recess,
and lunch time include 5 choices indicating the overall PA intensity levels; the
questions about PA immediately after school, in the evening, and on the weekend
ask how many times the student played games or did other PA that was “very
active” with choices between 0 times and 6 or more times. Then the child is asked
22
about how physically active he was during his free time for the previous week,
including a day-by-day assessment of how often they were active each day. The
PAQ-C has been validated using objective assessment of PA during the school
year.
Protocol Procedures – CNSIE and PAQ-C Questionnaires
Students that returned a signed parental consent form were given a packet
containing the child assent, CNSIE, and PAQ-C questionnaires. In an effort to
keep the class working at the same pace and ensure that everyone understood the
questions, one investigator read each item on the questionnaires aloud while the
students marked their questionnaires accordingly. A second investigator
circulated around the classroom to answer any questions that arose as the
questionnaires were completed. The questions were read aloud in Spanish to the
student that required the Spanish versions of the questionnaires. Questionnaires
were completed by grade level during the health class, therefore no students were
in groups larger than 40 while completing the questions.
Statistical Analysis
All statistical analyses were performed using the IBM SPSS Statistical
Analysis system version 20.0 software. One-way analyses of variance (ANOVAs)
were run to measure whether participation in the THANX program, age, gender,
or race influenced internal locus of control or physical activity. Further linear
regression models were run to measure covariance of these factors on LOC and
PA. All data is reported as the mean + the standard deviation. Data with a p-value
< 0.05 was considered significant. A dropout rate of 10% was anticipated due to
23
incomplete data due to student absence or attrition on the second data collection
date. Students that completed baseline data but were absent on the second data
collection date had their baseline scores copied for statistical purposes.
One hundred ten (110) students answered every question on both surveys
at baseline, and 90 of these had complete data on all questions again at post-
testing. Only these 90 students with complete data at both baseline and post are
included in analyses, as omitted questions could have resulted in a more internal
LOC score on the CNSIE, and under reporting of PA.
After computing the mean, median, and 25th and 75th percentile scores for
LOC at baseline and post-intervention, students were reclassified into an LOC
group by quartiles. Those that scored at or below the 25th percentile of 15 were
classified as “internal”, and those that scored at or above the 75th percentile of
19.25 were classified as “external”. Therefore, if a student’s LOC changed, it was
possible to be classified as “internal” at one of the two time points, and “external”
at the other.
PA scores were calculated by assigning a value from 0 to 4 for the
questions related to PA during physical education, recess, lunch, immediately
after school, in the evening, on the weekend, and for free time over the prior
week, both at baseline and at post-test, with “0” indicating sedentary behavior,
“1” light activity, “2” moderate activity, “3” moderately high activity, and “4”
highly active behavior. A composite school time PA score was created by
summing the scores for PA level during physical education, recess, and lunch,
with possible scores ranging from 0 (sedentary at all 3 occasions) to 12 (very
24
active at all 3 occasions). A composite non-school time PA score was created by
summing the scores for PA level immediately after school, in the evenings, on the
weekend, and in free time over the previous 7 days, with possible scores ranging
from 0 (sedentary at all 4 occasions) to 16 (very active during all 4 occasions).
Using these continuous scores, students that fell in the bottom 25th percentile were
classified as having low activity relative to their peers, and those in the 75th
percentile as high activity relative to their peers.
Due to age requirements and cut-off dates for starting kindergarten, when
a child’s birthday falls relative to the cut point, and the ability for children with
“late” birthdays to test-in to kindergarten as a 4 year old, it is possible for a single
grade to be comprised of children with 3 different ages, particularly at the
beginning of the school year. This study was conducted with 3rd through 6th
graders, therefore the ages of the children ranged from 7 to 12, with only 1 seven-
year-old in 3rd grade and 4 twelve-year olds in 6th grade at the September data
collection date. For statistical purposes, the 7-year-old’s data was combined with
that of the 8-year olds, and the 12-year-olds’ data was combined with that of the
11-year olds, as they were only a few months apart chronologically.
25
CHAPTER 4
RESULTS
One hundred twenty students had signed parent consent forms. One
hundred eleven students completed the surveys at baseline; 103 completed the
questionnaires at post-testing. There were 4 students with signed parent consent
that were absent on both data collection dates and were omitted from statistical
analyses. Only 90 students had complete questionnaires at both baseline and post
and were included in data analyses.
Demographics
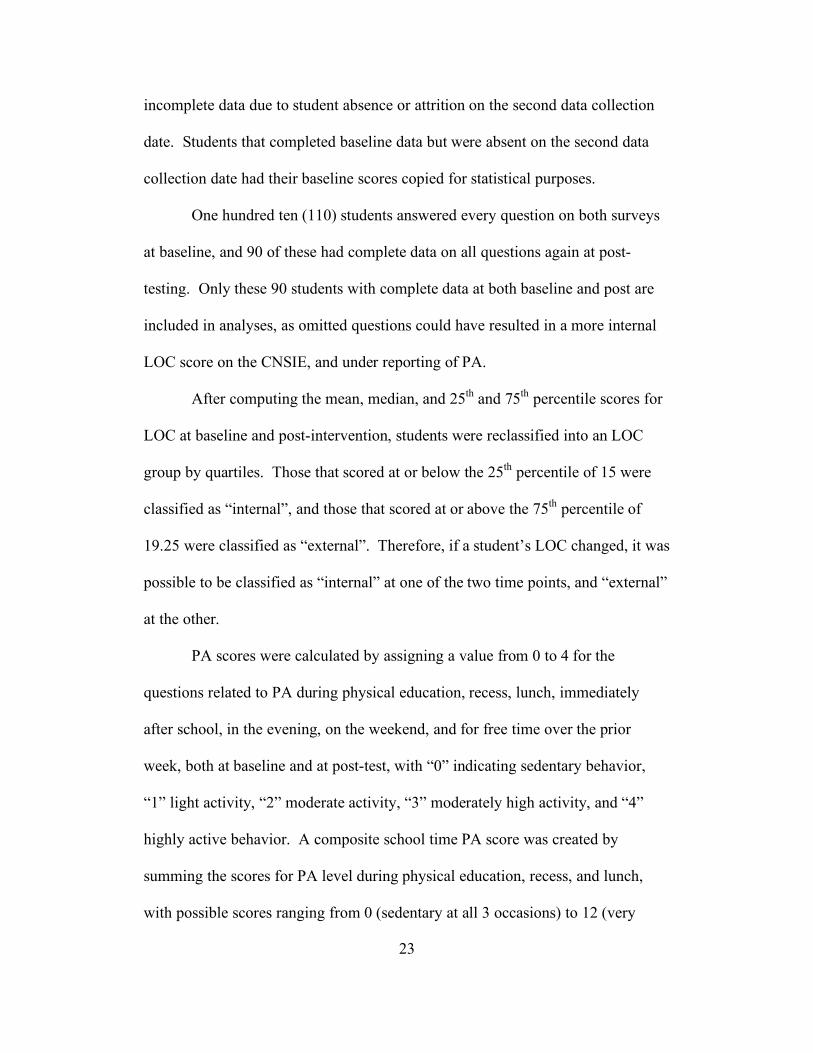
Twenty-six (29%) of the students were enrolled in the THANX after
school program. Sixty-four students (71%) were not enrolled in THANX.
Figure 1. Study participants by participation in the THANX program.
26
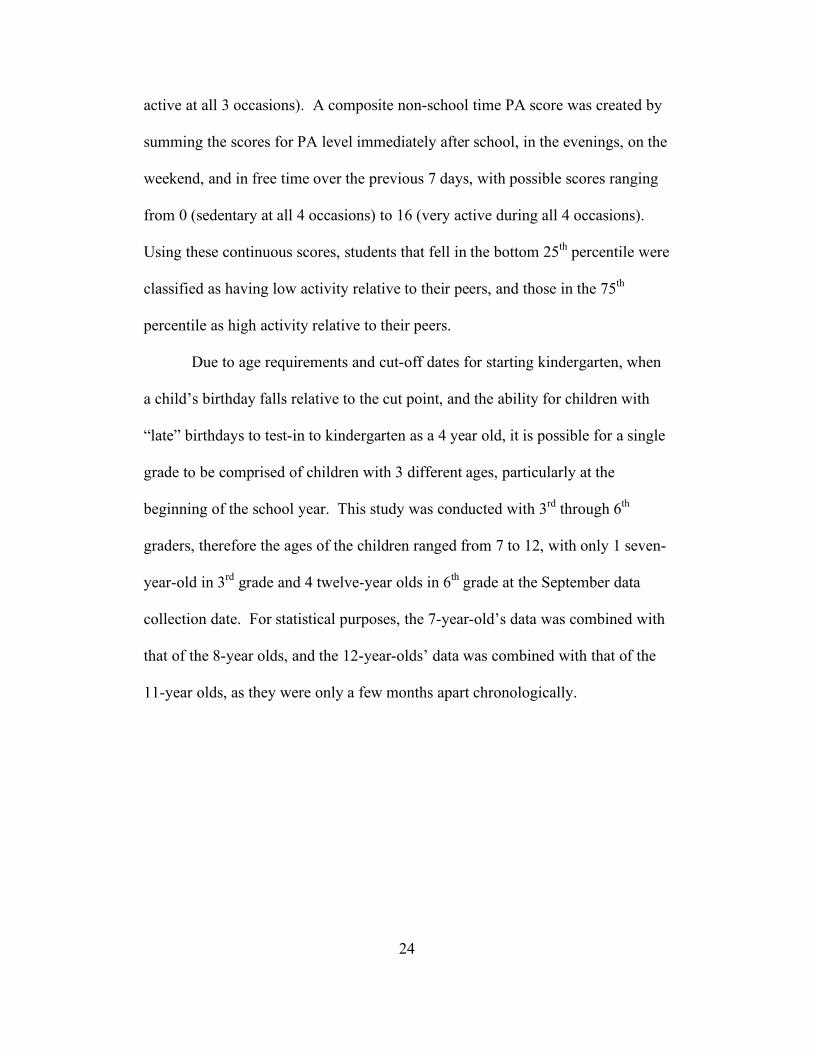
There were 53 males (59%) and 37 females (41%).
Figure 2. Study participants by Gender.
27
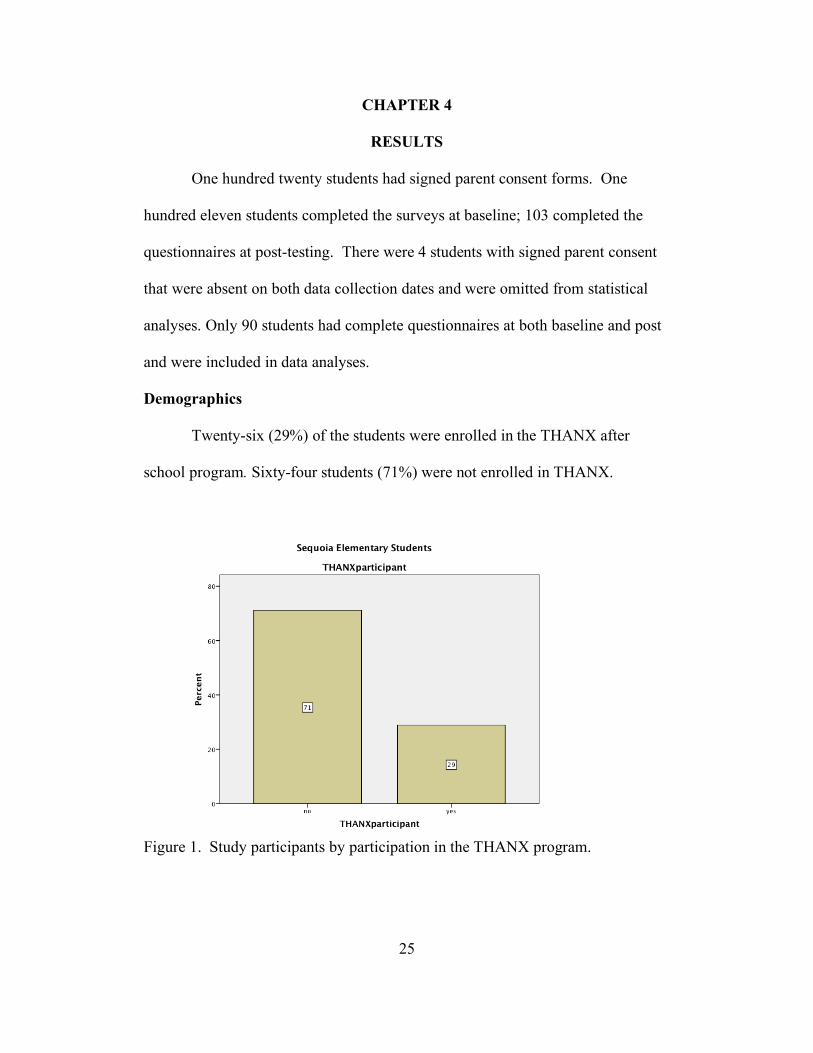
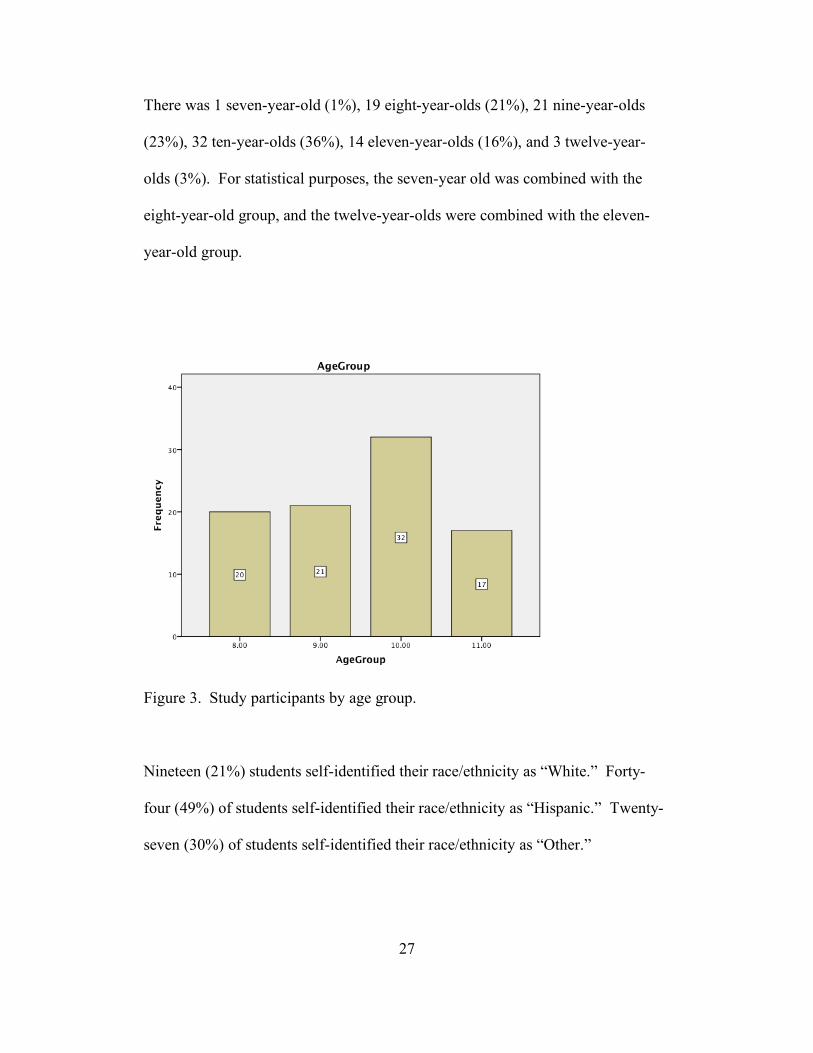
There was 1 seven-year-old (1%), 19 eight-year-olds (21%), 21 nine-year-olds
(23%), 32 ten-year-olds (36%), 14 eleven-year-olds (16%), and 3 twelve-year-
olds (3%). For statistical purposes, the seven-year old was combined with the
eight-year-old group, and the twelve-year-olds were combined with the eleven-
year-old group.
Figure 3. Study participants by age group.
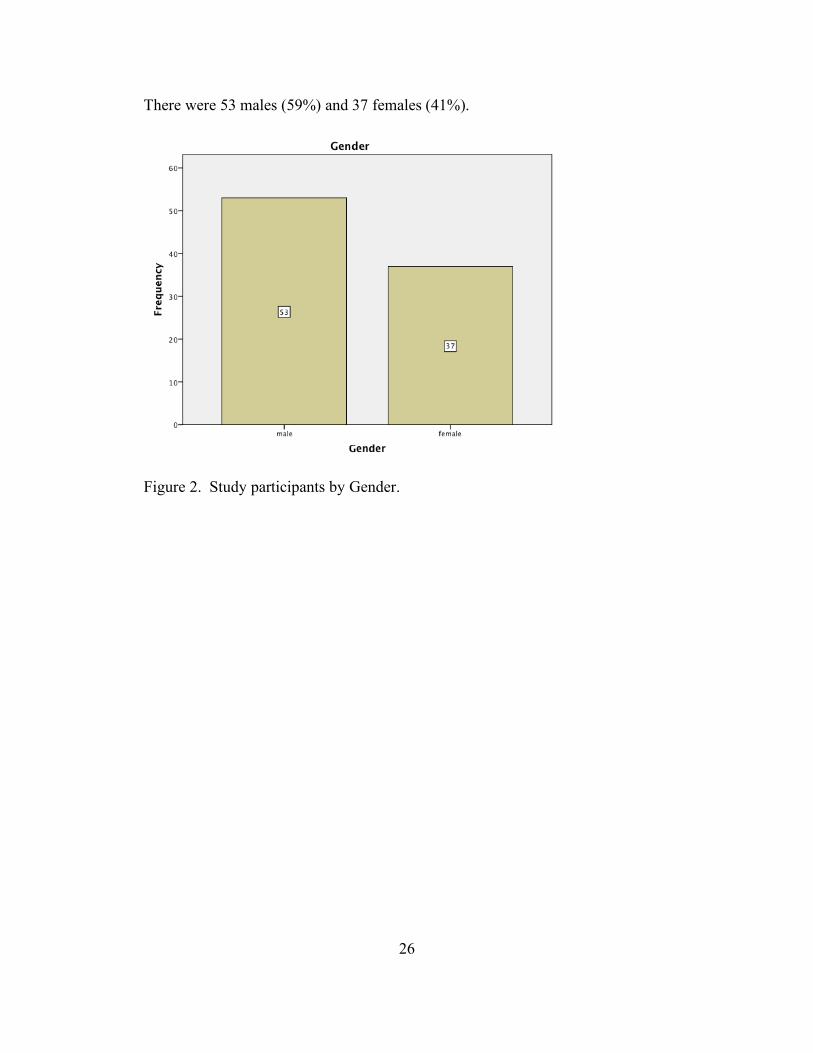
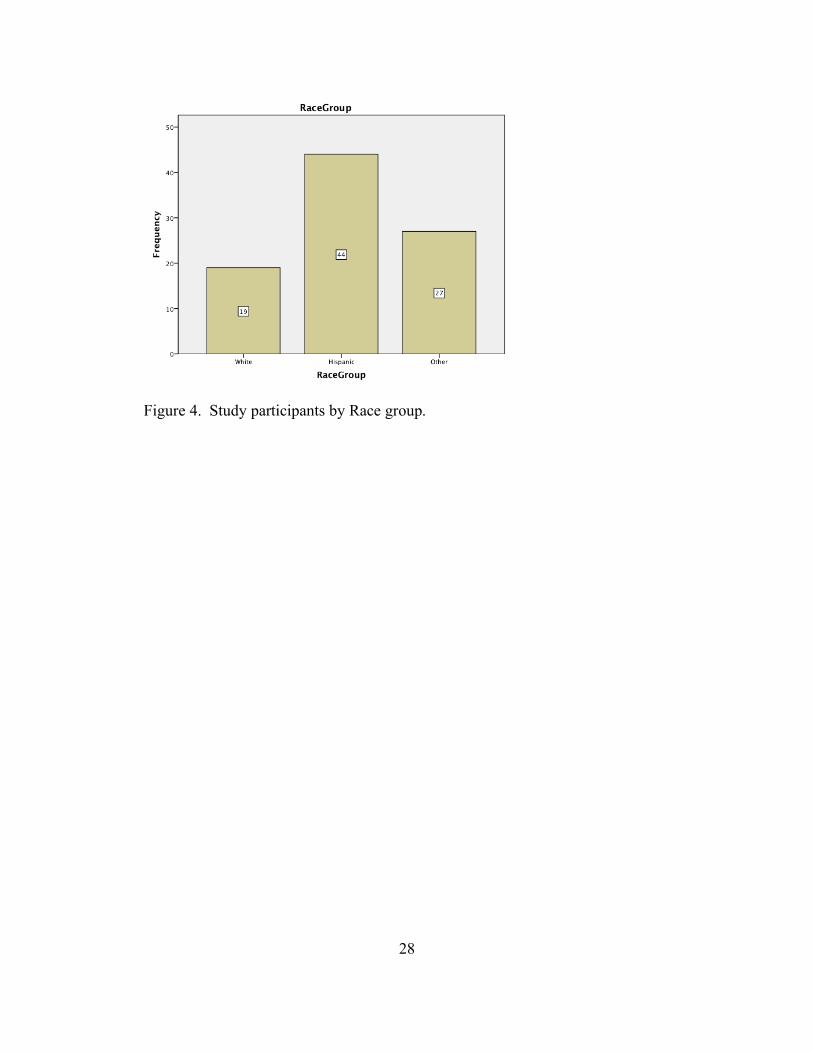
Nineteen (21%) students self-identified their race/ethnicity as “White.” Forty-
four (49%) of students self-identified their race/ethnicity as “Hispanic.” Twenty-
seven (30%) of students self-identified their race/ethnicity as “Other.”
28
Figure 4. Study participants by Race group.
29
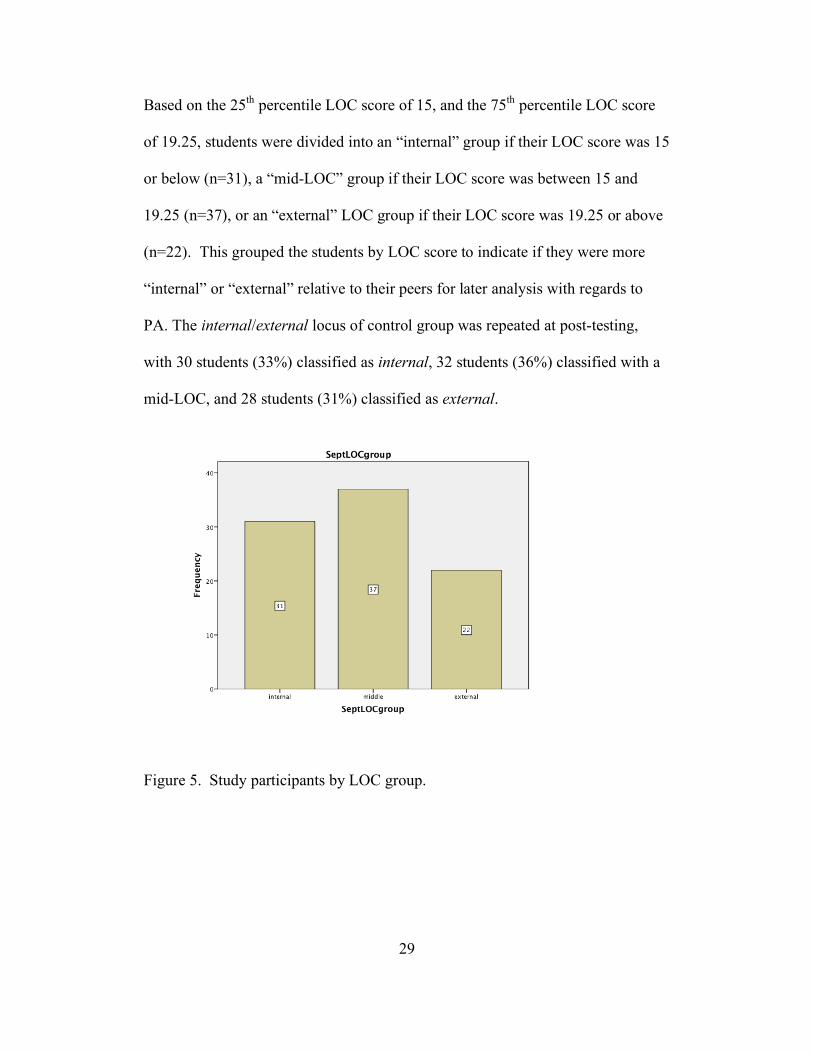
Based on the 25th percentile LOC score of 15, and the 75th percentile LOC score
of 19.25, students were divided into an “internal” group if their LOC score was 15
or below (n=31), a “mid-LOC” group if their LOC score was between 15 and
19.25 (n=37), or an “external” LOC group if their LOC score was 19.25 or above
(n=22). This grouped the students by LOC score to indicate if they were more
“internal” or “external” relative to their peers for later analysis with regards to
PA. The internal/external locus of control group was repeated at post-testing,
with 30 students (33%) classified as internal, 32 students (36%) classified with a
mid-LOC, and 28 students (31%) classified as external.
Figure 5. Study participants by LOC group.
30
Locus of Control (LOC)
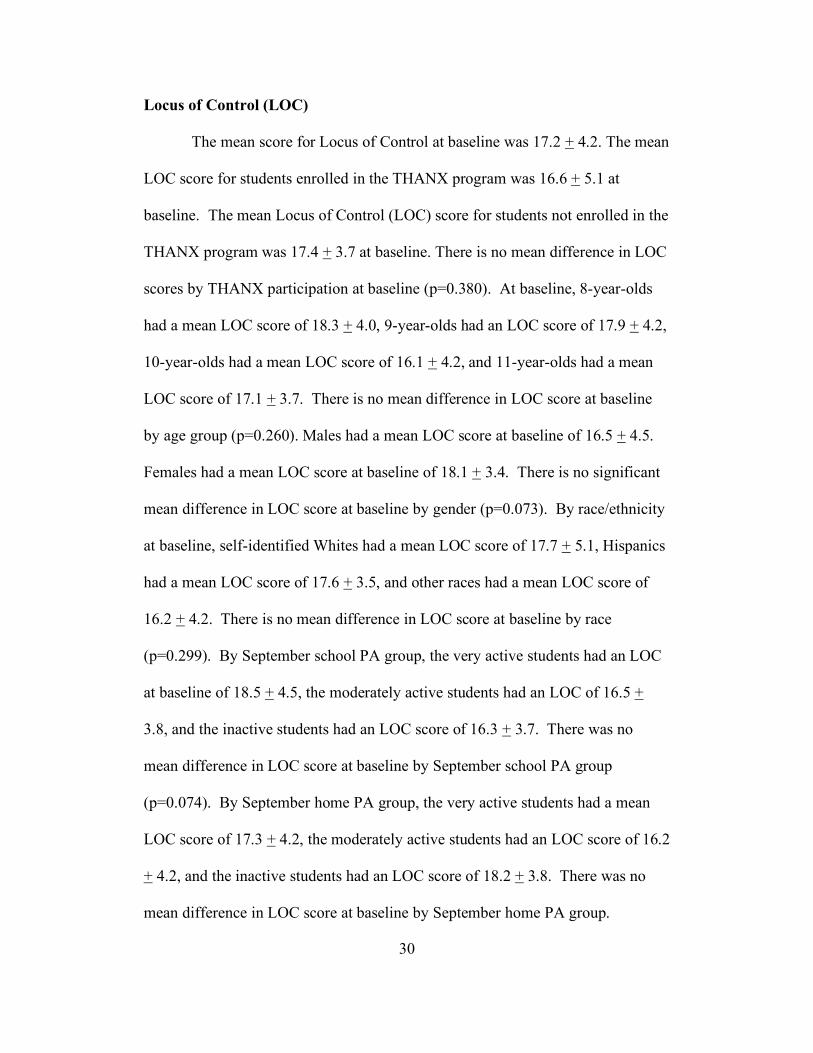
The mean score for Locus of Control at baseline was 17.2 + 4.2. The mean
LOC score for students enrolled in the THANX program was 16.6 + 5.1 at
baseline. The mean Locus of Control (LOC) score for students not enrolled in the
THANX program was 17.4 + 3.7 at baseline. There is no mean difference in LOC
scores by THANX participation at baseline (p=0.380). At baseline, 8-year-olds
had a mean LOC score of 18.3 + 4.0, 9-year-olds had an LOC score of 17.9 + 4.2,
10-year-olds had a mean LOC score of 16.1 + 4.2, and 11-year-olds had a mean
LOC score of 17.1 + 3.7. There is no mean difference in LOC score at baseline
by age group (p=0.260). Males had a mean LOC score at baseline of 16.5 + 4.5.
Females had a mean LOC score at baseline of 18.1 + 3.4. There is no significant
mean difference in LOC score at baseline by gender (p=0.073). By race/ethnicity
at baseline, self-identified Whites had a mean LOC score of 17.7 + 5.1, Hispanics
had a mean LOC score of 17.6 + 3.5, and other races had a mean LOC score of
16.2 + 4.2. There is no mean difference in LOC score at baseline by race
(p=0.299). By September school PA group, the very active students had an LOC
at baseline of 18.5 + 4.5, the moderately active students had an LOC of 16.5 +
3.8, and the inactive students had an LOC score of 16.3 + 3.7. There was no
mean difference in LOC score at baseline by September school PA group
(p=0.074). By September home PA group, the very active students had a mean
LOC score of 17.3 + 4.2, the moderately active students had an LOC score of 16.2
+ 4.2, and the inactive students had an LOC score of 18.2 + 3.8. There was no
mean difference in LOC score at baseline by September home PA group.

31
Figure 6. September LOC scores.
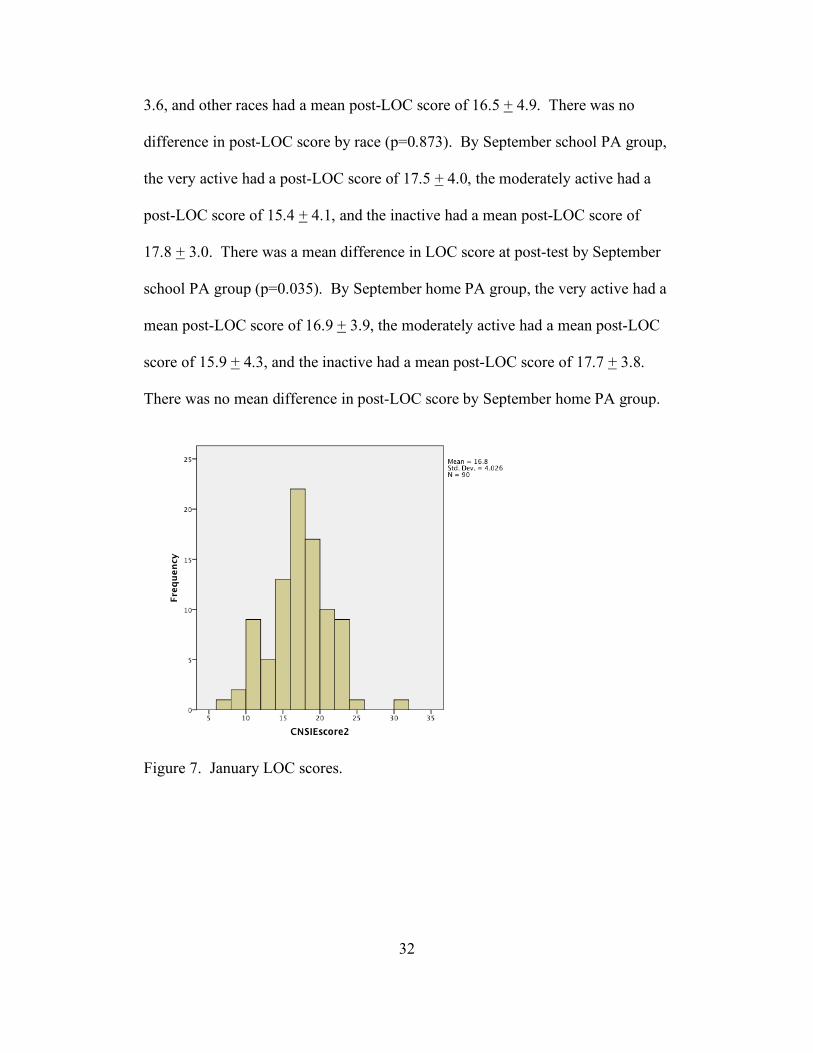
At post-test, the mean score for Locus of Control was 17.1 + 4.0. The
mean LOC score for students enrolled in the THANX program was 16.4 + 4.4.
The mean Locus of Control (LOC) score for students not enrolled in the THANX
program was 17.0 + 3.9. There was no mean difference in LOC scores by
THANX participation at post-testing (p=0.536). Eight- year-olds had a mean LOC
score at post-testing of 17.6 + 3.8; nine-year-olds had a mean LOC score of 16.8
+ 3.3; ten-year-olds had a mean LOC score of 16.9 + 4.7; eleven-year-olds had a
mean LOC score of 15.6 + 3.7. There was no mean difference in LOC score by
age group (p=0.506). Males had a mean LOC score at post-testing of 16.0 + 4.1.
Females had a mean LOC score at post-testing of 17.9 + 3.7. There was a
significant difference in LOC score at post-testing by gender (p=0.031) with
males being more internal and females being more external. White students had a
post-LOC score of 16.8 + 3.7, Hispanics had a mean post-LOC score of 17.0 +
32
3.6, and other races had a mean post-LOC score of 16.5 + 4.9. There was no
difference in post-LOC score by race (p=0.873). By September school PA group,
the very active had a post-LOC score of 17.5 + 4.0, the moderately active had a
post-LOC score of 15.4 + 4.1, and the inactive had a mean post-LOC score of
17.8 + 3.0. There was a mean difference in LOC score at post-test by September
school PA group (p=0.035). By September home PA group, the very active had a
mean post-LOC score of 16.9 + 3.9, the moderately active had a mean post-LOC
score of 15.9 + 4.3, and the inactive had a mean post-LOC score of 17.7 + 3.8.
There was no mean difference in post-LOC score by September home PA group.
Figure 7. January LOC scores.
33
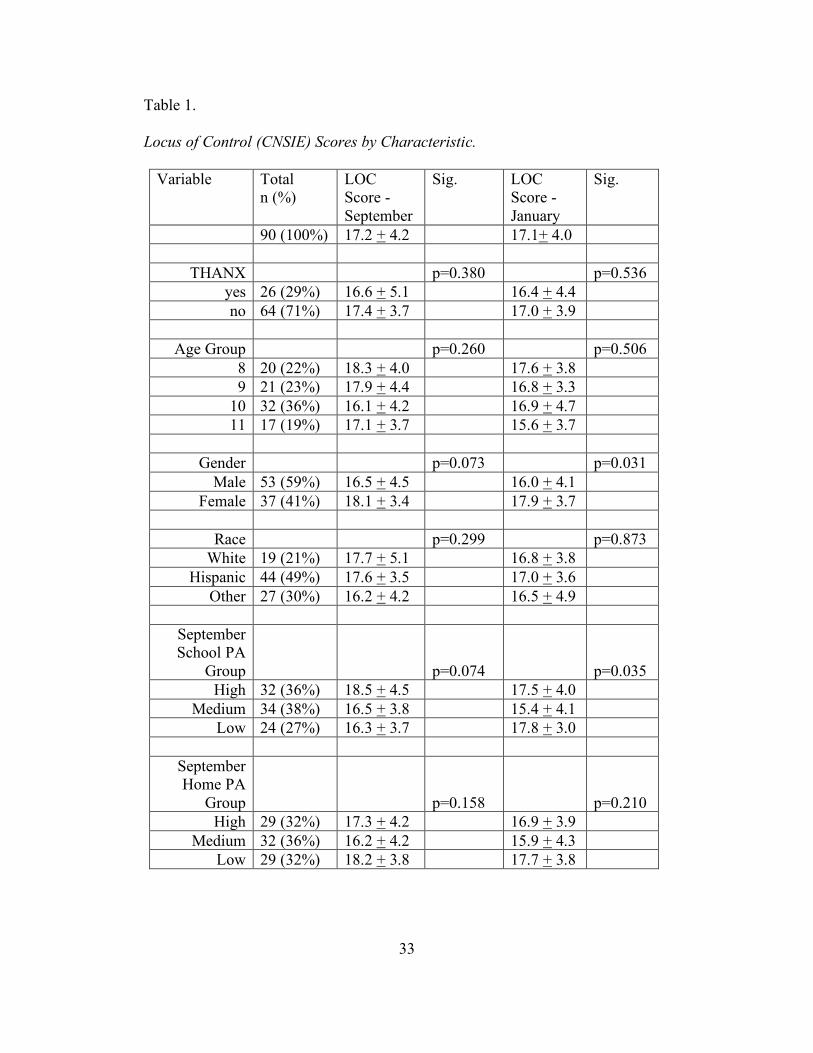
Table 1.
Locus of Control (CNSIE) Scores by Characteristic.
Variable Total n (%)
LOC Score - September
Sig. LOC Score - January
Sig.
90 (100%) 17.2 + 4.2 17.1+ 4.0
THANX p=0.380 p=0.536 yes 26 (29%) 16.6 + 5.1 16.4 + 4.4 no 64 (71%) 17.4 + 3.7 17.0 + 3.9
Age Group p=0.260 p=0.506
8 20 (22%) 18.3 + 4.0 17.6 + 3.8 9 21 (23%) 17.9 + 4.4 16.8 + 3.3
10 32 (36%) 16.1 + 4.2 16.9 + 4.7 11 17 (19%) 17.1 + 3.7 15.6 + 3.7
Gender p=0.073 p=0.031
Male 53 (59%) 16.5 + 4.5 16.0 + 4.1 Female 37 (41%) 18.1 + 3.4 17.9 + 3.7
Race p=0.299 p=0.873
White 19 (21%) 17.7 + 5.1 16.8 + 3.8 Hispanic 44 (49%) 17.6 + 3.5 17.0 + 3.6
Other 27 (30%) 16.2 + 4.2 16.5 + 4.9
September School PA
Group
p=0.074
p=0.035
High 32 (36%) 18.5 + 4.5 17.5 + 4.0 Medium 34 (38%) 16.5 + 3.8 15.4 + 4.1
Low 24 (27%) 16.3 + 3.7 17.8 + 3.0
September Home PA
Group
p=0.158
p=0.210
High 29 (32%) 17.3 + 4.2 16.9 + 3.9 Medium 32 (36%) 16.2 + 4.2 15.9 + 4.3
Low 29 (32%) 18.2 + 3.8 17.7 + 3.8
34
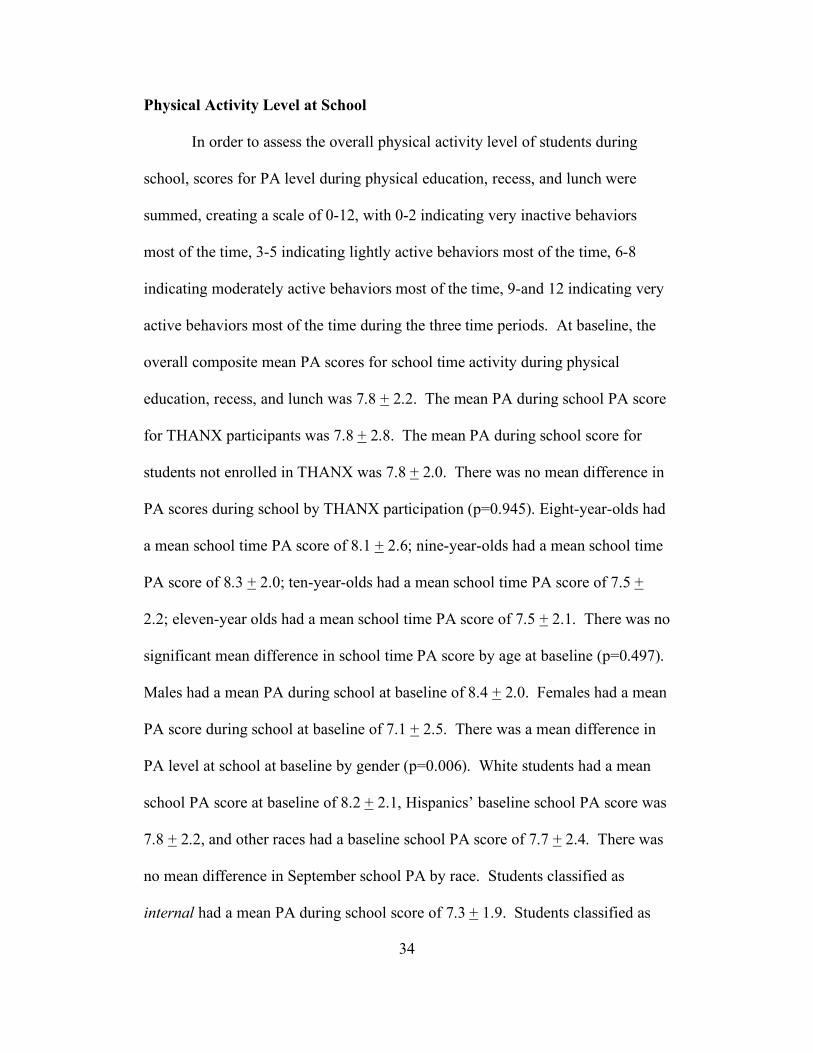
Physical Activity Level at School
In order to assess the overall physical activity level of students during
school, scores for PA level during physical education, recess, and lunch were
summed, creating a scale of 0-12, with 0-2 indicating very inactive behaviors
most of the time, 3-5 indicating lightly active behaviors most of the time, 6-8
indicating moderately active behaviors most of the time, 9-and 12 indicating very
active behaviors most of the time during the three time periods. At baseline, the
overall composite mean PA scores for school time activity during physical
education, recess, and lunch was 7.8 + 2.2. The mean PA during school PA score
for THANX participants was 7.8 + 2.8. The mean PA during school score for
students not enrolled in THANX was 7.8 + 2.0. There was no mean difference in
PA scores during school by THANX participation (p=0.945). Eight-year-olds had
a mean school time PA score of 8.1 + 2.6; nine-year-olds had a mean school time
PA score of 8.3 + 2.0; ten-year-olds had a mean school time PA score of 7.5 +
2.2; eleven-year olds had a mean school time PA score of 7.5 + 2.1. There was no
significant mean difference in school time PA score by age at baseline (p=0.497).
Males had a mean PA during school at baseline of 8.4 + 2.0. Females had a mean
PA score during school at baseline of 7.1 + 2.5. There was a mean difference in
PA level at school at baseline by gender (p=0.006). White students had a mean
school PA score at baseline of 8.2 + 2.1, Hispanics’ baseline school PA score was
7.8 + 2.2, and other races had a baseline school PA score of 7.7 + 2.4. There was
no mean difference in September school PA by race. Students classified as
internal had a mean PA during school score of 7.3 + 1.9. Students classified as
35
middle-LOC had a mean PA school score of 8.0 + 2.2. Students classified as
external had a mean PA during school score of 8.3 + 2.5. There was no mean
difference in PA level during school by LOC grouping (p=0.257).
Figure 8. September school PA scores.
At post-testing, the overall mean PA scores for school time activity
including physical education, recess, and lunch was 7.6 + 2.2. The mean PA
score for THANX participants was 7.2 + 2.6. The mean PA score for students not
enrolled in THANX was 7.8 + 2.0. There was no mean difference in PA scores
during school by THANX participation (p=0.248). Eight-year-olds had a post-test
mean school time PA score of 8.2 + 1.9; nine-year-olds had a mean school time
PA score of 8.4 + 2.0; ten-year-olds had a mean school time PA score of 7.0 +
2.3; eleven-year-olds had a mean school time PA score of 7.1 + 2.2. There was a
significant mean difference in school time PA score at post-test by age (p=0.042),
with post-hoc analysis using Fisher’s Least Significant Difference (LSD) showing
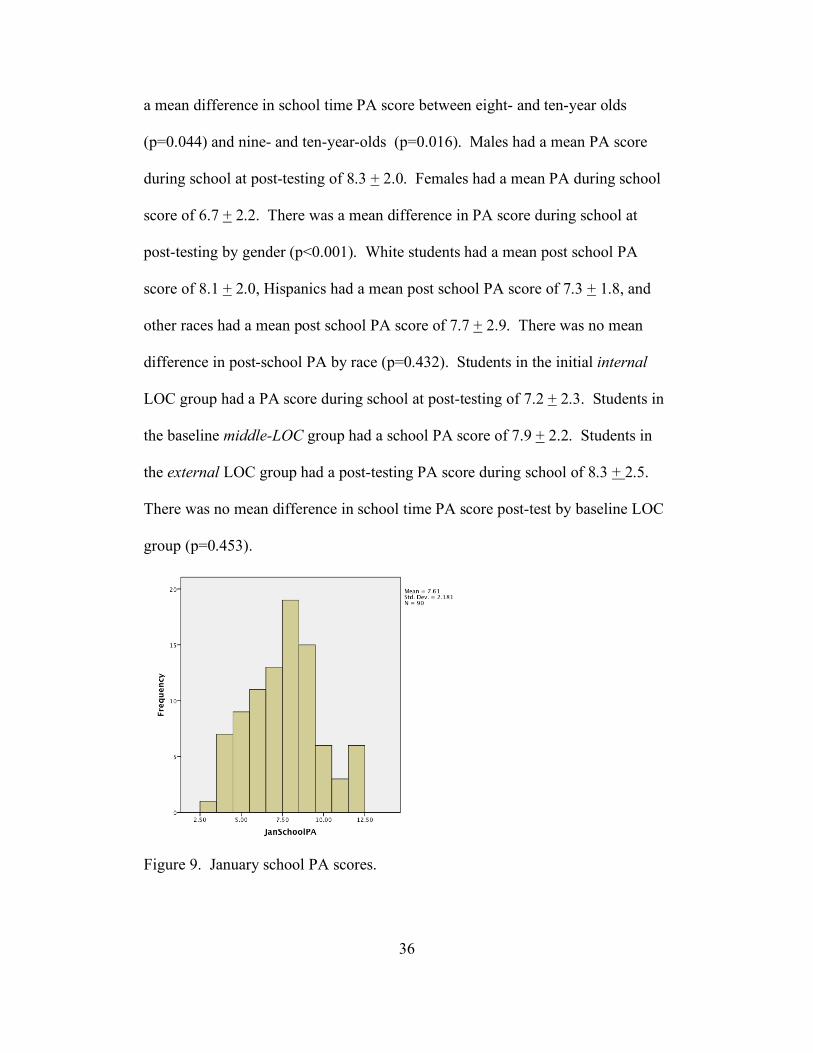
36
a mean difference in school time PA score between eight- and ten-year olds
(p=0.044) and nine- and ten-year-olds (p=0.016). Males had a mean PA score
during school at post-testing of 8.3 + 2.0. Females had a mean PA during school
score of 6.7 + 2.2. There was a mean difference in PA score during school at
post-testing by gender (p<0.001). White students had a mean post school PA
score of 8.1 + 2.0, Hispanics had a mean post school PA score of 7.3 + 1.8, and
other races had a mean post school PA score of 7.7 + 2.9. There was no mean
difference in post-school PA by race (p=0.432). Students in the initial internal
LOC group had a PA score during school at post-testing of 7.2 + 2.3. Students in
the baseline middle-LOC group had a school PA score of 7.9 + 2.2. Students in
the external LOC group had a post-testing PA score during school of 8.3 + 2.5.
There was no mean difference in school time PA score post-test by baseline LOC
group (p=0.453).
Figure 9. January school PA scores.
37
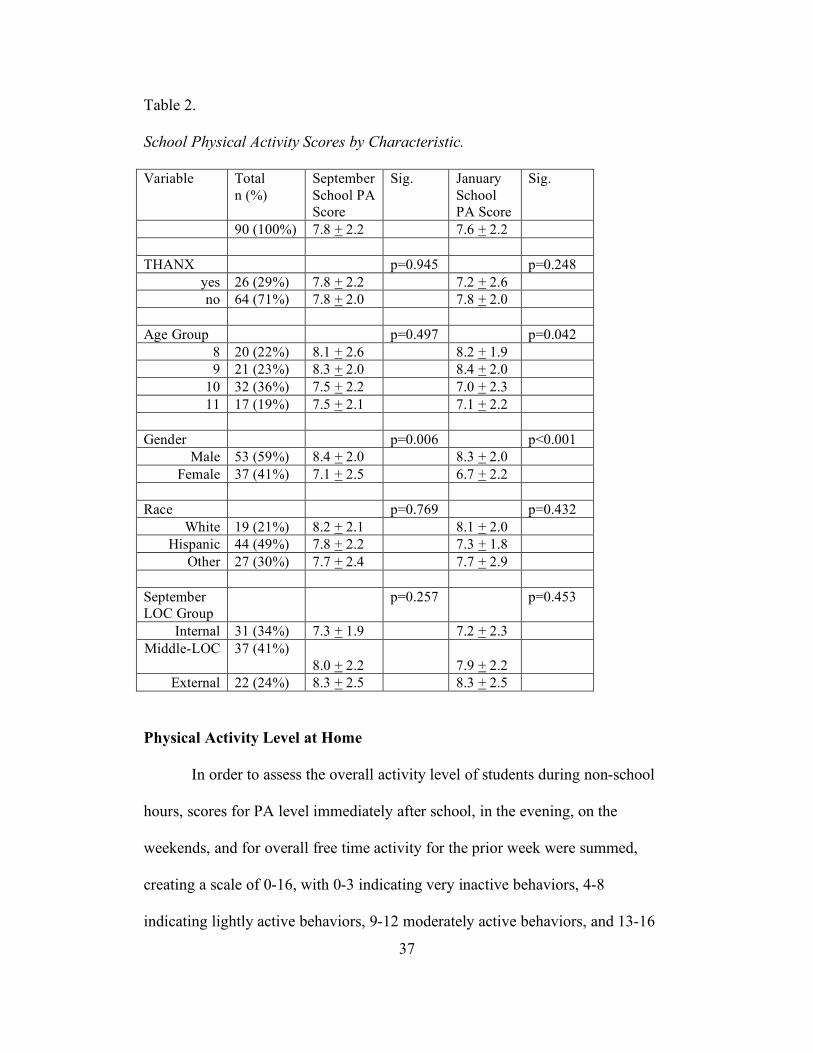
Table 2.
School Physical Activity Scores by Characteristic.
Variable Total n (%)
September School PA Score
Sig. January School PA Score
Sig.
90 (100%) 7.8 + 2.2 7.6 + 2.2 THANX p=0.945 p=0.248
yes 26 (29%) 7.8 + 2.2 7.2 + 2.6 no 64 (71%) 7.8 + 2.0 7.8 + 2.0
Age Group p=0.497 p=0.042
8 20 (22%) 8.1 + 2.6 8.2 + 1.9 9 21 (23%) 8.3 + 2.0 8.4 + 2.0
10 32 (36%) 7.5 + 2.2 7.0 + 2.3 11 17 (19%) 7.5 + 2.1 7.1 + 2.2
Gender p=0.006 p<0.001
Male 53 (59%) 8.4 + 2.0 8.3 + 2.0 Female 37 (41%) 7.1 + 2.5 6.7 + 2.2
Race p=0.769 p=0.432
White 19 (21%) 8.2 + 2.1 8.1 + 2.0 Hispanic 44 (49%) 7.8 + 2.2 7.3 + 1.8
Other 27 (30%) 7.7 + 2.4 7.7 + 2.9 September LOC Group
p=0.257 p=0.453
Internal 31 (34%) 7.3 + 1.9 7.2 + 2.3 Middle-LOC 37 (41%)
8.0 + 2.2
7.9 + 2.2
External 22 (24%) 8.3 + 2.5 8.3 + 2.5
Physical Activity Level at Home
In order to assess the overall activity level of students during non-school
hours, scores for PA level immediately after school, in the evening, on the
weekends, and for overall free time activity for the prior week were summed,
creating a scale of 0-16, with 0-3 indicating very inactive behaviors, 4-8
indicating lightly active behaviors, 9-12 moderately active behaviors, and 13-16
38
indicating very active behaviors during the 4 time frames. At baseline, the overall
mean PA scores for non-school time activity was 9.0 + 4.1. The mean PA score
for non-school hours for THANX participants was 9.0 + 3.8. The mean PA score
for non-school hours for students not enrolled in THANX was 8.9 + 4.2. There
was no mean difference in PA scores during non-school hours by THANX
participation (p=0.916). Eight-year-olds had a mean non-school time PA score of
7.4 + 4.0; nine-year-olds had a mean non-school time PA score of 7.9 + 4.2; ten-
year-olds had a mean non-school time PA score of 9.5 + 3.8; eleven-year-olds had
a mean school time PA score of 11.1 + 3.7. There was a significant mean
difference in non-school time PA score by age group (p=0.017), with post-hoc
analysis using LSD showing a mean difference between 8- and 10-year-olds
(p=0.053), 8- and 11-year-olds (p=0.004), and 9- and 11-year-olds (p=0.013).
Males had a mean PA score at home of 9.0 + 4.3. Females had a mean PA score
of activity at home of 8.9 + 4.1. There was no significant mean difference
between PA score at home at baseline by gender (p=0.968). White students had a
mean home PA score of 9.2 + 4.9, Hispanics had a mean home PA score of 9.3 =
4.0, and other races had a mean home PA score of 8.3 + 3.6. There was no
difference in mean home PA score at baseline by race. Students classified as
internal at baseline had a mean PA score for non-school PA of 9.1 + 3.8.
Students classified as middle-LOC group had a mean PA score for non-school PA
of 9.7 + 4.0. Students classified as external LOC group had a mean PA score for
non-school PA of 7.5 + 4.3. There was no mean difference in baseline PA levels
outside of school by LOC group (p=0.111).
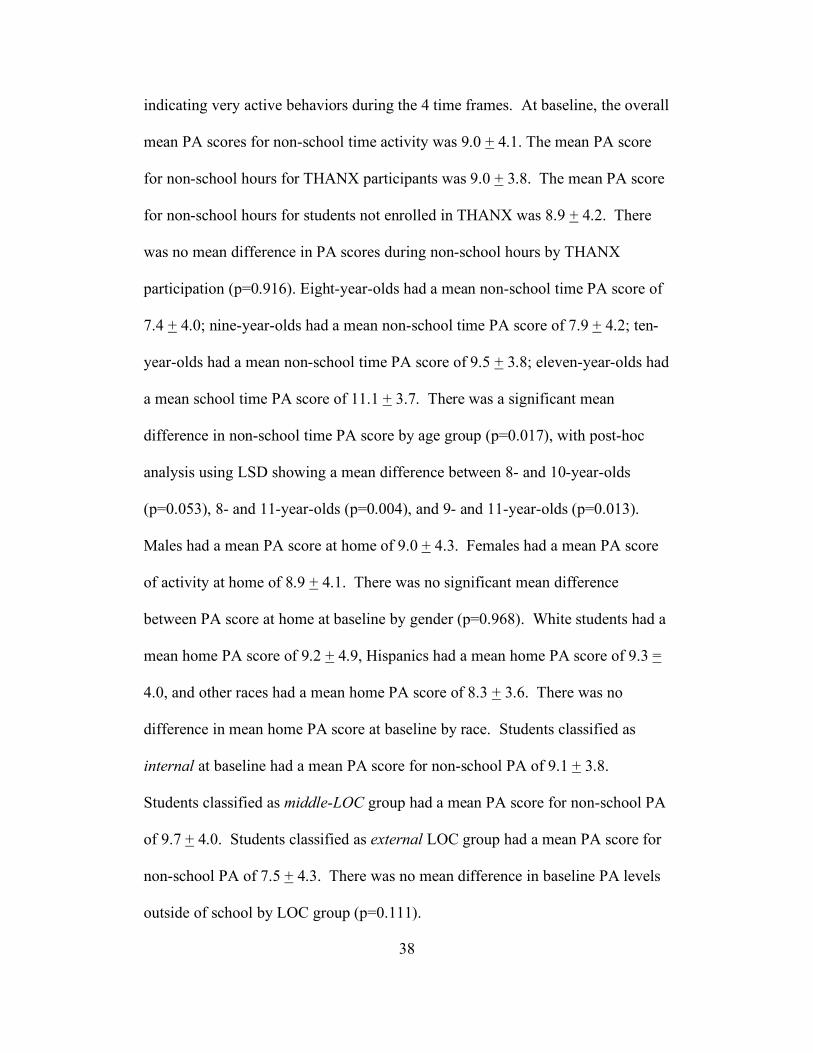
39
Figure 10. September home PA scores.
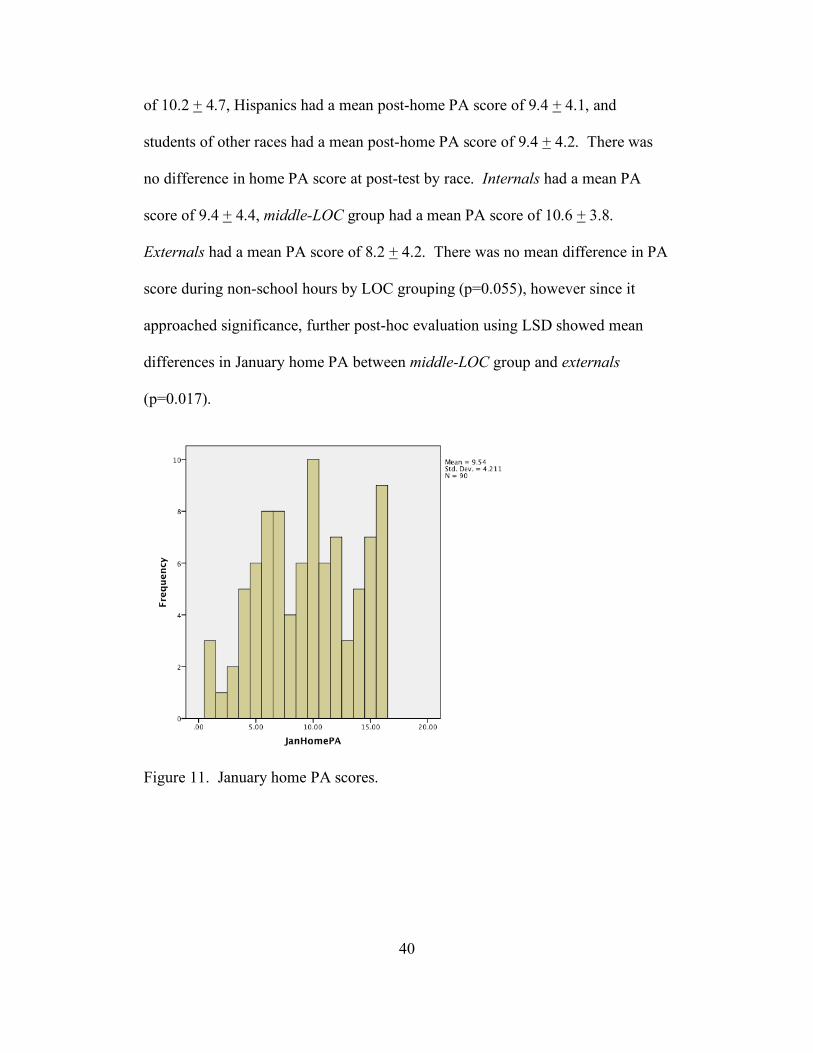
At post-test, the mean PA score for activity outside of school hours was
9.5 + 4.2. Students that participated in the THANX program had a mean PA
score of 9.3 + 4.2. Students that did not participate in the THANX after-school
program had a mean PA score for non-school hours of 9.6 + 4.2. There was no
mean difference in PA score for non-school hours post-intervention by THANX
participation (p=0.736). Eight-year-olds had a mean non-school time PA score of
9.0 + 5.0; nine-year-olds had a mean non-school time PA score of 9.8 + 4.6; ten-
year-olds had a mean non-school time PA score of 9.0 + 3.8; eleven-year olds had
a mean school time PA score of 10.9 + 3.4. There was no difference in non-
school time PA score by age group at post-testing (p=0.451). Males had a mean
PA score for activity outside of school hours of 10.3 + 4.4. Females had a mean
PA score of 8.4 + 3.7. There was a mean difference in PA outside of school hours
at post-test by gender (p=0.036). White students had a mean post-home PA score
40
of 10.2 + 4.7, Hispanics had a mean post-home PA score of 9.4 + 4.1, and
students of other races had a mean post-home PA score of 9.4 + 4.2. There was
no difference in home PA score at post-test by race. Internals had a mean PA
score of 9.4 + 4.4, middle-LOC group had a mean PA score of 10.6 + 3.8.
Externals had a mean PA score of 8.2 + 4.2. There was no mean difference in PA
score during non-school hours by LOC grouping (p=0.055), however since it
approached significance, further post-hoc evaluation using LSD showed mean
differences in January home PA between middle-LOC group and externals
(p=0.017).
Figure 11. January home PA scores.
41
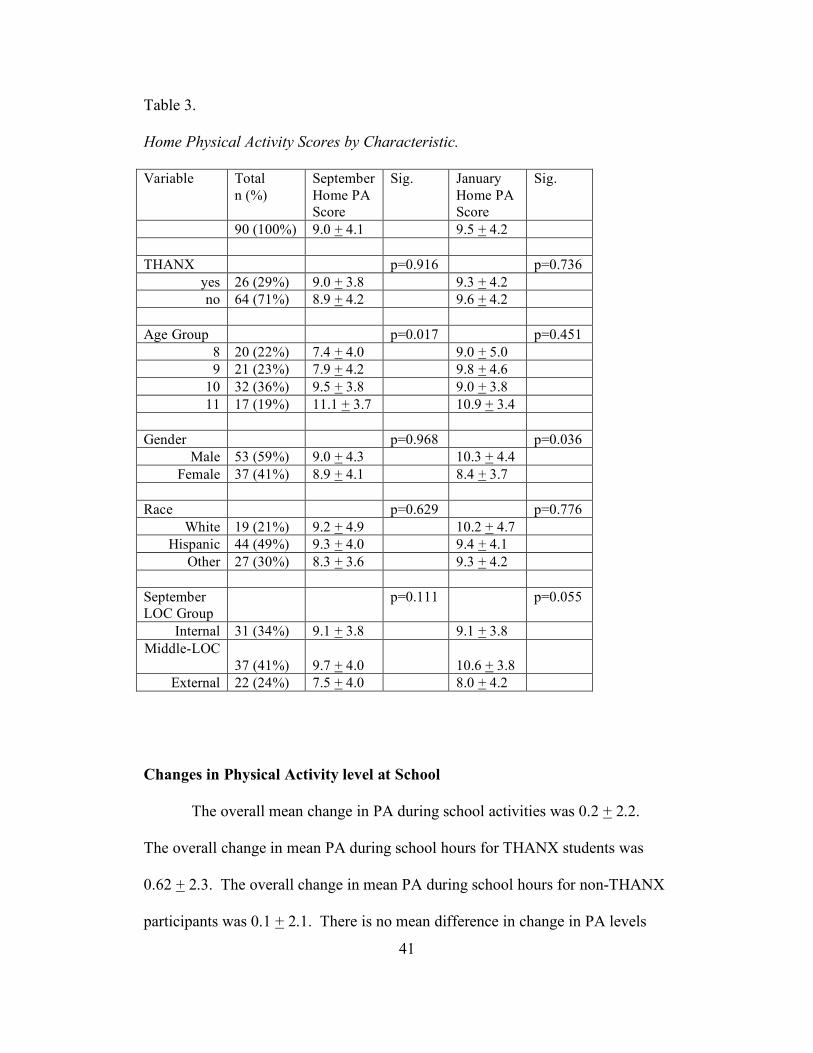
Table 3.
Home Physical Activity Scores by Characteristic.
Variable Total n (%)
September Home PA Score
Sig. January Home PA Score
Sig.
90 (100%) 9.0 + 4.1 9.5 + 4.2 THANX p=0.916 p=0.736
yes 26 (29%) 9.0 + 3.8 9.3 + 4.2 no 64 (71%) 8.9 + 4.2 9.6 + 4.2
Age Group p=0.017 p=0.451
8 20 (22%) 7.4 + 4.0 9.0 + 5.0 9 21 (23%) 7.9 + 4.2 9.8 + 4.6
10 32 (36%) 9.5 + 3.8 9.0 + 3.8 11 17 (19%) 11.1 + 3.7 10.9 + 3.4
Gender p=0.968 p=0.036
Male 53 (59%) 9.0 + 4.3 10.3 + 4.4 Female 37 (41%) 8.9 + 4.1 8.4 + 3.7
Race p=0.629 p=0.776
White 19 (21%) 9.2 + 4.9 10.2 + 4.7 Hispanic 44 (49%) 9.3 + 4.0 9.4 + 4.1
Other 27 (30%) 8.3 + 3.6 9.3 + 4.2 September LOC Group
p=0.111 p=0.055
Internal 31 (34%) 9.1 + 3.8 9.1 + 3.8 Middle-LOC
37 (41%) 9.7 + 4.0
10.6 + 3.8
External 22 (24%) 7.5 + 4.0 8.0 + 4.2
Changes in Physical Activity level at School
The overall mean change in PA during school activities was 0.2 + 2.2.
The overall change in mean PA during school hours for THANX students was
0.62 + 2.3. The overall change in mean PA during school hours for non-THANX
participants was 0.1 + 2.1. There is no mean difference in change in PA levels
42
during school by THANX participation (p=0.276). Males had an overall change
in PA at school of 0.1 + 2.2. Females had an overall change in PA at school of
0.4 + 2.1. There was no significant change in PA level during school by gender
(p=0.506). Internals had a change in PA during school from baseline to post-test
of 0.1 + 2.0. Middle-LOC group had a change in school PA of 0.1 + 1.8.
Externals had a change in PA during school of 0.6 + 2.2. There was no
significant difference between LOC group for changes in PA during school
(p=0.661). Eight-year-olds had a mean change in PA level during school of -0.1
+ 2.9; nine-year-olds had a mean change of -0.1 + 2.3; ten-year-olds had a mean
change in PA level during school of 0.5 + 1.6; eleven-year-olds had a mean
change of 0.4 + 2.2. There was no mean difference in change of PA level during
school by age (p=0.65).
Changes in Physical Activity level at Home
The overall mean change in PA during non-school hours was -0.6 + 4.8.
The overall change in mean PA during non-school hours for THANX students
was -0.3+ 4.7. The overall change in mean PA during non-school hours for non-
THANX students was -0.7 + 4.8. There is no mean difference in change in PA
levels during non-school hours by THANX participation (p=0.697). Males had a
mean change in PA during non-school hours of -1.3 + 4.8. Females had a mean
change in PA during non-school hours of 0.5 + 4.8. There is no mean difference
in change of PA level outside of school (p=0.069) by gender. Internals had a
change in PA during non-school hours from baseline to post-test of -0.2 + 4.2.
Middle-LOC group had a change of non-school PA of -0.9 + 4.0. Externals had a
43
change in PA outside of school of -0.5 + 6.5. There was no significant difference
between LOC group for changes in PA outside of school (p=0.836). Eight-year-
olds had a mean change in PA level outside of school of -1.6 + 5.4; nine-year-olds
had a mean change of -1.9 + 4.2; ten-year-olds had a mean change in PA level
outside of school of 0.5 + 4.3; eleven-year-olds had a mean change of 0.2 + 3.8.
There was no difference in mean change of PA level outside of school by age
group (p=0.196).
Changes in Locus of Control Group
The mean difference in change of LOC group was -0.1 + 1.0. THANX
participants had a mean change of -0.04 + 1.0. Non-THANX participants had a
mean change in LOC of -0.1 + 1.0. There was no significant change in Locus of
Control group from baseline to post-test as measured by participation in the
THANX program (p=0.809). Males had a mean change in LOC group of -0.1 +
0.9; females had a mean change of LOC group of -0.1 + 1.0. There was no mean
difference in change in LOC group by gender (p=0.979). Eight-year-olds had a
mean change in LOC group of 0.1 + 1.2; nine-year-olds had a mean change of
LOC group of 0.0 + 0.8; ten-year-olds had a mean change in LOC group of -0.3 +
1.0; and eleven-year olds had a mean change of 0.1 + 0.7. There was no mean
difference in change of LOC group by age (p=0.394). Whites had a mean change
of LOC group of 0.2 + 0.8; Hispanics had a mean change of LOC group of -0.1 +
1.1; other races combined had a mean change in LOC group of -0.2 + 0.9; there
was no difference in change of LOC group by race (p=0.477).
44
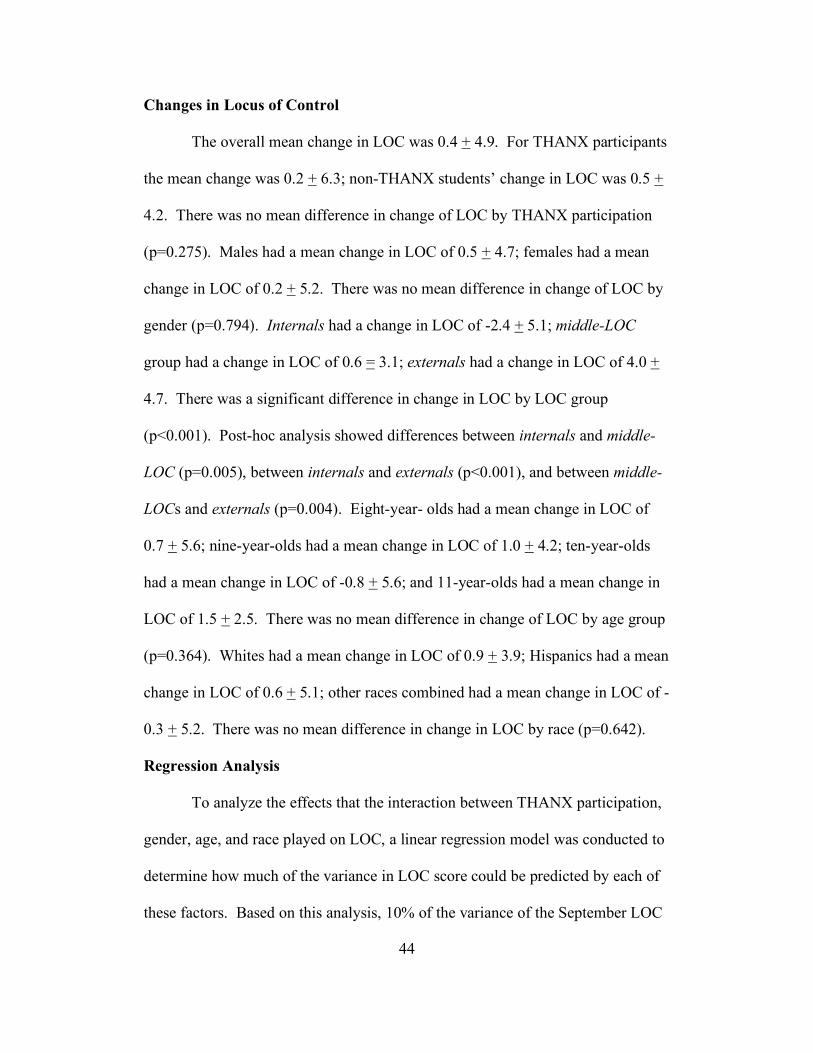
Changes in Locus of Control
The overall mean change in LOC was 0.4 + 4.9. For THANX participants
the mean change was 0.2 + 6.3; non-THANX students’ change in LOC was 0.5 +
4.2. There was no mean difference in change of LOC by THANX participation
(p=0.275). Males had a mean change in LOC of 0.5 + 4.7; females had a mean
change in LOC of 0.2 + 5.2. There was no mean difference in change of LOC by
gender (p=0.794). Internals had a change in LOC of -2.4 + 5.1; middle-LOC
group had a change in LOC of 0.6 = 3.1; externals had a change in LOC of 4.0 +
4.7. There was a significant difference in change in LOC by LOC group
(p<0.001). Post-hoc analysis showed differences between internals and middle-
LOC (p=0.005), between internals and externals (p<0.001), and between middle-
LOCs and externals (p=0.004). Eight-year- olds had a mean change in LOC of
0.7 + 5.6; nine-year-olds had a mean change in LOC of 1.0 + 4.2; ten-year-olds
had a mean change in LOC of -0.8 + 5.6; and 11-year-olds had a mean change in
LOC of 1.5 + 2.5. There was no mean difference in change of LOC by age group
(p=0.364). Whites had a mean change in LOC of 0.9 + 3.9; Hispanics had a mean
change in LOC of 0.6 + 5.1; other races combined had a mean change in LOC of -
0.3 + 5.2. There was no mean difference in change in LOC by race (p=0.642).
Regression Analysis
To analyze the effects that the interaction between THANX participation,
gender, age, and race played on LOC, a linear regression model was conducted to
determine how much of the variance in LOC score could be predicted by each of
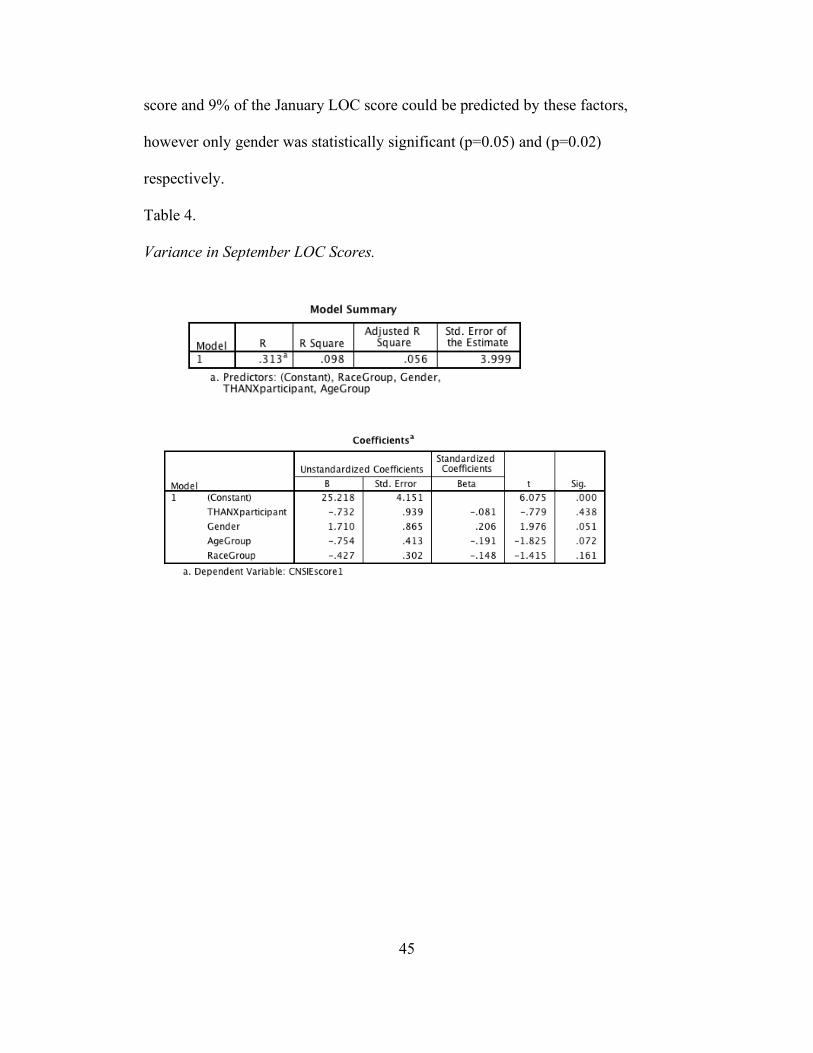
these factors. Based on this analysis, 10% of the variance of the September LOC
45
score and 9% of the January LOC score could be predicted by these factors,
however only gender was statistically significant (p=0.05) and (p=0.02)
respectively.
Table 4.
Variance in September LOC Scores.
46
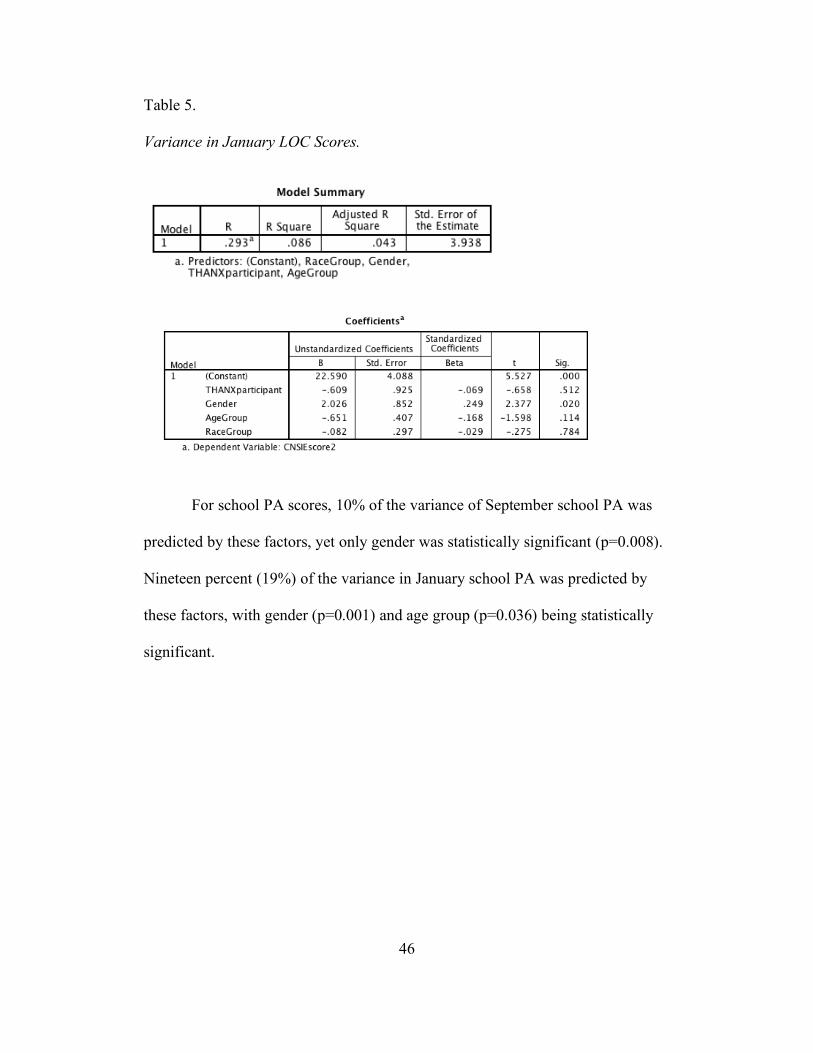
Table 5.
Variance in January LOC Scores.
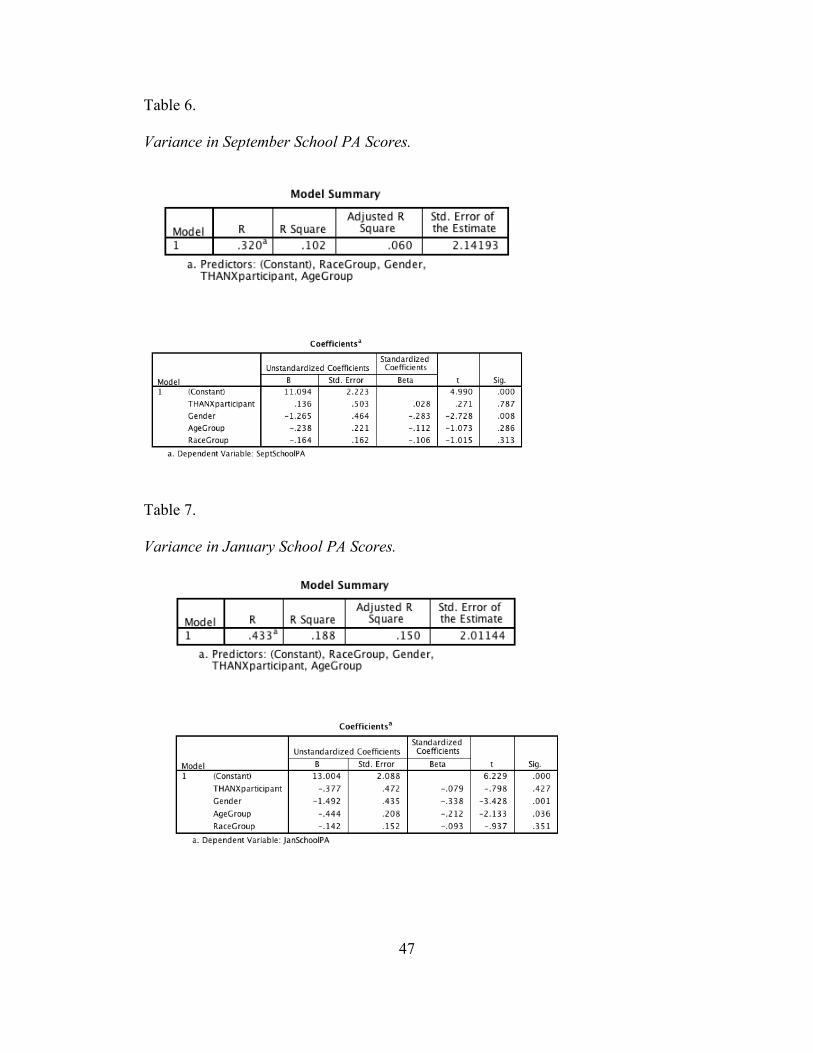
For school PA scores, 10% of the variance of September school PA was
predicted by these factors, yet only gender was statistically significant (p=0.008).
Nineteen percent (19%) of the variance in January school PA was predicted by
these factors, with gender (p=0.001) and age group (p=0.036) being statistically
significant.
47
Table 6.
Variance in September School PA Scores.
Table 7.
Variance in January School PA Scores.
48
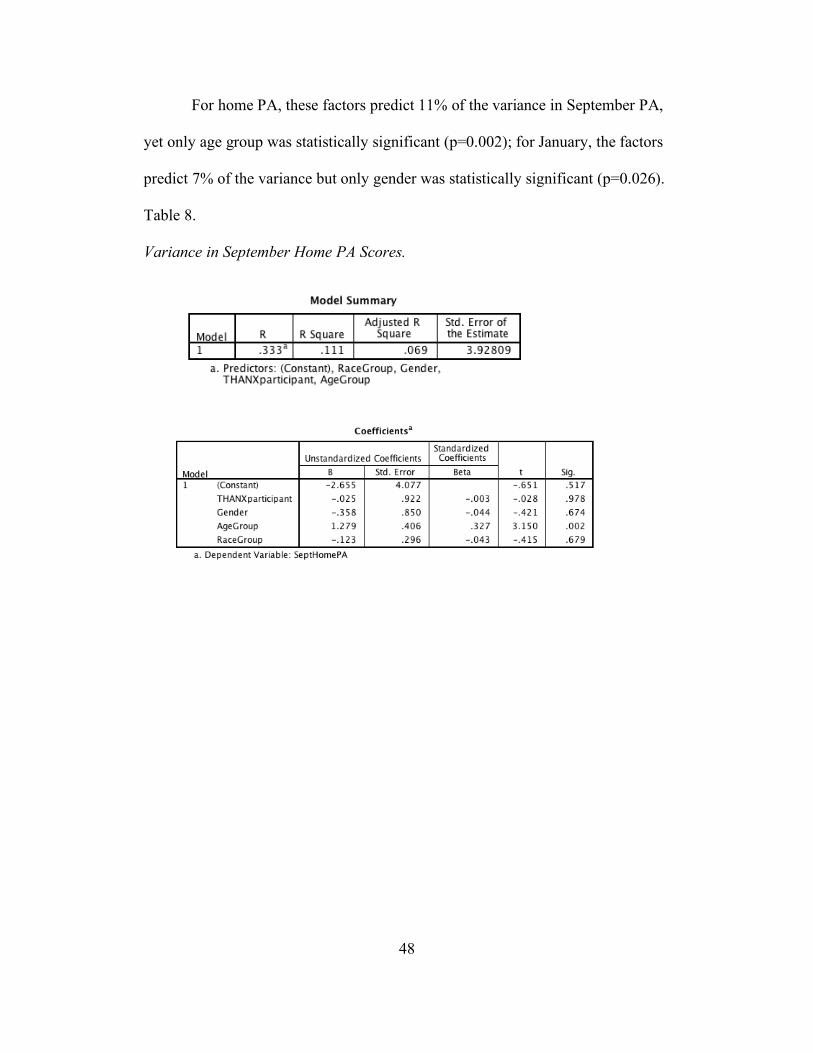
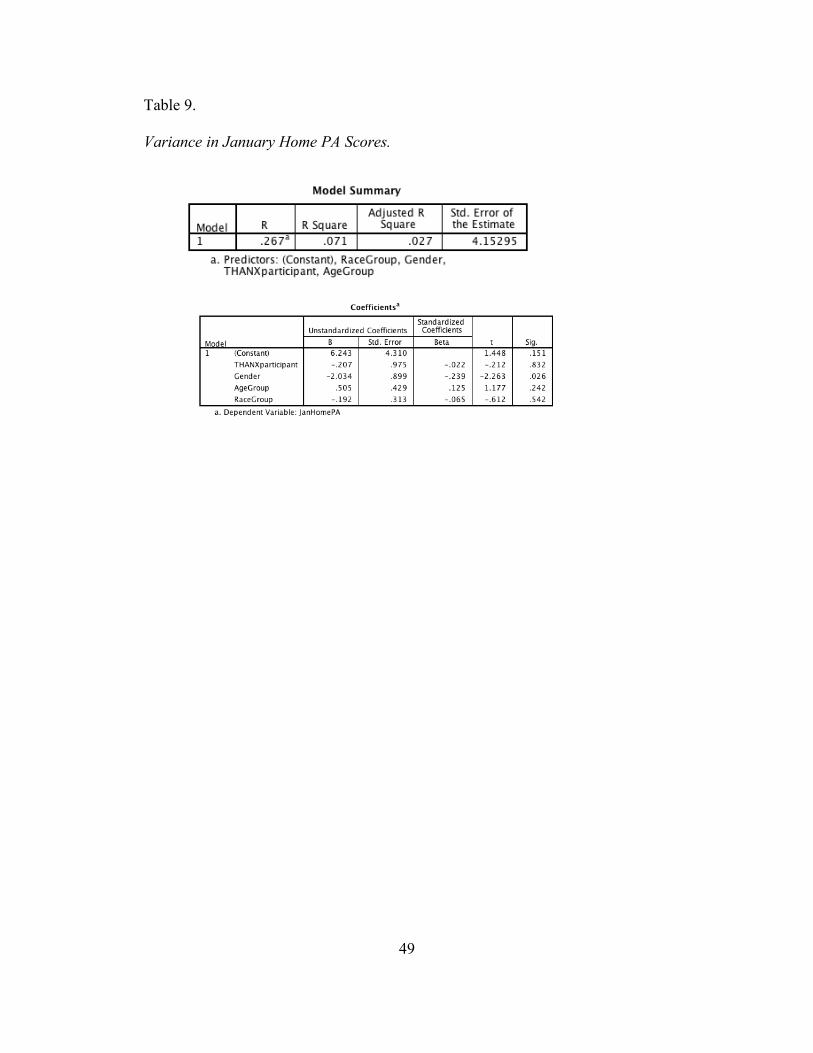
For home PA, these factors predict 11% of the variance in September PA,
yet only age group was statistically significant (p=0.002); for January, the factors
predict 7% of the variance but only gender was statistically significant (p=0.026).
Table 8.
Variance in September Home PA Scores.
49
Table 9.
Variance in January Home PA Scores.
50
CHAPTER 5
DISCUSSION
Mean Locus of Control (LOC) scores of the Child Nowicki Strickland
Internal External Scale (CNSIE) did not differ significantly from September to
January. This could be due to the fact that only 4 months elapsed between the
pre- and post-tests, which was not sufficient to see true changes. The present
study is part of a longer project in which data will be collected at the end of the
school year, which could provide ample time to denote changes. This held true by
age, participation in THANX, gender, and race. Although LOC scores did not
differ significantly from the two time points, LOC scores did differ significantly
by gender: males were more internal and females were more external.
School time PA scores differed by gender at baseline and by gender and
age group at post. Boys were more active than the girls at both time points, and
younger children were more active than older children. This may be because both
younger children and boys tend to use their free time to play and are not
concerned with what they look like during or after playing; they just want to have
fun. As children, particularly girls, enter adolescence they begin to become
concerned with both their appearance and performance relative to their peers;
those that are not naturally athletic or that lack exposure to sports compared to
their peers are more likely to avoid the activity or behavior, opting instead to
spend their time talking, standing around, or engaging in other more sedentary
activities. As demands in the classroom and at home increase with age, older
students may choose to finish incomplete assignments during school time
51
recreation so as to lessen the burden of homework after school, particularly if they
are involved in other activities that typically practice 2 or 3 times a week such as
soccer, baseball, football, karate, and dance, or if they have responsibilities
around the home such as helping to care for their younger siblings. Additionally,
at Sequoia, teachers have the discretion of allowing time for recess or not.
Generally, kindergarten through 2nd grade students have two 15 minute recesses
each day, and 3rd through 6th grade students have one recess, but not every day.
Students’ lunch period is 30 minutes, with the first 15 minutes designated as time
to eat and the last 15 minutes as time to play if they have finished their lunch.
Many students may also spend a significant amount of their lunch time waiting in
line to purchase their lunch, thus running out of time to play afterwards.
Non-school PA varied by age group at baseline, and by gender and LOC
group at post. Eight-year olds were significantly less active than 10- and 11- year
olds, and 9-year olds were less active than 11-year olds. This may be fairly
intuitive, as older children are given more freedom to go out and play with friends
in neighborhood parks often without immediate adult supervision allowing for
unstructured play. Safety and security issues may cause parents to be reluctant to
allow their 8- or 9-year olds to play in the neighborhood unsupervised; in this
case, if a parent was occupied at home, their child would have been there as well,
likely being sedentary inside the house. Another possible reason for the
difference in PA level is that older children are more likely to be involved with
organized sports, whether in recreational or competitive leagues, than younger
children who may still lack the gross motor skills and coordination required of
52
these sports. Younger siblings are often chronic spectators at their older brothers’
and sisters’ team practices and games, and frequently there are financial
considerations when children begin playing in competitive leagues, resulting in
fewer resources (money and time) available for the younger child to participate.
Although home PA scores did not differ by gender at baseline, in January
the boys were significantly more active than the girls. These differences were
found during overall free time PA during the prior week, but not specifically after
school, in the evening, or on the weekend. There was only one activity on the
PAQ-C that boys participated in significantly more than the girls and that was
football. The week prior to post-testing, the National Football League (NFL) was
in the last week of the playoffs holding the AFC and NFC championships,
deciding who would move on to the Superbowl on February 5th. The media hype
of the NFL during the week prior to testing could explain why boys were
significantly more active during their free time, specifically playing football, than
the girls. Family influence and role models could also explain gender differences;
this study did not assess parental PA levels so there is no way of knowing if
students that were more active also have more active role models in the home.
Overall, however, there was not much difference in leisure time PA levels
from September to January, suggesting that children’s level of overall free time
PA remains relatively constant. However, since childhood PA predicts
adolescence PA which in turn predicts adult PA, and since PA levels decline
somewhat at each time point, it appears that prior activity, not LOC, is the best
53
predictor of future activity, for it is likely that as these students get older their PA
levels will also decline even as their LOC becomes more internal.
The present study found that although boys were more internal and were
generally more active than girls both at school and at home, and older children
were more internal than younger children and were more active at home, younger,
and thus more external, children were more active at school. Therefore it is likely
gender and age that predict PA level, not LOC.
54
CHAPTER 6
CONCLUSIONS AND APPLICATION
Locus of control (LOC) is a phenomenon closely related to self-efficacy,
one’s confidence in their ability to complete a given task or behave in a certain
fashion. The present study did not demonstrate that LOC predicted PA level or
future PA. In fact, the best predictors current PA behaviors were age and gender,
and of future PA behaviors were current PA behaviors. However, since LOC can
be influenced by positive messages, interventions focusing on positive messages
regarding PA and self-efficacy could serve to make children more internal and
confident in their ability to engage in more physical activity thus meeting the
recommended guidelines of at least 60 minutes of play every day. Fostering a joy
for play and movement at a young age so as to make the behavior “normal” is the
best way to predict PA behavior throughout the lifespan.
One reason that girls may have been more external than boys is that they
are more likely to be “followers” rather than “leaders”. Girls’ actions tend to be
more motivated by what others are doing, saying, or even thinking about them;
they behave in ways because they are pushed and pulled. Even when considering
settings such as the gym, women tend to participate more in group exercise
classes, where the instructors and even the other women in the class push them to
work harder, and men tend to participate in more individual settings such as
running and weight lifting where they may set a personal goal of achieving a
certain pace, distance, or weight.
55
There were no significant changes in LOC or PA levels from pre- to post-
testing. Age and grade appear to be the strongest predictor of PA level with sharp
declines around age 11, as children enter adolescence. Therefore interventions
designed to target this age level and to increase or at the very least maintain their
PA level could be beneficial for encouraging increased PA levels in adolescence,
as these behaviors carry on into adulthood.
Gender proved to be the greatest determinant in PA level at school, with
boys significantly more active than girls during recess and lunch, as well as in
their overall PA for the week at post-test. Additionally, gender had significant
mean differences in total school PA and total overall PA at post-test. Despite
having access to PA, girls continue to lag behind boys in sports. This could be
because physical education has traditionally taught men’s team sports and
women’s team sports simply are not as prominent. Or it could be that there is
simply a lack of physically active female role models for the girls to emulate. At
Sequoia Elementary School in Mesa, AZ, although all of the general education
teachers in the study were female, both physical education teachers were male.
This sends a message to girls as well as boys that girls are supposed to study and
boys are supposed to play. The demographics of the teachers at Sequoia
Elementary are not unique. Stereotypes that boys are supposed to run around and
get sweaty and girls are supposed to be concerned with their appearance are
reinforced by the popular media; women are rarely shown sweating and
exercising as a matter of fact.
56
In spite of laws like Title IX which have given girls more opportunities to
participate in sports at school, girls still lack female role models in professional
sports, and those that exist tend to participate in “women’s” sports such as ice
skating, gymnastics, tennis, and golf. Men dominate the sports news industry;
they are the reporters covering sports that men play such as football, baseball,
basketball, and hockey; very few sports reporters are women, and very rarely do
men report on women’s sports. In both the on- and off- seasons of each male
dominated sport, the airwaves on multiple sports channels are filled with news
about drafts, trades, projected playoff contenders, coaches, and scandals.
However, women’s sports do not have a single television channel dedicated to
them, and on the sports channels that do exist, female stars are rarely mentioned,
even in the days leading to a national or global championship or competition. The
most attention women’s sports receive is during the Olympics, and even then, the
replay of the matches or competitions frequently takes place during late night
hours when young girls are asleep and unlikely to watch.
Present physical activity is the greatest predictor of future physical
activity, and as PA tends to decline from childhood to adolescence to adulthood,
the best way to increase PA in adulthood is to increase it significantly in
childhood. The best chance to improve the long-term health of the nation will
take a generation to see the results. An investment in children, particularly young
girls, to ensure that they meet the minimum recommendation of 60 minutes of
play daily now will be an investment in the collective health future of the country
as well. Schools are strapped not only for funding for teachers, books, and
57
facilities, but for time to encourage their students to be what they are: children. In
their natural state, children will play; they will create; they will learn; and in
doing so their self-efficacy will increase; their self-esteem will improve; and their
locus of control will become more internal as they see connections between what
they do and how this influences their lives.
58
REFERENCES
Andersen, R.E., Crespo, C.J., Bartlett, S.J., Cheskin, L.J., & Pratt M. (1998). Relationship of physical activity and television watching with body weight and level of fatness among children: Results from the Third National Health and Nutrition Examination Survey. Journal of the American Medical Association, 279:938–942. [PubMed: 9544768]
Bandura, A. (1991). Social cognitive theory of self-regulation. Organizational
Behavior and Human Decision Processes, 50, 248-287. Baranowski, T., Mendlein, J., Resnicow, K., Frank, E., Cullen, K.W., &
Baranowski, J., (2000). Physical activity and nutrition in children and youth: An overview of obesity prevention. American Journal of Preventive Medicine, 31, Sl-S10.
Barling, J. (1979). Verbal proficiency: A confounding variable in the reliability
of children’s attitude scales? Child Development, 30(4): 1254-1256. Bauman, A. E., Sallis, J. F., Dzewaltowski, D. A., & Owen, N. (2002). Toward a
better understanding of the influences on physical activity: The role of determinants, correlates, causal variables, mediators, moderators, and confounders. American Journal of Preventative Medicine, 23(2 Suppl), 5-14.
Baumeister, R.F., Campbell, J.D., Krueger, J.I., & Vohs, K.D. (2003). Does high
self-esteem cause better performance, interpersonal success, happiness, or healthier lifestyles? American Psychological Society, 4(1), 1-44.
Biddle, S.J., Gorely, T., Pearson, N., & Bull, F.C. (2011). An assessment of self-
reported physical activity instruments in young people for population surveillance: Project ALPHA. International Journal of Behavioral Nutrition and Physical Activity, 2011, 8: 1. doi:10.1186/1479-5868-8-1.
Biddle, S.J., Gorely T., & Stensel D.J. (2004). Health-enhancing physical activity
and sedentary behaviour in children and adolescents. Journal of Sports Sciences, 22(8), 679-701. doi:10. 1080/0264041040001712412
Booth, F.W., Laye, M.J., Lees, S.J., Rector, R.S. & Thyfault, J.P. (2008).
Reduced physical activity and risk of chronic disease. European Journal of Applied Physiology, 102, 381-390
Booth, M. L., Owen, N., Bauman, A., Clavisi, O., & Leslie, E. (2000). Social-
cognitive and perceived environment influences associated with physical activity in older Australians. Preventive Medicine, 31(1), 15-22.
59
Bungum, T. J., Orsak, K. C, & Chang, C. L. (1997). Factors affecting exercise
adherence at a worksite wellness program. American Journal of Health Behavior, 21(1), 60-66.
Canadian Fitness and Lifestyle Research Institute. 2006 physical activity monitor.
Ottawa ON: Canadian Fitness and Lifestyle Research Institute, 2006. www.cflri.ca/eng/statistics/surveys/pam2006. Accessed January 24, 2011.
Center for Education Policy. Choices, changes, and challenges: curriculum and instruction in the NCLB era. Washington, DC: Center for Education Policy; 2007.
Centers for Disease Control and Prevention. (2004). Youth Risk Behavior
Surveillance—United States, 2003.Washington, DC: Centers for Disease Control and Prevention, 2004.
Centers for Disease Control and Prevention. (2000). Overview: School health
policies and programs study 2000. Available at: http://www.cdc.gov/ nccdphp/dash/shpps. Accessed January 24, 2011.
Centers for Disease Control and Prevention. (2010). State Indicator Report on
Physical Activity, 2010. Atlanta, GA: U.S. Department of Health and Human Services, 2010.
Chinapaw, M.J.M., Mokkink, L.B., van Poppel, M.N.N., van Mechelen, W., &
Terwee, C.B. (2010). Physical Activity Questionnaires for Youth: A systematic review of measurement properties. Sports Medicine 2010, 40(7): 539-563.
Clark, D. O., & Nothwehr, F. (1999). Exercise self-efficacy and its correlates
among socioeconomically disadvantaged older adults. Health Education & Behavior, 26(4), 535-546.
Crimi, K., Hensley, L.D., & Finn, K.J. (2009). Psychosocial correlates of
physical activity in children and adolescents in a rural community setting. International Journal of Exercise Science, 2(4): 230-243.
Dale, D., Corbin, C.B., Dale, K.S. (2000). Restricting opportunities to be active
during school time: Do children compensate by increasing physical activity levels after school? Research Quarterly for Exercise & Sport, 71(3):240-248.
60
Dey, E. L., Astin, A. W., & Korn, W. S. (1992). The American freshman: Twenty-five year trends, 1966–1990. Los Angeles, CA: Higher Education Research Institute.
Dietz, W.H. (2001). The obesity epidemic in young children. Reduce television
viewing and promote playing. British Medical Journal, 322(7282):313-314.
Dietz, W.H. (1998). Health consequences of obesity in youth: Childhood
predictors of adult disease. Pediatrics, 101,518–25. [PubMed: 12224658]
Dishman, R.K., & Buckworth, J. (1996). Increasing physical activity: A
quantitative synthesis. Medicine and Science in Sports and Exercise, 28, 706-719.
Dishman, R.K., & Buckworth, J. (1997). Adherence to physical activity. In W.P.
Morgan (Ed.), Physical activity and mental health (pp. 63-80) Washington, DC: Taylor & Francis.
Dishman, R. K., & Ickes, W. (1981). Self-motivation and adherence to therapeutic
exercise. Journal of Behavioral Medicine, 4(4), 421-438. Dishman, R. K., Ickes, W., & Morgan, W. P., (1980). Self-motivation and
adherence to habitual physical activity. Journal of Applied Social Psychology, 10(2), 115-132.
Eisenmann, J.C., Bartee, R.T., Smith, D.T., Welk, G.J., & Fu, Q. (2008).
Combined influence of physical activity and television viewing on the risk of overweight in US youth. International Journal of Obesity, 32:613–8.
Ekelund, U., Brage, S., Froberg, K., Harro, M., Anderssen, S.A., Sardinha, L.B.,
Riddoch, C., Andersen, L.B. (2006). TV viewing and physical activity are independently associated with metabolic risk in children: The European Youth Heart Study. PLoS Medicine; (3),e488. [PubMed: 17194189]
Finlayson, M.A., & Rourke, B.P. (1978). Locus of control as a predictor variable
in rehabilitation medicine. Journal of Clinical Psychology, 34(2), 367-368.
Freedman, D.S., Serdula, M.K., Srinivasan, S.R., Berenson, G.S. (1999). Relation
of circumferences and skinfold thicknesses to lipid and insulin concentrations in children and adolescents: The Bogalusa Heart Study. American Journal of Clinical Nutrition, 69,308–17. [PubMed: 9989697]
61
Gale, J. B., Eckhoff, W. T., Mogel, S. F., & Rodnick, J. E. (1984). Factors related
to adherence to an exercise program for healthy adults. Medicine and Science in Sports and Exercise, 16(6), 544-549.
Gentile, B., Twenge, J.M., Campbell, W.K. (2010). Birth cohort differences in
Self-Esteem, 1988-2008: A cross-temporal meta-analysis. Review of General Psychology: 14(3), 261-268.
Gordon-Larsen P, Nelson MC, & Popkin BM. (2004). Longitudinal Physical
Activity and Sedentary Behavior Trends: Adolescence to Adulthood. American Journal of Preventive Medicine; 27:277.
Graham, G., Wilkins, J.L.M., Westfall, S., Parker, S., Fraser, R., & Tembo, M.
(2002). The effects of high-stakes testing on elementary school art, music, and physical education. Journal of Physical Education, Recreation and Dance, 73(8):51-54.
Holtz, G. T. (1995). Welcome to the jungle: The why behind “Generation X.”
New York: St. Martin’s Press. Hume, C., Singh, A., Brug, J., van Mechelen, W., Chinapaw, M. (2008). Dose-
response associations between screen time and overweight among youth. International Journal of Pediatric Obesity, 1–4.
Hurtig-Wennloef, A., Ruiz, J.R., Harro, M. (2007). Cardiorespiratory fitness
relates more strongly than physical activity to cardiovascular disease risk factors in healthy children and adolescents: The European Youth Heart Study. European Journal of Cardiovascular Prevention & Rehabilitation, 14, 575-581. doi:10.1097/HJR.0b013e32808 c67e3
Janssen, I., Katzmarzyk, P. T., Boyce, W. F., Vereecken, C., Mulvihill, C., &
Roberts, C., (2005). The health behaviour in school-aged children obesity working group comparison of overweight and obesity prevalence in school-aged youth from 34 countries and their relationships with physical activity and dietary patterns. Obesity Reviews, 6(2), 123-132. doi:10.1111/j.1467- 789X.2005.00176.x
Jordan, A.B. (2010). Children's television viewing and childhood obesity.
Pediatric Annals. 39(9):569-73. doi: 10.3928/00904481-20100825-08. Katzmarzyk, P.T., Church, T.S., Craig, C.L., & Bouchard, C. (2009). Sitting time
and mortality from all causes, cardiovascular disease, and cancer. Medicine & Science in Sports & Exercise, 41, 998-1005.
62
Kimm, S.Y.S., Glynn, N., Obarzanek, E., Kriska, A., Daniels, S., Barton, B., & Liu, K. (2005). Relation between the changes in physical activity and body-mass index during adolescence: A multicentre longitudinal study. Lancet, 366, 301-307. doi:10.1016/S0140-6736(05)66837-7
Kjonniksen, L., Torsheim, T., & Wold, B. (2008). Tracking of leisure-time
physical activity during adolescence and young adulthood: A 10-year longitudinal study. International Journal of Behavioral Nutrition and Physical Activity, 5:69.
Kong, Y., & Shen, F. (2011). Impact of locus of control on health message
effectiveness. Health Mark Quarterly, 28(4): 354-371. doi: 10.1080/07359683.2011.623114.
Kowalski, K.C., Crocker, P.R.E., Faulkner, R.A. (1997). Validation of the
physical activity questionnaire for older children. Pediatric Exercise Science, 9:174-186.
Mark, A.E., Janssen, I. (2008) Relationship between screen time and metabolic
syndrome in adolescents. Journal of Public Health, 30,153–60. [PubMed: 18375469]
Marsh, H.W. (1986). Global self-esteem: Its relation to specific facets of self-
concept and their importance. Journal of Personality and Social Psychology, 51:1224-1236.
McKenzie, T.L., LaMaster, K.J., Sallis, J.F., Marshall, S.J. (1999). Classroom
teachers' leisure physical activity and their conduct of physical education. Journal of Teaching Physical Education, I9,126-132.
Metzler, M.W. (2002). The impact of House Bill 1187 on K-12 health and
physical education programs and staffing in Georgia. Journal of Physical Education, Recreation and Dance, 2002, 35(3):11-15.
Must, A., Jacques, P.F., Dallal, G.E., Bajema, C.J., Dietz, W.H. (1992). Long-
term morbidity and mortality of overweight adolescents. A follow-up of the Harvard Growth Study of 1922 to 1935. New England Journal of Medicine, 327, 1350–5. [PubMed: 1406836]
Nowicki, S., & Strickland, B. R. (1973). A locus of control scale for children.
Journal of Consulting and Clinical Psychology, 40(1), 148-154. doi:10.1037/h0033978
63
Owen, N., Healy, G.N., Matthews, C.E., & Dunstan, D.W. (2010). Too much sitting: The population health science of sedentary behavior. Medicine & Science in Sports & Exercise, 38,105-113.
Pate, R.R., Baranowski, T., Dowda, M., & Trost, S.G. (1996). Tracking of
physical activity in young children. Medicine & Science in Sports & Exercise, 28(l):92-96.
Ratey, J.J. (2008). Spark: The revolutionary new science of exercise and the
brain. New York: Hachette Book Group USA. Rey-Lopez, J.P., Vicente-Rodriguez, G., Biosca, M., & Moreno, L.A., (2008).
Sedentary behaviour and obesity development in children and adolescents. Nutrition Metabolism Cardiovascular Diseases,18, 242–51. [PubMed: 18083016]
Rotter, J. B. (1966). Generalized expectancies for internal versus external control
of reinforcement. Psychological Monographs: General and Applied, 80(1), 1-28. doi:10.1037/h0092976
Sallis, J., Conway, T., Prochaska, J., McKenzie, T. L., Marshall, S. J., & Brown,
M. (2001). The association of school environments with youth physical activity. American Journal of Public Health, 91(4) 618-620.
Sardinha, L.B., Andersen, L.B., Anderssen, S.A., Quiterio A. L., Ornelas, R.,
Froberg K., et al. (2008). Objectively measured time spent sedentary is associated with insulin resistance independent of overall and central body fat in 9- to 10-year-old Portuguese children. Diabetes Care, 31, 569–75. [PubMed: 18070991]
Schoenborn, C. A., & Stommel, M. (2011). Adherence to the 2008 adult physical
activity guidelines and mortality risk. American Journal of Preventive Medicine, 40(5), 514-521. doi:10.1016/j.amepre.2010.12.029
Shephard, R.J. (1997). Curricular physical activity and academic performance.
Pediatric Exercise Science, 9, 113-126. Sherman, L.W. (1984). Development of children’s perceptions of internal locus
of control: A cross-sectional and longitudinal analysis. Journal of Personality, 52(4), 338-354.
Sternfeld, B., Ainsworth, B. E., & Quesenberry, C. P., Jr. (1999). Physical activity
patterns in a diverse population of women. Preventive Medicine, 28(3), 313-323.
64
Sullum, J., Clark, M. M., & King, T. K. (2000). Predictors of exercise relapse in a college population. Journal of American College Health, 48(A), 175-180.
Taras, H. (2005). Physical activity and student performance at school. Journal of
School Health, 75, 214–218. doi:10.1111/j.1746-1561.2005.tb06675.x Tortolero, S.R., Goff, D.C. Jr., Nichaman, M.Z., Labarthe, D.R., Grunbaum, J.A.,
& Hanis, C.L. (1997). Cardiovascular risk factors in Mexican-American and non-Hispanic white children: The Corpus Christi Child Heart Study. Circulation 1997;96:418–23. [PubMed: 9244206]
Troiano, R.P., Berrigan, D., Dodd, K.W., Masse, L.C., Tilert, T., & McDowell,
M. (2008). Physical activity in the U.S. measured by accelerometer. Medicine & Science in Sports & Exercise 2008;40:181–8.
Trost, S. G., Owen, N., Bauman, A. E., Sallis, J. F., & Brown, W. (2002).
Correlates of adults' participation in physical activity: Review and update. Medicine & Science in Sports & Exercise, 54(12), 1996-2001.
Trudeau, F., & Shephard, R.J., (2008). Physical education, school physical
activity, school sports, and academic performance. International Journal of Behavioral Nutrition and Physical Activity, 5(10), 10-21. doi:10.1186/1479-5868-5-10
Twenge, J.M., Campbell, W.K. (2001). Age and birth cohort differences in self-
esteem: A cross-temporal meta-analysis. Personality and Social Psychology Review, 5(4): 321-344.
Tyler, J.D., & Holsinger, D.N. (1975). Locus of control differences between rural
American Indian and white children. The Journal of Social Psychology, 95, 149-155.
U.S. Department of Health and Human Services. (2008). 2008 Physical Activity
Guidelines for Americans: Be Active, Healthy, and Happy. Retrieved from http://www.health.gov/paguidelines/pdf/paguide.pdf.
U.S. Department of Health and Human Services. (2010). The Surgeon General’s
Vision for a Healthy and Fit Nation. Rockville, MD: U.S. Department of Health and Human Services, Office of the Surgeon General.
Warburton D. R., Nicol C., & Bredin S. D. (2006). Prescribing exercise as
preventive therapy. Canadian Medical Association Journal, 174(7), 961-974. doi:10.1503/cmaj.1040750
65
Weiss, R., Kaufman, F.R. (2008). Metabolic complications of childhood obesity: Identifying and mitigating the risk. Diabetes Care, 31(2) S310–6. [PubMed: 18227502]

66
APPENDIX A
IRB APPROVAL
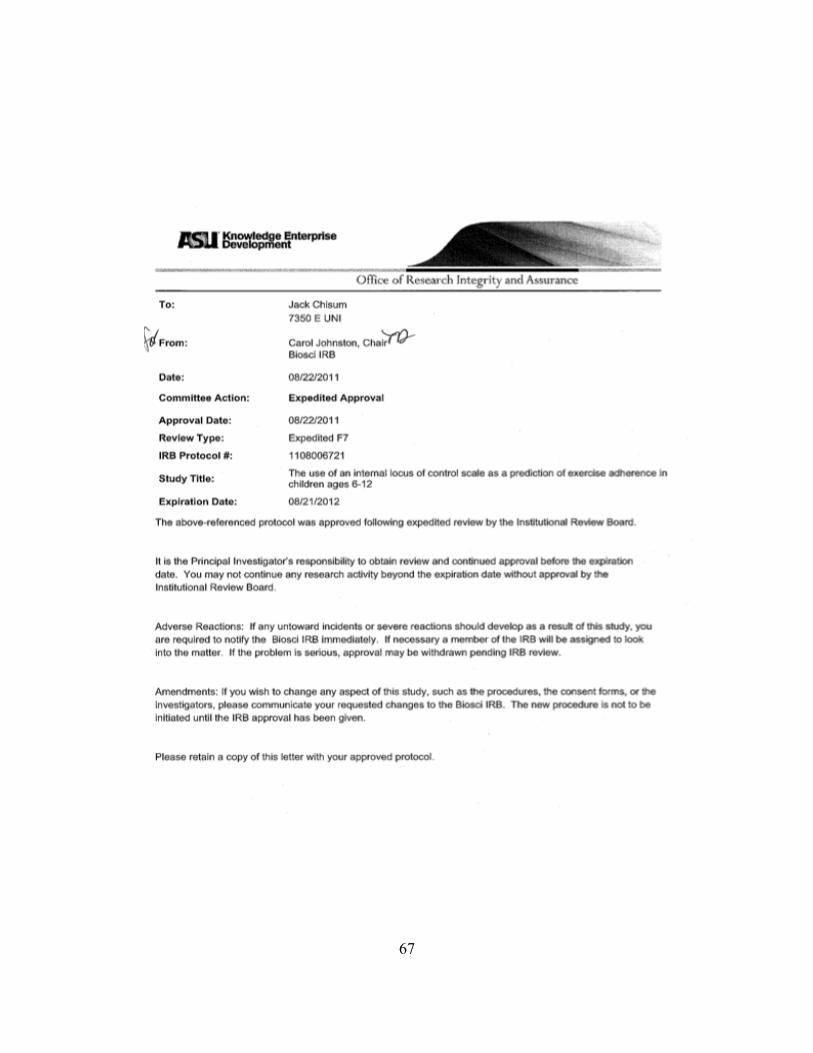
67

68
APPENDIX B
PARENTAL CONSENT FORM: ENGLISH
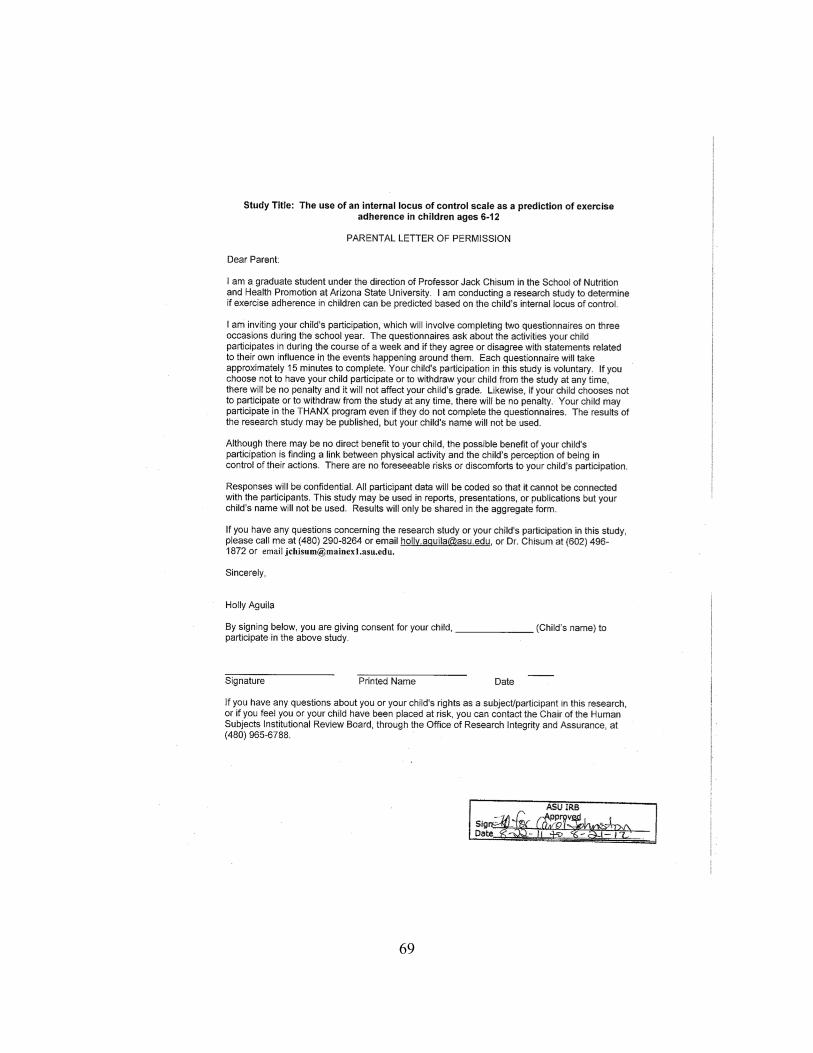
69
70
APPENDIX C
PARENTAL CONSENT FORM: SPANISH
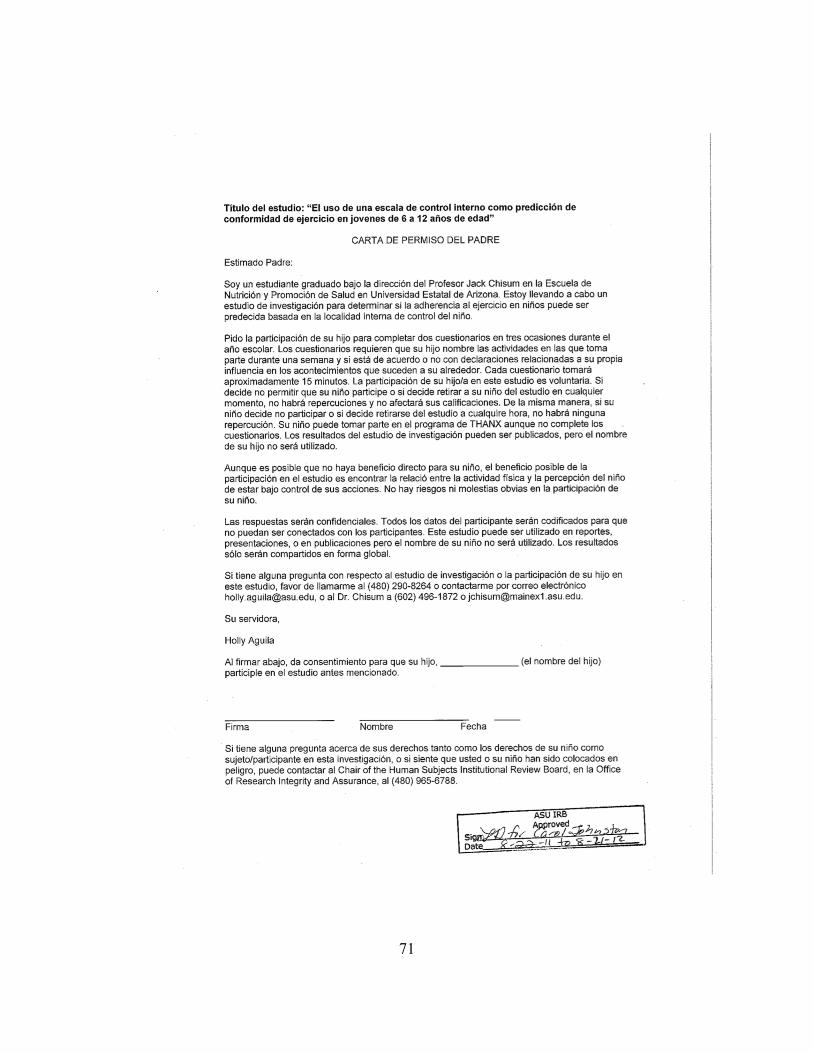
71

72
APPENDIX D
CHILD ASSENT FORM
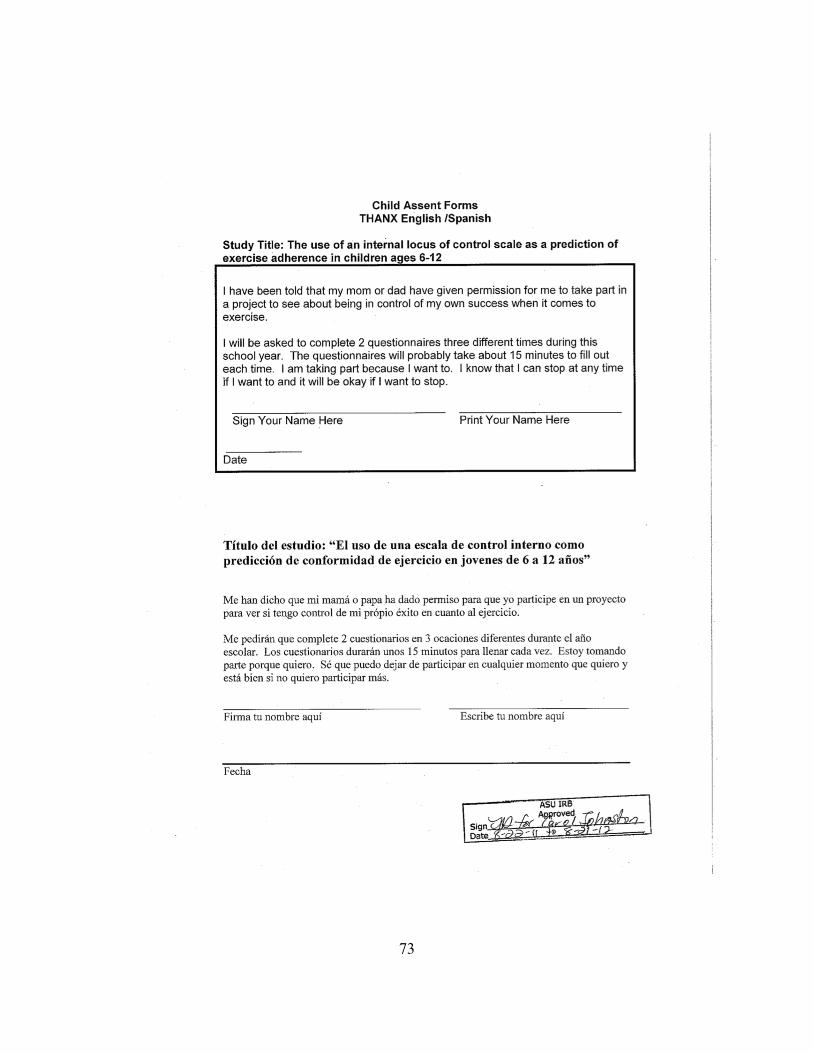
73

74
APPENDIX E
FLOW CHART
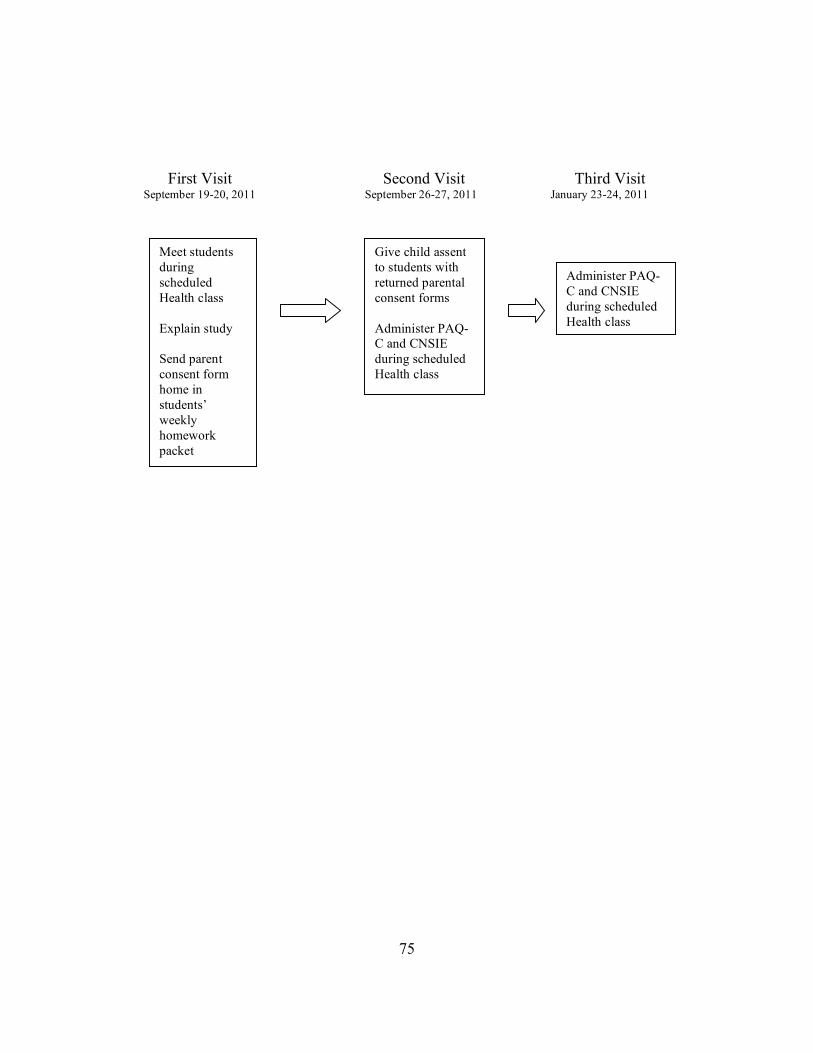
75
First Visit Second Visit Third Visit September 19-20, 2011 September 26-27, 2011 January 23-24, 2011
Give child assent to students with returned parental consent forms Administer PAQ-C and CNSIE during scheduled Health class
Meet students during scheduled Health class Explain study Send parent consent form home in students’ weekly homework packet
Administer PAQ-C and CNSIE during scheduled Health class

76
APPENDIX F
CNSIE – ENGLISH
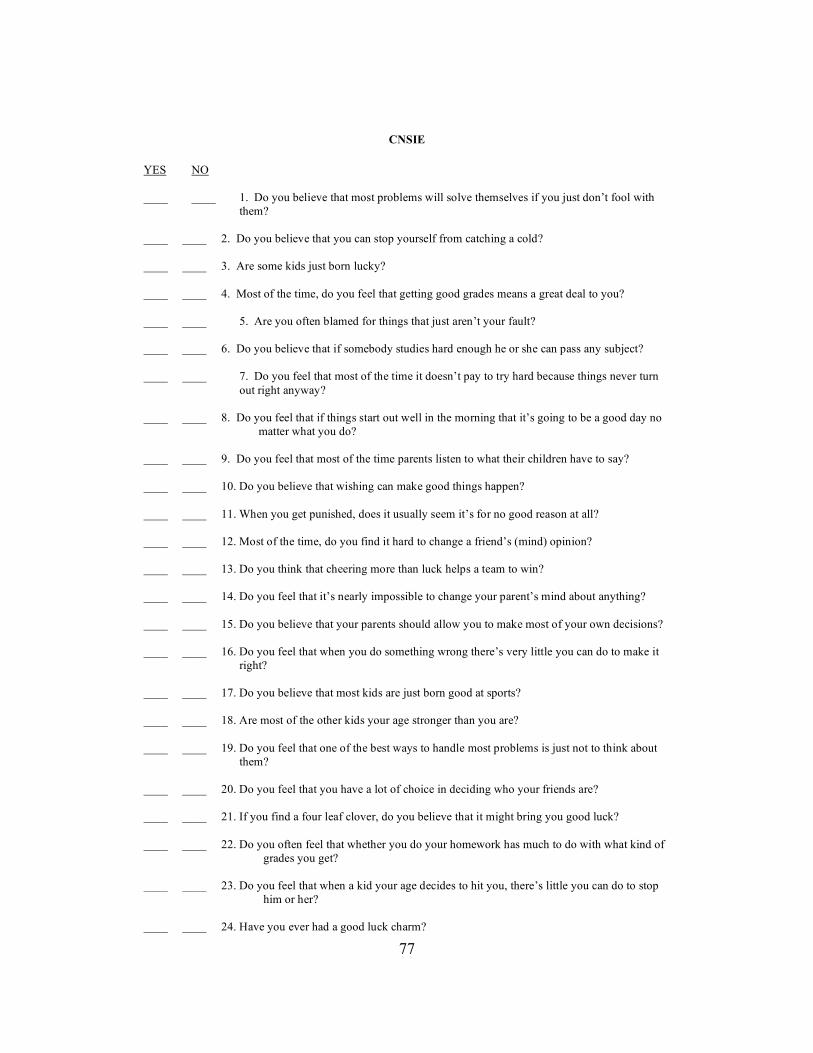
77
CNSIE
YES NO ____ ____ 1. Do you believe that most problems will solve themselves if you just don’t fool with them? ____ ____ 2. Do you believe that you can stop yourself from catching a cold? ____ ____ 3. Are some kids just born lucky? ____ ____ 4. Most of the time, do you feel that getting good grades means a great deal to you? ____ ____ 5. Are you often blamed for things that just aren’t your fault? ____ ____ 6. Do you believe that if somebody studies hard enough he or she can pass any subject? ____ ____ 7. Do you feel that most of the time it doesn’t pay to try hard because things never turn
out right anyway? ____ ____ 8. Do you feel that if things start out well in the morning that it’s going to be a good day no
matter what you do? ____ ____ 9. Do you feel that most of the time parents listen to what their children have to say? ____ ____ 10. Do you believe that wishing can make good things happen? ____ ____ 11. When you get punished, does it usually seem it’s for no good reason at all? ____ ____ 12. Most of the time, do you find it hard to change a friend’s (mind) opinion? ____ ____ 13. Do you think that cheering more than luck helps a team to win? ____ ____ 14. Do you feel that it’s nearly impossible to change your parent’s mind about anything? ____ ____ 15. Do you believe that your parents should allow you to make most of your own decisions? ____ ____ 16. Do you feel that when you do something wrong there’s very little you can do to make it right? ____ ____ 17. Do you believe that most kids are just born good at sports? ____ ____ 18. Are most of the other kids your age stronger than you are? ____ ____ 19. Do you feel that one of the best ways to handle most problems is just not to think about them? ____ ____ 20. Do you feel that you have a lot of choice in deciding who your friends are? ____ ____ 21. If you find a four leaf clover, do you believe that it might bring you good luck? ____ ____ 22. Do you often feel that whether you do your homework has much to do with what kind of
grades you get? ____ ____ 23. Do you feel that when a kid your age decides to hit you, there’s little you can do to stop
him or her? ____ ____ 24. Have you ever had a good luck charm?
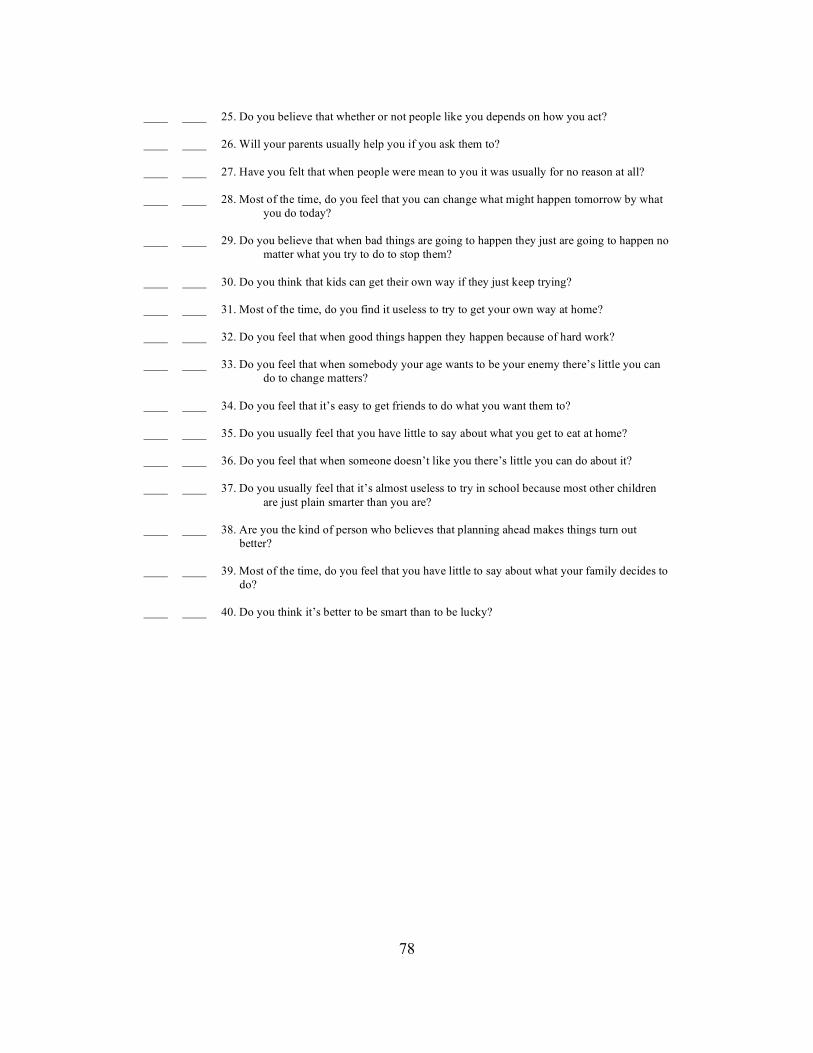
78
____ ____ 25. Do you believe that whether or not people like you depends on how you act? ____ ____ 26. Will your parents usually help you if you ask them to? ____ ____ 27. Have you felt that when people were mean to you it was usually for no reason at all? ____ ____ 28. Most of the time, do you feel that you can change what might happen tomorrow by what
you do today? ____ ____ 29. Do you believe that when bad things are going to happen they just are going to happen no
matter what you try to do to stop them? ____ ____ 30. Do you think that kids can get their own way if they just keep trying? ____ ____ 31. Most of the time, do you find it useless to try to get your own way at home? ____ ____ 32. Do you feel that when good things happen they happen because of hard work? ____ ____ 33. Do you feel that when somebody your age wants to be your enemy there’s little you can
do to change matters? ____ ____ 34. Do you feel that it’s easy to get friends to do what you want them to? ____ ____ 35. Do you usually feel that you have little to say about what you get to eat at home? ____ ____ 36. Do you feel that when someone doesn’t like you there’s little you can do about it? ____ ____ 37. Do you usually feel that it’s almost useless to try in school because most other children
are just plain smarter than you are? ____ ____ 38. Are you the kind of person who believes that planning ahead makes things turn out better? ____ ____ 39. Most of the time, do you feel that you have little to say about what your family decides to do? ____ ____ 40. Do you think it’s better to be smart than to be lucky?

79
APPENDIX G
CNSIE – SPANISH
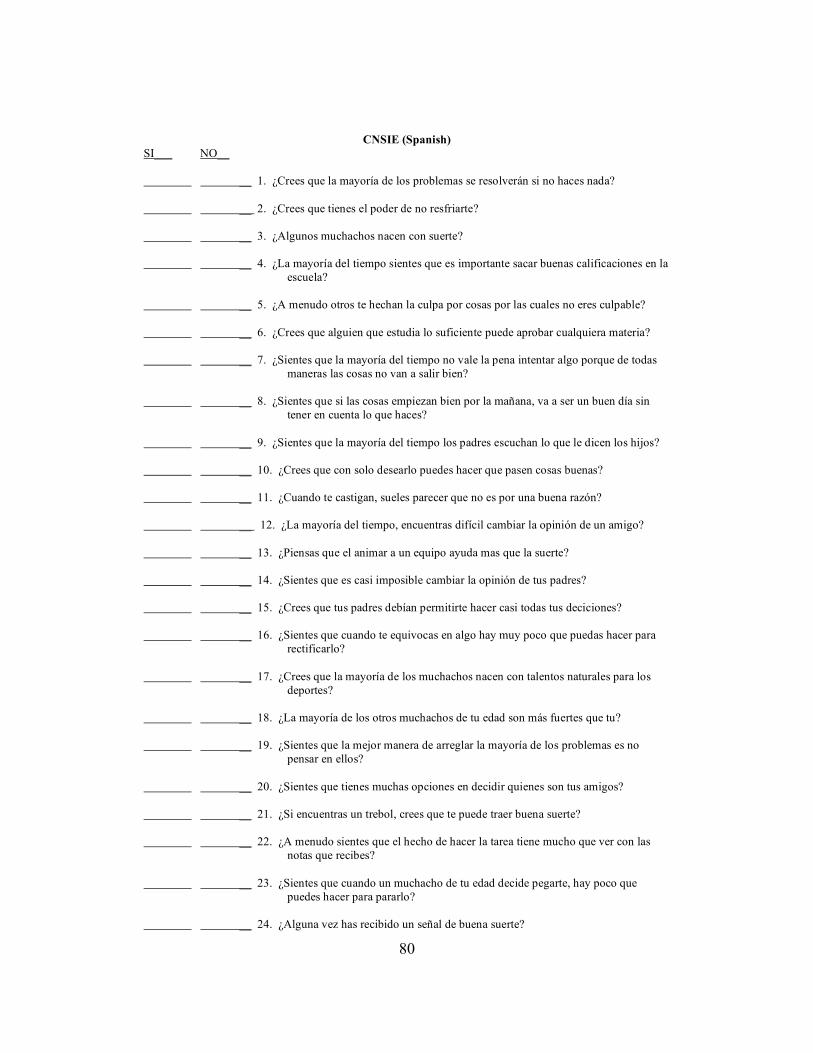
80
CNSIE (Spanish) SI___ NO__ __ 1. ¿Crees que la mayoría de los problemas se resolverán si no haces nada? __ 2. ¿Crees que tienes el poder de no resfriarte? __ 3. ¿Algunos muchachos nacen con suerte? __ 4. ¿La mayoría del tiempo sientes que es importante sacar buenas calificaciones en la escuela? __ 5. ¿A menudo otros te hechan la culpa por cosas por las cuales no eres culpable? __ 6. ¿Crees que alguien que estudia lo suficiente puede aprobar cualquiera materia? __ 7. ¿Sientes que la mayoría del tiempo no vale la pena intentar algo porque de todas maneras las cosas no van a salir bien? __ 8. ¿Sientes que si las cosas empiezan bien por la mañana, va a ser un buen día sin tener en cuenta lo que haces? __ 9. ¿Sientes que la mayoría del tiempo los padres escuchan lo que le dicen los hijos? __ 10. ¿Crees que con solo desearlo puedes hacer que pasen cosas buenas? __ 11. ¿Cuando te castigan, sueles parecer que no es por una buena razón? __ 12. ¿La mayoría del tiempo, encuentras difícil cambiar la opinión de un amigo? __ 13. ¿Piensas que el animar a un equipo ayuda mas que la suerte? __ 14. ¿Sientes que es casi imposible cambiar la opinión de tus padres? __ 15. ¿Crees que tus padres debían permitirte hacer casi todas tus deciciones? __ 16. ¿Sientes que cuando te equivocas en algo hay muy poco que puedas hacer para rectificarlo? __ 17. ¿Crees que la mayoría de los muchachos nacen con talentos naturales para los deportes? __ 18. ¿La mayoría de los otros muchachos de tu edad son más fuertes que tu? __ 19. ¿Sientes que la mejor manera de arreglar la mayoría de los problemas es no pensar en ellos? __ 20. ¿Sientes que tienes muchas opciones en decidir quienes son tus amigos? __ 21. ¿Si encuentras un trebol, crees que te puede traer buena suerte? __ 22. ¿A menudo sientes que el hecho de hacer la tarea tiene mucho que ver con las notas que recibes? __ 23. ¿Sientes que cuando un muchacho de tu edad decide pegarte, hay poco que puedes hacer para pararlo? __ 24. ¿Alguna vez has recibido un señal de buena suerte?
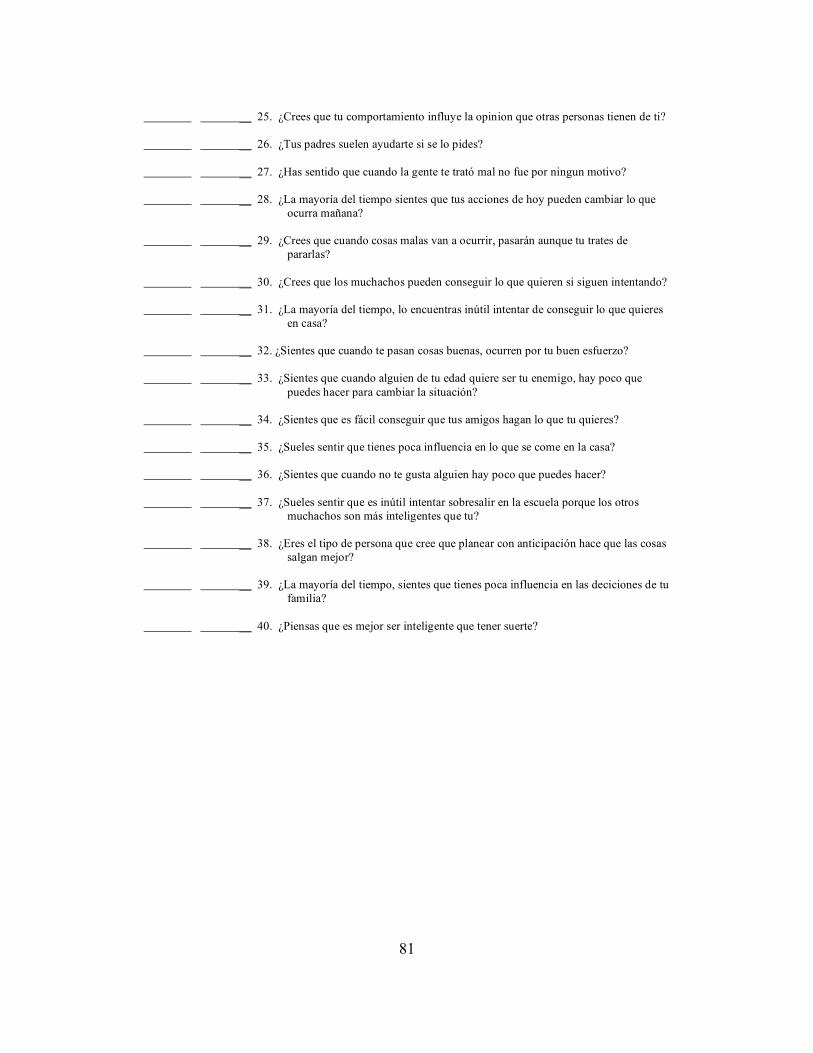
81
__ 25. ¿Crees que tu comportamiento influye la opinion que otras personas tienen de ti? __ 26. ¿Tus padres suelen ayudarte si se lo pides? __ 27. ¿Has sentido que cuando la gente te trató mal no fue por ningun motivo? __ 28. ¿La mayoría del tiempo sientes que tus acciones de hoy pueden cambiar lo que ocurra mañana? __ 29. ¿Crees que cuando cosas malas van a ocurrir, pasarán aunque tu trates de pararlas? __ 30. ¿Crees que los muchachos pueden conseguir lo que quieren si siguen intentando? __ 31. ¿La mayoría del tiempo, lo encuentras inútil intentar de conseguir lo que quieres en casa? __ 32. ¿Sientes que cuando te pasan cosas buenas, ocurren por tu buen esfuerzo? __ 33. ¿Sientes que cuando alguien de tu edad quiere ser tu enemigo, hay poco que puedes hacer para cambiar la situación? __ 34. ¿Sientes que es fácil conseguir que tus amigos hagan lo que tu quieres? __ 35. ¿Sueles sentir que tienes poca influencia en lo que se come en la casa? __ 36. ¿Sientes que cuando no te gusta alguien hay poco que puedes hacer? __ 37. ¿Sueles sentir que es inútil intentar sobresalir en la escuela porque los otros muchachos son más inteligentes que tu? __ 38. ¿Eres el tipo de persona que cree que planear con anticipación hace que las cosas salgan mejor? __ 39. ¿La mayoría del tiempo, sientes que tienes poca influencia en las deciciones de tu familia? __ 40. ¿Piensas que es mejor ser inteligente que tener suerte?

82
APPENDIX H
PAQ-C (ENGLISH)
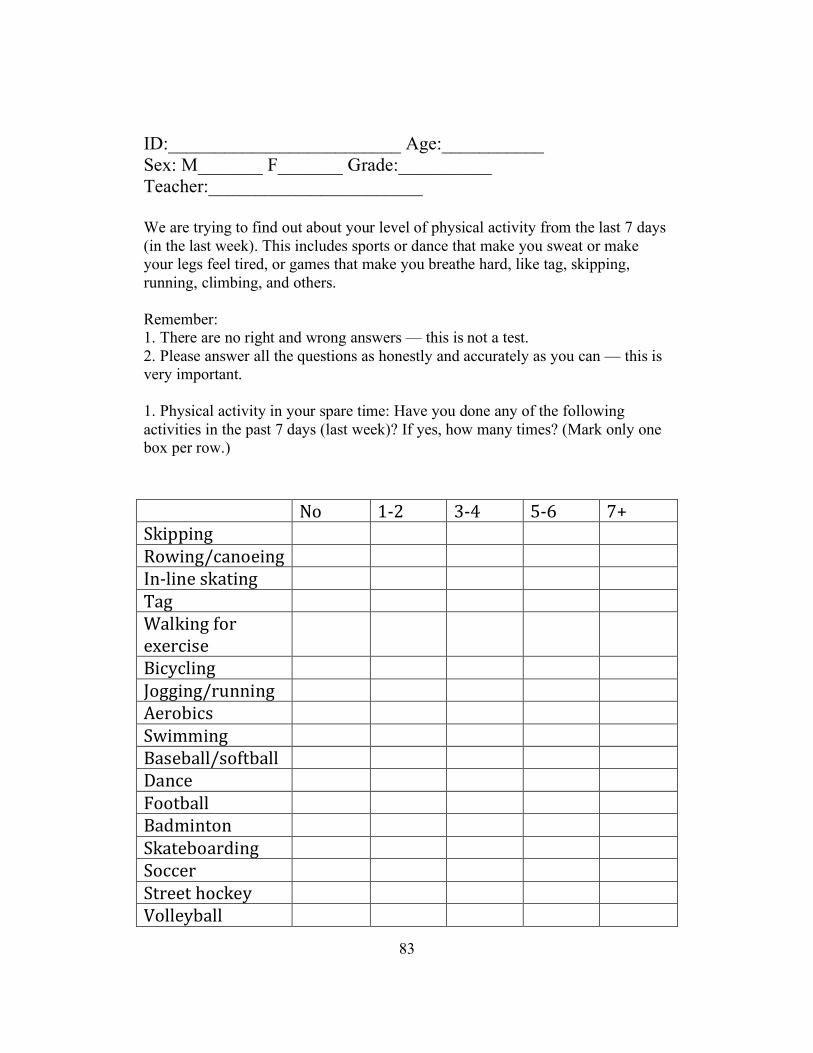
83
ID:_________________________ Age:___________ Sex: M_______ F_______ Grade:__________ Teacher:_______________________ We are trying to find out about your level of physical activity from the last 7 days (in the last week). This includes sports or dance that make you sweat or make your legs feel tired, or games that make you breathe hard, like tag, skipping, running, climbing, and others. Remember: 1. There are no right and wrong answers — this is not a test. 2. Please answer all the questions as honestly and accurately as you can — this is very important. 1. Physical activity in your spare time: Have you done any of the following activities in the past 7 days (last week)? If yes, how many times? (Mark only one box per row.)
! "#! $%&! '%(! )%*! +,!-./00/12! ! ! ! ! !3#4/125671#8/12! ! ! ! ! !91%:/18!;.7</12! ! ! ! ! !=72! ! ! ! ! !>7:./12!?#@!8A8@6/;8!
! ! ! ! !
B/6C6:/12! ! ! ! ! !D#22/125@E11/12! ! ! ! ! !F8@#G/6;! ! ! ! ! !-4/HH/12! ! ! ! ! !B7;8G7::5;#?<G7::! ! ! ! ! !I7168! ! ! ! ! !J##<G7::! ! ! ! ! !B7KH/1<#1! ! ! ! ! !-.7<8G#7@K/12! ! ! ! ! !-#668@! ! ! ! ! !-<@88<!L#6.8C! ! ! ! ! !M#::8CG7::! ! ! ! ! !
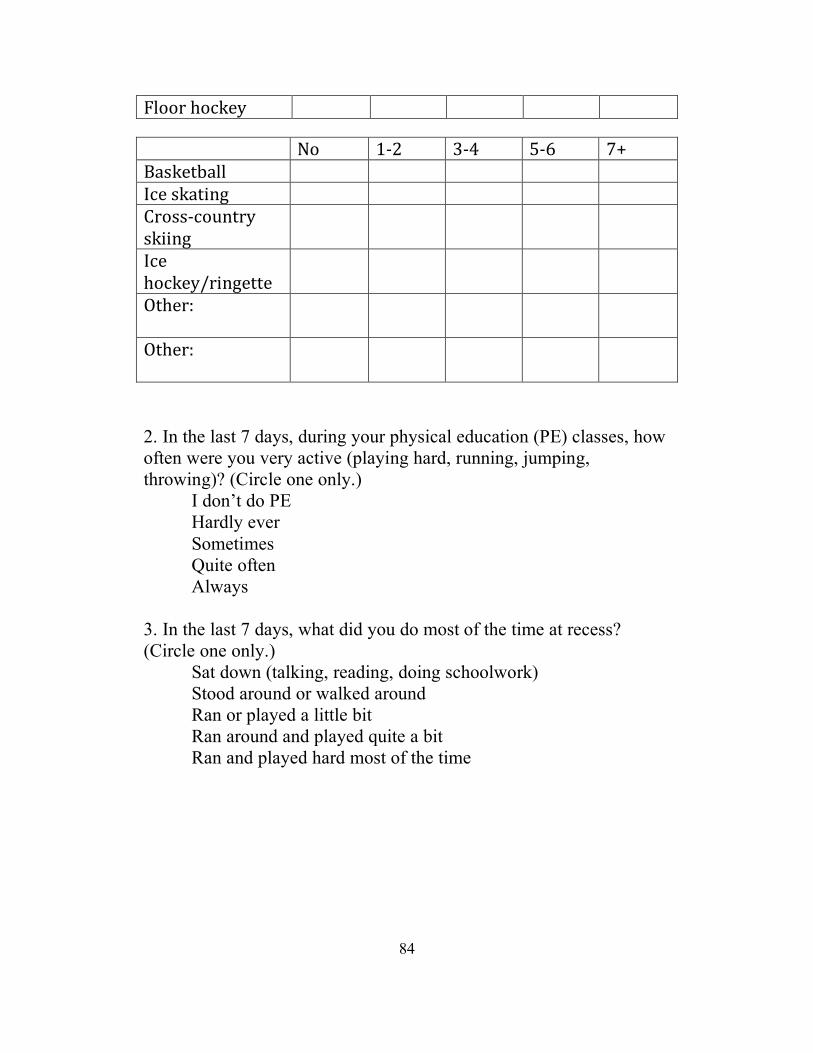
84
J:##@!L#6.8C! ! ! ! ! ! ! "#! $%&! '%(! )%*! +,!B7;.8<G7::! ! ! ! ! !968!;.7</12! ! ! ! ! !N@#;;%6#E1<@C!;.//12!
! ! ! ! !
968!L#6.8C5@/128<<8!
! ! ! ! !
O<L8@P!!
! ! ! ! !
O<L8@P!!
! ! ! ! !
2. In the last 7 days, during your physical education (PE) classes, how often were you very active (playing hard, running, jumping, throwing)? (Circle one only.) I don’t do PE Hardly ever Sometimes Quite often Always 3. In the last 7 days, what did you do most of the time at recess? (Circle one only.) Sat down (talking, reading, doing schoolwork) Stood around or walked around Ran or played a little bit Ran around and played quite a bit Ran and played hard most of the time
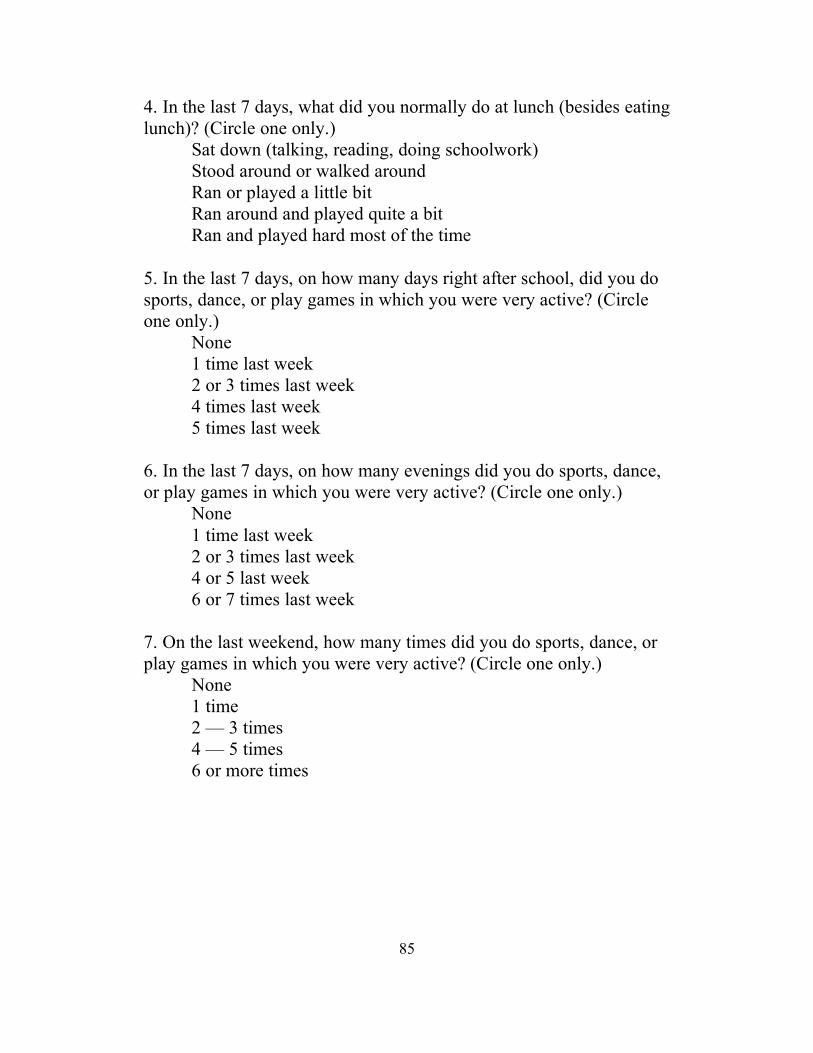
85
4. In the last 7 days, what did you normally do at lunch (besides eating lunch)? (Circle one only.) Sat down (talking, reading, doing schoolwork) Stood around or walked around Ran or played a little bit Ran around and played quite a bit Ran and played hard most of the time 5. In the last 7 days, on how many days right after school, did you do sports, dance, or play games in which you were very active? (Circle one only.) None 1 time last week 2 or 3 times last week 4 times last week 5 times last week 6. In the last 7 days, on how many evenings did you do sports, dance, or play games in which you were very active? (Circle one only.) None 1 time last week 2 or 3 times last week 4 or 5 last week 6 or 7 times last week 7. On the last weekend, how many times did you do sports, dance, or play games in which you were very active? (Circle one only.) None 1 time 2 — 3 times 4 — 5 times 6 or more times
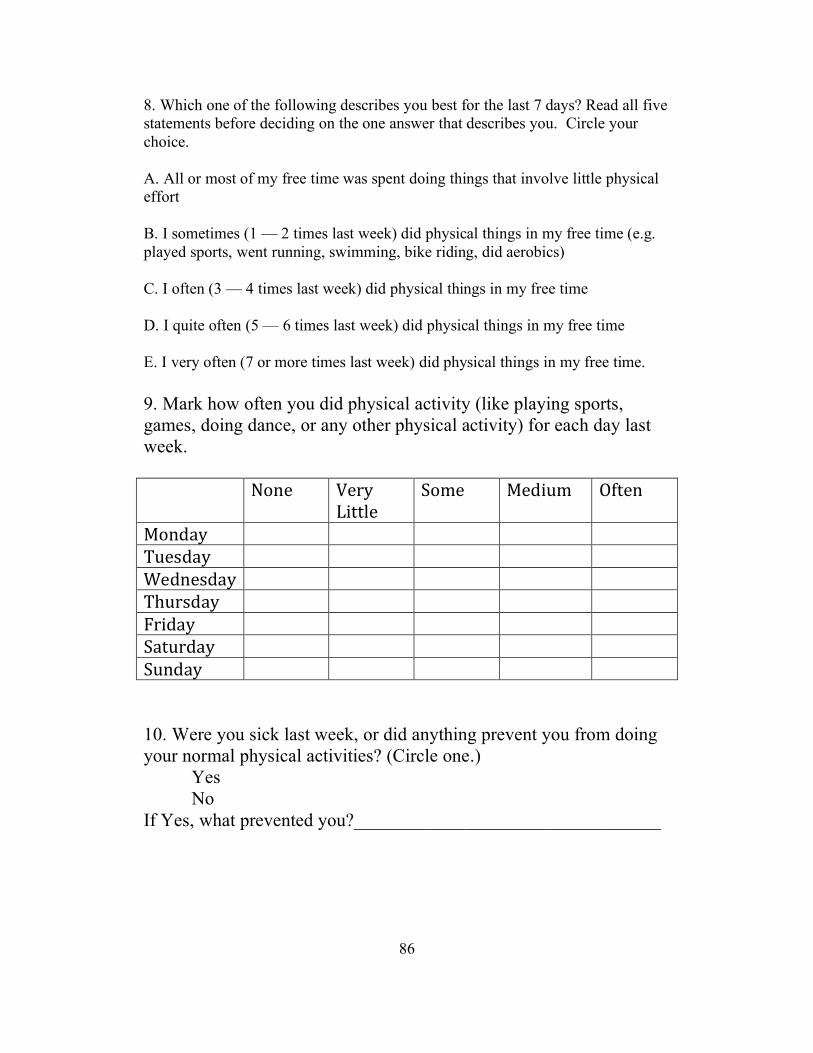
86
8. Which one of the following describes you best for the last 7 days? Read all five statements before deciding on the one answer that describes you. Circle your choice. A. All or most of my free time was spent doing things that involve little physical effort B. I sometimes (1 — 2 times last week) did physical things in my free time (e.g. played sports, went running, swimming, bike riding, did aerobics) C. I often (3 — 4 times last week) did physical things in my free time D. I quite often (5 — 6 times last week) did physical things in my free time E. I very often (7 or more times last week) did physical things in my free time. 9. Mark how often you did physical activity (like playing sports, games, doing dance, or any other physical activity) for each day last week. ! "#18! M8@C!
Q/<<:8!-#H8! R8K/EH! O?<81!
R#1K7C! ! ! ! ! !=E8;K7C! ! ! ! ! !>8K18;K7C! ! ! ! ! !=LE@;K7C! ! ! ! ! !J@/K7C! ! ! ! ! !-7<E@K7C! ! ! ! ! !-E1K7C! ! ! ! ! ! 10. Were you sick last week, or did anything prevent you from doing your normal physical activities? (Circle one.) Yes No If Yes, what prevented you?_________________________________

87
APPENDIX I
PAQ-C (SPANISH)
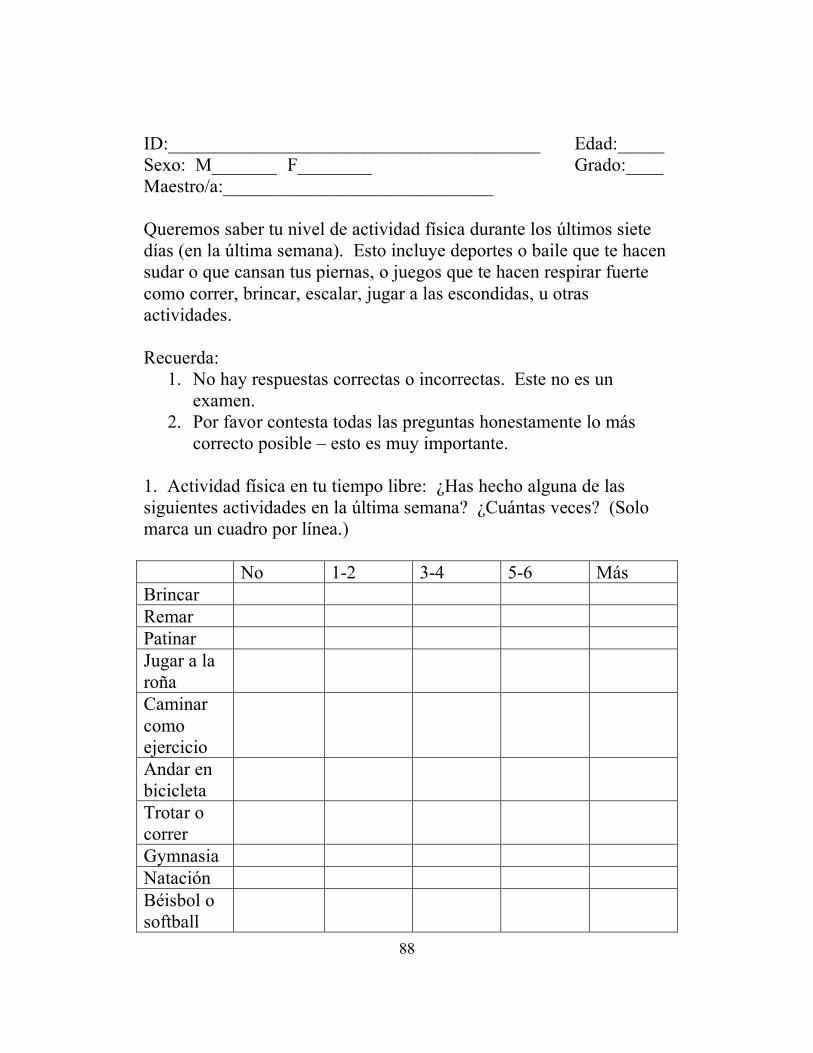
88
ID:________________________________________ Edad:_____ Sexo: M_______ F________ Grado:____ Maestro/a:_____________________________ Queremos saber tu nivel de actividad física durante los últimos siete días (en la última semana). Esto incluye deportes o baile que te hacen sudar o que cansan tus piernas, o juegos que te hacen respirar fuerte como correr, brincar, escalar, jugar a las escondidas, u otras actividades. Recuerda:
1. No hay respuestas correctas o incorrectas. Este no es un examen.
2. Por favor contesta todas las preguntas honestamente lo más correcto posible – esto es muy importante.
1. Actividad física en tu tiempo libre: ¿Has hecho alguna de las siguientes actividades en la última semana? ¿Cuántas veces? (Solo marca un cuadro por línea.) No 1-2 3-4 5-6 Más Brincar Remar Patinar Jugar a la roña
Caminar como ejercicio
Andar en bicicleta
Trotar o correr
Gymnasia Natación Béisbol o softball
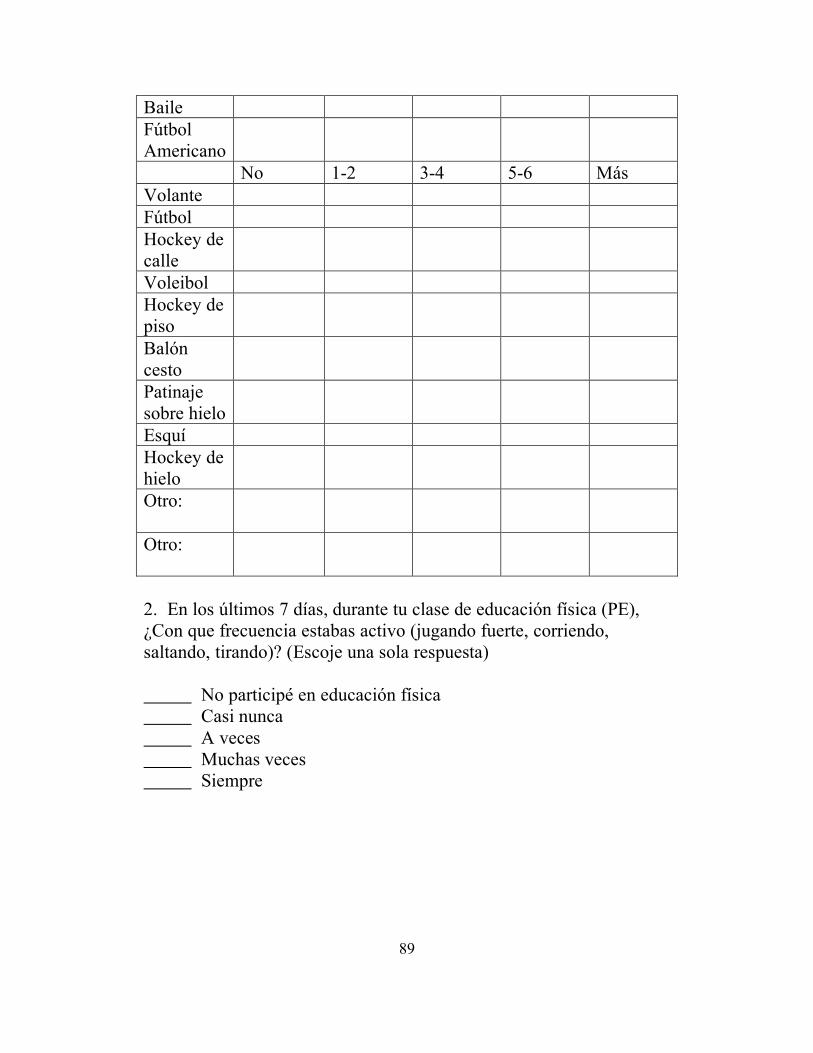
89
Baile Fútbol Americano
No 1-2 3-4 5-6 Más Volante Fútbol Hockey de calle
Voleibol Hockey de piso
Balón cesto
Patinaje sobre hielo
Esquí Hockey de hielo
Otro:
Otro:
2. En los últimos 7 días, durante tu clase de educación física (PE), ¿Con que frecuencia estabas activo (jugando fuerte, corriendo, saltando, tirando)? (Escoje una sola respuesta) No participé en educación física Casi nunca A veces Muchas veces Siempre
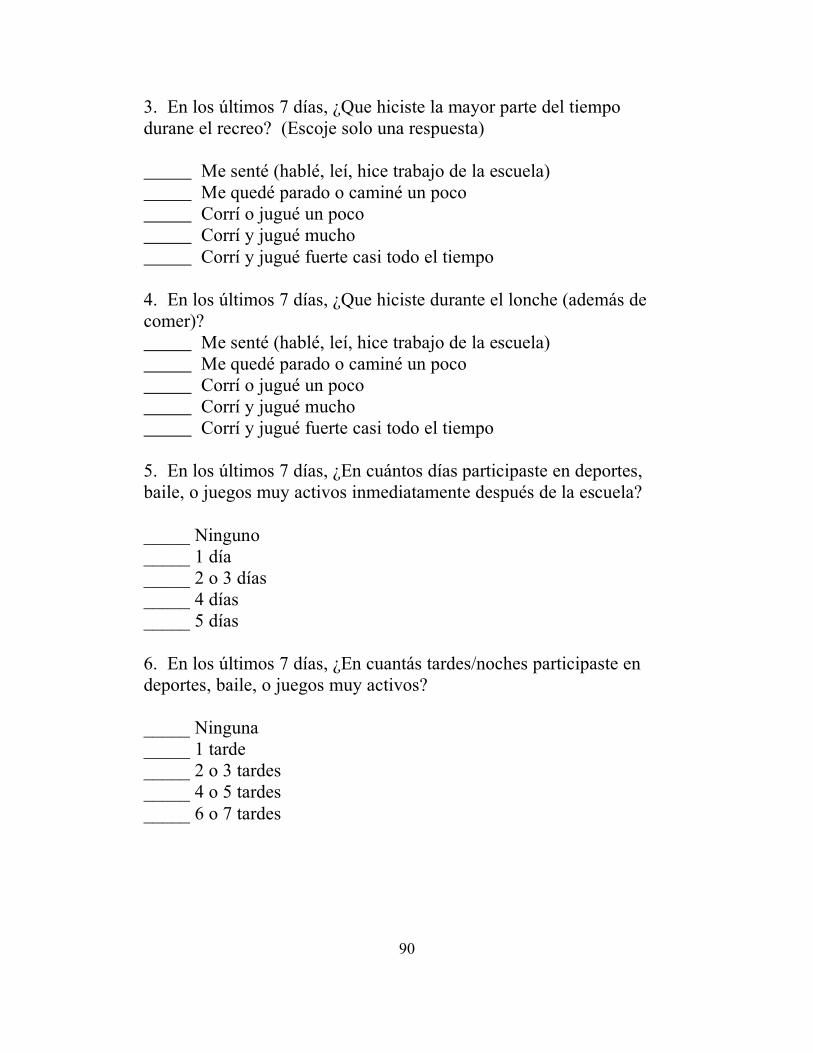
90
3. En los últimos 7 días, ¿Que hiciste la mayor parte del tiempo durane el recreo? (Escoje solo una respuesta) Me senté (hablé, leí, hice trabajo de la escuela) Me quedé parado o caminé un poco Corrí o jugué un poco Corrí y jugué mucho Corrí y jugué fuerte casi todo el tiempo 4. En los últimos 7 días, ¿Que hiciste durante el lonche (además de comer)? Me senté (hablé, leí, hice trabajo de la escuela) Me quedé parado o caminé un poco Corrí o jugué un poco Corrí y jugué mucho Corrí y jugué fuerte casi todo el tiempo 5. En los últimos 7 días, ¿En cuántos días participaste en deportes, baile, o juegos muy activos inmediatamente después de la escuela? _____ Ninguno _____ 1 día _____ 2 o 3 días _____ 4 días _____ 5 días 6. En los últimos 7 días, ¿En cuantás tardes/noches participaste en deportes, baile, o juegos muy activos? _____ Ninguna _____ 1 tarde _____ 2 o 3 tardes _____ 4 o 5 tardes _____ 6 o 7 tardes
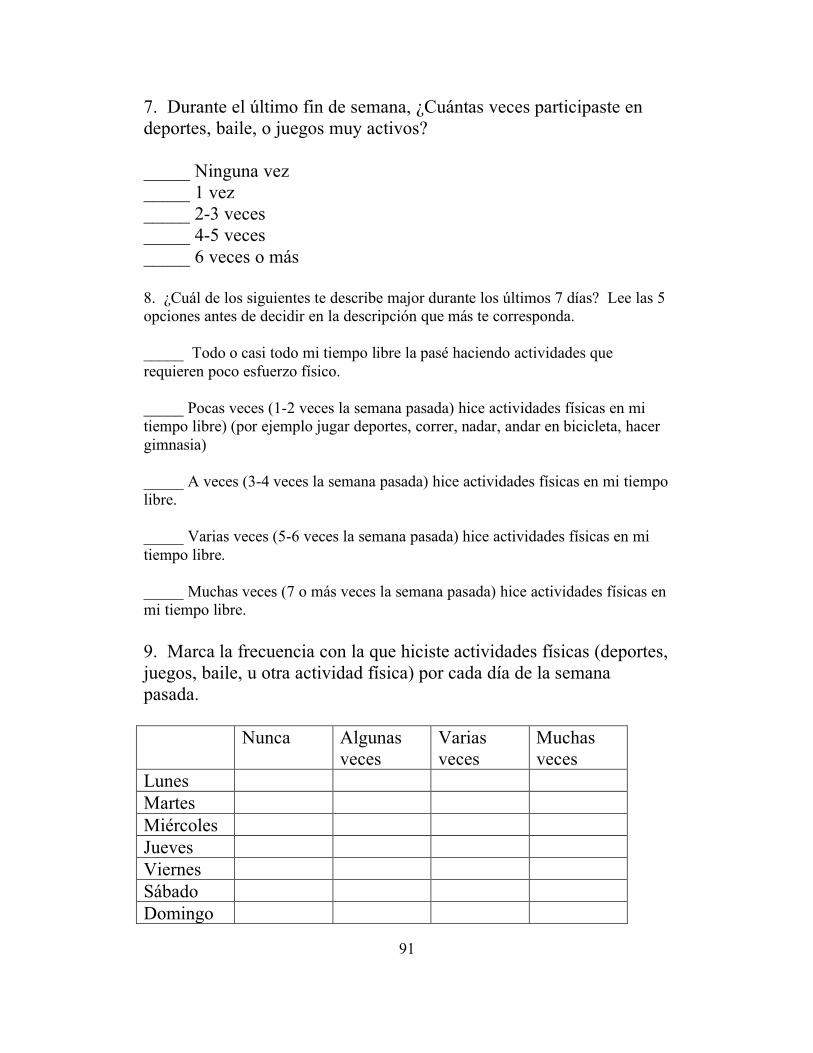
91
7. Durante el último fin de semana, ¿Cuántas veces participaste en deportes, baile, o juegos muy activos? _____ Ninguna vez _____ 1 vez _____ 2-3 veces _____ 4-5 veces _____ 6 veces o más 8. ¿Cuál de los siguientes te describe major durante los últimos 7 días? Lee las 5 opciones antes de decidir en la descripción que más te corresponda. _____ Todo o casi todo mi tiempo libre la pasé haciendo actividades que requieren poco esfuerzo físico. _____ Pocas veces (1-2 veces la semana pasada) hice actividades físicas en mi tiempo libre) (por ejemplo jugar deportes, correr, nadar, andar en bicicleta, hacer gimnasia) _____ A veces (3-4 veces la semana pasada) hice actividades físicas en mi tiempo libre. _____ Varias veces (5-6 veces la semana pasada) hice actividades físicas en mi tiempo libre. _____ Muchas veces (7 o más veces la semana pasada) hice actividades físicas en mi tiempo libre. 9. Marca la frecuencia con la que hiciste actividades físicas (deportes, juegos, baile, u otra actividad física) por cada día de la semana pasada. Nunca Algunas
veces Varias veces
Muchas veces
Lunes Martes Miércoles Jueves Viernes Sábado Domingo
92
10. ¿Estuviste enfermo la semana pasada, o hubo algo que te previno hacer tus actividades físicas normales? (marca uno) _____ Sí _____ No Si respondiste que “sí”, ¿Que te previno de participar en tus actividades físicas normales?___________________________