Embed Size (px)
Citation preview
Running head: THE USE OF A SMART TABLE TO INCREASE ON‐TASK BEHAVIOR
The Use of a SMART Table to Increase On-task Behavior
Taylor Warner
May 2, 2012
University of Mary Washington

Running head: THE USE OF A SMART TABLE TO INCREASE ON‐TASK BEHAVIOR 2
Abstract
This study explored the use of a SMART Table during math small groups to see its
effects on on-task behavior. Hussain (2006) and Preston and Mowbray (2008) found that
when technology is used in the classroom, teachers are better able to reach the needs of
their students because of technology’s ability to keep students engaged. I observed four
male students (two with off-task tendencies and two with on-task tendencies) for four
weeks without the SMART Table and four weeks with the SMART Table. Results
indicated that there were increases in on-task behaviors for all four students.

Running head: THE USE OF A SMART TABLE TO INCREASE ON‐TASK BEHAVIOR 3
Introduction
Does having the latest technology in the general education classroom benefit the
teachers and students? Previous research supports the importance of educational
technology and provides evidence that students are more engaged when interacting with
technology in the classroom (Ota &DuPaul, 2002; Preston & Mowbray, 2008; Smedley
& Higgins, 2005). The SMART Table is a multi-touch/-user interactive learning center
that allows students to work simultaneously on one surface (SmartTech). This new and
upcoming piece of technology is hands-on, interactive, and provides immediate feedback
for both the student and teacher. This study investigated the effects of using a SMART
Table during math instruction to increase on-task behavior of second grade students
identified with off-task behaviors.
Technology in the field of education has been rapidly growing in the last two
decades. The benefits to the teacher and student are abundant and growing every day
(Preston & Mowbray, 2008). Because off-task behavior is a common problem teachers
now face in their classroom dynamics, it is important they have tools and resources to
help eliminate this as much as possible. Students who are off-task do not only limit
themselves, but they distract their peers. Academic achievement is hindered when
inattention is present, causing students to not perform at their highest level (Ota &
DuPaul, 2002). This study found that a SMART Table was a reliable resource to keep
students engaged and on-task during math small groups.

Running head: THE USE OF A SMART TABLE TO INCREASE ON‐TASK BEHAVIOR 4
Literature Review
Technology in the field of education has been a popular area of research in the
past two decades (Ota & DuPaul, 2002; Preston & Mowbray, 2008; Smedley & Higgins,
2005). A wide range of benefits have been found to support the integration of educational
technology into the general education classroom. Because behavioral needs are a
common factor in today’s elementary classroom, it is important to see the effects
technology has on students’ behaviors. Technology allows teachers to reach a variety of
learning styles, which accommodates to the ever-changing differences found in the
classroom (Preston & Mowbray, 2008; Smedley & Higgins, 2005). Because technology
is interactive and promotes student engagement, this study investigated whether a new,
upcoming piece of technology called a SMART Table would increase on-task behaviors
in 2nd grade students with off-task tendencies.
Student Engagement
Previous research has shown the consequential effects of student engagement on
academic achievement. Bodovski and Farkas (2007) found that low student achievement
growth was correlated with low engagement during mathematics instruction over the first
four years of school (K-3). Bodovski and Farkas (2007) state that “the effect of
engagement was strongest among the lowest-performing group” (p. 115), showing that
although engagement affects all students, in all four grade levels, it has a particularly
stronger affect on lower students than higher students. Students who were initially low
performing students gained the most academic growth when engaged in their learning.
This also means that higher students were found to be engaged while being taught, which
Running head: THE USE OF A SMART TABLE TO INCREASE ON‐TASK BEHAVIOR 5
in turn provides evidence that their engagement produced learning (Bodovski & Farkas,
2007).
Technology in the classroom is a recent strategy to increase student engagement
while learning (Preston & Mowbray, 2008; Smedley & Higgins, 2005; Son, 2008).
Interactive Whiteboards (IWB) are large whiteboards that display an image from a
computer that work as a touch screen. Research on IWB’s show that when using these in
the classroom, students become more engaged with educational multimedia because they
are able to not only watch videos, save notes, and capture information, but they are able
to interact and work with the material presented on the board (Preston & Mowbray,
2008). Smedley & Higgins (2005) also found similar finding that explain how technology
is engaging in the special education classroom. These findings support the idea that
student engagement is essential to student learning, and technology is now a resource that
enhances student engagement in the classroom.
Ota and DuPaul (2002) studied task engagement and mathematics performance in
children with Attention-Deficit Hyperactivty Disorder (ADHD) to see what effect
computer instruction had on their learning. Students with ADHD are commonly off-task
or easily distracted. This research was based off previous research that found that high
levels of hyperactivity significantly impaired academic achievement and led to behavioral
difficulties. Ota and DuPaul (2002) found that with computer assisted instruction, student
engagement increased and off-task behaviors decreased with students with ADHD. This
is because computer assisted instruction helps focus student’s attention on a stimulus and
presents materials in smaller sections. It also provides immediate feedback on

Running head: THE USE OF A SMART TABLE TO INCREASE ON‐TASK BEHAVIOR 6
performance which creates an ideal environment for students who are commonly off-task
(Ota & DuPaul, 2002).
Technology
As mentioned before, the use of Interactive Whiteboards in today’s classroom is
changing the way material is taught and learned (Hussain, 2006; Preston & Mowbray,
2008). Hussain (2006) states, “the IWB is helping teachers to create a learning condition
that motivates and stretches learners imagination in their classrooms” (p 78). This allows
teachers to create personalized learning experiences for their class, and form their lessons
to best meet the needs of their students. IWB’s allow for more of a collaborative learning
environment, which increases student involvement and teamwork. Students are able to
access the internet, use visual mediums, view graphics, and physically interact with
electronic material, which thus makes learning engaging and fun (Hussain, 2006; Preston
& Mowbray, 2008). By bringing new technology into the classroom, teachers are able to
better reach their student’s needs, while keeping them engaged at the same time.
Other benefits of educational technology include the idea of reaching various
learning styles and increases students ability to solve problems (Durmus & Karakirik,
2006; Preston & Mowbray, 2008; Smedley & Higgins, 2005). Because in the past,
whiteboard had only one use, they reached a limited amount of users. Interactive
technology today is able to reach all types of learners due to its wide range of abilities.
Because students are now able to share information both auditory and visually, while
physically engaging with the technology, there is a greater chance for students individual
needs to be met. Now visual-spatial, auditory, and kinesthetic learners can benefit from
Running head: THE USE OF A SMART TABLE TO INCREASE ON‐TASK BEHAVIOR 7
the same resource at the same time, making learning more enjoyable and teaching more
efficient (Preston & Mowbray, 2008).
Durmus & Karakirik (2006) also found another benefit of technology in the
classroom, by finding benefits for using virtual manipulatives over physical
manipulatives. Their findings supported that idea that virtual manipulatives eliminate
constraints and provide immediate feedback to the students and teachers. Virtual
manipulatives provide physical engagement and pose problems for students to solve.
They help familiarize students with mathematical concepts and representations, thus
“help them to appreciate the meaning applications of mathematics to solve real-world
problems”. The benefits of technology in the classroom, from Interactive Whiteboards to
virtual manipulatives, are ever growing and the positive impact on student learning is
evident.
SMART Tables
Hussian (2006) explained that one weakness of Interactive Whiteboards is that it
lacks simultaneous activity of students because only one student can use it at a time.
SMART Tables solve this problem because they are multi-touch/-user interactive
learning centers that allows students to work simultaneously on one surface (SMART
Technologies). Recent research on SMART Table use found that it was beneficial in
engaging students in collaborative problem solving. Pre-K students were able to use
verbal and non-verbal communication to problem solve together using the SMART Table
(Evans, Wilkins, Motto, Brunger, & Crider).
Conclusion

Running head: THE USE OF A SMART TABLE TO INCREASE ON‐TASK BEHAVIOR 8
Research has shown the benefits of educational technology are that it is interactive,
engaging, and provides immediate feedback (Hussain, 2006; Preston & Mowbray, 2008;
Smedley & Higgins, 2005). It is these qualities that have been proven to keep students
more on-task and focused during school (Ota & DuPaul, 2002). Technology has such
positive impacts on today’s classroom, and off-task behavior is a common factor in
students behavioral issues. The purpose of this study was to compare students with off-
task tendencies and students with on-task tendencies using a behavioral observation test
to see if the use of a SMART Table during math small groups increased on-task behavior.
Methodology
Participants
Four second grade male students who attended Courthouse Road Elementary
School were observed in this study. Two of these students had off-task tendencies and
two had on-task tendencies. Students with on-task tendencies were used in this study to
provide evidence that the students with off-task tendencies did indeed have these
tendencies and also to see if the SMART Table had any effect on their behavior. One of
the off-task students was African American, while the other three were white. To protect
the privacy of the students, the two students with off-task tendencies were labeled and
referred to as Student A and Student B, while the two students with on-task tendencies
were labeled and referred to as Peer A and Peer B. All students were treated according to
the APA ethical guidelines and the IRB requirements were met.

Running head: THE USE OF A SMART TABLE TO INCREASE ON‐TASK BEHAVIOR 9
Materials
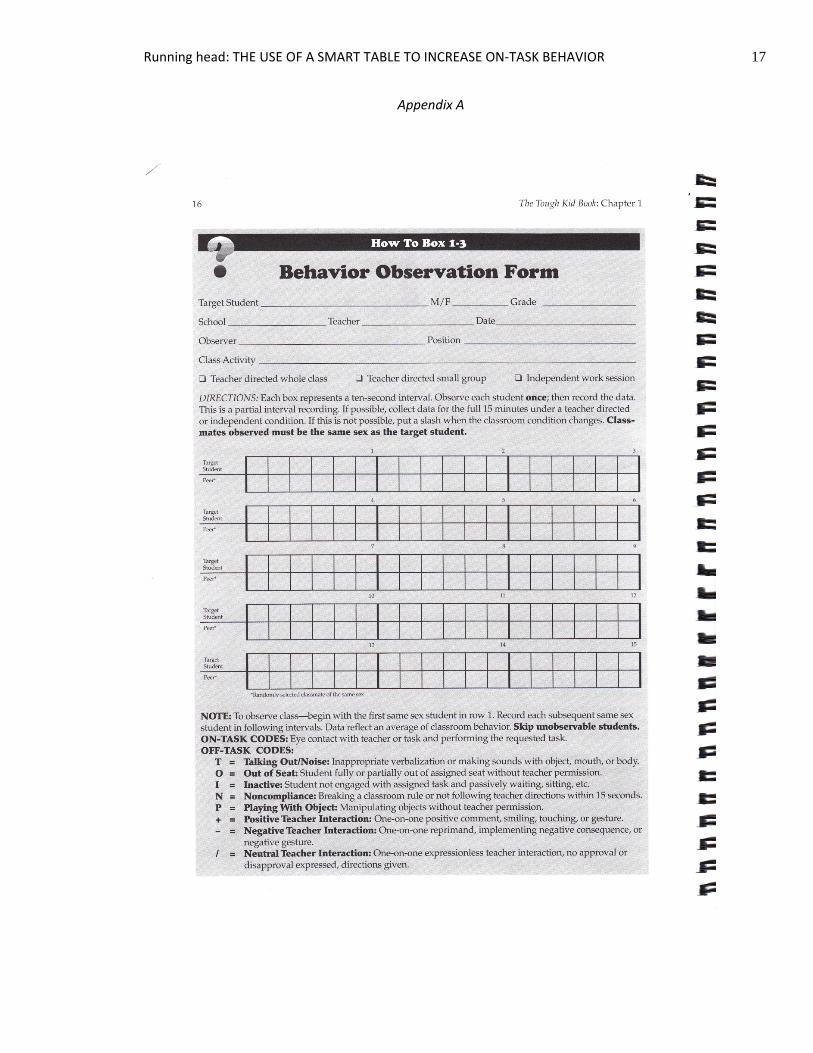
These students were observed using a video camera and dock during mathematics.
A behavioral discrepancy observation form was used to record the on-task and off-task
behaviors of each student. The students with off-task tendencies were recorded as the
“target student” and compared to their corresponding “peer” with on-task tendencies.
The observation form listed specific off-task behaviors that were recorded. Included
were: Talking Out/Noise, Out of Seat, Inactive, Noncompliance, Playing with Object, and
Negative Teacher Interaction.
Design
The independent variables of this study are the implementation of the Smart Table
in math small groups and the behaviors of the students (on-task or off-task). The four
students were observed four times in math small groups without the Smart Table and four
times in math small groups with the Smart Table. The recordings took place once a week
for each pair of students for four weeks. The first four week session was without the
Smart Table and the last four week session was with the Smart Table, therefore each
condition had four observations. Each video recording (observation) session was 15
minutes long. After the school day, I watched the video recording four times, observing
and recording data for each student.
Procedure
During the first four week session, the video camera and dock was set up in the
corner of the room, facing a math station. I recorded both Student A and Peer A’s group,
and Student B and Peer B’s group. Each station lasted between 15 and 20 minutes. After

Running head: THE USE OF A SMART TABLE TO INCREASE ON‐TASK BEHAVIOR 10
the school day, I watched the video and recorded whether or not each student was on-task
or off-task every 10 seconds, for 15 minutes. Only one behavior was recorded for each 10
second interval. If the student was off-task, I specified which type of off-task behavior
they exhibited using the off-task codes on the observation form. To be considered on-
task the student must have had eye contact with the teacher or task and performing the
requested task.
For the second four week session, the Smart Table was brought into the classroom
and replaced the previous math station that was recorded during the first four weeks. The
students were already familiarized with the Smart Table, so they understood the rules and
expectations of using it. This also eliminated the “honey moon phase” of having a new
piece of technology in the classroom. Again, I video-taped both groups (A and B’s) and
recorded their data every 10 seconds for 15 minutes.
Actual on-task percentages were calculated for all four students. Data from the
first and second sessions were compared to see if the implementation of the Smart Table
increased on-task behaviors in Student A and Student B.
Results
A T-Test was run to examine if the use of a SMART Table increased on-task
behavior in four second grade male students. It was found that the percentage of on-task
behavior increased significantly for both students with off-task tendencies and for one of
the students with on-task tendencies

Running head: THE USE OF A SMART TABLE TO INCREASE ON‐TASK BEHAVIOR 11
The use of a SMART Table had a significant effect on Student A’s on-task
behavior. His mean jumped from being on-task 66.25% of the time without the SMART
Table to 96.00% on-task with the SMART Table (p = .0096) The use of a SMART Table
did not have a significant effect on Peer A, although there was an increase in on-task
behavior once the SMART Table a was utilized. Peer A’s on-task behavior mean without
the SMART Table was 82.25% and with the SMART Table was 85.50% (p = .5845).
The use of a SMART Table also had a significant effect on Student B’s (off-task
tendencies) on-task behavior. His mean percentage of on-task behaviors without the
SMART Table was 53.00% and with the SMART Table jumped to 85.25% (p = .0061).
The use of a SMART Table also had a significant effect on Peer B (on-task tendencies)
because his mean without the SMART Table was 89.75% and with the SMART Table
was 96.50%, near perfect ( p = .0011). The average range without the use of the SMART
Table was 53.00- 89.00 and the average range with the use of the SMART Table was
85.25- 96.50, therefore showing there was an increase in on-task behaviors when the
SMART Table was introduced.
Overall, the use of a SMART Table significantly increased on-task behavior in
second grade males with off-task tendencies. It also increased on-task behavior in second
grade males with on-task tendencies, with significant increases for one of the boys.
Student’s with off-task tendencies saw an average of 31% increase in on-task behaviors
and student’s with on-task tendencies saw a 5% increase in on-task behavior after the
SMART Table was introduced.

Running head: THE USE OF A SMART TABLE TO INCREASE ON‐TASK BEHAVIOR 12
Discussion
As seen from the results, the use of a SMART Table did increase on-task
behaviors in all four students, with three of them having significant increases. This is
interesting because not only did I find that using a SMART Table during math small
groups increases on-task behavior in students who tend to be off-task during this time,
but it also increased on-task behaviors in students who already were on-task majority of
the time. Students with on-task tendencies (Peer A and B) were used in this study to show
the severity of off-task behaviors in Student A and Student B. Peer A and Peer B
obviously did not have as much room for growth as the students with off-task tendencies
did, but they still saw improvement. Therefore I can conclude that using a SMART Table
during math helped all four students stay more on –task and engaged with their work.
Although all students saw an increase in on-task behavior, Peer A only had a 3%
increase. I believe this was not as large or significant as the other students because he
tends to be shy and while observing I noticed him step back from the table and watch the
other five students engage in the activity. This also could have been because I had six
students on the SMART Table at once, and even though the table allows for up to eight
players, the students seemed crowded with six.
All the students in the class, including the four boys observed, seemed to really
enjoy having a SMART Table in class. Students were constantly hoping it was their turn
on the SMART Table and asked quite frequently to use it in different subjects. I noticed
that they enjoyed working together and because there are multiple programs on the
SMART Table, the students were engaged because they were quickly moving from one
Running head: THE USE OF A SMART TABLE TO INCREASE ON‐TASK BEHAVIOR 13
program to the next. Boredom was never a factor when observing the students. Any
issues always came from students being too engaged and leaving others out.
One limitation to my study was that Student A was diagnosed with Attention
Deficit Hyperactivity Disorder during my observations without the SMART Table. He
was then put on medicine the weekend before I introduced the SMART Table for two
weeks, therefore the significant difference found in his behavior may have been due to
the medicine, not the SMART Table. However, I did find that Student A really thrived in
the small group environment and loved using the SMART Table. He took on a leader
position and sometimes found himself taking more turns on the SMART Table then he
should. Although he was put on medicine for two weeks, the last two weeks he was not
on medicine and his scores indicate that he was actually more on-task for the two weeks
without the medicine than with the medicine.
Another limitation for this study is that this study only followed four second grade
male students so this data cannot be applied to a larger population such as females or
another grade level. I would hope these findings would be true across grade levels and
genders but because of my small, specific sample I cannot generalize it over a larger
group of people.
Because of that limitation, in future research I would like to expand my study by
examining the effects of a SMART Table over both males and females and see if there is
a difference among different grade levels. I would also like to use groups of four
students at the SMART Table rather than six so I can better guarantee student

Running head: THE USE OF A SMART TABLE TO INCREASE ON‐TASK BEHAVIOR 14
involvement. Having a larger sample would help me generalize my data outside of my
student teaching classroom and hopefully be beneficial to teachers around the world.

Running head: THE USE OF A SMART TABLE TO INCREASE ON‐TASK BEHAVIOR 15
References
Bodovski, K. & Farkas, G. (2007). Mathematics growth in early elementary school: The
roles of beginning knowledge, student engagement, and instruction. The
Elementary School Journal, 108(2), 115-130.
Durmus, S. & Karakirk, E. (2006). Virtual manipulatives in mathematics education: A
theoretical framework. The Turkish Online Journal of Educational Technology,
5(1).
Evans, M.A., Wilkins, J.L.M., Motto, A., Brunger, A., & Crider, J. (2011). Group
meaning in mathematical discourse: A multimodal analysis of PreK students
using multi-touch virtual manipulatives. In Spada, H., Stahl, G., Miyake, N., Law,
N. (Eds.), Connecting Computer-Supported Collaborative Learning to Policy and
Practice: CSCL2011 Conference Proceedings. Volume II — Short Papers &
Posters (pp.806-810). International Society of the Learning Sciences.
Hussain, R.M. (2006). Deployment of Ict: A case for the interactive whiteboard.
Malaysian Online Journal of Instructional Technology, 3(1), 78-84.
Ota, K. & DuPaul, G. (2002). Task engagement and mathematics performance in children
with attention-deficit hyperactivity disorder: Effects of supplemental computer
instruction. School Psychology Quarterly, 17(3), 242-257.
Preston, C. & Mowbray, L. (2008). Use of SMART Boards for teaching, learning, and
assessment in kindergarten science. Teaching Science, 54(2), 50-53.
SMART Technologies (2011). Retrieved from http://www.smarttech.com/table

Running head: THE USE OF A SMART TABLE TO INCREASE ON‐TASK BEHAVIOR 16
Smedley, T.M. & Higgins, K. (2005). Virtual technology: Bringing the world into the
special education classroom. Intervention in School and Clinic, 41(2), 114-119.
Son, J.D. (2008) Is educational technology shortening student attention spans? Learning
and Leading with Technology, 8-9.
Running head: THE USE OF A SMART TABLE TO INCREASE ON‐TASK BEHAVIOR 17
Appendix A

Running head: THE USE OF A SMART TABLE TO INCREASE ON‐TASK BEHAVIOR 18
Table 1
On-Task Percentages With and Without the SMART Table
Without Smart Table With Smart Table
Student A 66.25 96
Peer A 82.25 85.5
Student B 53 85.25
Peer B 89.75 96.5

Running head: THE USE OF A SMART TABLE TO INCREASE ON‐TASK BEHAVIOR 19
Figure 1: This graph shows the increases in on-task behavior for Student A and peer A once the SMART Table was introduced. Student A had a 29.75% significant increase and Peer A had a 3.25% increase.

Running head: THE USE OF A SMART TABLE TO INCREASE ON‐TASK BEHAVIOR 20
Figure 2: This graph shows the increase in on-task behavior for Student B and Peer B once the SMART Table was introduced. Student B had a 32.25% significant increase in on-task behavior and Peer B had a 6.75% significant increase.