Embed Size (px)
Citation preview

USING RADON-222 AS A TRACER OF MIXING BETWEEN SURFACE AND
GROUND WATER IN THE SANTA FE RIVER SINK/RISE SYSTEM
By
LAUREN A. SMITH
A THESIS PRESENTED TO THE GRADUATE SCHOOL OF THE UNIVERSITY OF FLORIDA IN PARTIAL FULFILLMENT
OF THE REQUIREMENTS FOR THE DEGREE OF MASTER OF SCIENCE
UNIVERSITY OF FLORIDA
2004

Copyright 2004
by
Lauren A. Smith

iii
ACKNOWLEDGMENTS
I wish to express my appreciation to my advisor, Dr. Jonathan Martin, for his
constant patience and enthusiasm. I wish to express my gratitude to my committee
members, Dr. Elizabeth Screaton and Dr. Philip Neuhoff, both of whom are wonderful
mentors and friends. I wish to thank all of the employees at O’Leno State Park for their
cooperation. A special thanks goes to Dr. Jaye Cable, for her assistance; to Dr. Jason
Curtis, for his support and never-ending supply of liquid nitrogen; and to Kevin Hartl, for
construction of a beautiful radon-extraction line. My thanks go to those who supported
me through their friendship and love, especially my family. Last but certainly not least, I
would like to give the greatest thanks to Brooke Sprouse and Jennifer Martin: without
their support, patience, and laughter in the field, the ticks and snakes would have gotten
to me.

iv
TABLE OF CONTENTS page ACKNOWLEDGMENTS.................................................................................................. iii
LIST OF TABLES ............................................................................................................. vi
LIST OF FIGURES...........................................................................................................vii
ABSTRACT....................................................................................................................... ix
CHAPTER 1 INTRODUCTION ....................................................................................................... 1
Study Area.................................................................................................................... 4 Location and Climate............................................................................................ 4 Physiography ........................................................................................................ 6 Geology and Hydrostratigraphy............................................................................ 6
Background 222Rn Studies............................................................................................ 8 Background O’Leno Studies........................................................................................ 9
2 METHODS ................................................................................................................ 14
Field Methods ............................................................................................................ 14 Sample Bottle Construction ................................................................................ 14 Water Sampling .................................................................................................. 15 Ground Water Sampling ..................................................................................... 17
Lab Methods .............................................................................................................. 18 Absorbance................................................................................................................. 21
3 RESULTS .................................................................................................................. 22
Precipitation and River Stage..................................................................................... 22 Depth Profiles ............................................................................................................ 22 Excess 222Rn, Precipitation, and River Stage............................................................. 28
Sample Periods I to VI........................................................................................ 28 Well Samples ...................................................................................................... 30
Mixing Model ............................................................................................................ 31 Decay Equation .......................................................................................................... 32
Sink vs. Rise ....................................................................................................... 32 Sink vs. Karst Windows...................................................................................... 34
v
Gas Exchange Equation ............................................................................................. 36 Color Absorbance vs. Activity................................................................................... 36
4 DISCUSSION ............................................................................................................ 40
Precipitation and River Stage..................................................................................... 40 Depth Profiles ............................................................................................................ 40 Excess 222Rn............................................................................................................... 41 Radioactive Decay Along the Flow Path ................................................................... 46 Distribution of 222Rn in the Groundwater .................................................................. 48
5 CONCLUSIONS........................................................................................................ 51
APPENDIX MEASURED AND CALCULATED 222RN, TOTAL 226RA, TRAVEL TIME, AND EVASION FOR ALL SITES ............................................................... 53
REFERENCES.................................................................................................................. 59
BIOGRAPHICAL SKETCH ............................................................................................ 63

vi
LIST OF TABLES
Table page 1-1 Geologic and hydrogeologic units found in the Santa Fe River Basin.................... 10
2-1 Dates, river stages, and sample sites of each sample event ..................................... 16
2-2 Drilling records of six wells drilled during 2003. ................................................... 17
2-3 Average percent efficiency and standard deviation for each Lucas cell. ................ 21
3-1 Average, standard deviation, and coefficient of variation for each sample time .... 30
3-2 Relationship between measured 222Rn-activity and travel time and calculated 222Rn-activity and travel time using the decay equation.......................................... 34

vii
LIST OF FIGURES
Figure page 1-1 Map of the Santa Fe River basin, shown in shaded area ........................................... 5
1-2 Site map of the Santa Fe River Sink/Rise system in O’Leno State Park................... 7
2-1 Schematic of the sample bottles used for collection of water for 222Rn analysis .... 15
2-2 A simplified schematic of the Radon Extraction Line ............................................ 19
2-3 A simplified schematic of the radon counting system modified from Operations Manual 1012899A ................................................................................................... 20
3-1 The precipitation record for O'Leno State Park from June 2001 to July 2003, which encompasses the entire study period............................................................. 24
3-2 The Santa Fe River Stage recorded from O’Leno State Park from mid April 2001 till the end of June 2003 ................................................................................. 25
3-3 Vertial depth profiles at the River Rise ................................................................... 26
3-4 Vertical depth profiles at Vinzants Landing............................................................ 27
3-5 Radon-222 activities of samples from karst windows, the River Sink, and the River Rise versus distance along the flow path for sample dates of A. 5/8/02 and 9/12/02, B. 1/30/03, and C. 2/19/03, 2/26/03, and 3/5/03 ...................................... 29
3-6 Radon-222 activities of wells 1, 2, 3, 4, 6, and 7 .................................................... 31
3-7 Percent X (%X) versus Stage (m) for each site in the study area............................ 32
3-8 The gain or loss in activity downstream from the River Sink ................................. 35
3-9 Radon-222 activities of the River Sink at various sample periods vs. Absorbance .............................................................................................................. 38
3-10 Radon-222 activities of samples taken at Sweetwater Lake, Jim Sink, Ogden Pond, the River Sink, and Hawg Sink on 3/5/03 ..................................................... 38
3-11 Absorbance values taken during the study .............................................................. 39

viii
4-1 A conceptual model of interactions between the Floridan Aquifer and water in conduits during the sample periods ......................................................................... 43
4-2 Evasion at the River Rise increases as travel time increases................................... 44

ix
Abstract of Thesis Presented to the Graduate School of the University of Florida in Partial Fulfillment of the
Requirements for the Degree of Master of Science
USING RADON-222 AS A TRACER OF MIXING BETWEEN SURFACE AND GROUND WATER IN THE SANTA FE RIVER SINK/RISE SYSTEM
By
Lauren A. Smith
May 2004
Chair: Dr. Jonathan B. Martin Major Department: Geological Sciences
Karst aquifers (which provide 25% of the world’s population with potable water)
are characterized by links between surface and ground water, making them susceptible to
contamination. Linkage between groundwater and surface water occurs through the
unconfined Floridan Aquifer in north-central Florida. An example of surface-
groundwater linkage occurs when the Santa Fe River flows into a 32-m deep sinkhole,
the River Sink, and resurges approximately 8 km down gradient at the River Rise. This
system provides opportunities to observe mixing between surface and ground water
within a karst aquifer. Mixing can be observed using natural chemical and isotopic
tracers, one of which is the isotope 222Rn (half-life = 3.82 days). Radon-222 is formed by
the alpha decay of 226Ra, an alkaline earth element common in carbonate and clay
minerals. Surface waters have low 222Rn activities (~20 dpm/L) due to atmospheric
evasion and ground water have high 222Rn activities (>200 dpm/L). The difference in

x
activities of these two end members should make 222Rn a good tracer for surface-ground
water mixing in karst areas.
Activities of 222Rn were measured to depths of 8 and 10 m at two sinkholes
(Vinzants Landing and River Rise) and indicated that 222Rn is heterogeneous in the
sinkholes. Water samples were collected from the River Sink, River Rise, and karst
windows between the Sink and Rise from May 2002 to April 2003. These samples
encompass drought, base flow, and flood stages. As the river stage rises to flood
conditions (~11.51 masl) the excess 222Rn activities decrease from approximately 100
dpm/L to less than 25 dpm/L, indicating that no matrix water enters the conduit; and that
the conduit is filled with 222Rn-poor surface water from the Santa Fe River. During low
stage (9.25 masl), when past studies have found groundwater dominates the system, the
water activities are also low (≤ 25 dpm/L) possibly caused by evasion and radioactive
decay of 222Rn as the water slowly flows through the Sink/Rise System. At times of base
flow conditions for the river (10.70 m stage), activities are ~100 dpm/L, indicating some
ground water and surface water mixing. The fraction of surface and groundwater in the
system could not be determined through a two end-member mixing model because
evasion and radioactive decay complicate the simple mixing model. 222Rn may be a good
tracer of mixing between surface and ground water; however, further studies need to be
conducted to fully understand the impacts of decay, evasion, and lithology over the 222Rn
activities in the Sink/Rise system.

1
CHAPTER 1 INTRODUCTION
Karst aquifers provide 25% of the world’s population with potable water (Ford and
Williams, 1989). These aquifers are typically characterized by direct links between the
surface and ground water systems through sinkholes, swallets, and highly permeable
rocks, which make karst groundwater resources susceptible to surface contamination
(Ford and Williams, 1989). For example, tannins, pesticides, and nitrates from
agricultural and animal byproducts have been shown to move rapidly into and through
karst groundwater systems, contaminating water resources (Katz, 1992; Boyer and
Pasquerell, 1996; Kincaid, 1998). The loss of undersaturated surface water with respect
to calcite to the aquifer may also increase dissolution of carbonate rocks (Drever, 1988).
Tracking contaminants can be difficult because the heterogeneous permeability of
karstic rocks complicates modeling of fluid flow and contaminant transport.
Complications are due to the exchange of water among three types of porosity:
intergranular matrix porosity, fracture porosity, and conduits (White, 1999). Many
studies of karst aquifers have been conducted, but most focus on aspects of either conduit
flow or matrix flow. Highly altered karst aquifers, like those found in Paleozoic mid-
continent carbonates are dominated by conduit and fracture flow because recrystallization
has led to dense, low permeability matrix rocks. Less altered karst aquifers may have
matrix rocks with high permeability, creating flow characteristics that differ from karstic
aquifers formed in dense and altered carbonates with low permeability.

2
An important example of a less altered karst system dominated by both conduit and
matrix flow is the Floridan Aquifer system (Bush and Johnston, 1988), a regionally
important aquifer because it is the main source of potable water in north central Florida.
The Floridan Aquifer represents a class of karst aquifers with high intergranular porosity
and permeability (Budd and Vacher, 2002), which may allow a significant fraction of the
subsurface flow through matrix rocks (Martin and Screaton, 2001). Typical of all karstic
aquifers, the Floridan Aquifer has direct links to surface water through sinkholes,
swallets, and highly permeable rocks. Bush and Johnston (1988) suggested that on a
regional scale, it could be assumed that the conduit and matrix systems in the Floridan
Aquifer of the southeastern United States could be treated as homogenous or as an
equivalent porous medium. At a local scale, even in porous karst aquifers such as the
Floridan Aquifer, conduit flow predominates and the equivalent porous medium approach
is invalid (Bush and Johnston, 1988; Padilla et al, 1994; Halihan et al, 1998). Prevention
and remediation of contamination in these aquifers require an understanding of the
mixing among surface and ground water and controls of flow paths in the subsurface.
Many techniques have been used for studies of flow paths, mixing, and flow
velocities through karst aquifers. Common techniques include injection of artificial dyes
(e.g., rhodamine and fluorescein), studies of physical characteristics of the water, and
measurement of chemical and isotopic compositions of the water and dissolved
constituents (e.g., Smart, 1988; Ryan and Meiman, 1996; Martin and Dean, 1999). One
dissolved radioactive component with good potential for studying the mixing between
ground and surface water is the isotope 222Rn (half-life=3.82 days). Radon is a product of
the natural radioactive decay series of 238U and a direct product of alpha disintegration of

3
226Ra (Bertin and Bourg, 1994). As an alkaline earth element, radium is found in
carbonate and clay minerals; and thus large amounts of radon are generated in ground
water. However, because of atmospheric evasion (loss of radon gas to the atmosphere),
radon activity should be low in surface waters. In addition, radon is chemically
conservative (i.e., no source other than 226Ra and no sinks other than decay); and is easily
measured at low activities (e.g., 0.02 pCi/L (0.044 dpm/L)) through alpha-counting
techniques. Therefore, activities of 222Rn in karst water should reflect the relative
amounts of water from the surface with low 222Rn activity and water that has been stored
in matrix porosity and thus gained a high 222Rn activity.
Rogers (1958) was the first to use 222Rn to study ground water and surface water
relationships. He demonstrated that 222Rn activities in springs (ground water) were much
higher than in surface water and that the springs were a source of 222Rn in the streams
surrounding his study area. A study by Ellins et al. (1990) of Puerto Rican streams in an
upland karst region confirmed Rogers’ (1958) work. Ellins et al. (1990) described low
activities of 222Rn in the streams (18 to 200 dpm/L) as a function of the atmospheric
evasion and the high levels of 222Rn (up to 693 dpm/L) in related springs due to the input
of enriched groundwater. Bertin and Bourg (1994) were able to use the difference in
222Rn activities in ground and surface water to trace the seeping of Lot River water in
France into an alluvial aquifer. Though Bertin and Bourg (1994) did not work in a
karstic terrain, their study suggests that 222Rn can be used as a tracer of infiltrating river
water and can be used in the presence of mixing within the aquifer.
This study has two principle objectives:
• To evaluate the potential for using 222Rn in a karst environment for tracing groundwater and surface water interactions

4
• To define the interaction between surface water and ground water in a karst system with high matrix permeability using 222Rn.
To satisfy these objectives, several questions concerning 222Rn activities in a karstic
terrain were addressed:
• Does 222Rn trace surface water and ground water mixing in a karst region? • Will 222Rn trace mixing of the water from the matrix and conduit? • How can the interactions between surface and ground water be quantified? • Will lithology prove to be a main control over 222Rn activities?
Study Area
Location and Climate
The Santa Fe River Basin (Figure 1-1) covers an area of 3584.5 km2 and is a
tributary basin of the Suwannee River (Hunn & Slack, 1983). The Santa Fe River
originates in Altho and Santa Fe lakes in north-central Florida (Hunn & Slack, 1983) and
flows westward approximately 50 km until it reaches a 32 m deep sinkhole at O’Leno
State Park. River water that enters the sinkhole mixes with groundwater from the
Floridan Aquifer and travels through areas of mapped and unmapped conduits. This
water resurfaces at the River Rise (~8 km down gradient of the Sink) and continues as the
lower Santa Fe River (Hisert, 1994; Dean, 1999) (Figure 1-2).
Located in a semi-tropical climate, average air temperature in the Santa Fe River
Basin is 20°C and average groundwater temperature is around 22°C (Hisert, 1994;
Florida Geological Survey, 1992). Precipitation averages 123 cm/yr with most occurring
between June and September. Most summer rainfall occurs during local thunderstorms
and seasonal tropical storms. As a result, precipitation can be heterogeneous over small
areas. Winter rainfall is from extratropical storms, which causes most flooding.

5
Figure 1-1. Map of the Santa Fe River basO’Leno State Park is shown byModified from Hunn, J. D., SlaRiver Basin, Florida. U. S. Geo
O’Leno State Park
in, shown in shaded area. The location of the square and is seen in detail in Figure 1-2. ck, L. J., 1983. Water resources of the Santa Fe logical Survey.

6
Physiography
Three dominant physiographic divisions in the region include the Northern or
Proximal zone, the Central or Mid-peninsular zone and the Southern or Distal zone
(White, 1970). O’Leno State Park is located on the border between the Northern and
Central physiographic zones within the Western Valley, a 140 mile long lowland, and the
High Springs Gap, an opening within the Western Valley. This portion of Florida is a
well-drained area of high recharge, and variably developed karst. The High Springs Gap
includes the Cody Scarp, which represents the erosional edge of the Hawthorn Group.
This scarp is the most prominent topographic feature in peninsular Florida, yet it is a
subtle feature (with ~25m per 10km) (Puri and Vernon, 1964; White, 1970). The
Hawthorn Group is the confining unit for the Floridan Aquifer, and thus karst features are
common where the Hawthorn Group is absent. Most streams, including the Santa Fe
River, either disappear or become losing streams to the aquifer systems below as they
cross the scarp.
Geology and Hydrostratigraphy
Three aquifer systems comprise the hydrostratigraphy of the study area and include
the Surficial Aquifer system, Intermediate Aquifer system, and the Floridan Aquifer
system. The connection between the stratigraphy and hydrostratigraphy is shown in
Table 1-1. The Surficial Aquifer system provides small-yield domestic and agricultural
water supplies (Scott, 1992) and is composed of undifferentiated Plio-Pleistocene
sediments containing sinkhole fill, fine to medium sands, and layers of clay and silt
(Hunn and Slack, 1983; Scott, 1992). In O’Leno State Park, the Surficial Aquifer system
is less than 2 meters thick to absent (Hunn and Slack, 1983).

7
Figure 1-2. Site map of the Santa Fe River Sink/Rise system in O’Leno State Park. The
dashed line represents locations of caves mapped by cave divers (Old Bellamy Exploration Team, unpublished report). The solid line represents roads and the pentagons represent wells drilled in 2003. Modified from Hisert (1994); Dean (1999).
Cody Scarp

8
The Intermediate Aquifer is contained within the Hawthorn Group (Bush and
Johnston, 1988). The Hawthorn Group in Northern Florida consists of interbedded
phosphatic carbonates and siliciclastics with a trend of increasing siliciclastics in the
younger sediments. These sediments have low permeability and form an effective
aquiclude, the intermediate confining unit, which confines the Floridan Aquifer where
present (Bush and Johnston, 1988). In areas where the intermediate confining unit is
absent such as the western portion of the Santa Fe River Basin, the Surficial Aquifer
directly overlies carbonates of the Floridan Aquifer (Scott, 1992). The lack of the
confining unit limits lakes and wetlands in the surface (Scott, 1992). Karst features, such
as sinkholes are common through both the Surficial and Intermediate Aquifer systems
and provide direct recharge to the Floridan Aquifer System.
The Floridan Aquifer System is composed of several hundreds of meters of
limestone and dolostone and is the main source of water in northern Florida and parts of
Georgia, South Carolina and Alabama (Hunn and Slack, 1983; Stingfield and LeGrand,
1966). The stratigraphic units comprising the Floridan Aquifer system from late- Eocene
to Oligocene include the Oldsmar Limestone, Avon Park Limestone, Ocala Limestone,
and Suwannee Limestone. The Ocala Limestone is the uppermost stratigraphic unit in
O’Leno State Park (Hisert, 1994).
Background 222Rn Studies
Two surface and groundwater mixing studies using 222Rn were conducted
previously in portions of the Santa Fe River Basin. Ellins et al. (1992) used background
222Rn activities of the Santa Fe River (~10 dpm/L) and spring 222Rn activities in the lower
Santa Fe River Basin (~1000 dpm/L) to observe a ratio of ground to river water 222Rn
activities of 100:1. Hisert (1994) sampled 222Rn in the Santa Fe River along

9
Hollingsworth Bluff, located southwest of O’Leno State Park. In samples collected at the
riverbed, the depth halfway between the riverbed and surface, and the surface of the river,
Hisert (1994) found that 222Rn activities decreased with depth and were dependent on
groundwater influxes.
Hisert (1994) also measured 222Rn activities within the O’Leno State Park. At an
average discharge of 42 m3/s, 222Rn activities in water from selected karst windows in the
northern section of the park (River Sink and Jim Sink) are identical to atmospheric
background levels (< 50 dpm/L) (Hisert, 1994). At these discharges, activities in water
from the karst windows in the southern section of the park (Two Hole, Sweetwater Lake,
and River Rise) were close to ground water levels (~450 dpm/L). Hisert interpreted this
increase in activity to result from an influx of groundwater into the southern karst
windows.
It is unclear as to whether the Hawthorn Group or the carbonates in the Floridan
Aquifer is the major source of the 222Rn in the study. Smoak et al. (2000) found well
water from the Floridan Aquifer near Tampa, FL to have 226Ra activities for the Floridan
Aquifer to range from 5.8 to 6.6 dpm/L. These 226Ra activities are similar to those seen at
wells in this study, which correspond to 222Rn activities of approximately 1000 dpm/L.
Wherett (1992) found average soil gas 222Rn activities of the Hawthorn Group to be
approximately 2000 dpm/L. Although it is unclear how average soil gas converts to the
liquid gas used in this study, it can be assumed that the numbers are within the same
order of magnitude.
Background O’Leno Studies
Skirvin (1962) conducted the first study of water flow through the Sink/Rise
system of the Santa Fe River. Based on the tannic acid content of the water, Skirvin

10
Table 1-1. Geologic and hydrogeologic units found in the Santa Fe River Basin. Modified from Hunn and Slack (1983), Scott (1992), Hisert (1994), and Dean (1999).
Series Stratigraphic Unit Hydrogeologic Unit Lithologic Description Thickness (m)
Holocene Undifferentiated Surficial Aquifer Sinkhole fill, fluvial terraces, and 0-25 Pleistocene Sediments thin surficial sand
Pleistocene Alachua Formation Intermediate aquifer/ Reddish-white sands, with clays, 0-30 to Miocene Upper confining unit sandy clays, and phosphate pebbles
Middle to Hawthorn Group Phosphatic clayey sand-sandy clay
Lower Miocene with varying amounts of Fullers Earth
and carbonate
Oligocene Suwannee Limestone Floridan Very pale yellow, moderately indurated,
0-100
Aquifer porous, fossil-rich calcarenite
Eocene Ocala Limestone Very permeable limestone, 275-300 Avon Park dolomitic limestone, and dolomite Limestone Oldsmar Limestone
Paleocene Cedar Keys Formation Sub- Floridan confining unit
Limestone, some evaporites and clay
?

11
(1962) suggested that most water entering the River Sink discharged at the River Rise.
Skirvin (1962) also observed that water discharged from the Rise and intermediate karst
windows when water was blocked from the River Sink by a temporary dam. Skirvin
found that more water discharged from the Rise than flowed into the Sink in May and
November 1961. The overall discharge gain in May and November were 5.30 m3/s and
5.08 m3/s, respectively. These observations indicate that the system gains water from
sources other than the River Sink.
Hunn and Slack (1983) suggested that the water quality of the basin at this time
was more influenced by natural factors, such as limestone dissolution, than by
anthropogenic factors. Hunn and Slack (1983) describe the sinking eastern rivers as
having lower concentrations of iron, calcium, magnesium, and bicarbonate than the water
within the Floridan Aquifer. The rising western rivers have concentrations of iron,
calcium, magnesium, and bicarbonate similar to the Floridan Aquifer. These chemical
compositions indicate that the rivers contain water from the Floridan Aquifer, which is
similar to the results reported by Skirvin (1962).
Hisert (1994) provided the first in-depth look into the complex underground system
of O’Leno State Park by using sulfur hexafluoride (SF6), temperature, and δ18O to trace
groundwater flow from the River Sink to the River Rise. The SF6 tracer experiment,
conducted in July 1991, required two injections to link flow from the Sink to the Rise.
The first injection, performed at a discharge of 31.3 m3/s, connected the River Sink to
Sweetwater Lake through multiple karst windows, but SF6 from this injection was not
recovered at the River Rise. A second injection into Sweetwater Lake was detected at the
River Rise (Fig. 1-2). The discharge rate during this second injection was not reported,

12
but a third injection was made at Jim Sink when River discharge was 5.8 m3/s into the
River Sink, which connected Jim Sink to the River Rise via Sweetwater Lake. Even
though a direct connection was never made between the River Sink and Rise, Hisert
concluded that the karst windows in the Santa Fe River Sink/Rise system are
hydraulically connected.
Hisert was also able to use background temperatures of the river (15°C) and
groundwater (22°C) to conclude that the 2.5°C increase in temperature found within
some of the windows, including the Rise, indicated a 37.5% influx of groundwater. This
conclusion was supported by variations in oxygen ratios of the water samples. The karst
windows have a slightly enriched δ18O signature compared to the River Rise reflecting an
influx of δ18O-enriched groundwater.
Dean (1999) used water chemistry to determine the extent of mixing between the
river and ground water, and he used temperature as a tracer of flow rate from the River
Sink to the River Rise. Using natural variations in temperature, Dean (1999) found that
subsurface travel time of the water from the River Sink to the River Rise varies from
approximately 12 hours to nearly 8 days, depending on river stage. By using temperature
as a tracer and discharge measurements, Ginn (2002) and Screaton et al. (2004) found a
subsurface conduit flow at rates of 3.11 km/day, which are similar to the subsurface flow
rate found in Hisert’s thesis. Both Ginn (2002) and Dean (1999) agree with Hisert’s
conclusion that the sinks in O’Leno State Park are all hydraulically well connected.
Chloride (Cl-) concentrations from Dean (1999) increased between the River Sink
and Sweetwater Lake by an average of 35.8% during low flow conditions. This increase
suggests an addition of Cl- rich water, probably groundwater. During high flow

13
conditions the Cl- concentrations between the Sink and Sweetwater Lake change by an
average of 4.3%, which suggests very little addition of ground water.

14
CHAPTER 2 METHODS
The objectives of this project were met through a series of physical and chemical
measurements including daily precipitation, river stage records, and measurements of
isotopic compositions in water samples collected from various sites in the region of the
Santa Fe River Sink/Rise system. Park staff collected daily precipitation and river stage
measurements for the O’Leno State Park station on the Santa Fe River. New chemical
analyses used in this thesis include measurement of 222Rn activities in all collected water
samples and measurement of absorbance in selected samples.
Field Methods
Sample Bottle Construction
Sample bottles were constructed from emptied, cleaned 2.5 L glass acid bottles,
which were wrapped in duct tape to prevent breakage (Figure 2-1). A two-holed rubber
stopper along with two lengths of 1/40-inch diameter copper pipes, one 2-inch long piece
and the other 12-inches long were placed in the mouth of each bottle. The base of the
12-inch pipe was attached to an Aqua-Tech air diffuser. The rubber stopper was secured
with thin wire and attached to the bottle with silicon to make a gas tight seal. Rubber
tubing with male/female connectors was attached to the ends of the two copper pipes that
extend from the rubber stopper. Clamps were attached to each rubber tube to control
airflow. Each bottle was evacuated in the lab for approximately 5 min. before water
sampling. The vacuum allows the water samples to be sucked into the bottle and
prevents atmospheric contamination of the sample.

15
Gas tight silicon seal Connector
Clamp
2” copper tubing 12” copper tubing
Air bubbler
Duct Tape
2.5 L acid bottle
Rubber Hose
Figure 2-1. Schematic of the sample bottles used for collection of water for 222Rn
analysis.
Water Sampling
Water was sampled at 11 sites along the river (Vinzants Landing, River Sink,
Ogden Pond, Big Sink, Parener’s Sink, Jim Sink, Jug Lake, Hawg, Two Hole,
Sweetwater Lake, and the River Rise) and at 5 wells (Wells 1, 2, 3, 4, 6, and 7) located
within the park (Figure 1-2). Samples were collected between May 2002 and May 2003
at stages ranging from 9.78 to >11.51 masl (Table 2-1).
One objective of this study was to develop simple and robust techniques for
sampling and observing 222Rn activities in karst systems. Consequently, sampling
techniques evolved as the study proceeded. Two types of samples were collected initially
and include grab samples and vertical profile samples. Grab samples were taken
approximately one foot from shore of the various sinks by submerging the tube with the
male connector and loosening the clamp. Vertical profile samples were taken at the River

16
Table 2-1. Dates, river stages, and sample sites of each sample event. Sample Periods Sampling Dates River Stage (m) Grab or Peristaltic Samples Sample sites
I 5/8/02 9.78 Grab Samples All 11 sites 6/6/02 9.61 Grab Samples Vertical profile of River Rise (1, 2, 4, 6, 8, 10 m depths) 7/3/02 9.56 Grab Samples Vertical profile of River Rise (0.3, 1, 2, 4, 6, 10 m) Vertical profile of Vinzants Landing (0.3, 1, 2, 4, 6, 8 m) 8/29/02 10.12 Grab Samples Vertical profile of Vinzants Landing (0.3, 1, 2, 4, 6, 8 m)
II 9/13/02 10.16 Grab Samples All 11 sites III 1/31/03 10.53 Peristaltic Samples All 11 sites IV 2/19/03 11.49 Peristaltic Samples River Sink, Ogden, Jim, Hawg, Sweetwater, River RiseV 2/27/03 11.51 Peristaltic Samples River Sink, Ogden, Hawg, Sweetwater, River Rise VI 3/5/03 >11.51 Peristaltic Samples River Sink, Ogden, Jim, Hawg, Sweetwater, River Rise
4/30/03 10.56 Peristaltic Samples Wells 5/7/03 10.47 Peristaltic Samples Vertical profile of River Rise (0.3, 1, 2, 4, 6, 10 m) Vertical profile of Vinzants Landing (0.3, 1, 2, 4, 6, 8 m)

17
Rise and Vinzants Landing to depths of 10 and 8 meters, respectively. These samples
were collected using a rubber raft and a rope to secure the raft position. Once in position,
a tube was lowered to various depths, and water was siphoned to the tip of the tube.
After the tube was filled with water, it was attached to the evacuated bottle, which was
allowed to fill with sample water.
Subsequent samples were collected from shore using a peristaltic pump (Geotech
Geopump 2). This sample system included a tube that was extended up to 20 meters
from shore. One end was connected to the pump and the other was weighted and
screened with a woven mesh of polypropylene with a mesh size of 210 µm. The tube
was set to a 2-meter depth and attached to a long PVC pipe with floats on either side and
pushed from shore. The tubing was purged with 2 liters of water before being connected
to the sample bottle. The peristaltic pump was also used for the vertical profiles. A
weighted rubber tube was lowered from the side of the boat at various depths (0.3, 1, 2, 4,
6, 8, and 10 m) and then connected to the pump, which like the other samples, was
allowed to purge for two minutes before each sample was taken.
Ground Water Sampling
Ground water samples were taken from 6 wells (Well 1, 2, 3, 4, 6, and 7) that are
located within the Park. Completed depth, screened interval, and depth to bedrock are
given in Table 2-2.
Table 2-2. Drilling records of six wells drilled during 2003. Wells Completed Depth (ft) Screened Interval (ft) Depth to Bedrock (ft)
1 75 75-55 56 2 100 100-80 20 3 93 93-73 10 4 97 97-77 15 6 102 102-82 16 7 98 98-78 18

18
At each well a Redi-flow 2” variable performance submersible pump was used to
pump water directly into the base of an 8.4-liter bucket, which was allowed to overflow
ensuring no atmospheric interference. The wells were purged with at least three well
volumes before 222Rn samples were collected. The samples were collected by
submerging the tubing to the base of the bucket and allowing the vacuum to fill the
bottle.
Lab Methods
Radon was extracted from the water samples within 24 hours from sample time to
insure a minimal loss of 222Rn to decay. Bottles were attached to the extraction line
(Figure 2-2), clamps were loosened, and ultra pure (99.999992 %) helium was allowed to
bubble into the sample through the l2-inch copper pipe (Figure 2-1). The helium sparged
gases from the water, and all gases flowed from the bottle through the shorter copper
pipe. Gases flowed to a U-shaped collection tube, which is filled with copper filings and
submerged in liquid nitrogen (Figure 2-2). Prior to entering the U tube, water and carbon
dioxide are removed from the carrier gas by Hammond drierite and Thomas ascarite. As
the gases flow through the U tube, the 222Rn freezes to the surfaces of the copper filings
and other remaining gases (e.g. He and O2) escape. After one hour, the liquid nitrogen is
removed, the bottles are disconnected, and the U tube is warmed. Counting cells (Lucas
cells) are attached to the extraction line and helium pushes the trapped 222Rn into the cells
(Figure 2-2). The cells are then allowed to sit for a minimum of three hours for the alpha
particle from the 222Rn decay to allow an ingrowth of daughters (Operations Manual,
1985) (Figure 2-3) and then are placed on the alpha counter. After 222Rn has been
extracted from a sample, it is allowed to sit for a minimum of 7 days to allow regrowth of

19
Figure 2-2. A simplified schematic of the Radon Extraction Line. Each number below
corresponds with the number in the diagram. (J. Cable, 2003 personal communication)
1. By-pass valve purges line between samples or will be used when evacuating Lucas cells.
2. Valve controls flow into the sample bottle. Flow is regulated by the Flow meter (400 ml/min is recommended).
3. Valve controls flow out of sample bottle. Gas from bottle headspace is forced out of bottle and carried through the line. Flow passes through Drierite to remove water vapor and Ascarite to remove carbon dioxide. These gases must be removed to eliminate their freezing inside the LN2 trap and taking up surface area reserved for radon molecules.
4. Valve controls flow into LN2 cold trap. This valve is open during the sample processing and is closed after the collection period (about 60 minutes) is complete. Time series experiments using standards have shown that after 50 minutes 90% of radon in water is collected on the trap. After 60 min, 99% of radon is collected.
5. Valve controls flow into the Lucas cell. During sample processing, Lucas cell is left off of the line and helium is allowed to exit the cell port. Valve 5 is open. Radon and helium are forced into the cell after the trap has been heated and the cell is evacuated.
6. Valve controls flow to vacuum pump. Left closed during sample processing. It is opened only when the trap is closed (4 & 5 valves) so that you can evacuate the Lucas cell.
20
Figure 2-3. A simplified schematic of the radon counting system modified from
Operations Manual 1012899A. The voltage travels to the PM tube and gives off pulses of light with each detected α - particle. The pulse of light is then sent to the counter.
222Rn from the 226Ra dissolved in the water. The ingrown 222Rn is then extracted and
measured following the techniques for initial 222Rn analysis, which provides a
measurement of 222Rn activity in the sample. Once all samples have been run, the bottles
are emptied to determine water volume.
The error associated with radon analysis are those associated with sample counting,
cell background counting, volume, line efficiency, and operator error. Efficiency of the
extraction line and counter were calculated by running 222Rn standards. The primary
standard used was NIST 268.2 Bq/g (16,092 dpm/g). The standard was diluted into 8
standards in bottles identical to those used for the measured 222Rn samples and were
extracted for 222Rn using the same process as with the measured samples. Each Lucas
cell was used three times. Table 2-3 shows that the average percent efficiency of the

21
Table 2-3. Average percent efficiency and standard deviation for each Lucas cell.
extraction line, lucas cells, and alpha counter range from 41 – 80 % and standard
deviation ranges from 0.01 to 0.54. The precision of the procedure was determined by
running duplicates. Duplicates were taken at Vinzants Landing at a depth of one and six
meters, at the River Rise at a depth of one and six meters, and at Well 2. The percent
difference of the duplicates taken at Vinzants Landing (1m) is 11% and is 64% at
Vinzants Landing (6 m). The percent difference of the duplicates taken at the River Rise
1 m and 6 m are 73% and 18%, respectively. The percent difference of the duplicates of
Well 2 is 29%.
Absorbance
A spectrophotometer measures the color absorbance quantitatively within the
visible spectrum (360-375 nanometers). The instrument used in this study was the Milton
Roy Spectronic 401 spectrophotometer. To get an absorbance value a wavelength was
set on the spectrophotometer that will be maximally absorbed by river water. In this case
the wavelength is 375 nanometers. Water with a higher amount of color due to tannins;
such as river water, will have a higher absorbance value than water with little color
(groundwater). It would be expected that the samples composed of groundwater will have
a higher 222Rn activity and should have the lowest absorbance. Therefore, absorbency
should be a good check for the 222Rn activities of this study.
Counter Red Green Blue Yellow Cells I II III I II III I II III I II III
Average % efficiency
45 41 39 56 44 48 72 70 53 65 80 57
Standard Deviation
0.08 0.29 0.12 0.2 0.01 0.11 0.04 0.16 0.25 0.39 0.03 0.54

22
CHAPTER 3 RESULTS
Precipitation and River Stage
The precipitation and river stage records for the study period are shown in Figures
3-1 and 3-2. A total of 120.45 cm of rainfall fell at the O’Leno station during the study
period (April 1, 2002 – May 7, 2003) with 57% of the total (120.45 cm) occurring
between September 2002 and April 2003, or 62% of the study interval.
River stage is controlled by precipitation and evapotranspiration, but river stage
varies seasonally primarily due to evapotranspiration, which ranges from approximately 5
cm/month during the winter to approximately 14 cm/month during the summer (Gordon,
1998). The river stage between April 1, 2002 and May 7, 2003 ranged from a minimum
of 9.48 masl on August 1, 2002 to a maximum of 14.43 masl on March 13, 2003 (Figure
3-2). Between the stages of 9.48 and approximately 10.50 masl, the river is completely
captured by Vinzants Landing, a swallet upstream of the River Sink. Once stage reaches
approximately 12 masl, the river overflows its banks at the south/southwestern portion of
the Sink and continues overland flow in a south/southwestern direction within the Park.
At stage of approximately 14.3 masl the river overflows its banks at the eastern portion of
the Sink and begins to connect to all the other intermediate karst windows and the River
Rise via overland flow (Dean, 1999).
Depth Profiles
Profiles of 222Rn activity with depth were measured at Vinzants Landing and the
River Rise. River Rise profiles are shown on Figure 3-3 A and B and Vinzants Landing

23
profiles are shown on Figures 3-4 A and B. Figure 3-3 A has two profiles, one taken on
June 5, 2002 and the other on July 2, 2002. On these dates all river water was captured
by the sinkhole at Vinzants Landing. Both profiles have low 222Rn activities, but show
distinctly different trends. The July 2nd profile decreases with depth from a maximum of
~13 dpm/L to a minimum of ~2 dpm/L, whereas the June 5th profile is variable at the
surface but increases slightly with depth below the sample taken at 4 m below the
surface. Figure 3-4 B shows the first two profiles along with a third profile taken on May
7, 2003, when the river water was being captured by the River Sink at a stage of 10.43
masl. There is no pattern with depth; activities vary from a minimum of 25 dpm/L to a
maximum of 186.7 dpm/L. This profile also shows no similarity with the first two
profiles.
The first two Vinzants profiles were taken during the summer of 2002 (July 2, 2002
and August 29, 2002) when all river water was captured by the sinkhole at Vinzants
Landing (Figure 3-4 A). The profile taken on July 2nd shows the highest activity (32.86
dpm/L) at a depth of 0.3 m with a minimum at a depth of 4.0 m. The August 29th profile
has the highest activity (30.37 dpm/L) at a depth of 0.3 m, but the activity changes with
depth less than on July 2nd. Figure 3-4 B. shows the first two profiles as well as a third
profile taken on May 7, 2003. The May 7th profile has the highest activity (393 dpm/L) at
depths of 0.3 meters and passes through a minimum between 2 and 6 meters below the
water surface.
24
Santa Fe River Stage
9
10
11
12
13
14
15
4/19/2001 7/28/2001 11/5/2001 2/13/2002 5/24/2002 9/1/2002 12/10/2002 3/20/2003 6/28/2003
Date
Riv
er S
tage
(m)
5/8/02
9/12/02
1/30/03
2/19/03
2/27/033/5/03
6/5/02
7/2/02
8/29/02 5/7/03
Depth Profile Sample TimesIndividual Site Sample Times
I
II
III
IV
VVI
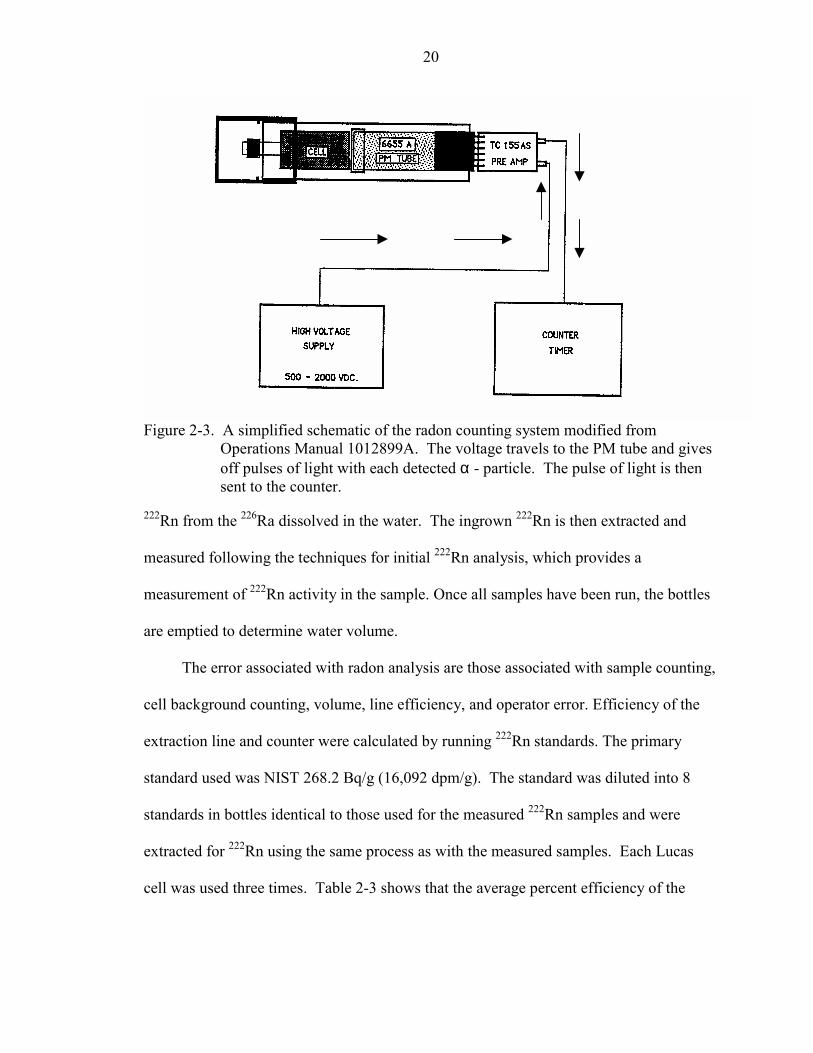
Figure 3-1. The precipitation record for O'Leno State Park from June 2001 to July 2003, which encompasses the entire study period.
The red arrows indicate when individual sinks were sampled and the green arrows indicate when the depth profile sampling was performed. The roman numerals indicate the sample periods (Table 2-1).

25
O'Leno State Park Precipitation
0
1
2
3
4
5
6
7
8
9
4/19/2001 7/28/2001 11/5/2001 2/13/2002 5/24/2002 9/1/2002 12/10/2002 3/20/2003 6/28/2003
Date
Prec
ipita
tion
(cm
)
Depth Profile Sample TimesIndividual Site Sample Times
II IV V
5/8/02
9/12/02 2/19/03
1/30/03
2/27/03
3/5/03
8/29/02
7/2/02
5/7/03
6/5/02
IIII
VI
Figure 3-2. The Santa Fe River Stage recorded from O’Leno State Park from mid April 2001 till the end of June 2003. The red arrows indicate when individual sites were sampled and the green arrows indicate when the depth profile samples were performed. The roman numerals indicate the sample periods (Table 2-1).

0 2 4 6 8 10 1 2 14
0
2
4
6
8
10
12
6 /5 /02
7 /02 /02
E xcess 222R n A ctiv ity (dpm /L)
D e pth (m )
00
2
4
6
8
10
12
4.60
Depth (m)
A Excess 222Rn Activity (dpm/L)
Figure 3-3. Vertical depth profiles at the River Rise. A. Depth profiles of the River Rise tasinkhole at Vinzants Landing. B. The first two profiles as seen in graph A and river was flowing to the River Sink. The values at 1 m and 6 m depths are averachange between profile A and B.
26
50 100 150 200
6/5/02
7/02/02
5/7/03
48.3348.33
4.60
Excess 222Rn Activity (dpm/L)
ken when the river was captured by the the profile taken in May 2003 when the ges of duplicate samples. Note the scale
B

27
0 5 10 15 20 25 30 35
0
2
4
6
8
8/29/02
7/2/02
Excess 222 Rn Activity (dpm/L)
Depth (m)
0 50 100 150 200 250 300 350 4000
2
4
6
8
7/2/02
8/29/02
5/7/03
28.7728.77
103.82103.82
Excess 222Rn Activity (dpm/L)
Depth (m)
A B
Figure 3-4. Vertical depth profiles at Vinzants Landing. A. The depth profiles of Vinzants Landing when it captured the river. B.
The first two profiles as seen in graph A versus the profile taken in May 2003 when the river was flowing to the River Sink. The values at 1 m and 6 m depths are averages. Note the scale change between profile A and B.

28
This profile also has no pattern with depth and shows no similarity with the first two
profiles
Excess 222Rn, Precipitation, and River Stage
Sample Periods I to VI
Excess 222Rn (dpm/L) records for the first two sample periods (May 8, 2002 and
September 12, 2002) are shown in Figure 3-5 A, when river stage was 9.78 and 10.16
masl, respectively. Little to no precipitation had occurred in this area directly preceding
the sampling events and all activities for both dates are less than 50 dpm/L. River stage
was sufficiently low at these times that all river water flowed into Vinzants Landing and
none into the River Sink.
Activities measured for sample period III (January 30, 2003) are shown in Figure
3-5 B. Approximately 40.21 cm of rain fell between September 12, 2002 and January 30,
2003, causing the river stage to rise to 10.53 masl (Figure 3-1, 3-2). Most of the 222Rn
activities sampled on January 30, 2003 are higher than the first two sample periods, with
the highest activity of 295.0 dpm/L at Hawg Sink. Ogden Pond, Jug Sink, and Two Hole
have activities similar to the first two sample periods.
By sample period IV (February 19, 2003) the river stage reached 11.49 masl and all
activities returned to values less than or equal to 50 dpm/L (Figure 3-5 C). This trend of
decreasing 222Rn activities with increasing stage continued to sampling period five
(February 27, 2003) where, at a stage of 11.51 masl, all locations, with an exception of
Hawg Sink have activities less than 25 dpm/L. At that location, the 222Rn activity was
97.5 dpm/L but this value also represents a decrease in activity of 33 % from its peak
activity of 295 dpm/L on January 30, 2003 (Figure 3-5 C). By March 5, 2003, sample
period six, the river water had risen over the lower of two staff gages and overflowed its

29
0
25
50
75
100
125
150
0 2000 4000 6000 8000
5/8/02 9/12/02
Exc
ess
222R
n (d
pm/L
)
D istance (m)
0
25
50
75
100
125
150
0 2000 4000 6000 8000
1/30/03
Exc
ess
222R
n (d
pm/L
)
D istance (m)
0
25
50
75
100
125
150
0 2000 4000 6000
2/19/03
2/26/03
3/5/03
Exc
ess
222R
n (d
pm/L
)
D istance (m)
Figure 3-5. 222Rn activities of samples from karst windowsRise versus distance along the flow path for sam9/12/02, B. 1/30/03, and C. 2/19/03, 2/26/03, an
Big
A
Sink
Ogden Parener’s
Jim Jug
Hawg Two Hole
Sweetwater
Rise
BSink
Ogden
Parener’s
Jim
Jug
Hawg (287.7)
Two Hole
Sweetwater
Rise
Big
Sink
Jim
Hawg
Sweetwater
eOgden
Ris8000
, the River Sink, and the River ple dates of A. 5/8/02 and d 3/5/03.

30
banks. At this time, most sample locations have activities less than or equal to 25 dpm/L
(Figure 3-5 C). The relationship between the average, standard deviation, and coefficient
of variation for samples collected during sample periods 1-6 are shown in Table 3-1. The
averages shown on Table 3-1 do not include Hawg Sink or Ogden Lake for 2/19/03. At
that time Ogden Lake had an activity of 0.09 dpm/L, which is likely in error. The
different activities at Hawg Sink suggest that it may not be on a similar flow path to the
other karst windows.
Table 3-1. Average, standard deviation, and coefficient of variation for each sample time.
Sample Time Number of samples Average (dpm/L) Standard Devation Coefficient of Variation1 9 22.5 8.7 0.42 11 18.3 8.4 0.53 9 60.4 35.1 0.64 5 26.2 19.5 0.75 3 14.6 9.8 0.76 5 11.3 5.3 0.5
Well Samples
During the course of this study seven wells were drilled in locations throughout the
field area (Figure 1-2). Six of the wells were sampled on April 30, 2003 and 222Rn
activities are shown on Figure 3-6. Wells 1, 2, and 3 have 222Rn activities ranging from
1172 dpm/L to 732 dpm/L and are either located in the northern portion of the park
(Wells 1 & 2) or up gradient (northeast) of the mapped conduit (Well 3). Wells 4, 6, and
7 have activities less than wells 1, 2, and 3 and range from 432 to 152 dpm/L. Wells 4, 6,
and 7 are located in the southern portion of the study area. Well 3 is also located in the
southern portion of the study area, but it is located up gradient from the other southern
wells and the mapped conduit.

31
0
200
400
600
800
1000
1200
1400
0 1 2 3 4 5 6 7 8
Exce
ss 22
2 Rn
(dpm
/L)
Wells
Well 1
Well 2 (avg)
Well 3
Well 4
Well 6
Well 7
Figure 3-6. 222Rn activities of wells 1, 2, 3, 4, 6, and 7. A duplicate was taken at well 2.
The activity plotted is the average of the two samples taken with a range of 213 dpm/L.
Mixing Model
Mixing between the Santa Fe River and the Floridan Aquifer can be estimated by
modeling the quantities of each water type in the samples. Assuming there is only two
end member mixing with distinct 222Rn signatures, the amount of river water in the
samples (%X) can be calculated by a mixing model (Kincaid, 1998), described by
%X = ((Rs – Raq)/(Rriv – Raq)) * 100 (1)
where Rs represents the activity of 222
exRn measured in each sample, Raq is the activity of
222exRn in the groundwater, which is determined by the average well activities of wells 1,
2, and 3, and Rriv is the amount of 222exRn in the river. The River Sink has large changes
in activity due to the variable input of ground and surface water in the upper Santa Fe
River. Therefore, the 222exRn activities for the River Sink during each sample period
were used for Rriv. This model has been used to calculate percentages of river water in
North and/or East of Conduit
South and West of Conduit

32
samples taken from the River Sink, Rise, and the intermediate karst windows. Figure 3-7
shows the fraction of river water for each site with respect to river stage according to
values calculated using equation (1). Sample periods I and II have approximately 100%
river water in each sample. Sample period III shows more variability; the X% ranges
from 60 to 100%. Sample period IV, V, and VI have approximately 100% river water in
each sample. Because the River Sink 222Rn activities were used as the Rriv variable all
%X values for the River Sink are 100% and are not reported in Figure 3-7.
65
70
75
80
85
90
95
100
105
9.5 10 10.5 11 11.5 12 12.5
OgdenBigParenersJimJugHawgTwo HoleSweetwaterRise
9.5 10 10.5 11 11.5 12 12.5
% X
Stage (m)
Figure 3-7. %X versus Stage (m) for each site in the study area. Lower the %X represents higher the groundwater content in the samples.
Decay Equation
Sink vs. Rise
The amount of decay that takes place over a period of time can be determined in the
basic radioactive decay equation described by
N = Noe –λt (2)

33
N is the activity of parent atoms that remain after a certain travel time (t), No is the
original activity of radioactive parent atom, and λ is the decay constant, which is 0.263
day-1 for 222Rn. Rearranging the equation allows calculation of travel time from
calculated and measured 222Rn activities.
t = ln(N) – ln( No) (3) - λ
Table 3-2 shows how travel time, decay, and the measured activities of the
samples taken at the River Sink and Rise interact. Martin (2003) was able to calculate
velocities and travel time by correlating temperature peaks as water flowed through the
Sink/Rise system. Travel time (t) was based on these travel times and velocities given in
Martin (2003) for 2/19/03, 2/23/03, and 3/3/03, which are compared to sample periods
2/19/03, 2/26/03, and 3/5/03 of this study. No water was entering the River Sink during
the first two sample periods (5/8/02 and 9/12/02); therefore, it is possible that there was
no flow from the Sink to the Rise. Because of this, travel times cannot be calculated for
these two dates. Martin (2003) did not have velocities calculated for a date close to
sample period III (1/30/03) therefore the travel time here is from Dean (1999).
Calculated activity for the River Rise (222exRn Rise calc) was found by using equation (2),
assuming the initial 222Rn activity (No) is the activity at the River Sink. Calculated travel
time (T222exRn) is the travel time found by using equation (3), where No is the 222Rn
activity of the River Sink, and N is the 222Rn of the River Rise.
The measured activity of the Rise sample collected January 30, 2003 is higher than
the calculated activity. For example, the measured activity of the water at the River Rise
was 53.50 dpm/L, but the calculated value was 17.0 dpm/L. The last three sample

34
Table 3-2. Relationship between measured 222Rn-activity and travel time and calculated 222Rn-activity and travel time using the decay equation.
Date Stage (m) 222exRn Sink1 (dpm/L)
222exRn Rise2
(dpm/L) 222
exRn Rise calc3 (dpm/L)
Tt4 (days)
T 222exRn5
(days) 5/8/02 9.78 22.55 10.6 ---- ---- 2.9 9/12/02 10.16 18.32 8.54 ---- ---- 2.93 1/30/03 10.53 48.6 53.5 17.00 4 ---- 2/19/03 11.49 20.32 4.45 13.70 1.5 5.78 2/26/03 11.51 24.25 4.62 16.34 1.5 6.31 3/5/03 >11.51 17.94 4.54 13.8 1 5.25
1 & 2 Measured 222Rn activities of the River Sink and Rise, respectively. 3 N calculated by the equation 2 using 1 as No and 4 at travel time. 4 Travel time from Martin (2003) based on river stage during the sample times. 5 Travel time calculated by equation 3, using 1 and 2 as N0 and N, respectively.
periods (February 19, 2003, February 26, 2003, and March 5, 2003) have a different
relationship than the first three sample periods between the measured and calculated
222exRn activities for the River Rise. The measured activities are lower than the
calculated values. For example, the measured activity of the Rise on February 19, 2003
was 4.45 dpm/L and the calculated activity was 13.7 dpm/L. Travel times for each
sample period were also calculated using the decay equation. However, the calculated
travel times do not correspond with the travel times from Dean (1999) and Martin (2003)
and are not used in any other calculations or discussion.
Sink vs. Karst Windows
A 222Rn value for each site was calculated by using equation (1) and the value of
222Rn activity at the River Sink. These values are reported in Appendix Table A-1, which
gives a comparison of measured and calculated 222Rn activity, 226Ra activity, and travel
time between the River Sink and all other sites. Martin (2003) only calculated travel
times for the River Sink, Parener’s, Two Hole, Sweetwater, and the Rise. Travel times

35
for the other sites (Ogden, Big, Jim, Jug, and Hawg) were calculated from velocities
reported by Martin (2003)
Radon-222 activity increased from the River Sink to most karst windows on May 8,
2002, September 12, 2002, and January 30, 2003 and decreased from the River Sink to
most karst windows on February 19, 2003, February 26, 2003, and March 5, 2003.
Locations where this trend is not followed include Ogden Pond, Parener’s Sink and Hawg
Sink. Activity decreased between the River Sink and Ogden Pond for all sample periods.
Parener’s Sink shows a increase for all period. Hawg Sink has higher 222Rn activity for
all sample times, except February 19, 2003 (Figure 3-8).
-40
-20
0
20
40
60
80
100
0 1000 2000 3000 4000 5000 6000 7000 8000
5/8/02; 9.78 m
9/12/02, 10.16 m
1/30/03, 10.53 m
2/19/03, 11.49 m
2/26/03, 11.51 m
3/5/03, > 11.51 m
Gai
n (d
pm/L
)
Distance (m)
Loss
(dp
m/L
)
Ogden
Big
Paraners
Jim
Jug
Hawg
Two Hole
Sweetwater
Rise
Figure 3-8. The gain or loss in activity downstream from the River Sink. If there is a
gain in activity then the measured activity at the site is higher than the measured activity at the Sink. If there is a loss in activity the measured activity at the site is lower than the measured activity at the Sink. Activity at Hawg Sink for January 30,2003 sample time is 295 dpm/L.

36
Gas Exchange Equation
To determine the amount of 222Rn that is lost to the atmosphere by evasion,
Elsinger and Moore (1983) and Ellins et al (1990) used the gas exchange equation.
Cd = Cu e-[D/(zhv)] x (4)
Cu and Cd are the 222Rn activities up and downstream. D is the molecular diffusivity of
222Rn, which is 1.2 x10⁻⁹ m2/s at 23°C and h, v, and x are the average stream depth,
velocity and distance between sample locations, respectively. The variable z is the
thickness of stagnant film layer at the surface of the stream. Elsinger and Moore (1983)
found the thickness of the stagnant film of the Pee Dee River in South Carolina to be
between 19 and 48 µm. Within this range, the thickness of the stagnant film layer does
not significantly effect the calculations (< 1%) therefore the average of this (33.5 µm) is
used for the current study. However, if the thickness of the stagnant film decreases to
lower than 19 µm, the calculations are effected. Even though this equation is not for
karst environments, it was used to establish a first order estimate of the amount of
evasion occurring in the Sink/Rise system. This equation assumes that both stream and
the air above it constitute two well - mixed reservoirs with uniform vertical activities
separated by a stagnant film of water (Ellins, 1990). The amount of exchange is mainly
governed by flow - generated turbulence (Ellins, 1990); however, the thicker the film the
slower the rate of transfer.
Color Absorbance vs. Activity
Figure 3-9 and 3-10 suggest that the initial hypothesis of absorbance may not be
correct. Figure 3-9 shows activity vs. absorbance values for the River Sink in samples
collected on 1/30/03, 2/19/03, and 3/5/03. Contrary to expectations, the sample with the

37
lowest absorbance has the highest activity. In Figure 3-10, the sample with the highest
activity has the lowest absorbance; however, the sample with the second highest activity
also has the highest absorbance. The relationship between absorbance and stage can be
seen in Figures 3-11A, B, and C. Figure 3-11 A. gives averaged absorbance values for
each site versus stage and Figures 3-11 B and 3-11 C. plot Ogden and Hawg sinks versus
stage. R2 values for the regression curves on Figure 3-11 A, B, and C are 0.888, 0.854,
and 0.9589, respectively. All graphs show an increase in absorbance with the increase of
stage.

38
S in k
00 .10 .20 .30 .40 .50 .6
0 2 0 4 0 6 0A c tiv ity (d p m /L )
Abs
orbe
nce 2 /1 9 /0 3 3 /5 /0 3
1 /3 0 /0 3
Figure 3-9. 222Rn activities of the River Sink at various sample periods vs. Absorbance.
The sample with the highest activity has the lowest absorbance.
3 /0 5 /0 3
0 .40 .4 20 .4 40 .4 60 .4 8
0 .5
0 5 1 0 1 5 2 0 2 5A c tiv ity (d p m /L )
Abs
orbe
nce
H a w g
S inkO g d e nJ im
S w e e tw a te r
Figure 3-10. 222Rn activities of samples taken at Sweetwater Lake, Jim Sink, Ogden
Pond, the River Sink, and Hawg Sink on 3/5/03.

39
R iv e r S ta g e v s A b s o rb e n c e
y = 0 .1 1 9 x - 0 .9 7 5 5R 2 = 0 .8 8 8 4
00 .10 .20 .30 .40 .50 .6
1 0 1 0 .5 1 1 1 1 .5 1 2 1 2 .5
S ta g e (ft )
Ab
so
rbe
n
1 /3 0 /0 3 2 /1 9 /0 32 /2 6 /0 3
3 /5 /0 3
O g d e ny = 0 .1 2 8 x - 1 .0 8 3 4R 2 = 0 .8 5 4
0
0 .1
0 .2
0 .3
0 .4
0 .5
9 1 0 1 1 1 2 1 3
S ta g e (m )
Ab
so
rbe
n
1 /3 0 /0 3
2 /1 9 /0 3
2 /2 6 /0 3 3 /5 /0 3
Hawgy = 0.2467x - 2.5052R2 = 0.9589
00.10.20.30.40.5
9 10 11 12 13Stage (m)
Abs
orbe
nce
1/30/032/19/03
2/26/03 3/5/03
A
B
C
Figure 3-11. Absorbance values taken during the study. A. Average absorbance for all
the samples collected. B. Absorbance values for Ogden Pond. C. Absorbance values for Hawg Sink. Each graph covers samples collected on 1/30/03, 2/19/03, 2/26/03, and 3/5/03.

40
CHAPTER 4 DISCUSSION
Precipitation and River Stage
River stage varies little during the summer months due to low amounts of rainfall
and high evapotranspiration rates (~ 14 cm/month) (e.g. Gordon, 1998). However, low
evapotranspiration rates (~ 5 cm/month) during the fall and winter months cause higher
stage fluctuations than the summer, particularly during associated times of increased
precipitation and passage of cold fronts (e.g. Gordon, 1998). During the winter months of
this study, river stage increased rapidly with rainfall: between March 3-7, 2003, 2.27 cm
of rainfall caused an increase of stage by 1.24 meters (Figure 3-1and 3-2). In all of June
2002, 11.07 cm of rain fell; however, evapotranspiration caused river stage to decrease by
0.03 m during this time.
Depth Profiles
Assuming that surface water loses 222Rn to the atmosphere and sources of 222Rn are
from the Hawthorn group and solid material in the Floridan Aquifer, there should be an
increase of 222Rn with depth in the sinkholes. However, depth profiles in this study
indicate that the water has heterogeneous 222Rn activities with depth.
All profiles taken from the River Rise and Vinzants Landing reflect heterogeneous
activities with depth that may reflect mixing between river water and groundwater
(Figures 3-3 and 3-4). The main difference between the profiles shown in Figures 3-3
and 3-4 is that Vinzants Landing has its highest activities at the surface. The lithology of
the sinkholes should not have an impact over the activity; however, this is unknown. It is

41
possible that the high activities seen at both sites are due to higher amounts of sediment
mixing with the waters. Chung (1973) and Berelson et al (1982) indicate that the increase
in 222Rn activity with depth (which should be seen in depth profiles) is due to fluxes of
sediment caused by turbidity currents within the water column. 226Ra is bonded with the
sediment and the decay to 222Rn causes the increase in activity. Both of these studies are
conducted in coastal environments in the Santa Barbara and San Nicholas basins,
California. Even though the environments differ from the current study, they provide an
analog for what could occur at Vinzants Landing and the River Rise.
Excess 222Rn
Three capturing processes control the 222Rn activity in the karst windows of the
Santa Fe River: mixing of low activity surface water and 222Rn rich ground water,
atmospheric evasion, and radioactive decay. All three processes depend on the flow
through the Sink/Rise System. During the first two sample periods, all water in the Santa
Fe River was captured by the sinkhole at Vinzants Landing. The river stages for these
two dates are 9.78 masl and 10.16 masl, respectively. Martin and Screaton (2002)
suggest that during low flow conditions, the conduit will have a lower head than the
matrix and will act as a drain for the surrounding matrix porosity (Figure 4-1 A). With
no water flowing into the River Sink, groundwater should be the main influence over the
222Rn activities measured from the samples taken at these times and even during 5/8/02
and 9/12/02 water seemed to be resurging at the River Rise (i.e., the River Rise was not
dry). Therefore the conduit should have water with high 222Rn activity that may approach
values found at the wells (~200 to ~1200 dpm/L).
Flow rates are slow at low stage conditions (~10.00 masl), with travel times from
the River Sink to the Rise of approximately 8 days or longer (Dean, 1999; Martin &

42
Dean, 1999). However, if there is no flow entering the River Sink, then travel times are
indeterminable. Slow to no flow in the Sink/Rise system, combined with 222Rn’s short
half-life (3.84 days), indicates that radioactive decay will reduce the activities. This also
allows longer time for evasion of 222Rn to the atmosphere. Figure 4-2 indicates that more
evasion does occur during slow flow, but not enough to account for the low activity.
Rainfall prior to sample period I and II is minimal therefore there is no dilution caused by
surface water recharge. Therefore, it is possible that the diffuse flow from the matrix to
the conduit is slow enough that significant decay occurs. This along with other factors
such as radioactive decay within the conduit and evasion probably account for the low
activities during these sample periods.
Prior to sample period III, 18.8 cm of rain fell and caused the river stage to rise to
10.53 masl, which is considered average river stage based on the hydrograph of river
stage for the study period (Figure 3-2). Some 222Rn activities are higher than seen during
the first two sample periods. Travel time from the Sink to the Rise is approximately four
days on the basis of the stage vs. travel time relationship in Dean (1999). More rapid
travel time may prevent most evasion and decay allowing 222Rn activities to stay
elevated. For example, calculated 222Rn activity (N from equation 2) for Ogden Pond
(Appendix Table A-1) during sample period III is 48.3 dpm/L, but activity from the River
Sink (No) is 48.6 dpm/L. Also, results from the gas exchange equation (Appendix Table
A-3) show that at Ogden Pond only 0.17 dpm/L was lost to evasion. Both of these results
indicate that the quicker travel time creates less loss of activity due to radioactive decay
and evasion. Another possible explanation for the elevated 222Rn activities is that an
increase in diffuse flow from the rain has created a more rapid influx of 222Rn rich water

43
River WaterMixing
Mixing
Matrix Water
Santa Fe River Water
Sample Periods IV, V, and VI
C
Decay over time
Evasion
Matrix Water
Sample Periods I and II
A
Mixing
Matrix Water
Santa Fe River Water
Sample Period III
B
Figure 4-1. A conceptual model of interactions between the Floridan Aquifer and water
in conduits during the sample periods. A. No water is entering the River Sink; therefore, the matrix water enters the conduits. Since there is little flow through the Sink/Rise system at this time, the water in the conduits decays. B. River water is now flowing to the River Sink and water from the matrix is entering the conduit and mixing with the river water. There is flow in the system and the decay is minimal. C. The river is flooding and the abundant amount of river water in the conduit is now moving to the matrix.

44
Evasion vs. Travel Time
y = 0.4965x + 0.1155R2 = 0.9679
0.00
1.00
2.00
3.00
4.00
5.00
0.00 2.00 4.00 6.00 8.00 10.00
Travel Time (days)
Evas
ion
(dpm
/L)
9.78
10.16
10.53
11.4911.51
>11.51
Figure 4-2. Evasion at the River Rise increases as travel time increases. The numbers by
the data points indicate river stage at the various sample times.
(ground water) to flow into the conduit and mix with the incoming river water (Figure 4-
1 b). A similar flow of groundwater to conduit was observed using Cl- concentrations in
the water. At stages of 10.45 to 10.70 masl, Dean (1999) saw an increase in Cl- by 24.7%
to 43.2 % from the River Sink to Sweetwater Lake, which he interpreted to indicate that
ground water flowed to the conduits. Compared to the first two sample periods, the
current study reports an increase in 222Rn during this stage of greater than or equal to 80,
this is probably due to the activity being lower than expected during the first two periods.
An increase in diffuse recharge should cause an increase in flow from the matrix to
the conduit; therefore, most sites should show a higher activity than the first two sample
periods. However, Ogden Pond, Jug Lake, and Two Hole Sink have activities similar to
the first two sample periods. It is unclear as to why Ogden Pond, Jug Lake, and Two Hole
Sink differ from the other samples. Of all the karst windows, Hawg Sink has the highest
222Rn activity at 295.0 dpm/L. A study conducted by Sprouse (2004, in process) reports
calcium concentrations of approximately 60 mg/L and an alkalinity of ~140 mg/L for

45
Hawg Sink in January 2003. Compared to the chemistry of the other sinks, these
concentrations are high and are possible indicators of ground water input. Along with the
high 222Rn activity measured at Hawg Sink, this may indicate that it is not on the same
flow path as the other sinks and could represent an unmapped groundwater source.
During sample periods IV, V, and VI, the river stage was 11.49, 11.51, and >11.51
masl, respectively. During sample period VI, elevation of the Santa Fe River was greater
than the staff gage located at the River Sink preventing stage measurements and an exact
stage value. At this time, it was observed that the river overflowed the banks on the
southwestern portion of the Sink and began to flow over land. The travel times from the
Sink to the Rise are 1.3 days for 2/19/03 and 2/26/03 and 1 day for 3/5/03 (Martin, 2003).
These rapid travel times prevent a large loss of activity due to radioactive decay and
evasion. For example, the calculated activity for the River Rise is ~ 4 dpm/L less than
the River Sink (Table 3-2) and the gas exchange equation indicates that only 0.5 dpm/L
was lost to evasion.
A possible cause for the observed low activities is dilution by rainwater. Two days
prior to sampling on February 19th, 7.57 cm of rain fell, 1.06 cm of rain fell the week
before sampling on February 26th, and 3.4 cm fell the week prior to March 5th. It takes
15 days for secular equilibrium between 226Ra and 222Rn to be reached. If the
surrounding sediments have been previously flushed with water, then a pulse of water
within 15 days of the first pulse, that flushed the system, will have less 222Rn activity.
However, depending on the timing of the water pulses, it is still possible that rainwater
would gain 222Rn activity as it moves through the sediment column and a dilution effect
from the rainwater and groundwater mixing in the matrix would not be seen. It is most

46
likely that the low activities seen at the various sinks during the sample periods are due to
dilute 222Rn-activity water entering the conduit at the River Sink. Based on Cl-
concentrations, Dean (1999) reported that at approximately 11.9 masl most of the water
at the River Rise originated from the River Sink, suggesting that there is little loss of
water from matrix porosity to the conduit during high flow. Martin (2003) supported this
conclusion and suggested that heads are higher in the conduit then in the matrix when
water is leaving the conduit and flowing to the matrix. Therefore, the river water in the
conduit is flowing out into the matrix (Martin and Screaton, 2002) (Figure 4-1 c). Color
absorbance values also indicate that the water with in the karst windows is consistent
with an origination at the River Sink. At most of the karst windows, there is an increase
in absorbance with an increase in stage (Figures 3-11, 12,and 13), which suggests that
higher flow rates flush the ground water from the conduit.
Radioactive Decay Along the Flow Path
At times of low flow, groundwater input and radioactive decay should be the main
controls over the 222Rn activities of the karst windows. The low 222Rn activities in
samples collected at the River Rise on May 8, 2002 and September 12, 2002 (Figure 3-4
A) indicate that radioactive decay and evasion control the water’s activity. Samples
collected January 30, 2003 have higher activities and a quick travel; therefore the effects
of decay and evasion may not be as strong.
Radon-222 activities calculated from equation (2) are not corrected for atmospheric
evasion. However, results of equation (4) indicate that approximately 4.5 dpm/L and 3.6
dpm/L are lost by evasion for May 8th and September 12th, respectively and only 2.5
dpm/L is lost for January 30th (Appendix Table A-3). For each of these dates, the
calculated 222Rn activities for the River Rise from equation (2) are approximately twice

47
the measured activities, which indicate that the measured activities are higher than if
decay was the only influence over the water 222Rn activity (Table 3-2). Therefore, there
is some source of 222Rn to the water (i.e., ground water).
Samples taken from the River Rise on February 19, 2003, February 27, 2003, and
March 5, 2003 all have measured 222Rn activities that are lower than calculated activities,
(Table 3-2, and Figure 3-8). Travel times during these sample periods are shorter (1-1.5
days) than the half-life of 222Rn (3.84 days) suggesting that a lesser amount of decay will
occur. The calculated activities for the River Rise are not much lower than the activities
at the River Sink, indicating that not much decay has occurred. For example, the
calculated activities at the River Rise for 2/19/03, 2/26/03, and 3/5/03 are all
approximately 5 dpm/L less than the activities at the River Sink. The amount of evasion
for 2/19/03, 2/26/03, and 3/5/03 was calculated to be 0.75, 0.71, and 0.48 dpm/L,
respectively and the amounts of evasion during 5/8/02, 9/12/02, and 1/30/03 are 4.45,
3.62, and 2.45 dpm/L, respectively. According to the Gas Exchange equation, this
indicates the quicker travel times also prevent most evasion. Figure 4-2 indicates that the
amount of evasion decreases with increasing travel time. The low 222Rn-activity river
water is not mixing with the high 222Rn-activity groundwater within the conduit but
moving out into the matrix. Other processes thus appear to control the loss of 222Rn from
the conduit.
If the loss of radon from the River Sink to the River Rise is not due to evasion what
is causing this? It is possible that the water in the conduit takes a longer time to travel
through the system than the temperature tracking indicates. Alternatively, it is possible
that the loss in activity is from mixing with a low 222Rn activity water source. Old
48
Bellamy Cave Exploration Team have mapped a main conduit which enters the system
from the east (Old Bellamy Cave Exploration Team, unpublished report); however, there
are no known surface water sources for the eastern system, suggests that it does not
supply dilute water. With the large amount of precipitation (> 20 cm) that occurred
during the later sample periods it is possible that the loss of activity is caused by a influx
of low activity surface water that travels to the conduit.
With a few exceptions (Ogden Pond, Parener’s Sink, and Hawg Sink) the other
sample sites used in this study agree with the 222Rn activities at the Rise. Ogden Sink has
calculated activities higher than the measured activities during all sample periods but
May 8, 2002. This could be caused either by less mixing with radon-rich ground water,
more degassing, or a combination of both. Parener’s Sink shows a decrease in activity on
9/12/02; however, it is so slight (-0.5 dpm/L) that it is smaller than analytical error of the
measurement. Hawg Sink shows an increase in activity from the River Sink during every
sample period but February 19, 2003 indicating a different source of groundwater not
available to the other karst windows.
Distribution of 222Rn in the Groundwater
Regional groundwater flow is from the northeast to the southwest (Miller, 1997);
therefore the wells on the eastern side of the conduit should sample groundwater that is
not influenced by water from the conduits. Martin (2003) indicates that local water flow
is towards the conduit during base flow conditions. Samples from the wells were
collected at a stage of 11.05 masl. Water collected from wells 1, 2, and 3 have a higher
activity than wells 4, 6, and 7. Well 1 and 3 are located in the eastern portion of the study
area and the measured activity of 1173 and 1134 dpm/L, respectively, suggests that they
are influenced by the groundwater. Even though Well 2 is on the western side of the

49
conduit, the high activity (733 dpm/L), which is measured, indicates that it is also
influence by the matrix water. Wells 1 and 2 are located in the northern portion of the
park, in which they are in closer proximity to the Hawthorn Group, which is a source of
222Rn. Wells 4, 6, and 7 are in the southwestern portion of the park, just west of the River
Rise. The low activities measured at these wells (152, 432, and 294 dpm/L, respectively)
indicate that may be influenced by the mixing between the river and ground water within
the matrix.
It is uncertain as to whether the Hawthorn provides more 222Rn activity to the area
then the limestone within the Floridan Aquifer. Crandall (1996) found that surficial
aquifer water influenced by the Hawthorn Group had 222Rn activities of ≥ 1200 dpm/L.
Smoak et al. (2000) found 226Ra activities for the Floridan to be approximately 6 dpm/L.
Wells 1, 2, and 3 have similar 226Ra activities, which indicates that the 222Rn activities of
the water measured in Smoack et al (2000) might also be relatively high. Well 1, 2, and 3
activities are also similar to those found in Crandall (1996). Therefore, at this point the
222Rn activities provided by the Hawthorn Group and the 222Rn activities provided by the
Floridan Aquifer limestone are indistinguishable.
Well activities were used as an end member (Raq) in the mixing equation. Kincaid
(1998) was able to use this model successfully and found the amount of river water to be
between 50 and 90 %. The %X, in this study, range from approximately 60 to > 100.
Figure 3-7 suggests that during sample periods I, II, IV, V, and VI primarily river water is
in the conduit and that during sample period III water in the karst windows is influenced
by ground water. However, previously discussed results suggest that this is not the case.
Water chemistry data from Dean (1999) indicated that water within the karst windows

50
was influenced by ground water. The 222Rn activities during sample periods I and II are
low, which is the result of radioactive decay and atmospheric evasion, not an influx of
river water. Therefore, in a future study of the Sink/Rise system more end members need
to be defined and quantified than what was provided by equation (1). Such end members
include influx of radon from the surrounding sediment and the influx of radon from the
Hawthorn Group. It is also important to use a variety of tracers, each with distinct
geochemical behavior, such as δ18O, Cl-, SO4-2, as well as 222Rn, to better constrain
surface and ground water mixing.

51
CHAPTER 5 CONCLUSIONS
Karst aquifers are important hydrologic systems and provide potable water to most
of our world. Therefore, it is necessary to understand the hydrologic characteristics of
these aquifers. One characteristic is the abundance of sinking streams, which allow for
mixing between the surface and ground water. These streams have potential to carry
pollutants that, once mixed with the potable groundwater, could spread quickly and harm
thousands of individuals. Natural tracers that record mixing of surface and ground water
would be valuable to developing an understanding of mechanisms and quantities of
mixing.
Results from this study suggest that 222Rn activity varies with stage. During low
stage, the low 222Rn activities suggest a loss of activity to decay and evasion. In the
future, to determine the exact amount of evasion that is occurring the stagnant film
thickness needs to be corrected for the Santa Fe Sink/Rise system. During base flow, the
high 222Rn activities suggest mixing between the river and ground waters within the
conduit. During high stage, low activities indicate there is little to no mixing between the
river and ground waters; river water is flowing from the conduit to the matrix. The
results also indicate that Hawg Sink may not be on the main flow path.
Furthermore, results indicate that a two end-member-mixing model is not adequate
to quantify the amounts of water involved in the mixing. In the future, when modeling
the quantities of water involved in mixing, other end members, such as, decay, evasion,
and sediment input need to be defined. The effects of lithology on the 222Rn activities

52
cannot be determined at this time. This is something that should be resolved in the
future. Other future work involves more depth profiles at other locations, as well as, the
River Rise and Vinzants Landing to fully understand vertical mixing with depth. Radon-
222 may prove to be a useful tracer of mixing between surface and ground water;
however, other tracers, such as Cl- and δ18O should be used to support the results from
the measured 222Rn activities and further analysis of the complex karst system, the Santa
Fe River Sink/Rise system needs to continue.

53
APPENDIX MEASURED AND CALCULATED 222RN, TOTAL 226RA, TRAVEL TIME, AND
EVASION FOR ALL SITES
Table A-1. Travel time, measured and calculated 222Rn, and total 226Ra Location Date Stage
(m) * Travel Time
(days) ^ 222
exRn calc(dpm/L)
** 222exRn
(dpm/L) ** 226Ra (dpm/L)
River Sink 5/8/02 9.78 -- -- 38.21 -0.25 9/12/02 10.16 -- -- 14.21 0.00 01/31/03 10.53 -- -- 12.64 1.34 02/19/03 11.49 -- -- 14.28 -2.49 2/26/03 11.51 -- -- 0.09 -1.45 3/5/03 <11.51 -- -- 14.8 1.62
Ogden 5/8/02 9.78 >0.24 >24.17 22.55 2.02 9/12/02 10.16 0.24 17.73 18.32 1.59 01/31/03 10.53 0.126 48.3 48.6 1.64 02/19/03 11.49 0.025 20.18 20.32 -2.45 2/26/03 11.51 0.025 24.08 24.25 1.14 3/5/03 <11.51 < 0.025 <17.81 17.94 0.26
Big 5/8/02 9.78 > 1.16 >16.62 18.43 1.25 9/12/02 10.16 1.16 13.5 27.09 1.15 01/31/03 10.53 0.61 41.41 92.10 1.41 02/19/03 11.49 0.119 -- -- -- 2/26/03 11.51 0.119 -- -- -- 3/5/03 <11.51 <0.119 -- -- --
Parener’s 5/8/02 9.78 >1.45 >15.42 23.37 1.17 9/12/02 10.16 1.45 12.53 12.01 1.32 01/31/03 10.53 0.756 39.8 96.96 -0.44 02/19/03 11.49 0.15 -- -- -- 2/26/03 11.51 0.15 -- -- -- 3/5/03 <11.51 <0.15 -- -- --
Jim 5/8/02 9.78 > 1.71 >14.38 31.20 -0.39 9/12/02 10.16 1.71 11.68 24.48 0 01/31/03 10.53 0.89 38.61 84.79 1.64 02/19/03 11.49 0.25 21.8 38.93 0.53 2/26/03 11.51 0.25 -- -- -- 3/5/03 <11.51 <0.25 <16.73 11.36 0.51

54
Table A-1. Continued Location Date Stage
(m) * Travel Time
(days) ^ 222
exRn calc(dpm/L)
** 222exRn
(dpm/L) ** 226Ra (dpm/L)
Jug 5/8/02 9.78 > 2.99 >10.23 25.18 2.41 9/12/02 10.16 2.99 8.31 32.05 1.64 01/31/03 10.53 1.56 32.25 29.71 1.11 02/19/03 11.49 0.43 -- -- -- 2/26/03 11.51 0.43 -- -- -- 3/5/03 <11.51 <0.43 -- -- --
Hawg 5/8/02 9.78 > 3.62 >8.55 17.82 -0.18
9/12/02 10.16 3.62 6.94 11.51 1.28 01/31/03 10.53 1.89 29.48 287.66 376.24 02/19/03 11.49 0.52 17.67 14.62 -2.58 2/26/03 11.51 0.52 21.08 97.50 -0.84 3/5/03 <11.51 <0.52 <15.60 21.29 0.78
Two Hole 5/8/02 9.78 > 3.67 >8.63 11.45 1.16 9/12/02 10.16 3.67 7.01 16.93 2.51 01/31/03 10.53 1.91 29.5 20.74 0.95 02/19/03 11.49 0.53 -- -- -- 2/26/03 11.51 0.53 -- -- -- 3/5/03 <11.51 <0.53 -- -- --
Sweetwater 5/8/02 9.78 > 4.82 >6.33 21.37 0.13 9/12/02 10.16 4.82 5.14 25.10 0 01/31/03 10.53 2.52 25.11 104.37 1.37 02/19/03 11.49 0.7 16.97 52.94 -1.87 2/26/03 11.51 0.7 20.26 14.83 1.44 3/5/03 <11.51 <0.70 15 8.08 0.38
River Rise 5/8/02 9.78 > 8 days >2.76 10.6 -0.11 9/12/02 10.16 8 days 2.24 8.537 1.24 01/31/03 10.53 4 17.01 53.5 -0.07 02/19/03 11.49 1.3 14.46 4.45 -0.08 2/26/03 11.51 1.3 17.26 4.62 -0.08 3/5/03 <11.51 1 12.78 4.54 0.36
* Travel time (days) is based on Dean (1999) and Martin (2003) ** Measured activities of 222Rn and 226Ra ^ Activities calculated using the decay equation
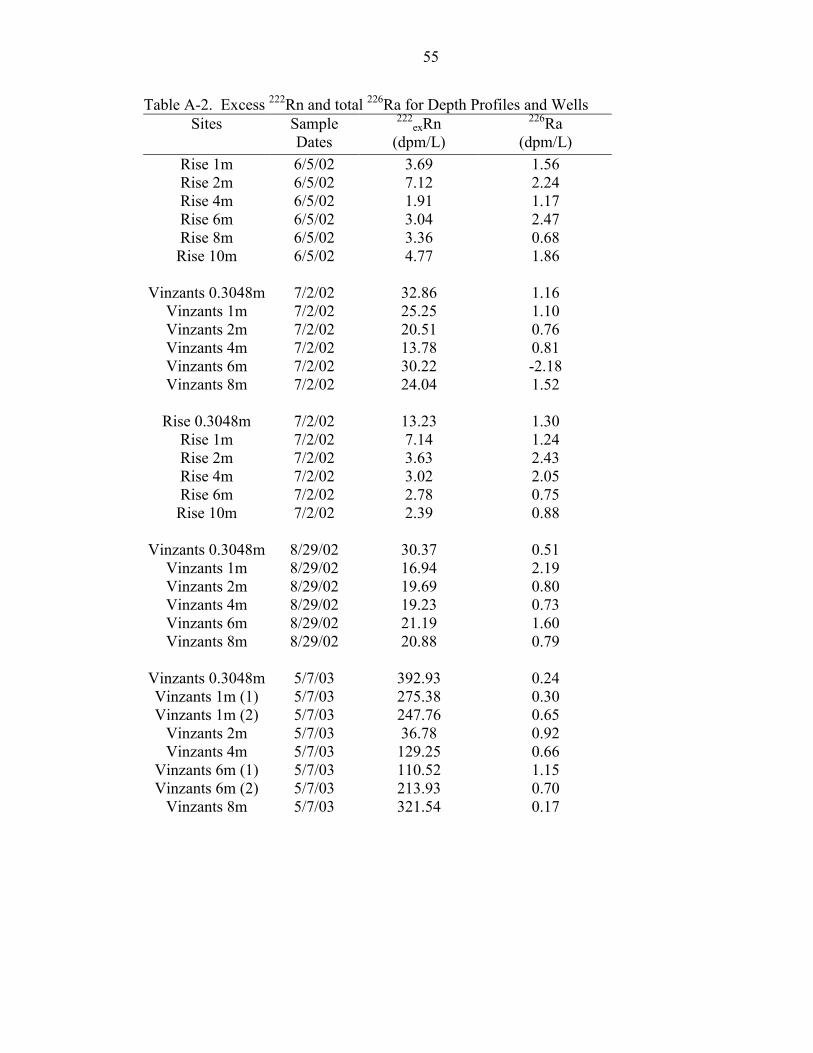
55
Table A-2. Excess 222Rn and total 226Ra for Depth Profiles and Wells Sites Sample
Dates 222
exRn (dpm/L)
226Ra (dpm/L)
Rise 1m 6/5/02 3.69 1.56 Rise 2m 6/5/02 7.12 2.24 Rise 4m 6/5/02 1.91 1.17 Rise 6m 6/5/02 3.04 2.47 Rise 8m 6/5/02 3.36 0.68 Rise 10m 6/5/02 4.77 1.86
Vinzants 0.3048m 7/2/02 32.86 1.16
Vinzants 1m 7/2/02 25.25 1.10 Vinzants 2m 7/2/02 20.51 0.76 Vinzants 4m 7/2/02 13.78 0.81 Vinzants 6m 7/2/02 30.22 -2.18 Vinzants 8m 7/2/02 24.04 1.52
Rise 0.3048m 7/2/02 13.23 1.30
Rise 1m 7/2/02 7.14 1.24 Rise 2m 7/2/02 3.63 2.43 Rise 4m 7/2/02 3.02 2.05 Rise 6m 7/2/02 2.78 0.75 Rise 10m 7/2/02 2.39 0.88
Vinzants 0.3048m 8/29/02 30.37 0.51
Vinzants 1m 8/29/02 16.94 2.19 Vinzants 2m 8/29/02 19.69 0.80 Vinzants 4m 8/29/02 19.23 0.73 Vinzants 6m 8/29/02 21.19 1.60 Vinzants 8m 8/29/02 20.88 0.79
Vinzants 0.3048m 5/7/03 392.93 0.24 Vinzants 1m (1) 5/7/03 275.38 0.30 Vinzants 1m (2) 5/7/03 247.76 0.65
Vinzants 2m 5/7/03 36.78 0.92 Vinzants 4m 5/7/03 129.25 0.66
Vinzants 6m (1) 5/7/03 110.52 1.15 Vinzants 6m (2) 5/7/03 213.93 0.70
Vinzants 8m 5/7/03 321.54 0.17

56
Table A-2. Continued Sites Sample
Dates 222
exRn (dpm/L)
226Ra (dpm/L)
Rise 0.3048m 5/7/03 31.55 0.22 Rise 1m (1) 5/7/03 123.60 0.49 Rise 1m (2) 5/7/03 8.79 0.98
Rise 2m 5/7/03 149.79 0.41 Rise 4m 5/7/03 186.74 0.14
Rise 6m (1) 5/7/03 27.76 0.13 Rise 6m (2) 5/7/03 23.24 0.78
Rise 8m 5/7/03 61.23 1.32 Rise 10m 5/7/03 110.25 -0.34
Well 1 4/30/03 1051.82 -7.08
Well 2 (1) 4/30/03 762 4.76 Well 2 (2) 4/30/03 625.87 1.94
Well 3 4/30/03 1120.69 0.77 Well 4 4/30/03 131.96 -0.36 Well 6 4/30/03 431.61 5.78 Well 7 4/30/03 293.61 1.49

57
Table A-3. Gas Exchange Equation Site Date Cd (dpm/L) Amount of Evasion
(dpm/L) Ogden Pond 5/8/02 22.40 0.15
9/12/02 18.19 0.13 1/30/03 48.43 0.17 2/19/03 20.31 0.01 2/26/03 24.23 0.02 3/5/03 17.93 0.01
Parener’s Sink 5/8/02 21.82 0.73 9/12/02 17.72 0.60 1/30/03 47.77 0.83 2/19/03 20.25 0.07 2/26/03 24.17 0.08 3/5/03 17.88 0.06
Big Sink 5/8/02 21.64 0.91 9/12/02 17.58 0.74 1/30/03 47.56 1.04 2/19/03 20.23 0.09 2/26/03 24.15 0.10 3/5/03 17.86 0.08
Jim Sink 5/8/02 21.48 1.07 9/12/02 17.45 0.87 1/30/03 47.38 1.22 2/19/03 20.18 0.14 2/26/03 24.08 0.17 3/5/03 17.81 0.13
Jug Lake 5/8/02 20.71 1.84 9/12/02 16.82 1.50 1/30/03 46.48 2.12 2/19/03 20.07 0.25 2/26/03 23.95 0.30 3/5/03 17.72 0.22
Hawg Sink 5/8/02 20.34 2.21 9/12/02 16.52 1.80 1/30/03 46.05 2.55 2/19/03 20.02 0.30 2/26/03 23.89 0.36 3/5/03 17.67 0.27

58
Table A-3. Continued Site Date Cd (dpm/L) Amount of Evasion
(dpm/L)
Two Hole Sink 5/8/02 20.31 2.24 9/12/02 16.50 1.82 1/30/03 46.02 2.58 2/19/03 20.02 0.30 2/26/03 23.89 0.36 3/5/03 17.67 0.27
Sweetwater Lake 5/8/02 19.65 2.90 9/12/02 15.97 2.35 1/30/03 45.23 3.37 2/19/03 19.92 0.40 2/26/03 23.77 0.48 3/5/03 17.59 0.35
River Rise 5/8/03 18.10 4.45 9/12/02 14.70 3.62 1/30/03 20.10 2.45 2/19/03 19.58 0.74 2/26/03 23.36 0.89 3/5/03 17.44 0.50

59
REFERENCES
Berelson, W. M., Hammond, D. E., and Fuller, C, 1982. Radon-222 as a tracer for mixing in the water column and benthic exchange in the southern California borderland. Earth and Planetary Science Letters 61: 41-54.
Bertin, C., Bourg, A. C. M., 1994. Radon-222 and Chloride as natural tracers of the infiltration of river water into an alluvial aquifer in which there is significant river/groundwater mixing. Environmental Science Technology 28: 794-798.
Boyer, D. G., Pasquarell, G. C., 1996. Agricultural land use effects on nitrate concentrations in a mature karst aquifer. Water Res. Bull. 32: 565-573.
Budd, D. A., Vacher, H. L., 2002. Facies control on matrix permeability in the upper Floridan Aquifer, West-Central Florida: Implications to diffuse flow. In Hydrogeology and Biology of Post-Paleozoic Carbonate Aquifers, Karst Waters Institute Special Publication 7, ed. J. B. Martin, C. M. Wicks, and I. D. Sasowsky, 14-24. Charles Town, West Virginia: Karst Waters Institute.
Bush, P. W., Johnston, R. H., 1988. Ground-water hydraulics, regional flow, and ground-water development of the Floridan Aquifer system in Florida and in parts of Georgia, South Carolina, and Alabama. U. S. Geological Survey: 80.
Chung, Y., 1973. Excess radon in the Santa Barbara Basin. Earth and Planetary Science Letters 17: 319-323.
Corbett, R. D., Burnett, W. C., Cable, P. H., Clark, S. B., 1997. Radon tracing of the groundwater input into Par Pond, Savannah River Site. Journal of Hydrology, 203: 209-227.
Crandall, C. A., 1996. Shallow ground-water quality in selected agricultural areas of south-central Georgia. U. S. Geological Survey Water Resources Investigative Report # 96-4083.
Dean, R. W., 1999. Surface and ground water mixing in a karst aquifer: An example from the Floridan Aquifer. M. S. Thesis, Gainesville, Florida, University of Florida, 74 p.
Drever, J. I., 1988. The Geochemistry of Natural Waters, 2nd edition. Englewood Cliffs, NJ, Prentice Hall, 437 p.

60
Ellins, K. K., Hisert, R. A., Kincaid, T. R., 1992. Hydrogeology of the western Santa Fe River Basin. Field Trip Guide, South Eastern Geological Society Spring Meeting, Gainesville, FL.
Ellins, K. K., Roman-Mas, A., Lee, R., 1990. Using 222Rn to examine groundwater/surface discharge interaction in the Rio Grande De Manati, Puerto Rico. Journal of Hydrology 115: 319-341.
Elsinger, R. J., Moore, W. S., 1983. Gas exchange in the Pee Dee River based on 222Rn evasion. Geophysical Research Letters 10:443-446.
Ford, D. C., Williams, P. W., 1989. Karst Geomorphology and Hydrology. Winchester, MA, Unwin Hyman, Ltd.
Ginn, B., 2002. Using Temperature and Water Elevation measurements to model conduit properties in karst Aquifers; An Example from the Santa Fe Sink-Rise System, Florida, senior undergraduate thesis, University of Florida, 23 p.
Gordon, S. L., 1998. Surface and groundwater mixing in an unconfined karst aquifer, Ichetucknee River ground water basin, Florida: Ph.D. Dissertation, University of Florida.
Halihan, T., Wicks, C. M., Engein, J. F., 1998. Physical response of a karst drainage basin to flood pulses: Example of the Devil's Icebox cave system (Missouri, USA). Journal of Hydrology. 204:24-36.
Hamada, H., 2000. Estimation of groundwater flow rate using the decay of 222Rn in a well. Journal of Environmental Radioactivity 47: 1-13.
Hamada, H., Komae, T., 1998. Analysis of recharge by paddy field irrigation using 222Rn concentration in groundwater as an indicator. Journal of Hydrology 205: 92-100.
Hisert, R. A., 1994. A multiple tracer approach to determine the ground and surface water relationships in the western Santa Fe River, Columbia County, Florida, Gainesville, FL, Ph.D. Dissertation, University of Florida: 213 p.
Hunn, J. D., Slack, L. J., 1983. Water resources of the Santa Fe River Basin, Florida. U. S. Geological Survey.
Hussain, N., Church, T. M., Kim, G., 1999. Use of 222Rn and 226Ra to trace groundwater discharge into the Chesapeake Bay. Marine Chemistry 65: 127-134.
Katz, B. G., 1992. Hydrochemistry of the Upper Floridan Aquifer, Florida. USGS Water Resources Investigation Report 91-4196, 37 p.
Kincaid, T. R., 1998, River water intrusion to the unconfined Floridan Aquifer, Environmental and Engineering Geoscience IV: 361-374.

61
Martin, J. B., Dean, R. W.,1999. Temperature as a natural tracer of short residence times for ground water in karst aquifers. Karst Modeling. A. N. Palmer, M. V. Palmer and I. D. Sasowsky, Karst Waters Institute Special Publication #5: 236-242.
Martin, J. B., Screaton, E. J., 2002. Exchange of matrix and conduit water with examples from the Floridan Aquifer, U.S. Geological Survey Karst Interest Group proceedings, St. Petersburg, Florida. Water Resources Investigations Report 01-4011, 38-44.
Martin, J. M., 2003. Quantification of the matrix hydraulic conductivity in the Santa Fe River Sink/Rise system with implications on the exchange of water between the matrix and conduit, Gainesville, FL. M. S. Thesis, University of Florida: 100p.
Miller, J. A., 1997. Hydrogeology of Florida: In: The Geology of Florida, eds. A. F. Randazzo and D. S. Jones, Gainesville, Florida: University Press of Florida, p. 69-88.
Padilla, A., Pulido-Bosch, A., Mangin, A., 1994. Relative importance of base flow and quick flow from hydrographs of karst springs. Ground Water 32: 267-277.
Puri, H. S., Vernon, R. O., 1964. Summary of the Geology of Florida and a guidebook to the classic exposures, Florida Geological Survey Special Publication #5.
Rogers, A. S., 1958. Physical behavior and geological control of radon in mountain streams, Geological Bulletin No. 1052-E, U. S. Geological Survey.
Ryan, M., Meiman, J., 1996. An examination of short-term variations in water quality at a karst spring in Kentucky. Ground Water 34, 1: 23-30.
Scott, T. M., 1992. A Geological Overview of Florida, Florida Geological Survey.
Skirvin, R. T., 1962. The underground course of the Santa Fe River near High Springs, Florida, Gainesville, FL. M. S. Thesis, University of Florida, 62 p.
Smart, C. C., 1988. Artificial tracer techniques for the determination of the structure of conduit aquifers. Groundwater 26: 445-453.
Smoak, J. M., Brenner, M., Allen, M. S., Shelskie, C. L., Leeper, D. A., 2000. Biological Accumulation of 226Ra in groundwater- augmented Florida Lake. Limnology and Oceanography 45, 3: 710-715.
Stringfield, V. T., LeGrand, H. E., 1966. Hydrology of limestone terrains in the coastal plains of the southeastern United States: Geological Society of America Special Paper 93, 43 p.
Tennelec, Operations Manual, 1985, Dual Radon Counting System, Oak Ridge, Tennessee.

62
Wherett, Judith L., 1992. Geologic characterization of soil gas radon concentrations in Florida and comparison with soil permeability parameters, Gainesville, FL. M. S. Thesis, University of Florida: 87p.
White, W. A., 1970. The geomorphology of the Florida Peninsula, Geological Bulletin #51.
White, W. B., 1999. Conceptual models for karstic aquifers. Karst Modeling. A. N. Palmer, M. V. Palmer and I. d. Sasowsky, Karst Waters Institute Special Publication #5: 11-16.

63
BIOGRAPHICAL SKETCH
Lauren A. Smith was born to Roger D. Smith and Martha A. Smith on August 30,
1977, in Ft. Hood, Texas. Shortly after her birth, her family moved to Dublin, Georgia,
and has lived there ever since. After graduating from Dublin High School in 1995,
Lauren attended Furman University in Greenville, South Carolina, where she graduated,
in 2000, with a B. S. in earth and environmental science. Later that year, she moved to
Florida to begin graduate school at the University of Florida. She worked as a teaching
assistant for undergraduate classes and as a research assistant. She is currently seeking
employment in the environmental industry.