Embed Size (px)
Citation preview
Draft Report—Do not cite without authors’ permission. Created on 11/29/2005 1:37 PM
The US South’s Timber Sector in 2005: A prospective analysis of recent change By David N. Wear1, Douglas R. Carter2, and Jeffrey Prestemon3
The issues addressed in this report were initially raised by an expert panel convened to examine changes in timber markets in the US South. Members of the expert panel were: Robert Abt, North Carolina State University Doug Carter, University of Florida Michael Clutter, University of Georgia Jim Gan, Texas A&M University Ian Munn, Mississippi State University David Newman, University of Georgia Jeff Prestemon, USDA Forest Service Jacek Siry, University of Georgia David Wear, USDA Forest Service 1- Project Leader, Southern Research Station, USDA Forest Service ([email protected]) 2- Associate Professor, University of Florida ([email protected]) 3- Research Forester, Southern Research Station, USDA Forest Service
([email protected]) Correspondence Address: David N. Wear USDA Forest Service PO Box 12254 Research Triangle Park, NC 27709 Phone: 919-549-4011 Fax: 919-549-4047 Acknowledgements: The research reported here was supported by the Southern Group of State Foresters and the USDA Forest Service through the Southern Region and the Southern Research Station.
1

Draft Report—Do not cite without authors’ permission. Created on 11/29/2005 1:37 PM
The US South’s Timber Sector in 2005: A prospective analysis of recent change Table of Contents
Introduction..................................................................................................................... 6 Recent Trends in the Timber Sector ............................................................................... 8
Harvest Quantities....................................................................................................... 8 Timber Prices ............................................................................................................ 11 Summary of Changes................................................................................................ 13 Key Observations—Recent Trends........................................................................... 16
Demand Factors ............................................................................................................ 17 Competing Non-wood Products................................................................................ 17 Domestic Demands ................................................................................................... 19 International Trade in Wood Products...................................................................... 28 Key Observations--Demand...................................................................................... 40
Supply Factors .............................................................................................................. 42 Competing Uses of Land .......................................................................................... 42 Timberland Area ....................................................................................................... 44 Timberland Investments............................................................................................ 46 Landownership Changes........................................................................................... 49 Key Observations--Supply........................................................................................ 52
Conclusions and Implications ....................................................................................... 54 Literature Cited ............................................................................................................. 56 Appendix A. Data Notes .............................................................................................. 59
Recent Trends in the Forest Sector ........................................................................... 59 Demand Factors ........................................................................................................ 59 Supply Factors .......................................................................................................... 59
2
Draft Report—Do not cite without authors’ permission. Created on 11/29/2005 1:37 PM
List of Figures
Figure 1. Roundwood harvests in the US South by product (Sources: USDA Forest Service Timber Product Output Reports). .................................................................. 9
Figure 2. Roundwood production in the US South, selected products (Sources: USFS Timber Product Output Reports, see Appendix A for explanation of interpolation procedures)................................................................................................................ 10
Figure 3. Roundwood production in the US South, selected products (Sources: USDA Forest Service Timber Product Output Reports; see Appendix 1 for explanation of interpolation procedures). ......................................................................................... 11
Figure 4. Real stumpage prices in the US South by product (Source: Timber Mart South)........................................................................................................................ 12
Figure 5. Hardwood pulpwood harvest and price in the US South (Source: Timber Mart South and various RPA Timber Product Output reports). ........................................ 13
Figure 6. Softwood sawtimber harvest and price in the US South (Source: Timber Mart South and various RPA Timber Product Output reports). ........................................ 14
Figure 7. Softwood pulpwood harvest and price in the US South (Source: Timber Mart South and various RPA Timber Product Output reports). ........................................ 15
Figure 8. Engineered wood products production (Source: The Engineered Wood Association). ............................................................................................................. 19
Figure 8. Distance in miles by county from the forested center of the county to the closest pulpmill or chipmill. Yellow dots are pulpmills and chipmills within the southern states. Note that the universe of all pulpmills and chipmills within the U.S. and a circuity factor of 1.4 were used in the distance calculation (Source: R. Huggett, preliminary findings, economics of biomass removals, USFS, Research Triangle Park, North Carolina)................................................................................................ 20
Figure 10. US pulp output processing capacity, 1961-2000 (Source: Smith et al. 2003).21 Figure 11. Pulp mill capacity in the US and US South, 1983-2003 (Sources: Forest
Resources Association, USDA Southern Research Station, Pulp & Paper North American Factbook, Timber Mart South)................................................................. 22
Figure 12. Pulp production for various countries, 1995 and 2002 (Sources: Pulp and Paper International, Paperloop.com)......................................................................... 22
Figure 13. Average annual rates of change in pulp production for various countries, 1995 to 2002 (Sources: Pulp and Paper International, Paperloop.com). .......................... 23
Figure 14. Kraft linerboard mills manufacturing costs, 2003 (Source: Jaakko Poyry Management Consulting).......................................................................................... 24
Figure 15. Delivered coniferous pulpwood prices (Source: Wood Resources International)............................................................................................................. 25
Figure 16. Delivered non-coniferous pulpwood prices (Source: Wood Resources International)............................................................................................................. 25
Figure 17. Average distance in miles by county from the forested center of the county to the closest five sawmills within 150 miles. Yellow dots are sawmills within the southern states. Note that the universe of all sawmills within the U.S. were used in the distance calculation. (Source: R. Huggett, preliminary findings, economics of biomass removals, USFS Research Triangle Park, North Carolina) ........................ 26
3
Draft Report—Do not cite without authors’ permission. Created on 11/29/2005 1:37 PM
Figure 18. Softwood sawmill capacity (Source: Spelter and Alderman, 2003).............. 27 Figure 19. Panel capacity in the US South (Source: McKeever and Spelter 1998)....... 27 Figure 20. Southern panel production (source: The Engineered Wood Association). .. 28 Figure 21. US broad dollar index (Source: US Federal Reserve).................................... 29 Figure 22. US trade in wood pulp and the balance of trade (BOT) (Source: US
International Trade Commission). ............................................................................ 30 Figure 23. Wood pulp imports into the US (Source: US International Trade
Commission). ............................................................................................................ 30 Figure 24. Wood pulp imports into southern customs districts (Source: US International
Trade Commission)................................................................................................... 31 Figure 25. Wood pulp imports into southern customs districts (Source: US International
Trade Commission)................................................................................................... 31 Figure 26. Wood chips imports into the US (Source: US International Trade
Commission). ............................................................................................................ 32 Figure 27. Wood chips imports into southern customs districts in dollars (Source: US
International Trade Commission). ............................................................................ 33 Figure 28. Wood chips imports into southern customs districts in tons (Source: US
International Trade Commission) ............................................................................. 33 Figure 29. Wood chips imports into the US and the balance of trade (BOT) (Source: US
International Trade Commission). ............................................................................ 34 Figure 31. US wood chips exports from southern customs districts in dollars (Source:
US International Trade Commission). ...................................................................... 35 Figure 32. US wood chips exports from southern customs districts in tons (Source: US
International Trade Commission). ............................................................................ 36 Figure 33. Sawnwood imports and the balance of trade (BOT) (Source: US International
Trade Commission)................................................................................................... 37 Figure 34. Exports of US hardwood lumber to various regions (1989-2004). Source:
FAS Website. ............................................................................................................ 38 Figure 35. US lumber exports from southern customs districts (Source: US International
Trade Commission)................................................................................................... 39 Figure 36. Particleboard, OSB and waferboard imports and the balance of trade (BOT)
(Source: US International Trade Commission)........................................................ 40 Figure 37. Change in forest area 1945-1992 by State (Source: USFS Forest Inventory
and Analysis (FIA) survey data). .............................................................................. 43 Figure 39. Acres by forest management type (Source: FIA data summarized by Conner
and Hartsell 2002)..................................................................................................... 45 Figure 39. Real prices of hardwood and softwood pulpwood in the US South (Source:
Timber Mart South). ................................................................................................. 46 Figure 41. Total area planted in trees in the US South, all ownerships (industry,
nonindustrial private, and public) and the industry ownership (Sources: 1945-1999: Robert F. Moulton (2000 [compiled from annual USDA Forest Service tree planting reports; including estimates by J. Prestemon for industry (Arkansas 1954; Florida 1981; Georgia 1954, 1982; Louisiana 1954, 1981; Mississippi 1954; Texas 1981)]; 2000-2004: Steve Chapman, Georgia Forestry Commission (2005)). ..................... 48
Figure 42. Total tree planting in the US South with estimates of both expansion and replacement planting (see Appendix A). .................................................................. 49
4

Draft Report—Do not cite without authors’ permission. Created on 11/29/2005 1:37 PM
Figure 43. Forecast of the percent of industry timberland in a land conversion-value class in Georgia, 2010 (Source: Wear and Newman 2004)............................................... 51
5
Draft Report—Do not cite without authors’ permission. Created on 11/29/2005 1:37 PM
Introduction
Timber production in the southeastern United States has grown in absolute terms and relative to other regions of the country since the 1970’s. At the turn of the twenty first century, the South produced about sixty percent of all wood products in the US (Wear and Greis 2002). Over this period, the region has demonstrated strong comparative advantage in producing a renewable timber resource, as management has shifted from mining of volunteer second growth forests to intensively managed forest plantations. Forest products remain an important part of southern rural economies. While the timber growing sector experienced steady expansion from the late 1960’s until the late 1990’s, recent changes in these markets have raised questions about the future. This report intends to examine these recent changes in timber markets and assess the implications for the future. The coincidence of several factors has altered forest products markets since the late 1990’s. Industry consolidations changed land ownership across a large portion of the region’s most productive timberland. Changes in domestic consumption patterns, coupled with shifts in international trade, shifted timber demands. Depreciation and closure of older processing facilities, especially in the paper industry, accentuates many of these factors and changed the spatial arrangement of timber markets within the region. These observations have led many in the forestry community to conclude that the future of timber markets in the US in general and in the South in particular is one of decline. At the same time, other developments seem to bode well for southern forest products industries. Production of newer, engineered wood products continues to grow. Timber supply is strong and appears to have expanded throughout the 1990’s in spite of competing land use pressures. Intensive forest management continues to expand yields and the potential for growth appears to persist. Indeed, long run forecasts of general economic and timber market activity predict expanding domestic timber demand over the coming decades. Any expansion in timber production is expected to be concentrated in the South. Forecasts from both the Southern Forest Resource Assessment (Wear and Greis 2002) and the 2000 RPA Timber Assessment (Haynes 2003) suggest that southern forest landowners, facing strong future markets, will continue to invest in and expand their timber production capacity. The objective of this report is to provide an objective assessment of long-run trends and recent (5 year) changes in timber markets in the southeastern United States. Such an assessment is necessary to reconcile: (1) the recent decline in prices and production of some wood products, and (2) long-run optimism regarding the prospects for timber demand and productivity in the South. This assessment relies strictly on the interpretation of historical data and not on forecasting models. The focus is exclusively on understanding the most recent historical episode and placing it into the context of other developments in the world’s markets for wood products.
6

Draft Report—Do not cite without authors’ permission. Created on 11/29/2005 1:37 PM
This report is organized as follows. We start by charting the most basic timber market indicators: price and harvest quantity. Patterns of price and quantity change provide insights into overall market direction. We then explore a set of factors that affect the demand for timber products, including domestic conditions and forest products trade. This analysis of demand is then followed by an analysis of timber supply fundamentals, which focuses on land use, forest investment, and timberland ownership. We conclude with a synthesis of these findings and implications for the future of southern timber markets.
7
Draft Report—Do not cite without authors’ permission. Created on 11/29/2005 1:37 PM
Recent Trends in the Timber Sector
Our objective in this section is to measure how timber markets have changed in the US South since detailed records have been kept, with emphasis placed on the most recent changes. Our approach is to use timber harvests and prices as compact, summary indicators of the sector’s evolution over time. We begin by examining how harvest quantities and then prices have changed over time. We put these changes into context by decomposing quantity and price changes into their root causes, the shifts in supply and demand. The remaining sections of this report will examine several factors that have influenced supply and demand over this period.
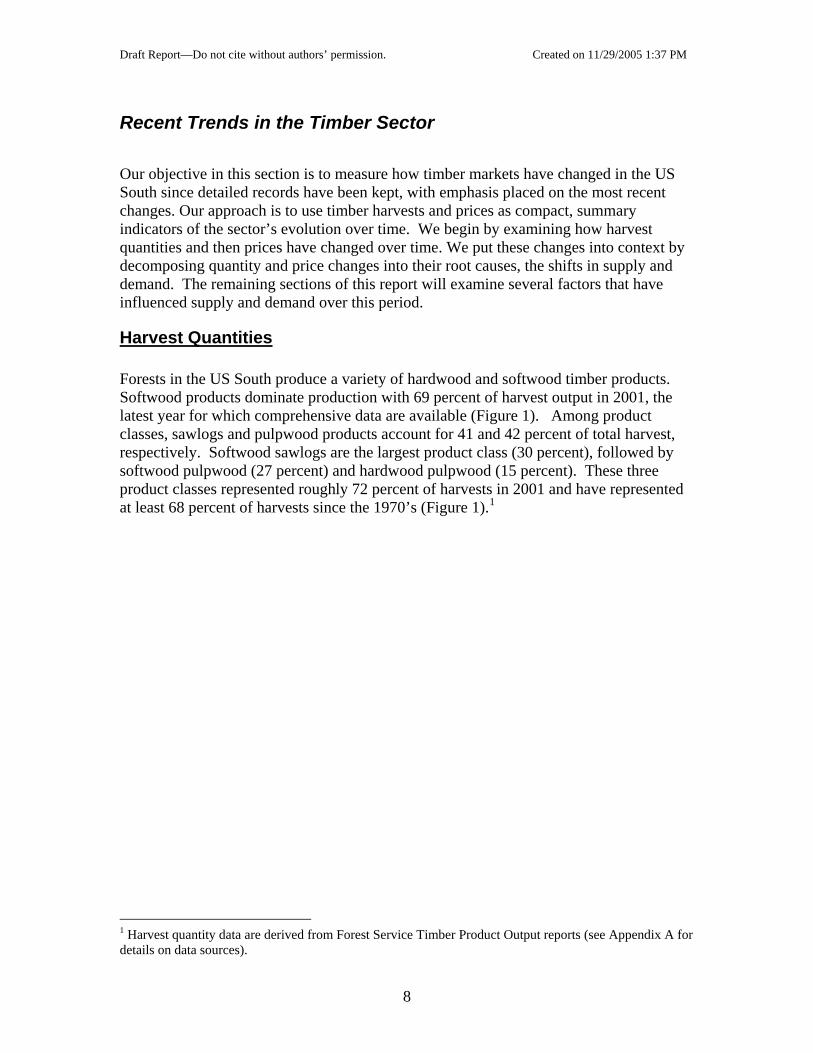
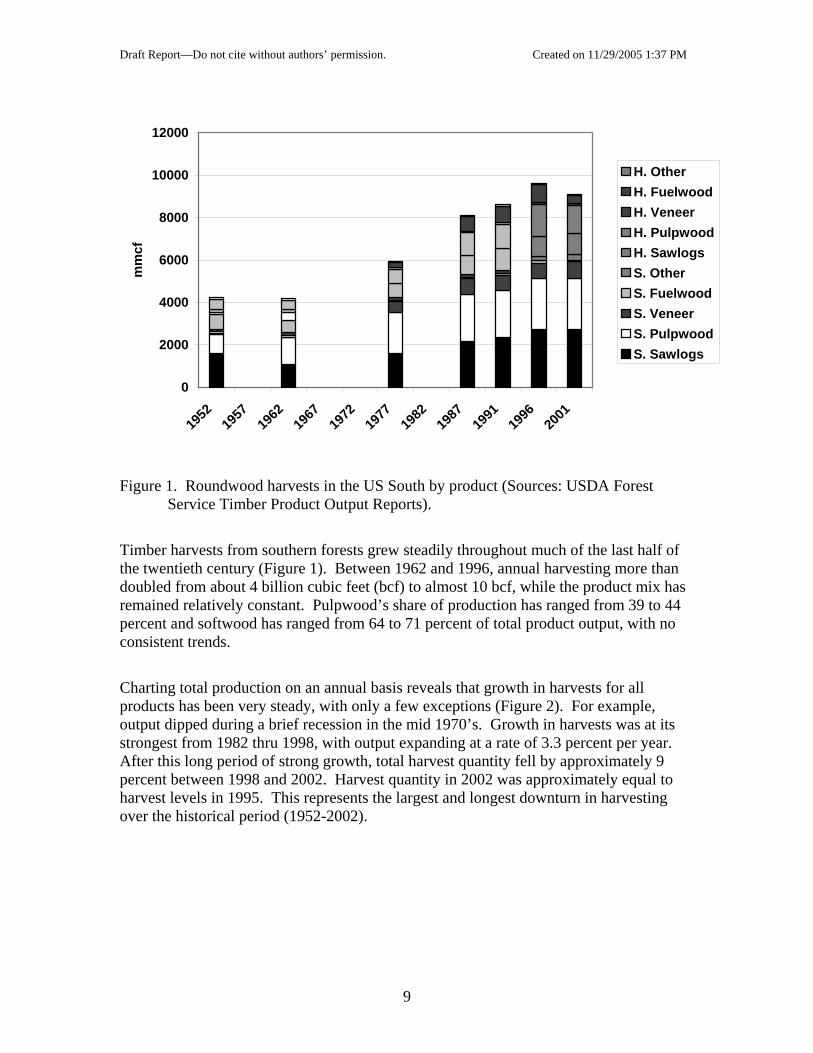
Harvest Quantities Forests in the US South produce a variety of hardwood and softwood timber products. Softwood products dominate production with 69 percent of harvest output in 2001, the latest year for which comprehensive data are available (Figure 1). Among product classes, sawlogs and pulpwood products account for 41 and 42 percent of total harvest, respectively. Softwood sawlogs are the largest product class (30 percent), followed by softwood pulpwood (27 percent) and hardwood pulpwood (15 percent). These three product classes represented roughly 72 percent of harvests in 2001 and have represented at least 68 percent of harvests since the 1970’s (Figure 1).1
1 Harvest quantity data are derived from Forest Service Timber Product Output reports (see Appendix A for details on data sources).
8
Draft Report—Do not cite without authors’ permission. Created on 11/29/2005 1:37 PM
0
2000
4000
6000
8000
10000
12000
1952
1957
1962
1967
1972
1977
1982
1987
1991
1996
2001
mm
cf
H. OtherH. FuelwoodH. VeneerH. PulpwoodH. SawlogsS. OtherS. FuelwoodS. VeneerS. PulpwoodS. Sawlogs
Figure 1. Roundwood harvests in the US South by product (Sources: USDA Forest Service Timber Product Output Reports).
Timber harvests from southern forests grew steadily throughout much of the last half of the twentieth century (Figure 1). Between 1962 and 1996, annual harvesting more than doubled from about 4 billion cubic feet (bcf) to almost 10 bcf, while the product mix has remained relatively constant. Pulpwood’s share of production has ranged from 39 to 44 percent and softwood has ranged from 64 to 71 percent of total product output, with no consistent trends.
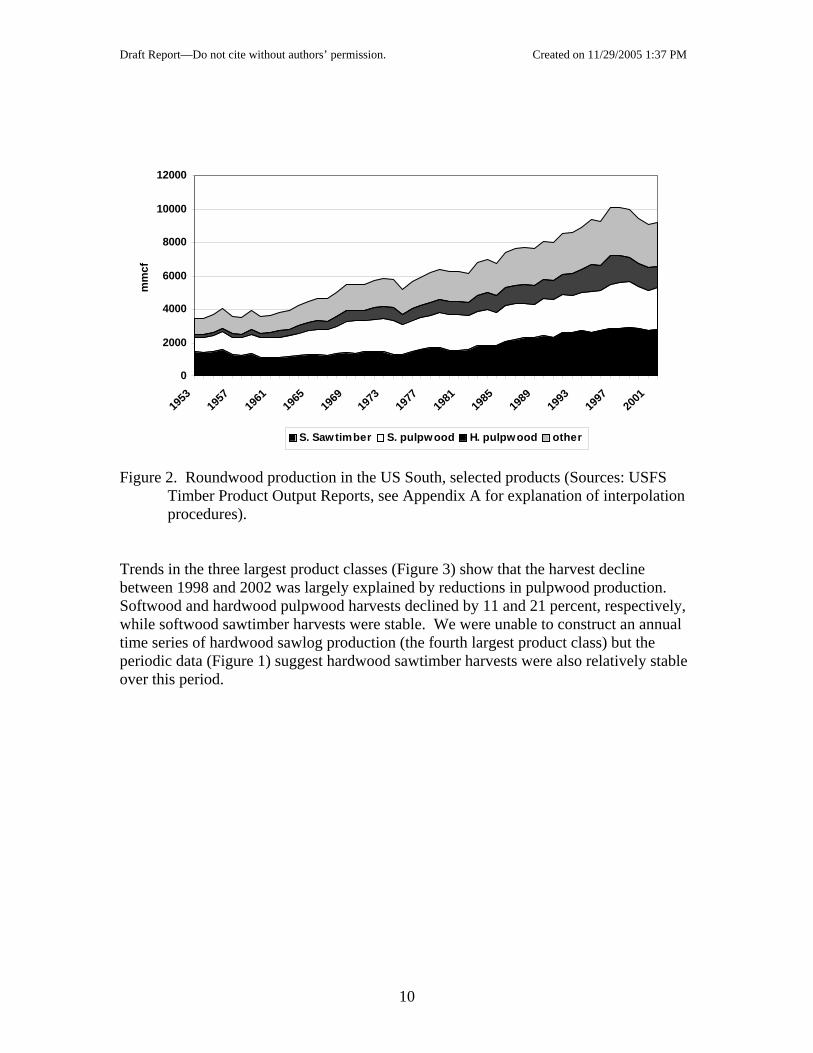
Charting total production on an annual basis reveals that growth in harvests for all products has been very steady, with only a few exceptions (Figure 2). For example, output dipped during a brief recession in the mid 1970’s. Growth in harvests was at its strongest from 1982 thru 1998, with output expanding at a rate of 3.3 percent per year. After this long period of strong growth, total harvest quantity fell by approximately 9 percent between 1998 and 2002. Harvest quantity in 2002 was approximately equal to harvest levels in 1995. This represents the largest and longest downturn in harvesting over the historical period (1952-2002).
9
Draft Report—Do not cite without authors’ permission. Created on 11/29/2005 1:37 PM
0
2000
4000
6000
8000
10000
12000
1953
1957
1961
1965
1969
1973
1977
1981
1985
1989
1993
1997
2001
mm
cf
S. Sawtimber S. pulpwood H. pulpwood other
Figure 2. Roundwood production in the US South, selected products (Sources: USFS
Timber Product Output Reports, see Appendix A for explanation of interpolation procedures).
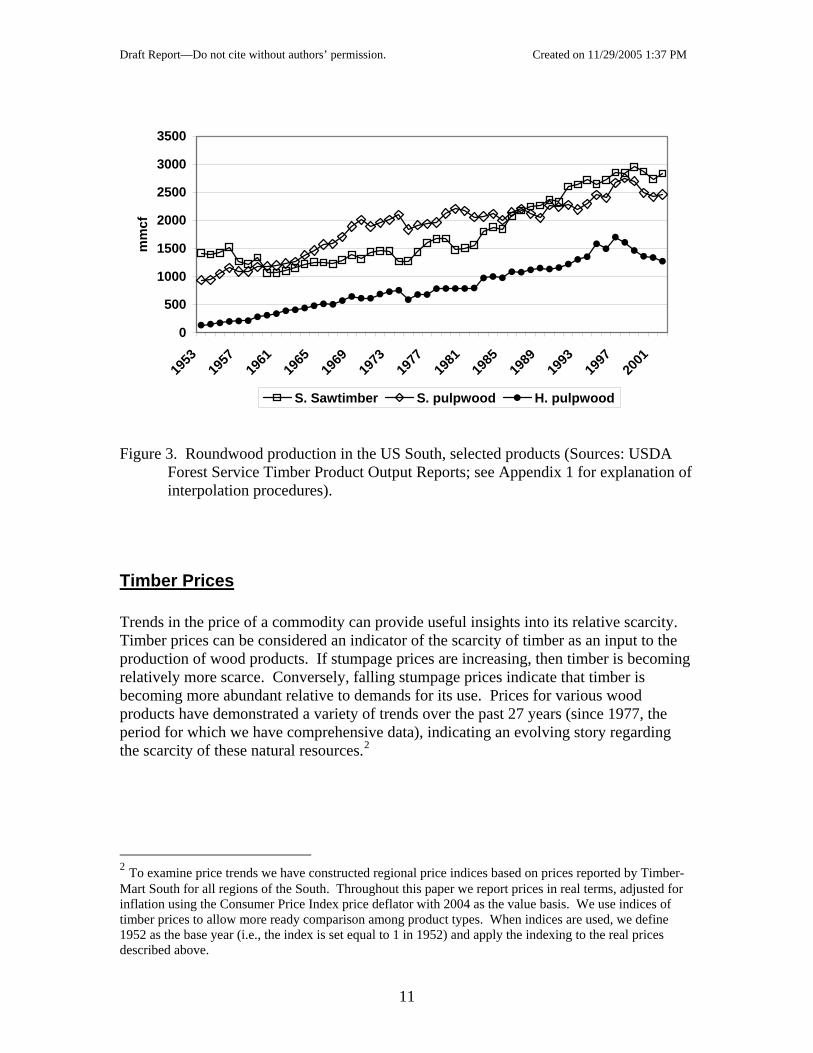
Trends in the three largest product classes (Figure 3) show that the harvest decline between 1998 and 2002 was largely explained by reductions in pulpwood production. Softwood and hardwood pulpwood harvests declined by 11 and 21 percent, respectively, while softwood sawtimber harvests were stable. We were unable to construct an annual time series of hardwood sawlog production (the fourth largest product class) but the periodic data (Figure 1) suggest hardwood sawtimber harvests were also relatively stable over this period.
10
Draft Report—Do not cite without authors’ permission. Created on 11/29/2005 1:37 PM
0
500
1000
1500
2000
2500
3000
3500
1953
1957
1961
1965
1969
1973
1977
1981
1985
1989
1993
1997
2001
mm
cf
S. Sawtimber S. pulpwood H. pulpwood
Figure 3. Roundwood production in the US South, selected products (Sources: USDA
Forest Service Timber Product Output Reports; see Appendix 1 for explanation of interpolation procedures).
Timber Prices Trends in the price of a commodity can provide useful insights into its relative scarcity. Timber prices can be considered an indicator of the scarcity of timber as an input to the production of wood products. If stumpage prices are increasing, then timber is becoming relatively more scarce. Conversely, falling stumpage prices indicate that timber is becoming more abundant relative to demands for its use. Prices for various wood products have demonstrated a variety of trends over the past 27 years (since 1977, the period for which we have comprehensive data), indicating an evolving story regarding the scarcity of these natural resources.2
2 To examine price trends we have constructed regional price indices based on prices reported by Timber-Mart South for all regions of the South. Throughout this paper we report prices in real terms, adjusted for inflation using the Consumer Price Index price deflator with 2004 as the value basis. We use indices of timber prices to allow more ready comparison among product types. When indices are used, we define 1952 as the base year (i.e., the index is set equal to 1 in 1952) and apply the indexing to the real prices described above.
11
Draft Report—Do not cite without authors’ permission. Created on 11/29/2005 1:37 PM
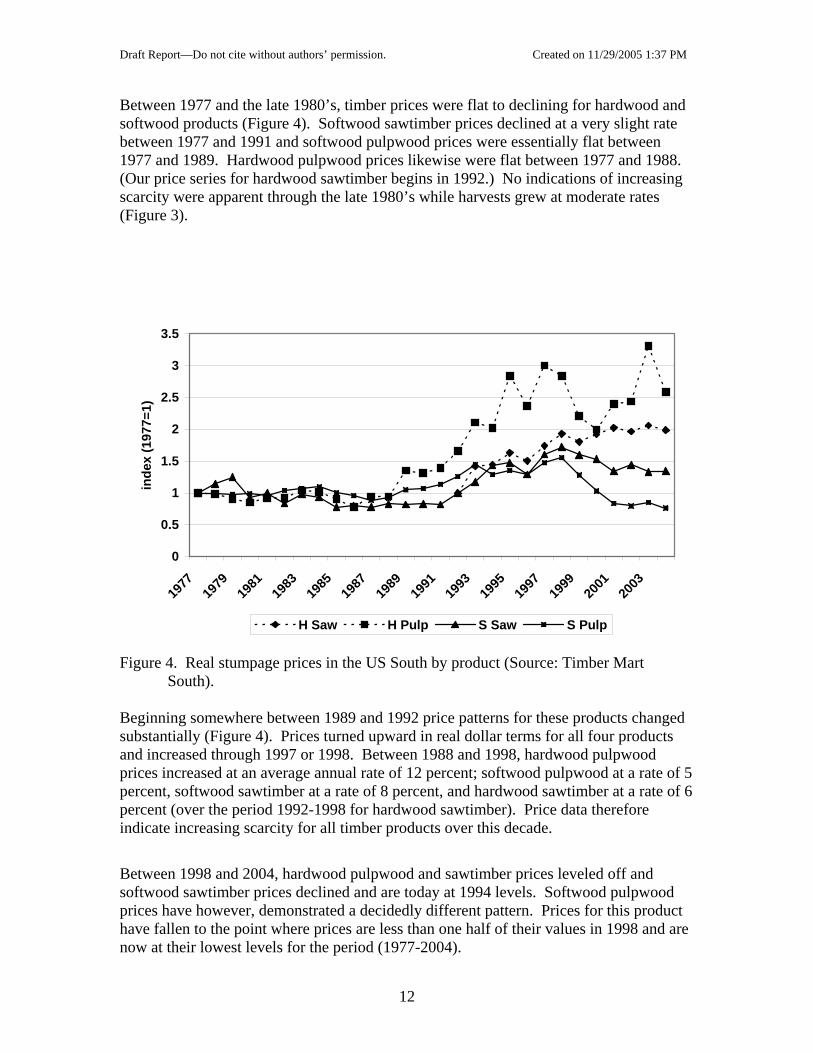
Between 1977 and the late 1980’s, timber prices were flat to declining for hardwood and softwood products (Figure 4). Softwood sawtimber prices declined at a very slight rate between 1977 and 1991 and softwood pulpwood prices were essentially flat between 1977 and 1989. Hardwood pulpwood prices likewise were flat between 1977 and 1988. (Our price series for hardwood sawtimber begins in 1992.) No indications of increasing scarcity were apparent through the late 1980’s while harvests grew at moderate rates (Figure 3).
0
0.5
1
1.5
2
2.5
3
3.5
1977
1979
1981
1983
1985
1987
1989
1991
1993
1995
1997
1999
2001
2003
inde
x (1
977=
1)
H Saw H Pulp S Saw S Pulp
Figure 4. Real stumpage prices in the US South by product (Source: Timber Mart South).
Beginning somewhere between 1989 and 1992 price patterns for these products changed substantially (Figure 4). Prices turned upward in real dollar terms for all four products and increased through 1997 or 1998. Between 1988 and 1998, hardwood pulpwood prices increased at an average annual rate of 12 percent; softwood pulpwood at a rate of 5 percent, softwood sawtimber at a rate of 8 percent, and hardwood sawtimber at a rate of 6 percent (over the period 1992-1998 for hardwood sawtimber). Price data therefore indicate increasing scarcity for all timber products over this decade.
Between 1998 and 2004, hardwood pulpwood and sawtimber prices leveled off and softwood sawtimber prices declined and are today at 1994 levels. Softwood pulpwood prices have however, demonstrated a decidedly different pattern. Prices for this product have fallen to the point where prices are less than one half of their values in 1998 and are now at their lowest levels for the period (1977-2004).
12
Draft Report—Do not cite without authors’ permission. Created on 11/29/2005 1:37 PM
Summary of Changes
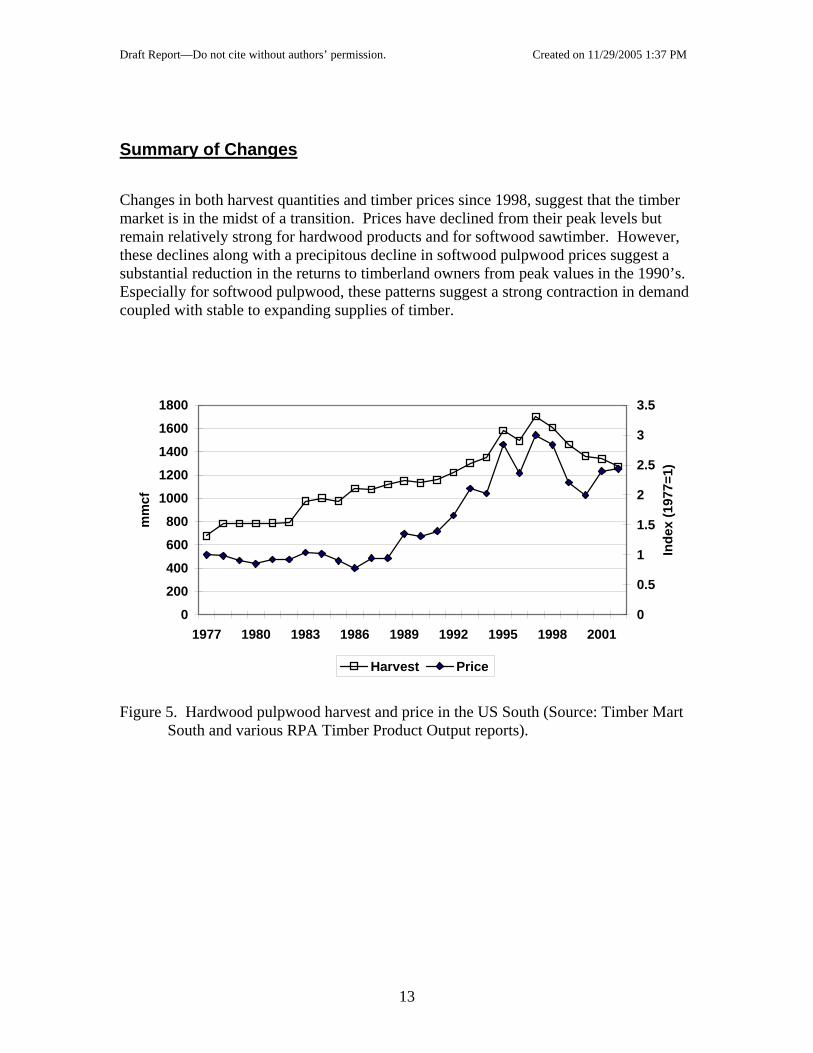
Changes in both harvest quantities and timber prices since 1998, suggest that the timber market is in the midst of a transition. Prices have declined from their peak levels but remain relatively strong for hardwood products and for softwood sawtimber. However, these declines along with a precipitous decline in softwood pulpwood prices suggest a substantial reduction in the returns to timberland owners from peak values in the 1990’s. Especially for softwood pulpwood, these patterns suggest a strong contraction in demand coupled with stable to expanding supplies of timber.
0
200
400
600
800
1000
1200
1400
1600
1800
1977 1980 1983 1986 1989 1992 1995 1998 2001
mm
cf
0
0.5
1
1.5
2
2.5
3
3.5
Inde
x (1
977=
1)Harvest Price
Figure 5. Hardwood pulpwood harvest and price in the US South (Source: Timber Mart
South and various RPA Timber Product Output reports).
13
Draft Report—Do not cite without authors’ permission. Created on 11/29/2005 1:37 PM
0
500
1000
1500
2000
2500
3000
3500
1977 1980 1983 1986 1989 1992 1995 1998 2001
mm
cf
0
0.2
0.4
0.6
0.8
1
1.2
1.4
1.6
1.8
2
Inde
x (1
977=
1)
Harvest Price
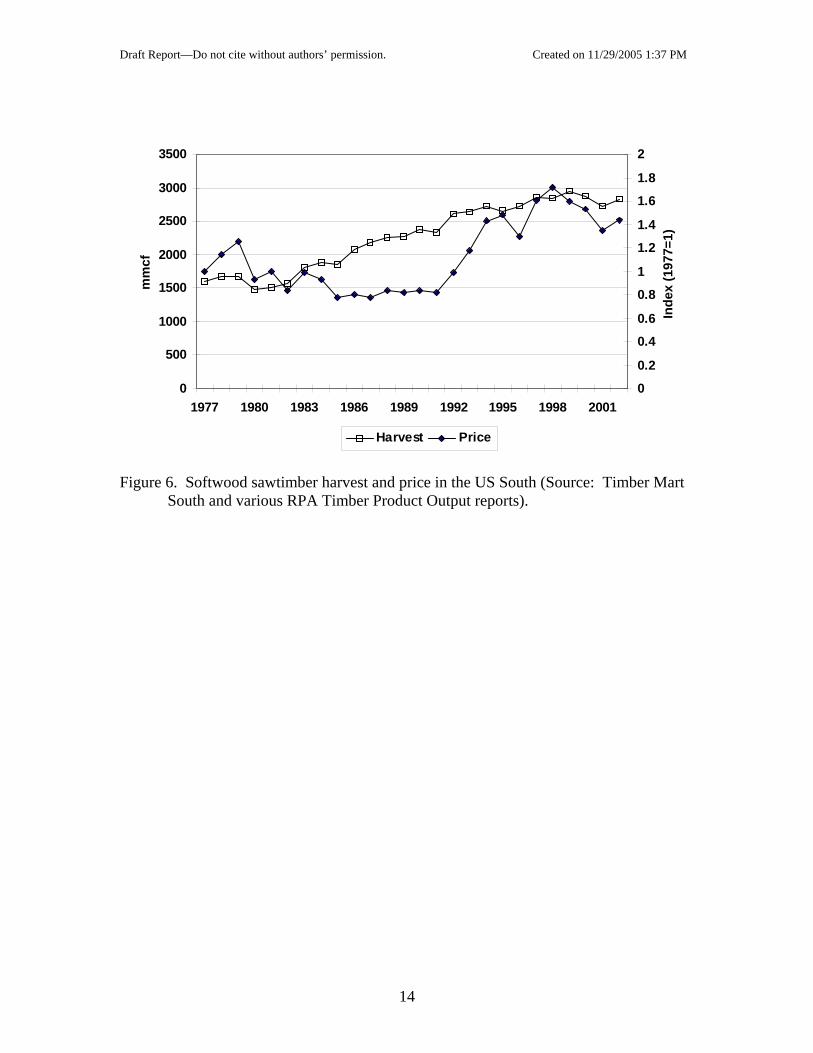
Figure 6. Softwood sawtimber harvest and price in the US South (Source: Timber Mart South and various RPA Timber Product Output reports).
14
Draft Report—Do not cite without authors’ permission. Created on 11/29/2005 1:37 PM
0.00
500.00
1000.00
1500.00
2000.00
2500.00
3000.00
1977 1980 1983 1986 1989 1992 1995 1998 2001
mm
cf
0
0.2
0.4
0.6
0.8
1
1.2
1.4
1.6
1.8
Inde
x (1
977=
1)
Harvest Price
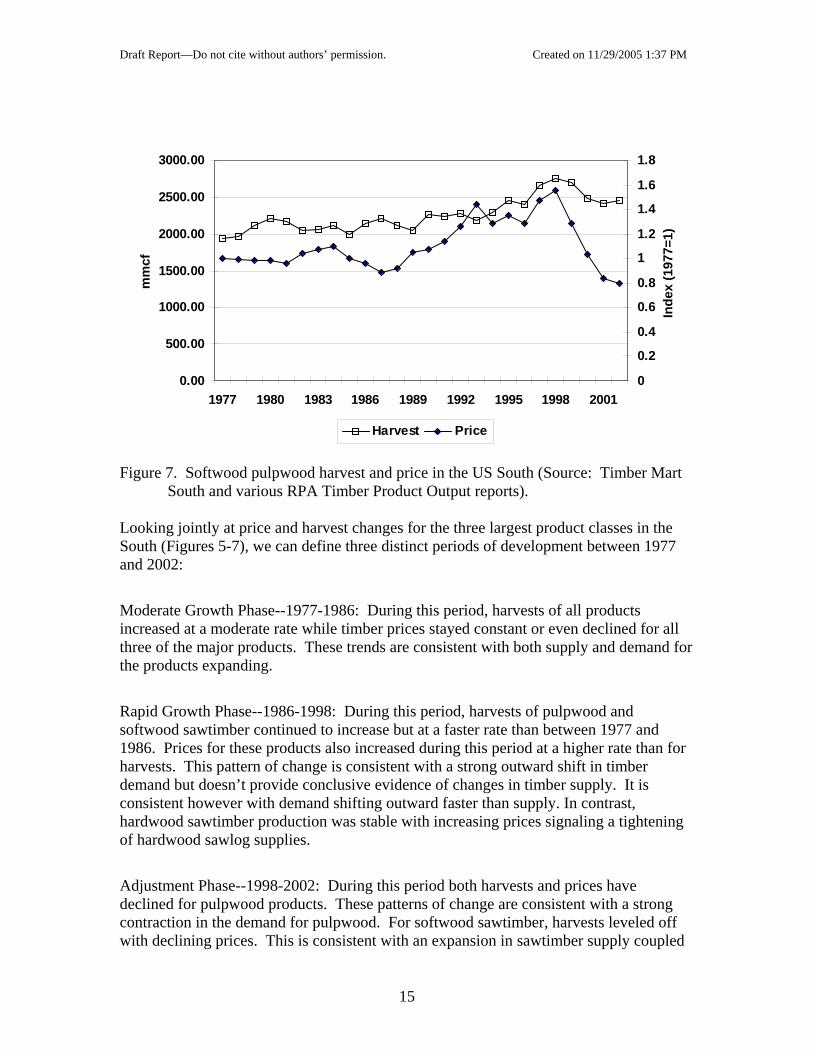
Figure 7. Softwood pulpwood harvest and price in the US South (Source: Timber Mart South and various RPA Timber Product Output reports).
Looking jointly at price and harvest changes for the three largest product classes in the South (Figures 5-7), we can define three distinct periods of development between 1977 and 2002:
Moderate Growth Phase--1977-1986: During this period, harvests of all products increased at a moderate rate while timber prices stayed constant or even declined for all three of the major products. These trends are consistent with both supply and demand for the products expanding.
Rapid Growth Phase--1986-1998: During this period, harvests of pulpwood and softwood sawtimber continued to increase but at a faster rate than between 1977 and 1986. Prices for these products also increased during this period at a higher rate than for harvests. This pattern of change is consistent with a strong outward shift in timber demand but doesn’t provide conclusive evidence of changes in timber supply. It is consistent however with demand shifting outward faster than supply. In contrast, hardwood sawtimber production was stable with increasing prices signaling a tightening of hardwood sawlog supplies.
Adjustment Phase--1998-2002: During this period both harvests and prices have declined for pulpwood products. These patterns of change are consistent with a strong contraction in the demand for pulpwood. For softwood sawtimber, harvests leveled off with declining prices. This is consistent with an expansion in sawtimber supply coupled
15
Draft Report—Do not cite without authors’ permission. Created on 11/29/2005 1:37 PM
with a decline in demand. Limited data for hardwood sawtimber indicates stable harvests and prices over this period.
In the subsequent sections of this paper, we examine various demand and supply factors that have likely influenced the markets for timber products in the South, with attention focused on evaluating the changes during the Adjustment Phase (1998-2002).
Key Observations—Recent Trends
• With very little variance, total timber production grew between 1962 and 1998. • Between 1998 and 2002, total timber production declined by about 9 percent;
back to 1995 levels. • Prices for softwood products declined between 1998 and 2004, dramatically so for
softwood pulpwood. Softwood pulpwood prices are, in inflation adjusted terms, at their lowest levels since 1977. Declines in softwood capacity and paper industry consolidation combine to leave no expectations of future softwood pulpwood price increases.
• Prices for hardwood products have not turned downward. • Based on price and quantity patterns, we identify three phases of development in
southern timber markets: 1) a moderate growth phase from 1977 to 1986, 2) a rapid growth phase between 1986 and 1998, and 3) an adjustment phase between 1998 and 2004.
• At a minimum we can say the following about market dynamics during each phase: 1) the moderate growth phase was characterized by expanding demand and supply, 2) the rapid growth phase was dominated by growth in demand outstripping supply growth for wood products, and 3) the adjustment phase was dominated by declines in demand.
• During the rapid growth period, hardwood sawtimber output grew only slightly with steady growth in prices, indicating a possible contraction of available hardwood sawtimber inventories and therefore supply.
16
Draft Report—Do not cite without authors’ permission. Created on 11/29/2005 1:37 PM
Demand Factors
Demand is an economic concept that relates the consumption of a commodity to its price. Elementary economic theory indicates that less of a commodity is consumed at a higher price and that charting all the possible price-consumption combinations defines a demand curve. This curve, however, can be repositioned based on many factors other than the commodity’s price—e.g., income, prices of substitutes for the commodity, and changing tastes. Here we examine demands for timber products by examining various factors that can shift the demand curves, in particular domestic demand curves. We look especially at substitution possibilities, production capacity, and international trade as important indicators of changes in domestic demand. Wood products are one of the many commodities that are used to produce final consumer products such as homes or paper and related products. Therefore, the demand for wood products is derived from the demand for final products into which they are a material input. Wood products compete with other construction inputs such as concrete, steel, aluminum, plastics or other fibers. We therefore need to account for these commodities when evaluating changes in wood products markets. We also need to account for the emergence of engineered wood products, such as oriented strand board, which can utilize smaller diameter trees, as substitutes for traditional wood products. In this section, we examine the structure of demand for timber in the southeastern United States. We start by examining the position of wood products relative to competing commodities in the US. This includes an examination of trends in substitution and in the prices of substitute products. We then examine the demand for timber derived from the domestic demands for solid wood products. Here we focus especially on sawtimber and pulpwood products and use domestic production capacity as an indicator of medium to long run demand. We close this section on demand by examining international trade including exports and imports of final goods and raw materials.
Competing Non-wood Products The potential for substitution between timber and other materials depends upon the level of technology and relative prices of alternative material inputs. For instance, the possibility for substitution away from timber to produce paper and paper related products is low since there are currently no economically viable and widely produced substitutes for wood fiber. However, the potential for substitution among alternative materials in building construction is much higher.
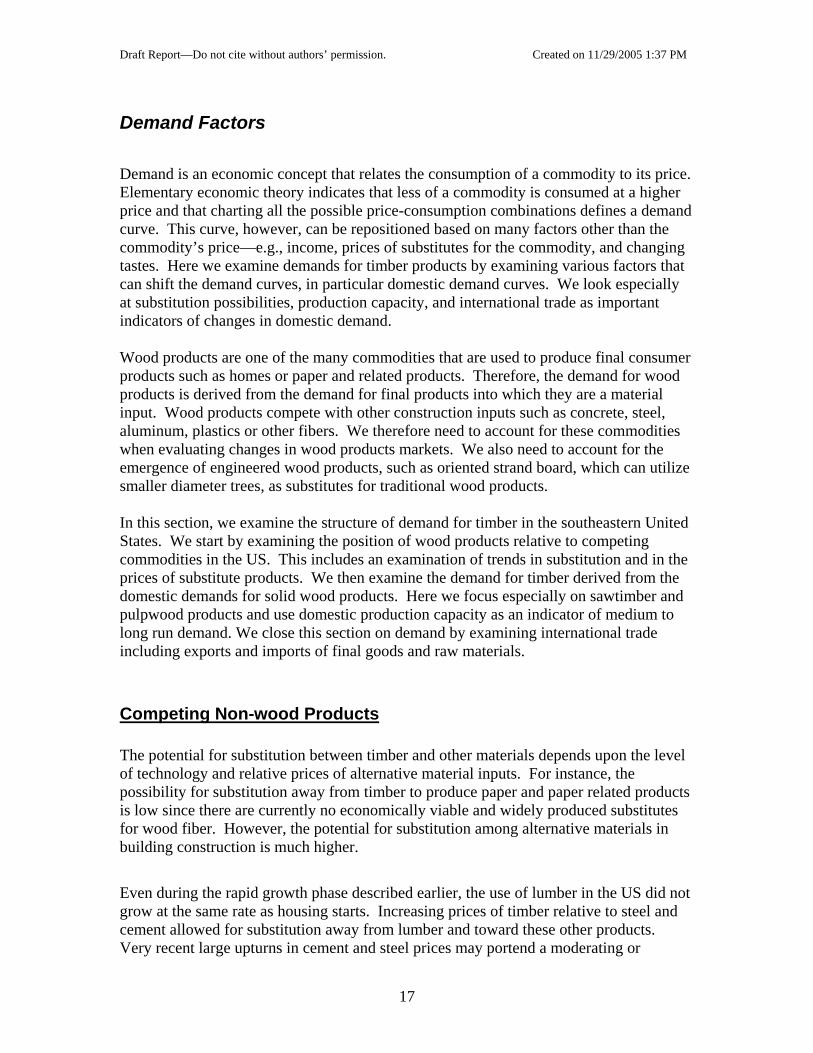
Even during the rapid growth phase described earlier, the use of lumber in the US did not grow at the same rate as housing starts. Increasing prices of timber relative to steel and cement allowed for substitution away from lumber and toward these other products. Very recent large upturns in cement and steel prices may portend a moderating or
17
Draft Report—Do not cite without authors’ permission. Created on 11/29/2005 1:37 PM
reversal of this substitution of raw materials. While many factors contribute to price differences among raw materials, energy prices will have a strong influence on the future competitive position of wood products. In general, steel and cement embody higher energy costs in transportation and production than do solid wood products. It is also conceivable that recent upsurges in energy prices could have a positive influence on domestically produced wood products.
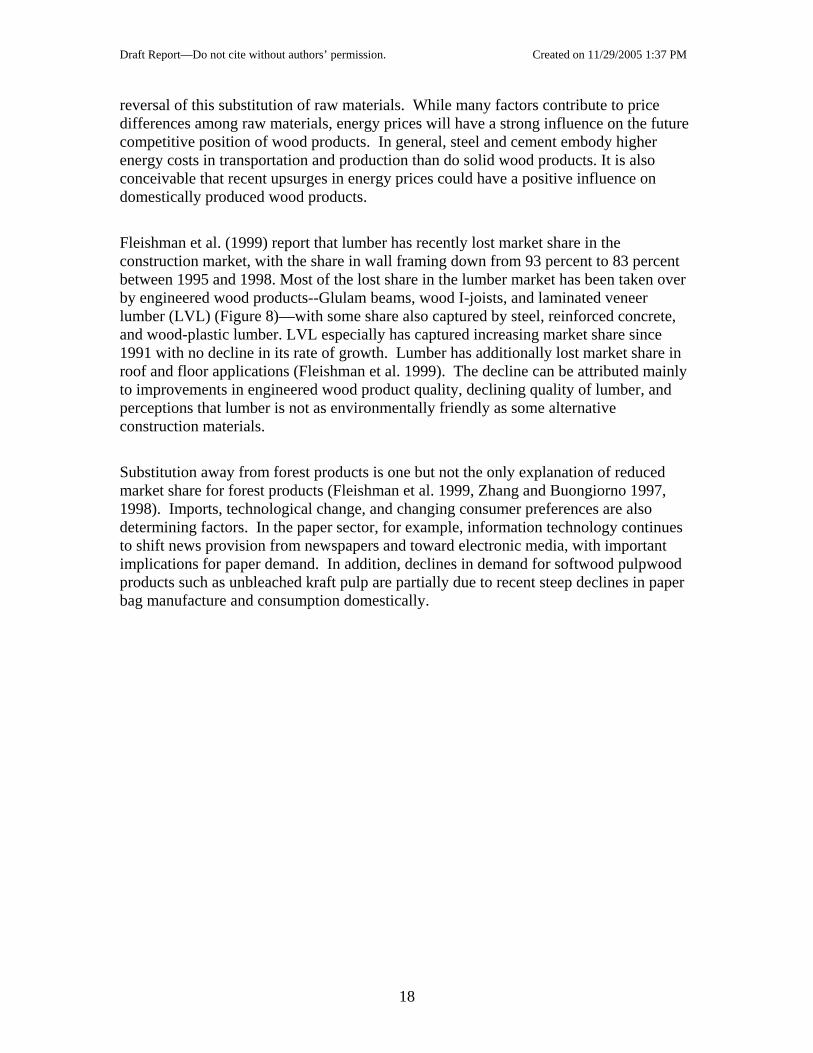
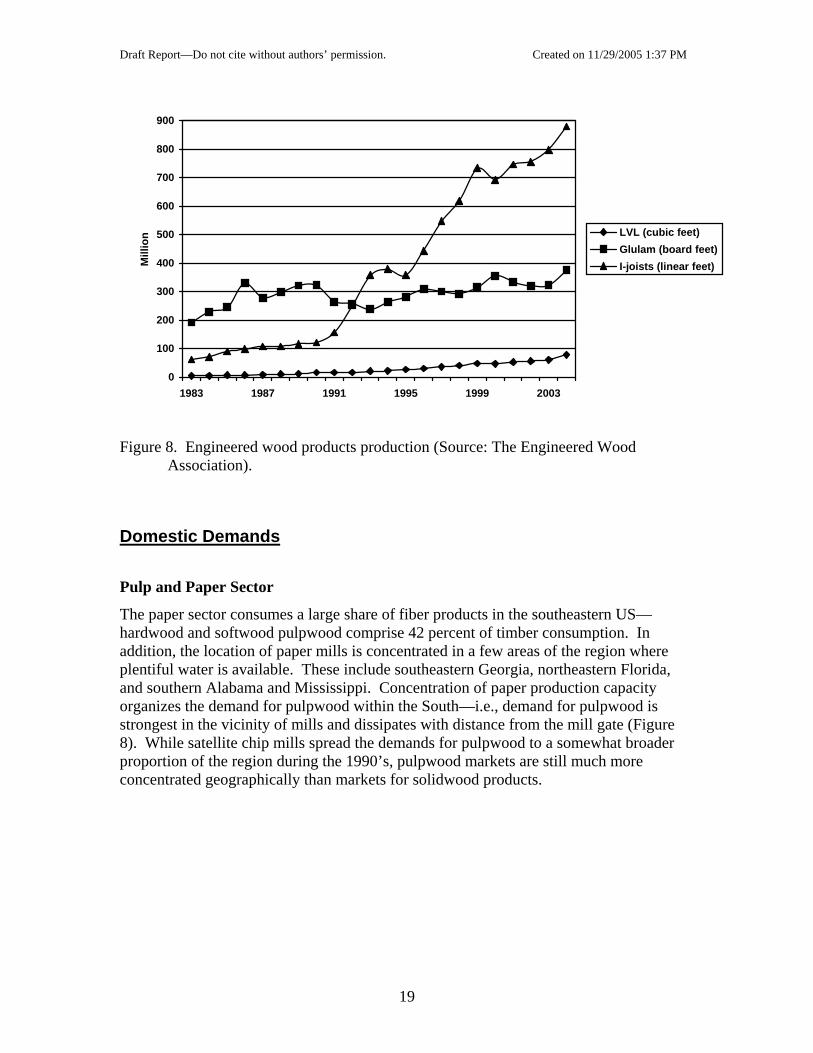
Fleishman et al. (1999) report that lumber has recently lost market share in the construction market, with the share in wall framing down from 93 percent to 83 percent between 1995 and 1998. Most of the lost share in the lumber market has been taken over by engineered wood products--Glulam beams, wood I-joists, and laminated veneer lumber (LVL) (Figure 8)—with some share also captured by steel, reinforced concrete, and wood-plastic lumber. LVL especially has captured increasing market share since 1991 with no decline in its rate of growth. Lumber has additionally lost market share in roof and floor applications (Fleishman et al. 1999). The decline can be attributed mainly to improvements in engineered wood product quality, declining quality of lumber, and perceptions that lumber is not as environmentally friendly as some alternative construction materials.
Substitution away from forest products is one but not the only explanation of reduced market share for forest products (Fleishman et al. 1999, Zhang and Buongiorno 1997, 1998). Imports, technological change, and changing consumer preferences are also determining factors. In the paper sector, for example, information technology continues to shift news provision from newspapers and toward electronic media, with important implications for paper demand. In addition, declines in demand for softwood pulpwood products such as unbleached kraft pulp are partially due to recent steep declines in paper bag manufacture and consumption domestically.
18
Draft Report—Do not cite without authors’ permission. Created on 11/29/2005 1:37 PM
0
100
200
300
400
500
600
700
800
900
1983 1987 1991 1995 1999 2003
Mill
ion LVL (cubic feet)
Glulam (board feet)I-joists (linear feet)
Figure 8. Engineered wood products production (Source: The Engineered Wood
Association).
Domestic Demands
Pulp and Paper Sector
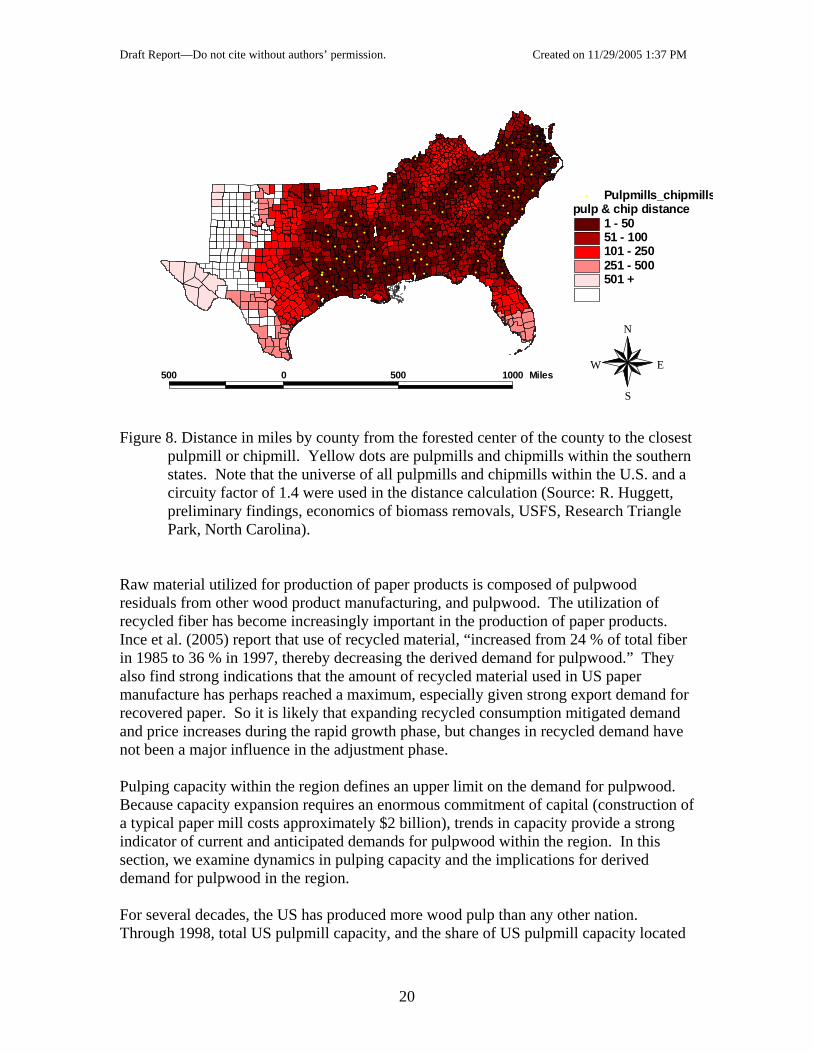
The paper sector consumes a large share of fiber products in the southeastern US—hardwood and softwood pulpwood comprise 42 percent of timber consumption. In addition, the location of paper mills is concentrated in a few areas of the region where plentiful water is available. These include southeastern Georgia, northeastern Florida, and southern Alabama and Mississippi. Concentration of paper production capacity organizes the demand for pulpwood within the South—i.e., demand for pulpwood is strongest in the vicinity of mills and dissipates with distance from the mill gate (Figure 8). While satellite chip mills spread the demands for pulpwood to a somewhat broader proportion of the region during the 1990’s, pulpwood markets are still much more concentrated geographically than markets for solidwood products.
19
Draft Report—Do not cite without authors’ permission. Created on 11/29/2005 1:37 PM
#
#
#
#
#
##
#
#
###
#
#
#
#
#
#
## #
#
#
#
#
#
#
#
#
#
#
#
#
# ##
##
#
#
#
#
#
#
#
#
#
#
#
#
#
#
## #
#
#
#
#
#
#
# #
#
#
#
##
#
#
#
#
#
#
#
# #
#
#
#
##
#
##
###
#
##
#
#
#
#
#
#
#
#
#
#
##
#
#
#
#
#
#
#
pulp & chip distance1 - 50 51 - 100101 - 250251 - 500501 +
# Pulpmills_chipmills
500 0 500 1000 Miles
N
EW
S Figure 8. Distance in miles by county from the forested center of the county to the closest
pulpmill or chipmill. Yellow dots are pulpmills and chipmills within the southern states. Note that the universe of all pulpmills and chipmills within the U.S. and a circuity factor of 1.4 were used in the distance calculation (Source: R. Huggett, preliminary findings, economics of biomass removals, USFS, Research Triangle Park, North Carolina).
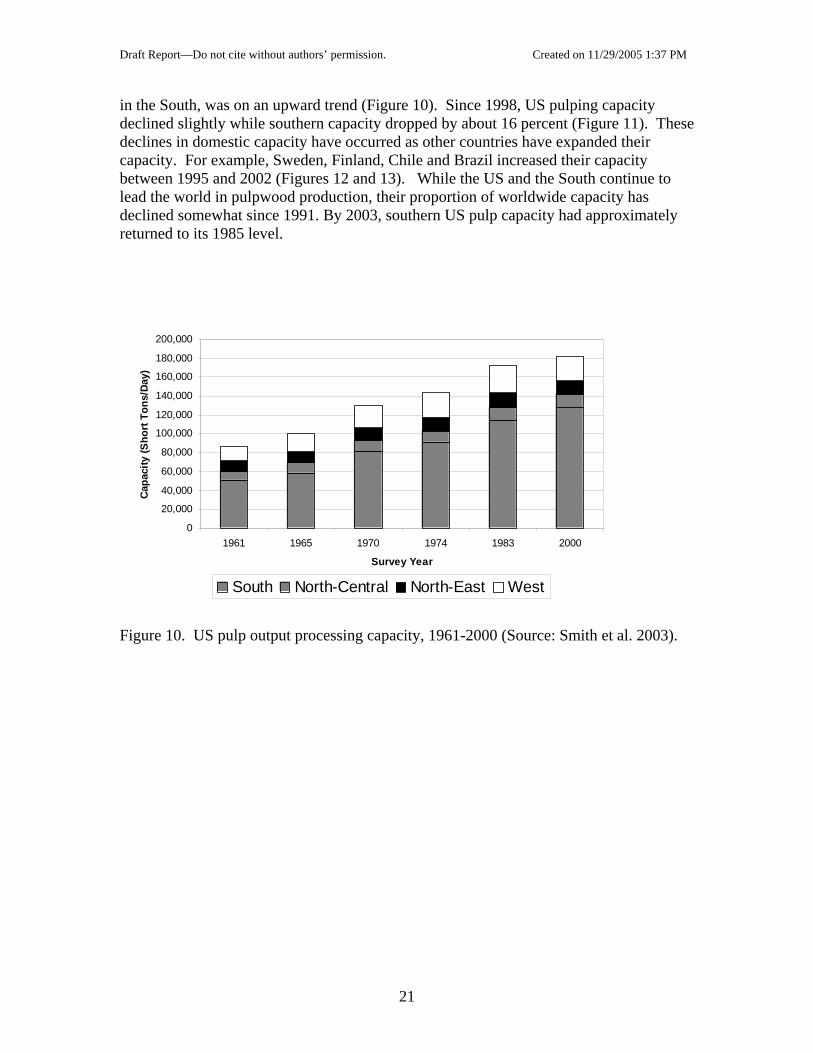
Raw material utilized for production of paper products is composed of pulpwood residuals from other wood product manufacturing, and pulpwood. The utilization of recycled fiber has become increasingly important in the production of paper products. Ince et al. (2005) report that use of recycled material, “increased from 24 % of total fiber in 1985 to 36 % in 1997, thereby decreasing the derived demand for pulpwood.” They also find strong indications that the amount of recycled material used in US paper manufacture has perhaps reached a maximum, especially given strong export demand for recovered paper. So it is likely that expanding recycled consumption mitigated demand and price increases during the rapid growth phase, but changes in recycled demand have not been a major influence in the adjustment phase. Pulping capacity within the region defines an upper limit on the demand for pulpwood. Because capacity expansion requires an enormous commitment of capital (construction of a typical paper mill costs approximately $2 billion), trends in capacity provide a strong indicator of current and anticipated demands for pulpwood within the region. In this section, we examine dynamics in pulping capacity and the implications for derived demand for pulpwood in the region. For several decades, the US has produced more wood pulp than any other nation. Through 1998, total US pulpmill capacity, and the share of US pulpmill capacity located
20
Draft Report—Do not cite without authors’ permission. Created on 11/29/2005 1:37 PM
in the South, was on an upward trend (Figure 10). Since 1998, US pulping capacity declined slightly while southern capacity dropped by about 16 percent (Figure 11). These declines in domestic capacity have occurred as other countries have expanded their capacity. For example, Sweden, Finland, Chile and Brazil increased their capacity between 1995 and 2002 (Figures 12 and 13). While the US and the South continue to lead the world in pulpwood production, their proportion of worldwide capacity has declined somewhat since 1991. By 2003, southern US pulp capacity had approximately returned to its 1985 level.
0
20,000
40,000
60,000
80,000
100,000
120,000
140,000
160,000
180,000
200,000
1961 1965 1970 1974 1983 2000
Survey Year
Cap
acity
(Sho
rt T
ons/
Day
)
South North-Central North-East West
Figure 10. US pulp output processing capacity, 1961-2000 (Source: Smith et al. 2003).
21

Draft Report—Do not cite without authors’ permission. Created on 11/29/2005 1:37 PM
0
20
40
60
80
1983 1985 1987 1989 1991 1993 1995 1997 1999 2001 2003
Tons
(mill
ions
)
Total U.S.South
Figure 11. Pulp mill capacity in the US and US South, 1983-2003 (Sources: Forest
Resources Association, USDA Southern Research Station, Pulp & Paper North American Factbook, Timber Mart South)
0
10
20
30
40
50
60
70
U.S.A. Canada Sweden Finland Brazil Chile N.Z.
Met
ric T
ons
(mill
ions
)
19952002
Figure 12. Pulp production for various countries, 1995 and 2002 (Sources: Pulp and
Paper International, Paperloop.com).
22

Draft Report—Do not cite without authors’ permission. Created on 11/29/2005 1:37 PM
-5%
0%
5%
10%
15%
USA
Can
ada
Swed
en
Japa
n
Finl
and
Bra
zil
Rus
sia
Indo
nesi
a
Chi
le
Ger
man
y
N.Z
.Ave
rage
Ann
ual P
erce
nt C
hang
e
Figure 13. Average annual rates of change in pulp production for various countries, 1995
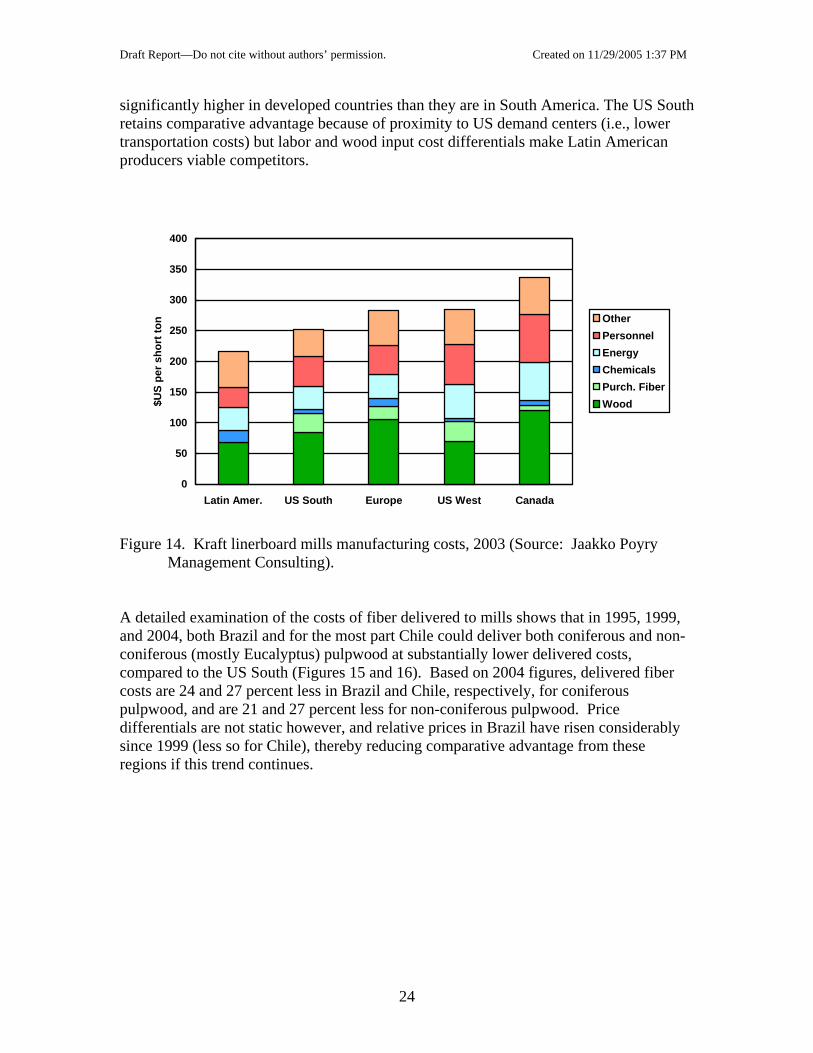
to 2002 (Sources: Pulp and Paper International, Paperloop.com). New pulp mill capacity and pulp production is feeding increased worldwide demand for paper products, especially in Asia. With level to declining capacity in the US it is clear that new capacity is being developed in other countries. There is no evidence of expansionary activity in pulp and paper manufacturing in the southern US. These changes are likely explained by shifts in comparative advantage relative to several factors, including labor costs, raw materials costs, and proximity to final product markets. Manufacturing costs in kraft linerboard mills in the US and abroad (Figure 14) provide an example of differences in comparative advantage. The US South is competitive in this market compared to the US West, Canada and Europe, but lags behind Latin American countries (primarily Brazil and Chile) in its cost structure. Fiber and labor costs are
23
Draft Report—Do not cite without authors’ permission. Created on 11/29/2005 1:37 PM
significantly higher in developed countries than they are in South America. The US South retains comparative advantage because of proximity to US demand centers (i.e., lower transportation costs) but labor and wood input cost differentials make Latin American producers viable competitors.
0
50
100
150
200
250
300
350
400
Latin Amer. US South Europe US West Canada
$US
per s
hort
ton Other
PersonnelEnergyChemicalsPurch. FiberWood
Figure 14. Kraft linerboard mills manufacturing costs, 2003 (Source: Jaakko Poyry
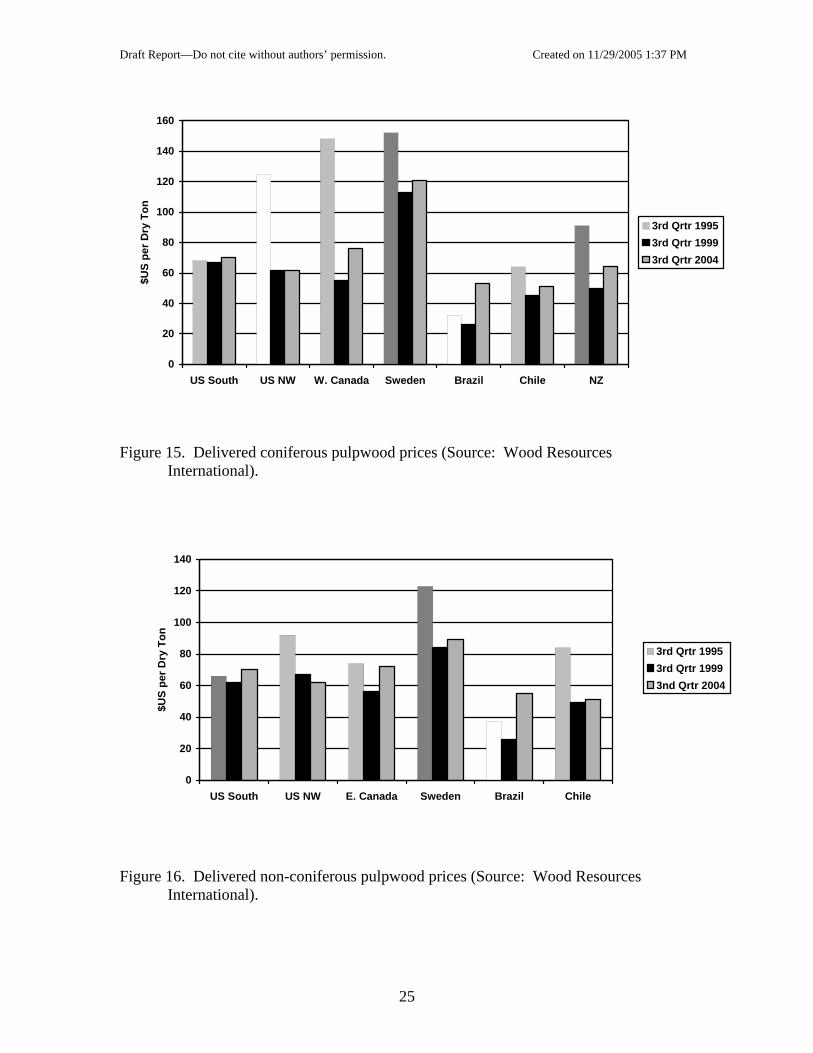
Management Consulting). A detailed examination of the costs of fiber delivered to mills shows that in 1995, 1999, and 2004, both Brazil and for the most part Chile could deliver both coniferous and non-coniferous (mostly Eucalyptus) pulpwood at substantially lower delivered costs, compared to the US South (Figures 15 and 16). Based on 2004 figures, delivered fiber costs are 24 and 27 percent less in Brazil and Chile, respectively, for coniferous pulpwood, and are 21 and 27 percent less for non-coniferous pulpwood. Price differentials are not static however, and relative prices in Brazil have risen considerably since 1999 (less so for Chile), thereby reducing comparative advantage from these regions if this trend continues.
24
Draft Report—Do not cite without authors’ permission. Created on 11/29/2005 1:37 PM
0
20
40
60
80
100
120
140
160
US South US NW W. Canada Sweden Brazil Chile NZ
$US
per D
ry T
on
3rd Qrtr 19953rd Qrtr 19993rd Qrtr 2004
Figure 15. Delivered coniferous pulpwood prices (Source: Wood Resources
International).
0
20
40
60
80
100
120
140
US South US NW E. Canada Sweden Brazil Chile
$US
per D
ry T
on
3rd Qrtr 19953rd Qrtr 19993nd Qrtr 2004
Figure 16. Delivered non-coniferous pulpwood prices (Source: Wood Resources
International).
25
Draft Report—Do not cite without authors’ permission. Created on 11/29/2005 1:37 PM
Solidwood Sector
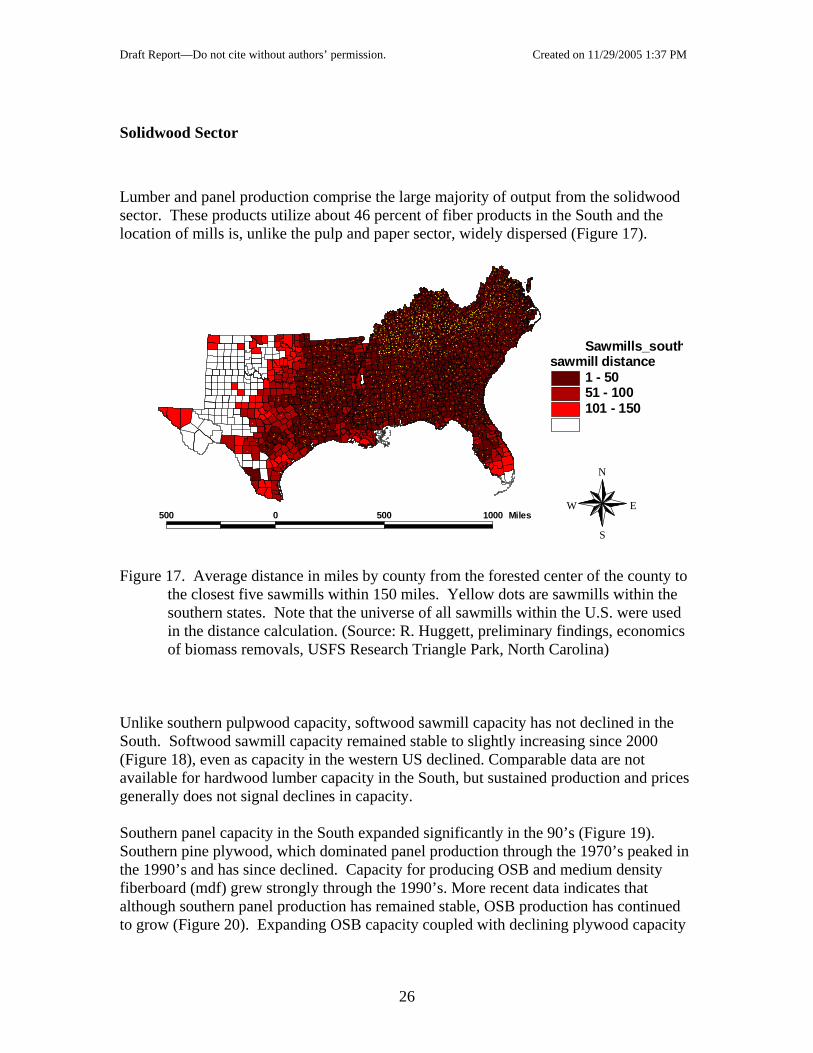
Lumber and panel production comprise the large majority of output from the solidwood sector. These products utilize about 46 percent of fiber products in the South and the location of mills is, unlike the pulp and paper sector, widely dispersed (Figure 17).
#
#
#
# #
#
#
#######
#
#
##
#
#
#
#
#
#
#
#
#
#
#
#
#
##
#
##
#
##
#
#
#
#
#
#
#
#
#
#
#
#
#
##
#
#
#
##
#
#
#
#
#
#
#
#
#
#
#
#
#
#
#
#
#
#
#
#
#
#####
##
#
#
#
#
#
#
#
#
#
#
#
#
# #
#
#
#
#
#
#
#
#
#
#
#
#
#
#
#
#
#
## #
#
#
###
# #
#
#
#
#
#
##
#
#
##
#
###
#
#
#
#
#
##
#
#
#
###
##
#
#
#
#
#
##
##
#
#
#
# #
#
#
##
#
#
#
#
###
#
#
#
#
#
#
##
#
##
#
#
####
#
#
#
#
# #
#
#
#
##
##
###
##
#
#
#
#
##
###
#
#
##
#
#
#
##
##
###
#
#
#
#
#
#
#
#
#
#
#
#
#
#
###
#
#
#
#
#
#
#
##
#
###
#
#
#
#
##
#
#
#
#
#
##
#
#
##
# #
#
#
#
#
#
# #
#
##
#
###
#
#
#
#
#
#
##
#
#
#
#
#
#
##
##
#
#
#
##
#
#
#
#
##
#
#
#
#
#
##
#
#
#
#
#
#
#
###
#
##
#
#
#
##
#
##
# #
#
#
#
#
#
#
#
#
##
##
##
#
#
#
#
#
##
#
####
#
#
##
#####
#
##
#
#
#
# #
#
#
#
#
#
#
#
#
#
#
#
#
#
#####
#
##
#
####
##
###
#
##
#
#
# #
##
#
###
###
##
#
#
##
###
#
##
#
#
##
####
######
###
####
#
#
#
###
##
##
##
##
#
#
#
#
#
#
#
#
##
###
#
#
#
##
##
###
#
#
##
##
#
#
#
#
##
#
#
#
#
#
#
#
#
##
####
#
##
#
#
#
##
#
#
##
##
#
##
##
##
#
#
#
##
#
#
##
#
###
###
##
#
##
#
#
## #
#
#
#
#
## #
#
##
#
#
#
# #
####
#
##
#
#
#
##
#
#######
##
#
#
##
#
# #
#
#
#####
#
#
##
##
###########
##
###
#
#
#
#
#
#
#
#
#
#
#
#
#
#
#
#
#
##
#
#
#
##
#
##
#
#
#
#
#
#
#
#
##
#
##
##
#
#
# #
#
#
#
#
#
##
#
##
#
##
#
#
##
##
#
#
##
#
##
# #
##
#
#
#
##
##
#
###
##
#
#
#
#
#
##
#
#
#
##
#
#
###
#
##
####
#
##
#
#
#
#
#
#
#
#
##
#
#
##
#
#
##
#
#
#
###
#
#
#
#
#
#
#
#
#
##
#
#
#
#
###
#
##
#
#
###
#
##
#
#
###
#
##
##
#
#
#
##
#
#
###
#
#
####
##
#
#
#
##
###
#
#
#
# #
##
#
#
## ##
##
#
#
##
#
#
##
#
##
##
##
#
#
#
#
#
#
##
###
####
##
####
#
#
#
#
###
# #
#
###
##
#
#
#
#
#
#
#
#
#
##
##
##
####
#
#
#
##
#
##
##
##
#
##
#
##
#
####
#
##
##
##
#
#
####
###
#
####
##
#
#
##
#
#
#
##
#
#
#
###
##
# #### ###
#
###
##
#
#
#
#
#
#
#
#
#
#
#
#
#
#
#
#
#
#
#
###
##
#
#
#
#
#
#
#
#
#
##
#
#
#
#
#
#
#
##
#
#
#
##
# #
#
#
#
##
##
#
#
# ##
#
#
#
#
#
#
##
#
#
##
#
#
#
#####
#
#
#
#
#
#
#
#
# #
#
##
##
###
#
###
#
#
##
###
#
#
#
##
######
#
##
#
##
#
#
#
## #
#
#
#
#####
###
#####
#
#
##
#
##
#
#
# #
#
#
#
#
#
# #
#
#
#
##
#
#
#
#
#
##
##
#
##
#
####
#####
####
#
#
##
####
#
#
#
#
#
##
#
#
#
#
###
#
##
##
#
####
##
#
###
##
#
#
#
##
#
##
#
#
#
##
##
##
#
#
#
#
#
##
#
#
#
#
##
#
###
###
#
#
###
###
#
#
#
#
#
#
#
##
#
##
#
####
#
###
##
#
#
#
##
#
###
#
#######
#
###
#
###
#
##
#
#
#
#
#
##
#
#
##
###
######
##
#
#####
#
#
#
#
# #
###
#
####
#
#
#
#
##
#
#
#
##
###
#
#
#
##
#
###
#
###
###
#
#
##
####
#
#
#
#
#
#
#
#
##
#
##
#
#
#
#
#
#
#
#
#
#
#
##
#
#
#
#
#
##
###
#
#
#
#
#
##
##
#
#
##
#
#
#
#
##
#
#
#
#
#
#
#
# #
##
#
##
#
#
#
###
#
# #
#
##
# ##
#
#
#
#
#
#
#
#
#
#
##
#
#
#
#
#
###
#
#
#
#####
#
#
#
#
#
##
#
#
#
#####
#
#
#
#
#
##
#
#
###
#
#
#
##
#
###
#
##
##
###
#
# #
##
##
# #
#
#
#
##
# #
# ##
##
#
#
#
#
#
#
#
##
#
#
#
###
#
#
#
#
#
###
#
#
###
#
##
###
##
##
#
#
#
#
#
##
##
#
#
####
#
##
#
#
#
#
#
#
## ##
# #
#
##
##
#
#
#
###
##
#
#
###
#
#
#
#
###
#
#
#
##
##
#
#
# ##
#
#
####
##
#
###
#
##
###
#
##
#
#
#
#
#
#
#
#
#
#
##
#
#
#
#
#
#
#
#
##
#
#
#
#
#
###
#
#
#
#
#
#
#
#
#
#
#
#
#
#
#
#
#
#
#
#
#
#
#
#
#
#
#
#
#
#
#
#
#
#
#
#
#
#
#
# #
#
#
#
#
#
#
##
#
#
#
#
#
#
#
#
#
#
## #
#
#
#
#
#
#
#
#
#
#
#
#
#
#
#
#
#
#
#
#
#
#
#
#
#
#
#
#
#
#
#
#
#
#
##
#
#
#
#
#
#
#
#
#
#
#
#
#
#
#
#
#
##
#
#
#
##
#
#
#
#
#
#
#
#
##
#
#
#
#
#
#
#
#
#
sawmill distance1 - 50 51 - 100 101 - 150
# Sawmills_south
500 0 500 1000 Miles
N
EW
S Figure 17. Average distance in miles by county from the forested center of the county to
the closest five sawmills within 150 miles. Yellow dots are sawmills within the southern states. Note that the universe of all sawmills within the U.S. were used in the distance calculation. (Source: R. Huggett, preliminary findings, economics of biomass removals, USFS Research Triangle Park, North Carolina)
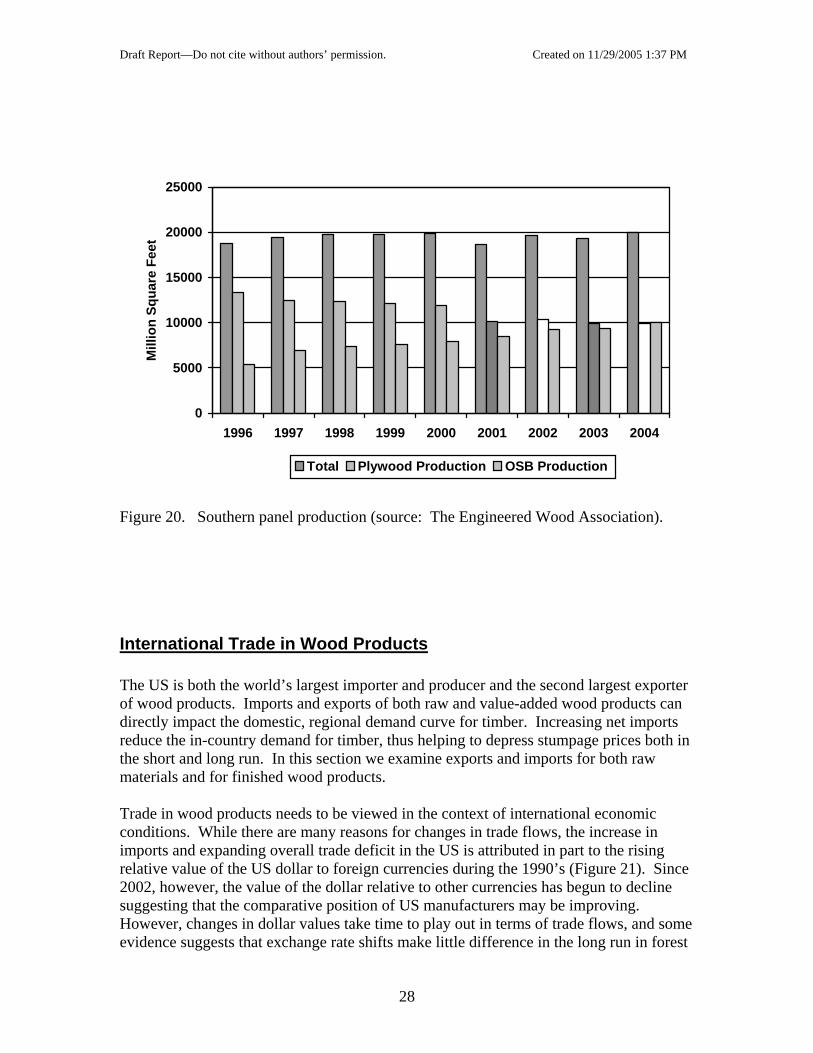
Unlike southern pulpwood capacity, softwood sawmill capacity has not declined in the South. Softwood sawmill capacity remained stable to slightly increasing since 2000 (Figure 18), even as capacity in the western US declined. Comparable data are not available for hardwood lumber capacity in the South, but sustained production and prices generally does not signal declines in capacity. Southern panel capacity in the South expanded significantly in the 90’s (Figure 19). Southern pine plywood, which dominated panel production through the 1970’s peaked in the 1990’s and has since declined. Capacity for producing OSB and medium density fiberboard (mdf) grew strongly through the 1990’s. More recent data indicates that although southern panel production has remained stable, OSB production has continued to grow (Figure 20). Expanding OSB capacity coupled with declining plywood capacity
26

Draft Report—Do not cite without authors’ permission. Created on 11/29/2005 1:37 PM
indicates increasing demand for less expensive, small diameter timber, especially compared to veneer logs used in plywood production.
38
39
40
41
42
43
44
45
46
1997 1998 1999 2000 2001 2002 2003
Mill
ion
cubi
c m
eter
s
U.S.-South U.S.-West
Figure 18. Softwood sawmill capacity (Source: Spelter and Alderman, 2003).
0
5
10
15
20
25
30
35
40
1965 1970 1975 1980 1985 1990 1995 1996 1997 1998
Cap
acity
(mill
ion
cubi
c m
eter
s)
Southern Pine Plywood OSB Particleboard MDF
Figure 19. Panel capacity in the US South (Source: McKeever and Spelter 1998).
27
Draft Report—Do not cite without authors’ permission. Created on 11/29/2005 1:37 PM
0
5000
10000
15000
20000
25000
1996 1997 1998 1999 2000 2001 2002 2003 2004
Mill
ion
Squa
re F
eet
Total Plywood Production OSB Production
Figure 20. Southern panel production (source: The Engineered Wood Association).
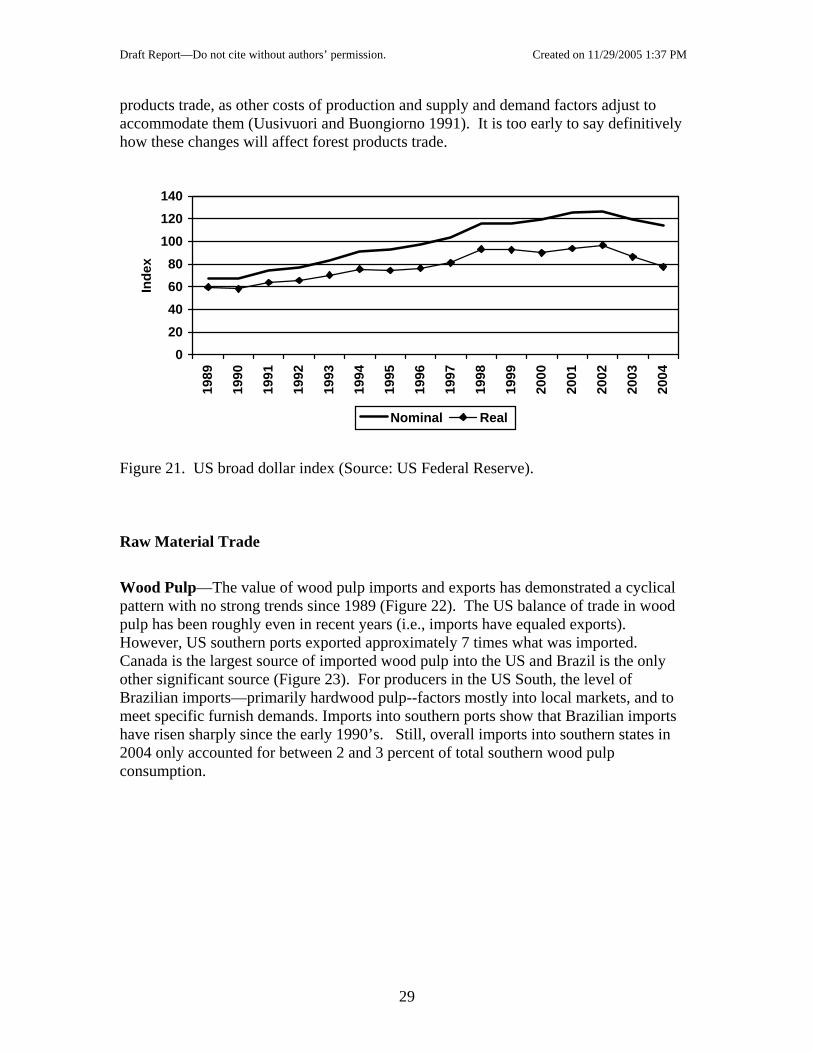
International Trade in Wood Products The US is both the world’s largest importer and producer and the second largest exporter of wood products. Imports and exports of both raw and value-added wood products can directly impact the domestic, regional demand curve for timber. Increasing net imports reduce the in-country demand for timber, thus helping to depress stumpage prices both in the short and long run. In this section we examine exports and imports for both raw materials and for finished wood products. Trade in wood products needs to be viewed in the context of international economic conditions. While there are many reasons for changes in trade flows, the increase in imports and expanding overall trade deficit in the US is attributed in part to the rising relative value of the US dollar to foreign currencies during the 1990’s (Figure 21). Since 2002, however, the value of the dollar relative to other currencies has begun to decline suggesting that the comparative position of US manufacturers may be improving. However, changes in dollar values take time to play out in terms of trade flows, and some evidence suggests that exchange rate shifts make little difference in the long run in forest
28
Draft Report—Do not cite without authors’ permission. Created on 11/29/2005 1:37 PM
products trade, as other costs of production and supply and demand factors adjust to accommodate them (Uusivuori and Buongiorno 1991). It is too early to say definitively how these changes will affect forest products trade.
020406080
100120140
1989
1990
1991
1992
1993
1994
1995
1996
1997
1998
1999
2000
2001
2002
2003
2004
Inde
x
Nominal Real
Figure 21. US broad dollar index (Source: US Federal Reserve). Raw Material Trade
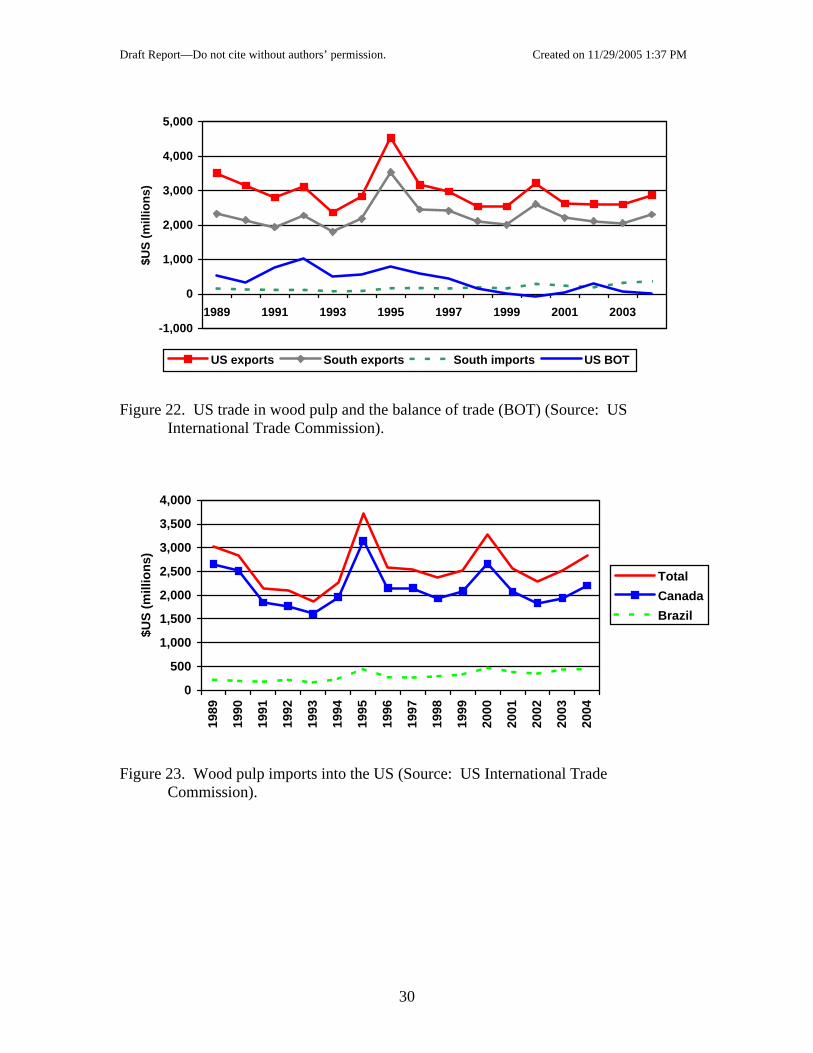
Wood Pulp—The value of wood pulp imports and exports has demonstrated a cyclical pattern with no strong trends since 1989 (Figure 22). The US balance of trade in wood pulp has been roughly even in recent years (i.e., imports have equaled exports). However, US southern ports exported approximately 7 times what was imported. Canada is the largest source of imported wood pulp into the US and Brazil is the only other significant source (Figure 23). For producers in the US South, the level of Brazilian imports—primarily hardwood pulp--factors mostly into local markets, and to meet specific furnish demands. Imports into southern ports show that Brazilian imports have risen sharply since the early 1990’s. Still, overall imports into southern states in 2004 only accounted for between 2 and 3 percent of total southern wood pulp consumption.
29
Draft Report—Do not cite without authors’ permission. Created on 11/29/2005 1:37 PM
-1,000
0
1,000
2,000
3,000
4,000
5,000
1989 1991 1993 1995 1997 1999 2001 2003
$US
(mill
ions
)
US exports South exports South imports US BOT
Figure 22. US trade in wood pulp and the balance of trade (BOT) (Source: US
International Trade Commission).
0
500
1,000
1,500
2,000
2,500
3,000
3,500
4,000
1989
1990
1991
1992
1993
1994
1995
1996
1997
1998
1999
2000
2001
2002
2003
2004
$US
(mill
ions
)
TotalCanadaBrazil
Figure 23. Wood pulp imports into the US (Source: US International Trade
Commission).
30
Draft Report—Do not cite without authors’ permission. Created on 11/29/2005 1:37 PM
0
50
100
150
200
250
300
350
400
1989
1990
1991
1992
1993
1994
1995
1996
1997
1998
1999
2000
2001
2002
2003
2004
$US
(mill
ions
)
TotalBrazil
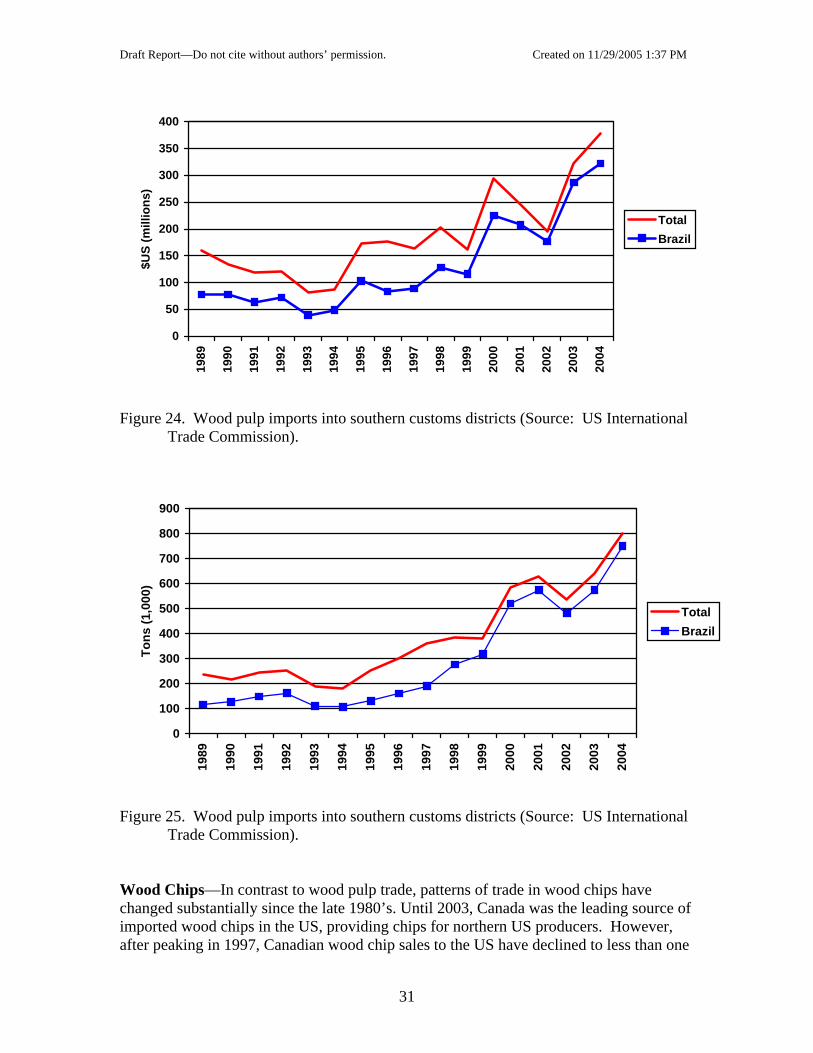
Figure 24. Wood pulp imports into southern customs districts (Source: US International
Trade Commission).
0
100
200
300
400
500
600
700
800
900
1989
1990
1991
1992
1993
1994
1995
1996
1997
1998
1999
2000
2001
2002
2003
2004
Tons
(1,0
00)
TotalBrazil
Figure 25. Wood pulp imports into southern customs districts (Source: US International
Trade Commission). Wood Chips—In contrast to wood pulp trade, patterns of trade in wood chips have changed substantially since the late 1980’s. Until 2003, Canada was the leading source of imported wood chips in the US, providing chips for northern US producers. However, after peaking in 1997, Canadian wood chip sales to the US have declined to less than one
31

Draft Report—Do not cite without authors’ permission. Created on 11/29/2005 1:37 PM
third of their peak level (Figure 26). Producers from the southern hemisphere have also been a source of imported wood chips for the US at various times. In the mid-1990’s Chile provided as much as one third of the total wood chip imports. In 2004, imports from Brazil increased dramatically, making Brazil the largest importer of wood chips into the US. Imports from Brazil are delivered mainly to southern US ports (Figure 27). Southern chip imports currently represent only about 0.9 percent of total southern pulpwood consumption, and about 3 percent of total southern hardwood pulpwood consumption. Most of these imports are concentrated in a few ports, especially in Mobile, Alabama and Florida, so localized impacts on hardwood markets could be substantial. The surge in Brazilian chip imports is the expected response to price increases due to local scarcity of hardwoods. In addition, Eucalyptus chips, a highly preferred fiber source for some paper grades, may be preferred over native hardwoods. The extent to which hardwood chip imports might increase from South America is unknown. However, it is likely that chip imports from South America now define a ceiling for domestic hardwood stumpage prices in certain areas of the South.
05,000
10,00015,00020,00025,00030,00035,00040,00045,00050,000
1989
1990
1991
1992
1993
1994
1995
1996
1997
1998
1999
2000
2001
2002
2003
2004
$US
(1,0
00's
)
TotalCanadaBrazilChile
Figure 26. Wood chips imports into the US (Source: US International Trade
Commission).
32

Draft Report—Do not cite without authors’ permission. Created on 11/29/2005 1:37 PM
0
5,000
10,000
15,000
20,000
25,000
30,000
1989
1990
1991
1992
1993
1994
1995
1996
1997
1998
1999
2000
2001
2002
2003
2004
$US
(1,0
00's
)
TotalBrazil
Figure 27. Wood chips imports into southern customs districts in dollars (Source: US
International Trade Commission).
0
100
200
300
400
500
600
700
800
1989
1990
1991
1992
1993
1994
1995
1996
1997
1998
1999
2000
2001
2002
2003
2004
Tons
(1,0
00's
)
TotalBrazil
Figure 28. Wood chips imports into southern customs districts in tons (Source: US
International Trade Commission)
33
Draft Report—Do not cite without authors’ permission. Created on 11/29/2005 1:37 PM
0
100,000
200,000
300,000
400,000
500,000
600,000
1989
1990
1991
1992
1993
1994
1995
1996
1997
1998
1999
2000
2001
2002
2003
2004
$USD
(1,0
00's
) TotalCanadaBrazilChileBOT
Figure 29. Wood chips imports into the US and the balance of trade (BOT) (Source: US
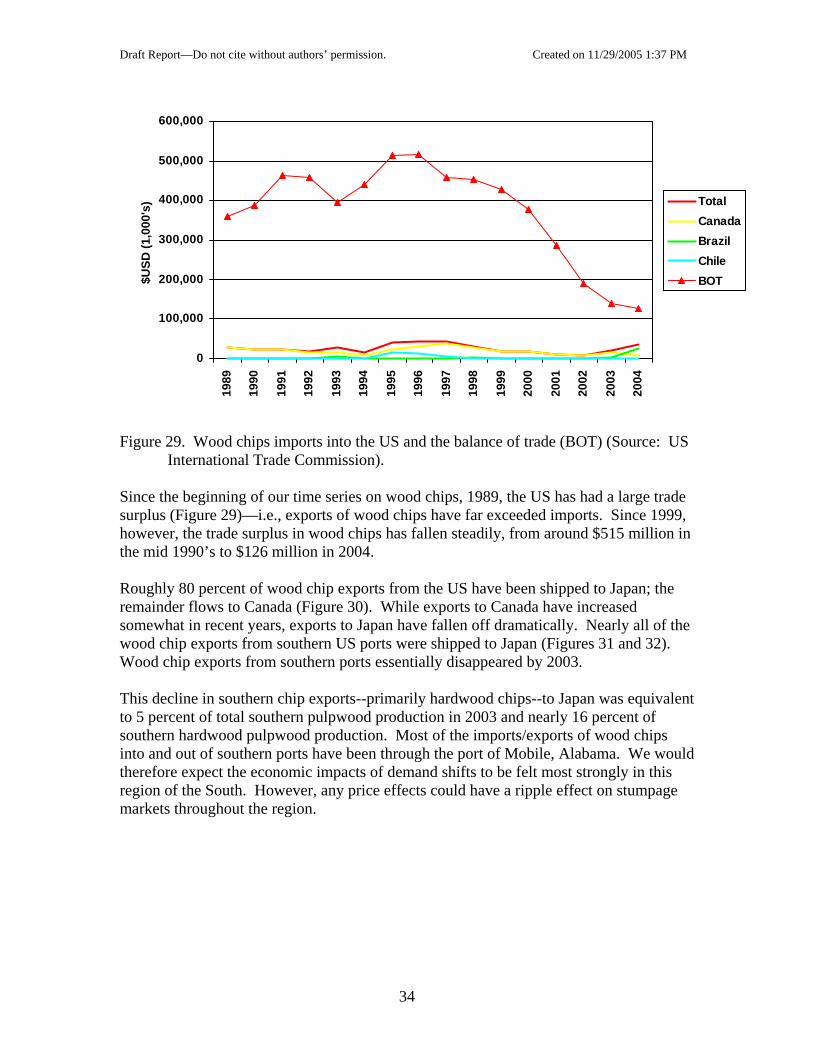
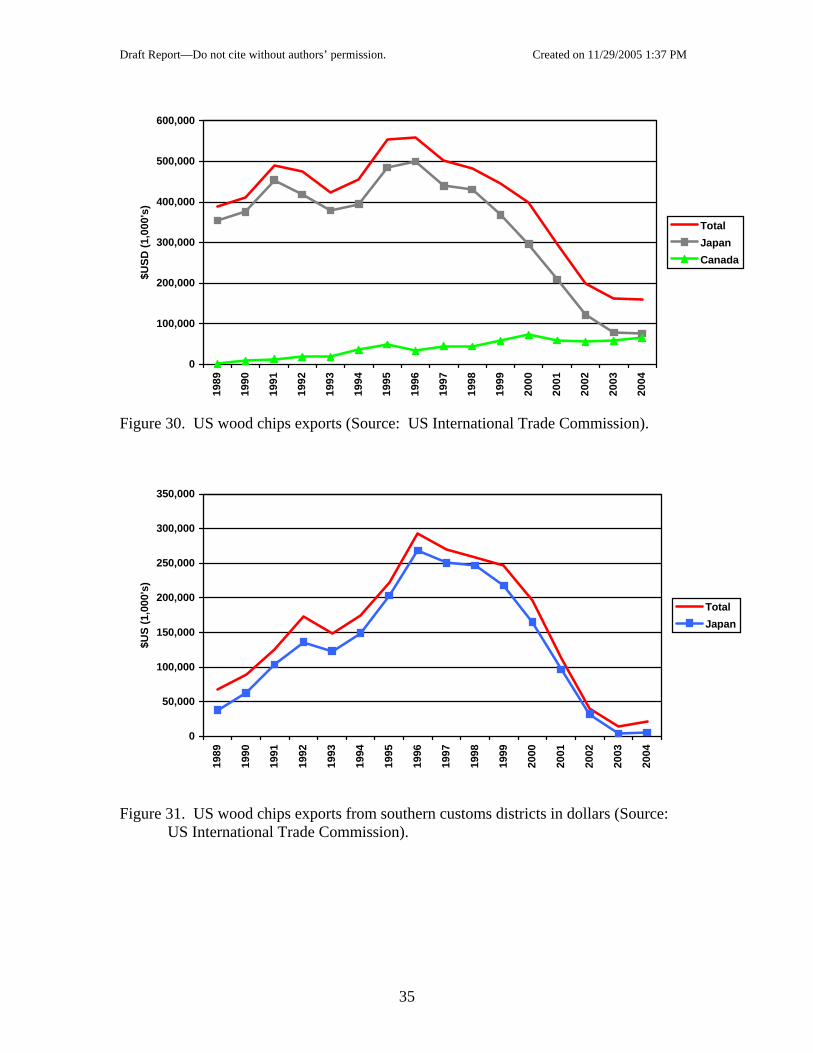
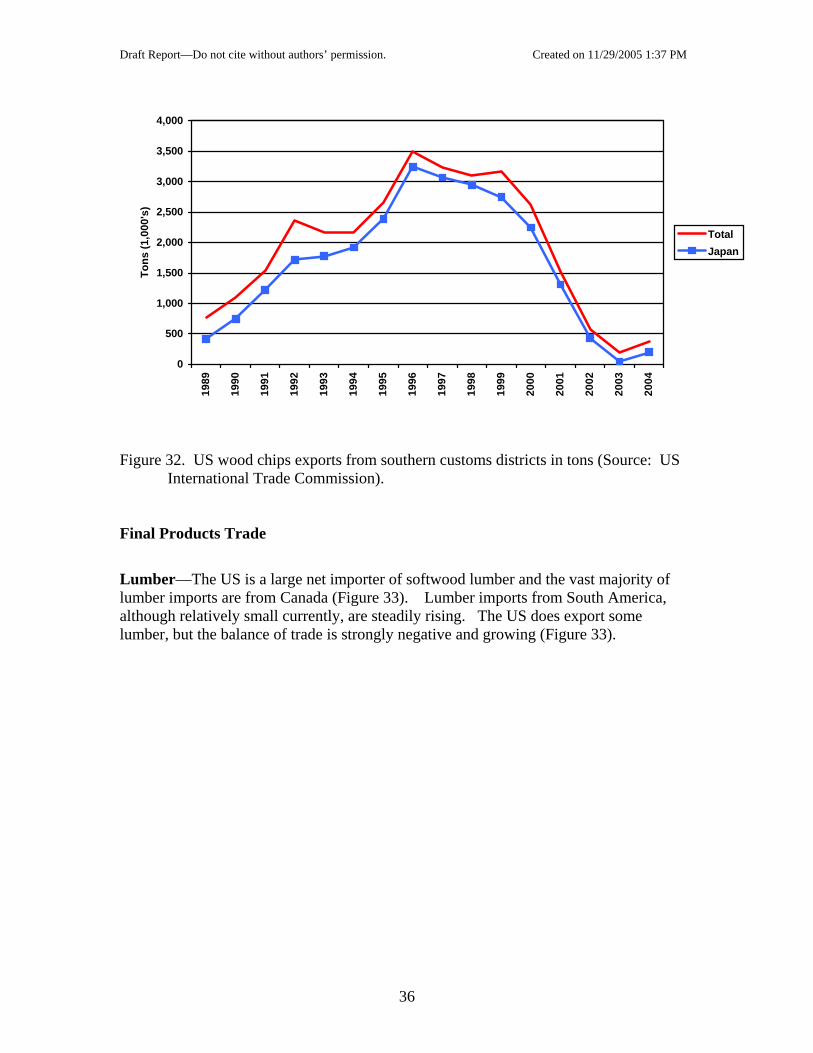
International Trade Commission). Since the beginning of our time series on wood chips, 1989, the US has had a large trade surplus (Figure 29)—i.e., exports of wood chips have far exceeded imports. Since 1999, however, the trade surplus in wood chips has fallen steadily, from around $515 million in the mid 1990’s to $126 million in 2004. Roughly 80 percent of wood chip exports from the US have been shipped to Japan; the remainder flows to Canada (Figure 30). While exports to Canada have increased somewhat in recent years, exports to Japan have fallen off dramatically. Nearly all of the wood chip exports from southern US ports were shipped to Japan (Figures 31 and 32). Wood chip exports from southern ports essentially disappeared by 2003. This decline in southern chip exports--primarily hardwood chips--to Japan was equivalent to 5 percent of total southern pulpwood production in 2003 and nearly 16 percent of southern hardwood pulpwood production. Most of the imports/exports of wood chips into and out of southern ports have been through the port of Mobile, Alabama. We would therefore expect the economic impacts of demand shifts to be felt most strongly in this region of the South. However, any price effects could have a ripple effect on stumpage markets throughout the region.
34
Draft Report—Do not cite without authors’ permission. Created on 11/29/2005 1:37 PM
0
100,000
200,000
300,000
400,000
500,000
600,000
1989
1990
1991
1992
1993
1994
1995
1996
1997
1998
1999
2000
2001
2002
2003
2004
$USD
(1,0
00's
)
TotalJapanCanada
Figure 30. US wood chips exports (Source: US International Trade Commission).
0
50,000
100,000
150,000
200,000
250,000
300,000
350,000
1989
1990
1991
1992
1993
1994
1995
1996
1997
1998
1999
2000
2001
2002
2003
2004
$US
(1,0
00's
)
TotalJapan
Figure 31. US wood chips exports from southern customs districts in dollars (Source:
US International Trade Commission).
35
Draft Report—Do not cite without authors’ permission. Created on 11/29/2005 1:37 PM
0
500
1,000
1,500
2,000
2,500
3,000
3,500
4,000
1989
1990
1991
1992
1993
1994
1995
1996
1997
1998
1999
2000
2001
2002
2003
2004
Tons
(1,0
00's
)
TotalJapan
Figure 32. US wood chips exports from southern customs districts in tons (Source: US
International Trade Commission). Final Products Trade
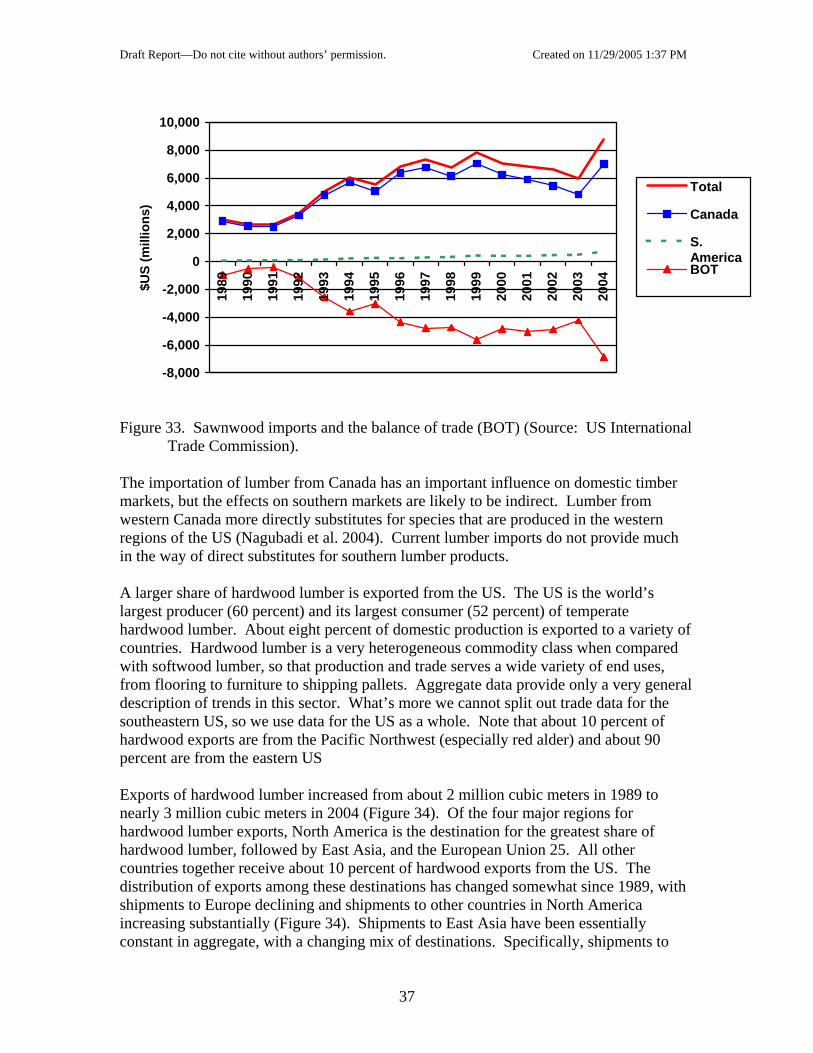
Lumber—The US is a large net importer of softwood lumber and the vast majority of lumber imports are from Canada (Figure 33). Lumber imports from South America, although relatively small currently, are steadily rising. The US does export some lumber, but the balance of trade is strongly negative and growing (Figure 33).
36
Draft Report—Do not cite without authors’ permission. Created on 11/29/2005 1:37 PM
-8,000
-6,000
-4,000
-2,000
0
2,000
4,000
6,000
8,000
10,000
1989
1990
1991
1992
1993
1994
1995
1996
1997
1998
1999
2000
2001
2002
2003
2004$U
S (m
illio
ns)
Total
Canada
S.AmericaBOT
Figure 33. Sawnwood imports and the balance of trade (BOT) (Source: US International
Trade Commission). The importation of lumber from Canada has an important influence on domestic timber markets, but the effects on southern markets are likely to be indirect. Lumber from western Canada more directly substitutes for species that are produced in the western regions of the US (Nagubadi et al. 2004). Current lumber imports do not provide much in the way of direct substitutes for southern lumber products. A larger share of hardwood lumber is exported from the US. The US is the world’s largest producer (60 percent) and its largest consumer (52 percent) of temperate hardwood lumber. About eight percent of domestic production is exported to a variety of countries. Hardwood lumber is a very heterogeneous commodity class when compared with softwood lumber, so that production and trade serves a wide variety of end uses, from flooring to furniture to shipping pallets. Aggregate data provide only a very general description of trends in this sector. What’s more we cannot split out trade data for the southeastern US, so we use data for the US as a whole. Note that about 10 percent of hardwood exports are from the Pacific Northwest (especially red alder) and about 90 percent are from the eastern US Exports of hardwood lumber increased from about 2 million cubic meters in 1989 to nearly 3 million cubic meters in 2004 (Figure 34). Of the four major regions for hardwood lumber exports, North America is the destination for the greatest share of hardwood lumber, followed by East Asia, and the European Union 25. All other countries together receive about 10 percent of hardwood exports from the US. The distribution of exports among these destinations has changed somewhat since 1989, with shipments to Europe declining and shipments to other countries in North America increasing substantially (Figure 34). Shipments to East Asia have been essentially constant in aggregate, with a changing mix of destinations. Specifically, shipments to
37
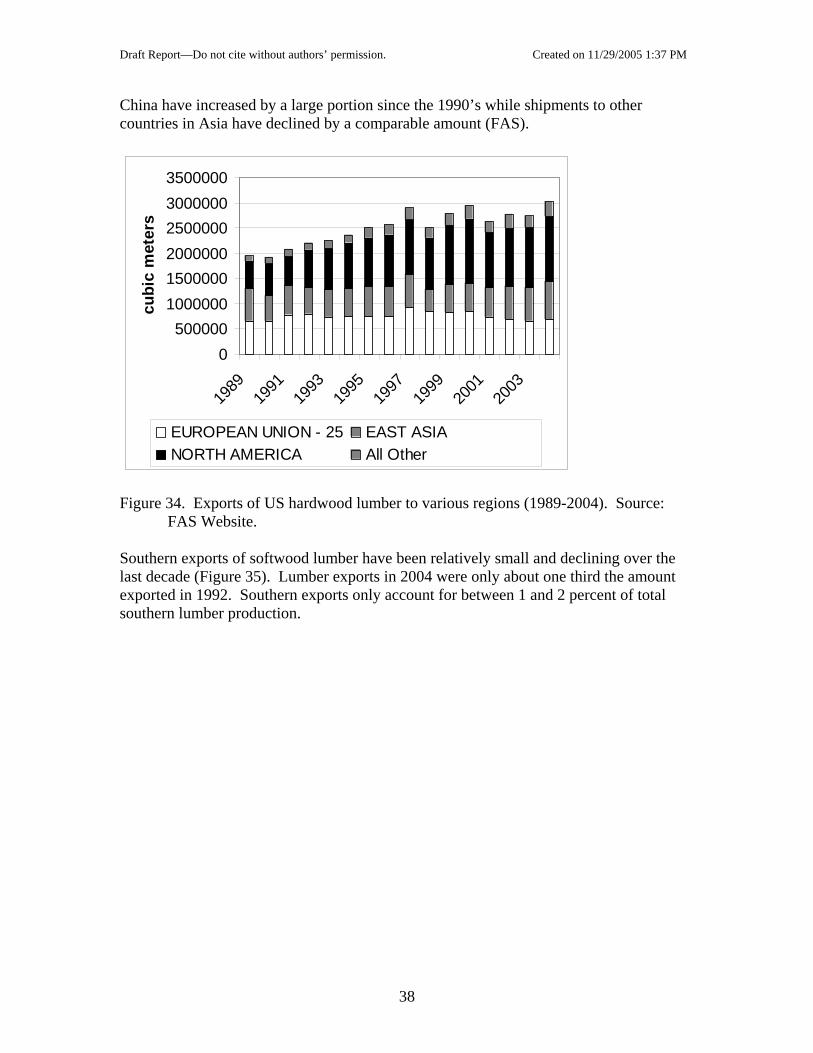
Draft Report—Do not cite without authors’ permission. Created on 11/29/2005 1:37 PM
China have increased by a large portion since the 1990’s while shipments to other countries in Asia have declined by a comparable amount (FAS).
0500000
100000015000002000000250000030000003500000
1989
1991
1993
1995
1997
1999
2001
2003
cubi
c m
eter
s
EUROPEAN UNION - 25 EAST ASIANORTH AMERICA All Other
Figure 34. Exports of US hardwood lumber to various regions (1989-2004). Source:
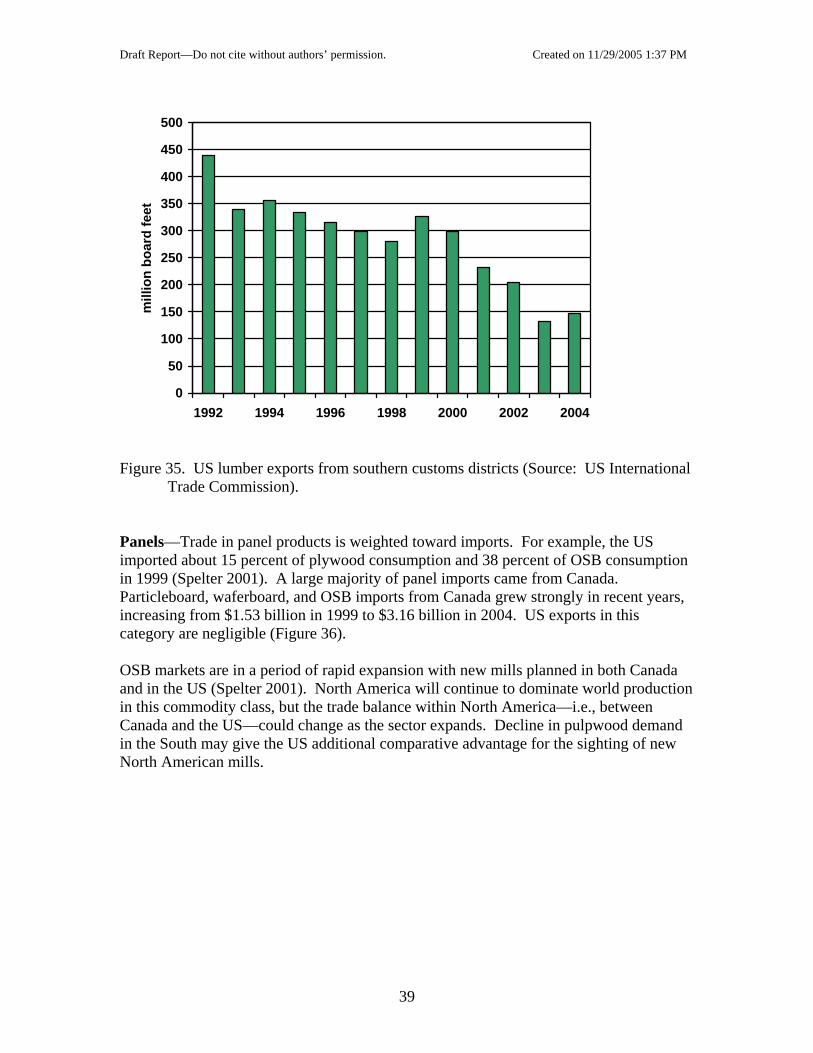
FAS Website. Southern exports of softwood lumber have been relatively small and declining over the last decade (Figure 35). Lumber exports in 2004 were only about one third the amount exported in 1992. Southern exports only account for between 1 and 2 percent of total southern lumber production.
38
Draft Report—Do not cite without authors’ permission. Created on 11/29/2005 1:37 PM
0
50
100
150
200
250
300
350
400
450
500
1992 1994 1996 1998 2000 2002 2004
mill
ion
boar
d fe
et
Figure 35. US lumber exports from southern customs districts (Source: US International
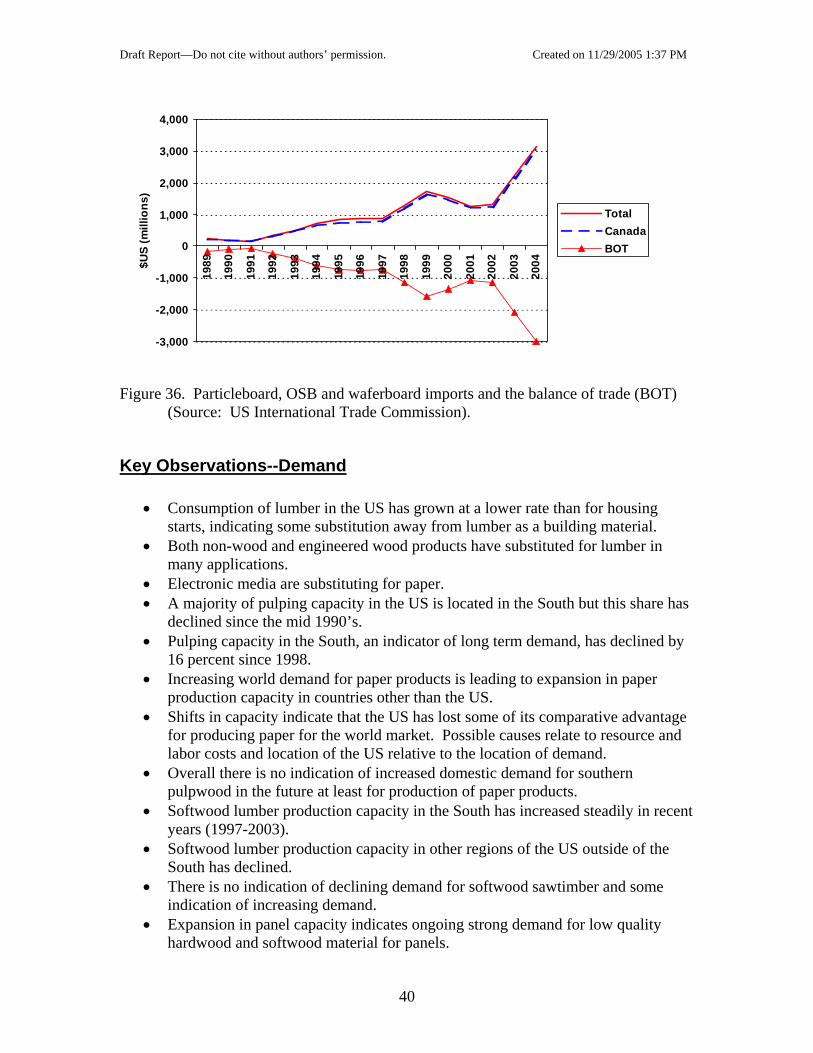
Trade Commission). Panels—Trade in panel products is weighted toward imports. For example, the US imported about 15 percent of plywood consumption and 38 percent of OSB consumption in 1999 (Spelter 2001). A large majority of panel imports came from Canada. Particleboard, waferboard, and OSB imports from Canada grew strongly in recent years, increasing from $1.53 billion in 1999 to $3.16 billion in 2004. US exports in this category are negligible (Figure 36). OSB markets are in a period of rapid expansion with new mills planned in both Canada and in the US (Spelter 2001). North America will continue to dominate world production in this commodity class, but the trade balance within North America—i.e., between Canada and the US—could change as the sector expands. Decline in pulpwood demand in the South may give the US additional comparative advantage for the sighting of new North American mills.
39
Draft Report—Do not cite without authors’ permission. Created on 11/29/2005 1:37 PM
-3,000
-2,000
-1,000
0
1,000
2,000
3,000
4,000
1989
1990
1991
1992
1993
1994
1995
1996
1997
1998
1999
2000
2001
2002
2003
2004$U
S (m
illio
ns)
TotalCanadaBOT
Figure 36. Particleboard, OSB and waferboard imports and the balance of trade (BOT)
(Source: US International Trade Commission).
Key Observations--Demand
• Consumption of lumber in the US has grown at a lower rate than for housing starts, indicating some substitution away from lumber as a building material.
• Both non-wood and engineered wood products have substituted for lumber in many applications.
• Electronic media are substituting for paper. • A majority of pulping capacity in the US is located in the South but this share has
declined since the mid 1990’s. • Pulping capacity in the South, an indicator of long term demand, has declined by
16 percent since 1998. • Increasing world demand for paper products is leading to expansion in paper
production capacity in countries other than the US. • Shifts in capacity indicate that the US has lost some of its comparative advantage
for producing paper for the world market. Possible causes relate to resource and labor costs and location of the US relative to the location of demand.
• Overall there is no indication of increased domestic demand for southern pulpwood in the future at least for production of paper products.
• Softwood lumber production capacity in the South has increased steadily in recent years (1997-2003).
• Softwood lumber production capacity in other regions of the US outside of the South has declined.
• There is no indication of declining demand for softwood sawtimber and some indication of increasing demand.
• Expansion in panel capacity indicates ongoing strong demand for low quality hardwood and softwood material for panels.
40
Draft Report—Do not cite without authors’ permission. Created on 11/29/2005 1:37 PM
• Wood pulp imports are a relatively small portion of wood products production in the South (between 2 and 3 percent).
• While small, wood pulp imports to southern custom districts have increased since 1998.
• Up to 8 percent of domestic demand for pulpwood has been displaced by changes in trade, the majority (5 percent) is defined by loss of wood chip export markets.
• Almost all lumber imports are from Canada with a small but increasing share from South America.
• Canadian imports do not directly displace demand for southern pine lumber. • The very small amount of southern pine lumber exports have declined
substantially since 1998.
41
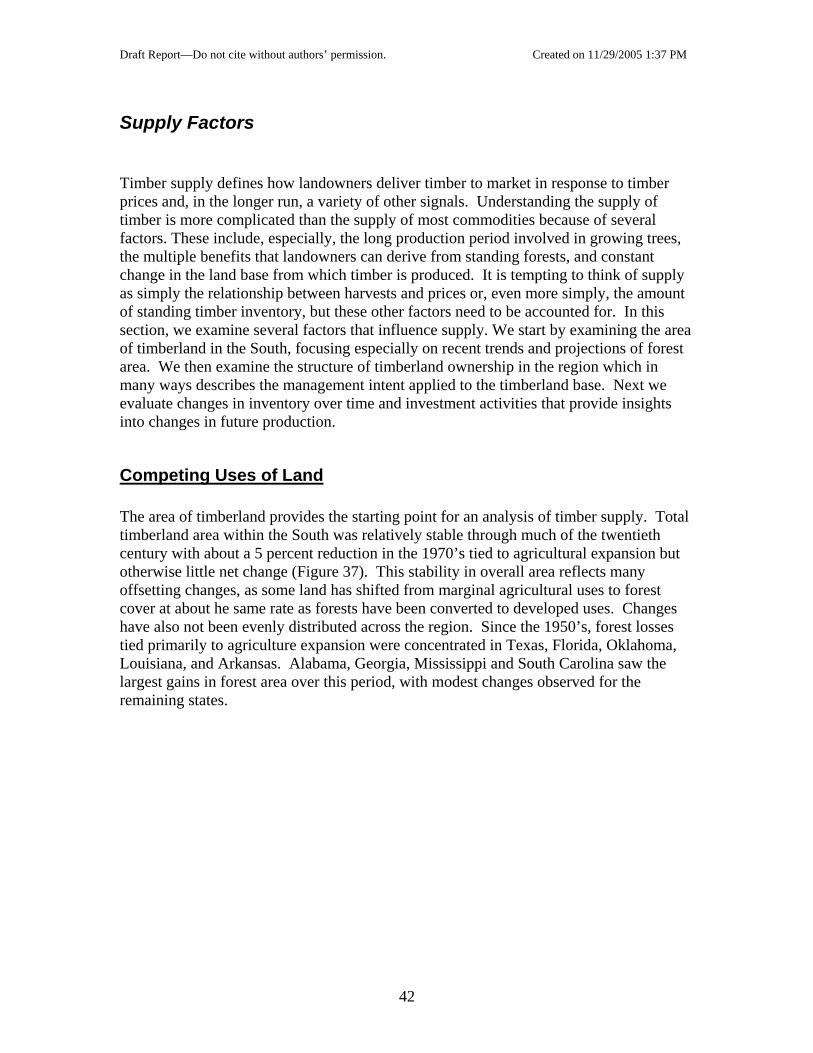
Draft Report—Do not cite without authors’ permission. Created on 11/29/2005 1:37 PM
Supply Factors Timber supply defines how landowners deliver timber to market in response to timber prices and, in the longer run, a variety of other signals. Understanding the supply of timber is more complicated than the supply of most commodities because of several factors. These include, especially, the long production period involved in growing trees, the multiple benefits that landowners can derive from standing forests, and constant change in the land base from which timber is produced. It is tempting to think of supply as simply the relationship between harvests and prices or, even more simply, the amount of standing timber inventory, but these other factors need to be accounted for. In this section, we examine several factors that influence supply. We start by examining the area of timberland in the South, focusing especially on recent trends and projections of forest area. We then examine the structure of timberland ownership in the region which in many ways describes the management intent applied to the timberland base. Next we evaluate changes in inventory over time and investment activities that provide insights into changes in future production.
Competing Uses of Land The area of timberland provides the starting point for an analysis of timber supply. Total timberland area within the South was relatively stable through much of the twentieth century with about a 5 percent reduction in the 1970’s tied to agricultural expansion but otherwise little net change (Figure 37). This stability in overall area reflects many offsetting changes, as some land has shifted from marginal agricultural uses to forest cover at about he same rate as forests have been converted to developed uses. Changes have also not been evenly distributed across the region. Since the 1950’s, forest losses tied primarily to agriculture expansion were concentrated in Texas, Florida, Oklahoma, Louisiana, and Arkansas. Alabama, Georgia, Mississippi and South Carolina saw the largest gains in forest area over this period, with modest changes observed for the remaining states.
42
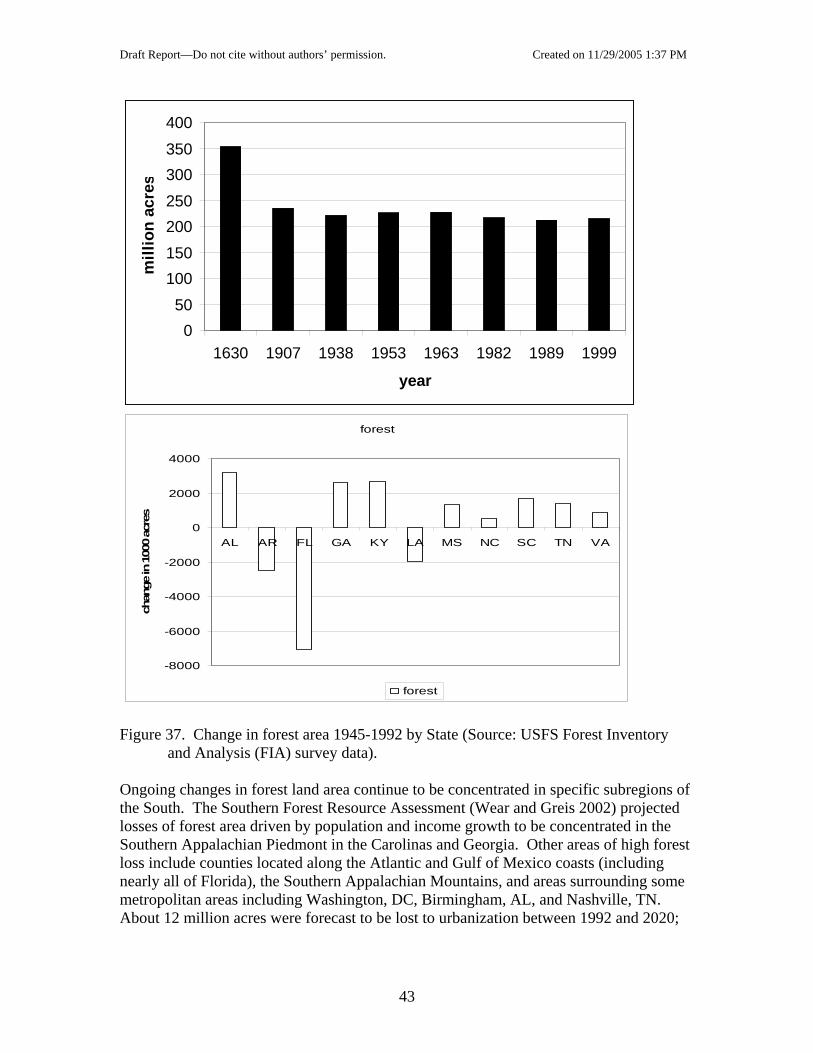
Draft Report—Do not cite without authors’ permission. Created on 11/29/2005 1:37 PM
050
100150200250300350400
1630 1907 1938 1953 1963 1982 1989 1999
year
mill
ion
acre
s
forest
-8000
-6000
-4000
-2000
0
2000
4000
AL AR FL GA KY LA MS NC SC TN VA
chan
ge in
100
0 ac
res
forest
Figure 37. Change in forest area 1945-1992 by State (Source: USFS Forest Inventory
and Analysis (FIA) survey data). Ongoing changes in forest land area continue to be concentrated in specific subregions of the South. The Southern Forest Resource Assessment (Wear and Greis 2002) projected losses of forest area driven by population and income growth to be concentrated in the Southern Appalachian Piedmont in the Carolinas and Georgia. Other areas of high forest loss include counties located along the Atlantic and Gulf of Mexico coasts (including nearly all of Florida), the Southern Appalachian Mountains, and areas surrounding some metropolitan areas including Washington, DC, Birmingham, AL, and Nashville, TN. About 12 million acres were forecast to be lost to urbanization between 1992 and 2020;
43
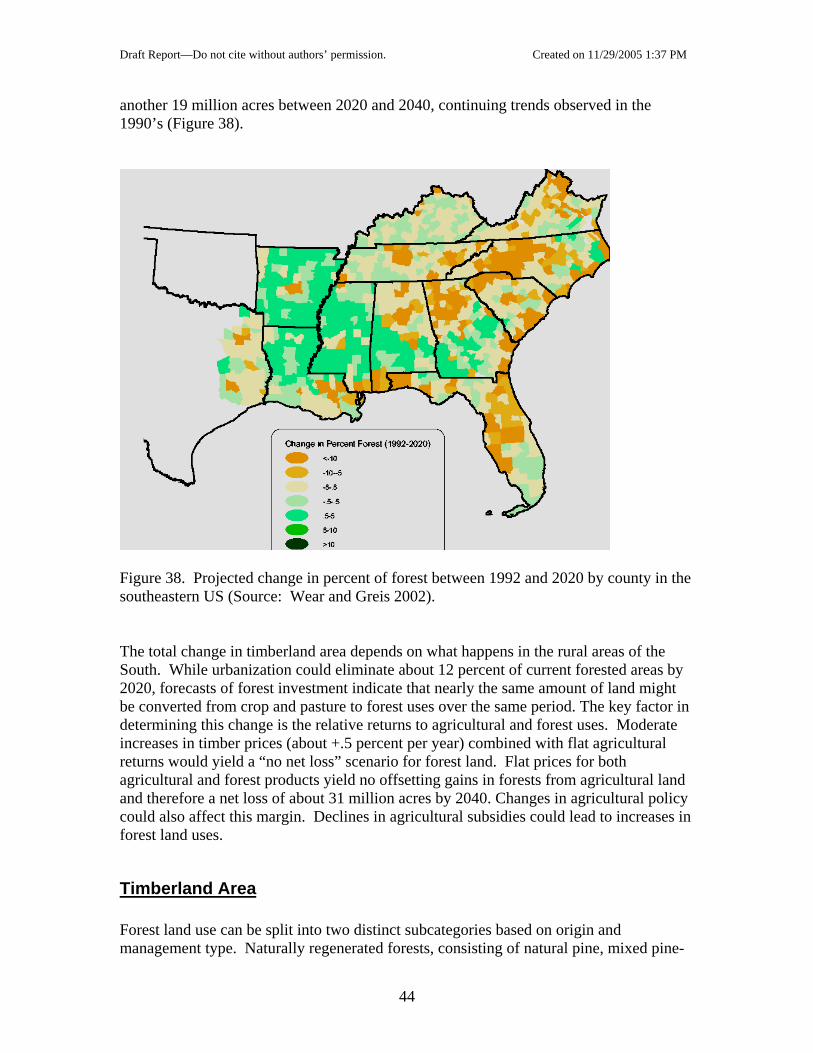
Draft Report—Do not cite without authors’ permission. Created on 11/29/2005 1:37 PM
another 19 million acres between 2020 and 2040, continuing trends observed in the 1990’s (Figure 38).
Figure 38. Projected change in percent of forest between 1992 and 2020 by county in the southeastern US (Source: Wear and Greis 2002). The total change in timberland area depends on what happens in the rural areas of the South. While urbanization could eliminate about 12 percent of current forested areas by 2020, forecasts of forest investment indicate that nearly the same amount of land might be converted from crop and pasture to forest uses over the same period. The key factor in determining this change is the relative returns to agricultural and forest uses. Moderate increases in timber prices (about +.5 percent per year) combined with flat agricultural returns would yield a “no net loss” scenario for forest land. Flat prices for both agricultural and forest products yield no offsetting gains in forests from agricultural land and therefore a net loss of about 31 million acres by 2040. Changes in agricultural policy could also affect this margin. Declines in agricultural subsidies could lead to increases in forest land uses.
Timberland Area Forest land use can be split into two distinct subcategories based on origin and management type. Naturally regenerated forests, consisting of natural pine, mixed pine-
44
Draft Report—Do not cite without authors’ permission. Created on 11/29/2005 1:37 PM
hardwood, and various hardwood forest management types, can be viewed as laresidual land use—most were not established with the intent of producing timber, and arelocated where both development and agricultural uses could not be justified. Forest plantations represent the other major subcategory of timberland. Establishing these forests requires a direct application of financial capital which generally implies intentharvest timber at some time. Plantation forestry, which has been limited to pine specin the South, is an agricultural style of forest management which is displacing harvests from naturally regenerated stands.
rgely a
to ies
0
10
20
30
40
50
60
70
80
1950 1960 1970 1980 1990 2000
Acr
es (m
illio
n)
Planted pine Natural pineOak–pine Upland hardwoodLowland hardwood
0
50
100
150
200
250
1950 1960 1970 1980 1990 2000
Acr
es (m
illio
n)
Planted Nonplanted
Figure 39. Acres by forest management type (Source: FIA data summarized by Conner
and Hartsell 2002).
45
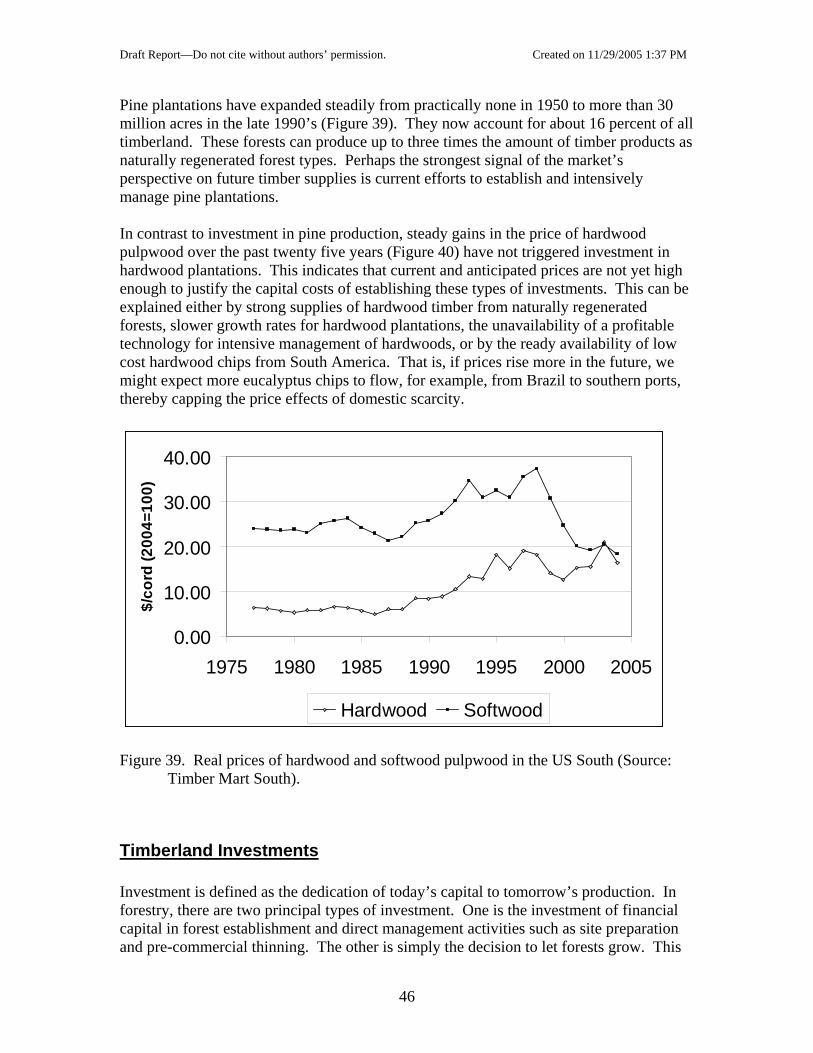
Draft Report—Do not cite without authors’ permission. Created on 11/29/2005 1:37 PM
Pine plantations have expanded steadily from practically none in 1950 to more than 30 ll
ly
contrast to investment in pine production, steady gains in the price of hardwood in
ble
million acres in the late 1990’s (Figure 39). They now account for about 16 percent of atimberland. These forests can produce up to three times the amount of timber products as naturally regenerated forest types. Perhaps the strongest signal of the market’s perspective on future timber supplies is current efforts to establish and intensivemanage pine plantations. Inpulpwood over the past twenty five years (Figure 40) have not triggered investmenthardwood plantations. This indicates that current and anticipated prices are not yet highenough to justify the capital costs of establishing these types of investments. This can be explained either by strong supplies of hardwood timber from naturally regenerated forests, slower growth rates for hardwood plantations, the unavailability of a profitatechnology for intensive management of hardwoods, or by the ready availability of low cost hardwood chips from South America. That is, if prices rise more in the future, we might expect more eucalyptus chips to flow, for example, from Brazil to southern ports,thereby capping the price effects of domestic scarcity.
0.00
10.00
20.00
30.00
40.00
1975 1980 1985 1990 1995 2000 2005
$/co
rd (2
004=
100)
Hardwood Softwood
igure 39. Real prices of hardwood and softwood pulpwood in the US South (Source:
Timberland Investments
FTimber Mart South).
vestment is defined as the dedication of today’s capital to tomorrow’s production. In Inforestry, there are two principal types of investment. One is the investment of financial capital in forest establishment and direct management activities such as site preparation and pre-commercial thinning. The other is simply the decision to let forests grow. This
46
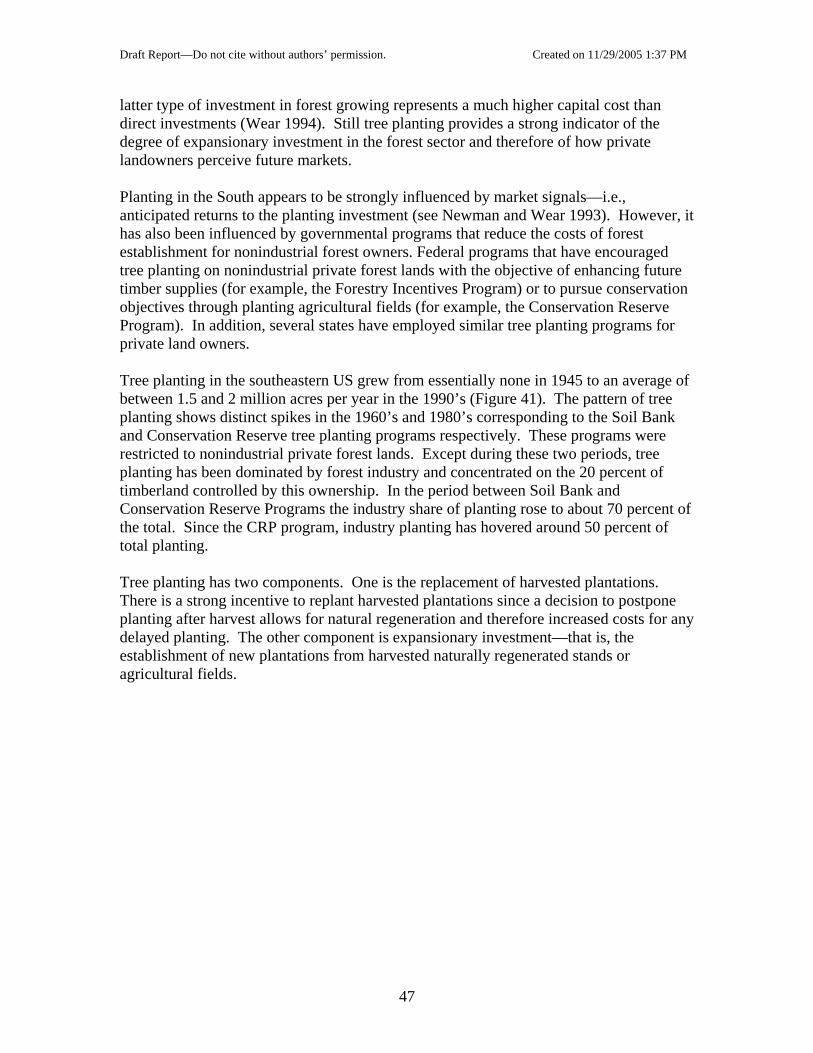
Draft Report—Do not cite without authors’ permission. Created on 11/29/2005 1:37 PM
latter type of investment in forest growing represents a much higher capital cost than direct investments (Wear 1994). Still tree planting provides a strong indicator of the degree of expansionary investment in the forest sector and therefore of how private landowners perceive future markets. Planting in the South appears to be strongly influenced by market signals—i.e.,
wever, it
ed e
ree planting in the southeastern US grew from essentially none in 1945 to an average of
percent of
ree planting has two components. One is the replacement of harvested plantations. e
y
anticipated returns to the planting investment (see Newman and Wear 1993). Hohas also been influenced by governmental programs that reduce the costs of forest establishment for nonindustrial forest owners. Federal programs that have encouragtree planting on nonindustrial private forest lands with the objective of enhancing futurtimber supplies (for example, the Forestry Incentives Program) or to pursue conservationobjectives through planting agricultural fields (for example, the Conservation Reserve Program). In addition, several states have employed similar tree planting programs for private land owners. Tbetween 1.5 and 2 million acres per year in the 1990’s (Figure 41). The pattern of tree planting shows distinct spikes in the 1960’s and 1980’s corresponding to the Soil Bank and Conservation Reserve tree planting programs respectively. These programs were restricted to nonindustrial private forest lands. Except during these two periods, tree planting has been dominated by forest industry and concentrated on the 20 percent of timberland controlled by this ownership. In the period between Soil Bank and Conservation Reserve Programs the industry share of planting rose to about 70 the total. Since the CRP program, industry planting has hovered around 50 percent of total planting. TThere is a strong incentive to replant harvested plantations since a decision to postponplanting after harvest allows for natural regeneration and therefore increased costs for andelayed planting. The other component is expansionary investment—that is, the establishment of new plantations from harvested naturally regenerated stands or agricultural fields.
47
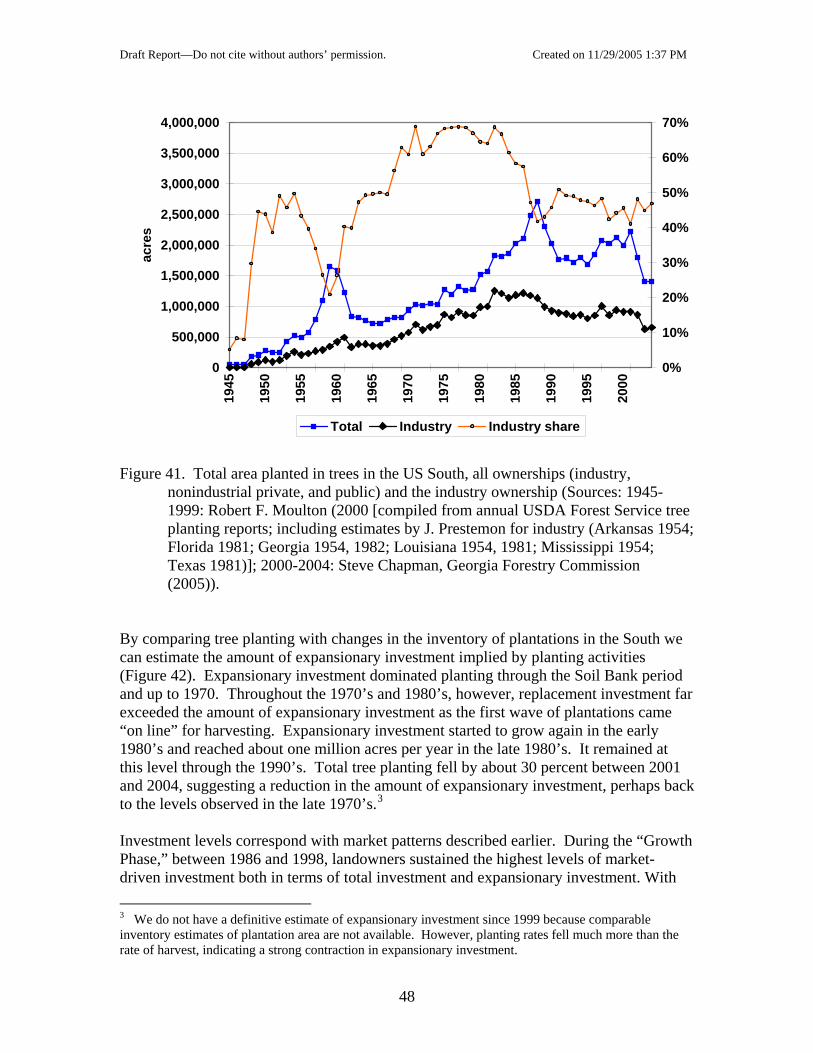
Draft Report—Do not cite without authors’ permission. Created on 11/29/2005 1:37 PM
0
500,000
1,000,000
1,500,000
2,000,000
2,500,000
3,000,000
3,500,000
4,000,000
1945
1950
1955
1960
1965
1970
1975
1980
1985
1990
1995
2000
acre
s
0%
10%
20%
30%
40%
50%
60%
70%
Total Industry Industry share
Figure 41. Total area planted in trees in the US South, all ownerships (industry,
nonindustrial private, and public) and the industry ownership (Sources: 1945-1999: Robert F. Moulton (2000 [compiled from annual USDA Forest Service tree planting reports; including estimates by J. Prestemon for industry (Arkansas 1954; Florida 1981; Georgia 1954, 1982; Louisiana 1954, 1981; Mississippi 1954; Texas 1981)]; 2000-2004: Steve Chapman, Georgia Forestry Commission (2005)).
By comparing tree planting with changes in the inventory of plantations in the South we can estimate the amount of expansionary investment implied by planting activities (Figure 42). Expansionary investment dominated planting through the Soil Bank period and up to 1970. Throughout the 1970’s and 1980’s, however, replacement investment far exceeded the amount of expansionary investment as the first wave of plantations came “on line” for harvesting. Expansionary investment started to grow again in the early 1980’s and reached about one million acres per year in the late 1980’s. It remained at this level through the 1990’s. Total tree planting fell by about 30 percent between 2001 and 2004, suggesting a reduction in the amount of expansionary investment, perhaps back to the levels observed in the late 1970’s.3
Investment levels correspond with market patterns described earlier. During the “Growth Phase,” between 1986 and 1998, landowners sustained the highest levels of market-driven investment both in terms of total investment and expansionary investment. With 3 We do not have a definitive estimate of expansionary investment since 1999 because comparable inventory estimates of plantation area are not available. However, planting rates fell much more than the rate of harvest, indicating a strong contraction in expansionary investment.
48
Draft Report—Do not cite without authors’ permission. Created on 11/29/2005 1:37 PM
the onset of the “Adjustment Phase,” tree planting fell substantially from this elevated level. The amount of this decline is roughly equivalent to the level of expansionary investment, suggesting forest investment has fallen to a level roughly equal to replacement investment. At a minimum, we can say that expansionary investment was at relatively low levels in 2003 and 2004. Because timber growing defines a very long production process, this long period of expansionary investment will likely expand the supply of timber for a long time to come. Even with the slow down in investment beginning in 2002 the supply of softwood products, especially softwood pulpwood, should continue to grow.
0
500,000
1,000,000
1,500,000
2,000,000
2,500,000
3,000,000
1950 1960 1970 1980 1990 2000 2010
Acr
es
planting expansion replacement
Figure 42. Total tree planting in the US South with estimates of both expansion and
replacement planting (see Appendix A).
Landownership Changes Research into the economics of timber management has identified important distinctions between different ownership groups (e.g., Newman and Wear 1993; Pattanayak et al. 2004). In particular, these studies have documented more productive management focus on forest industry lands compared to all other ownerships. Investment patterns described in the previous section also highlight the 20 percent of timberland held by industry owners in the late 1990’s contains more than 60 percent of the plantations and therefore a large majority of invested forest capital. In effect, management on industry lands has been the most responsive to timber scarcity signals since 1970.
49
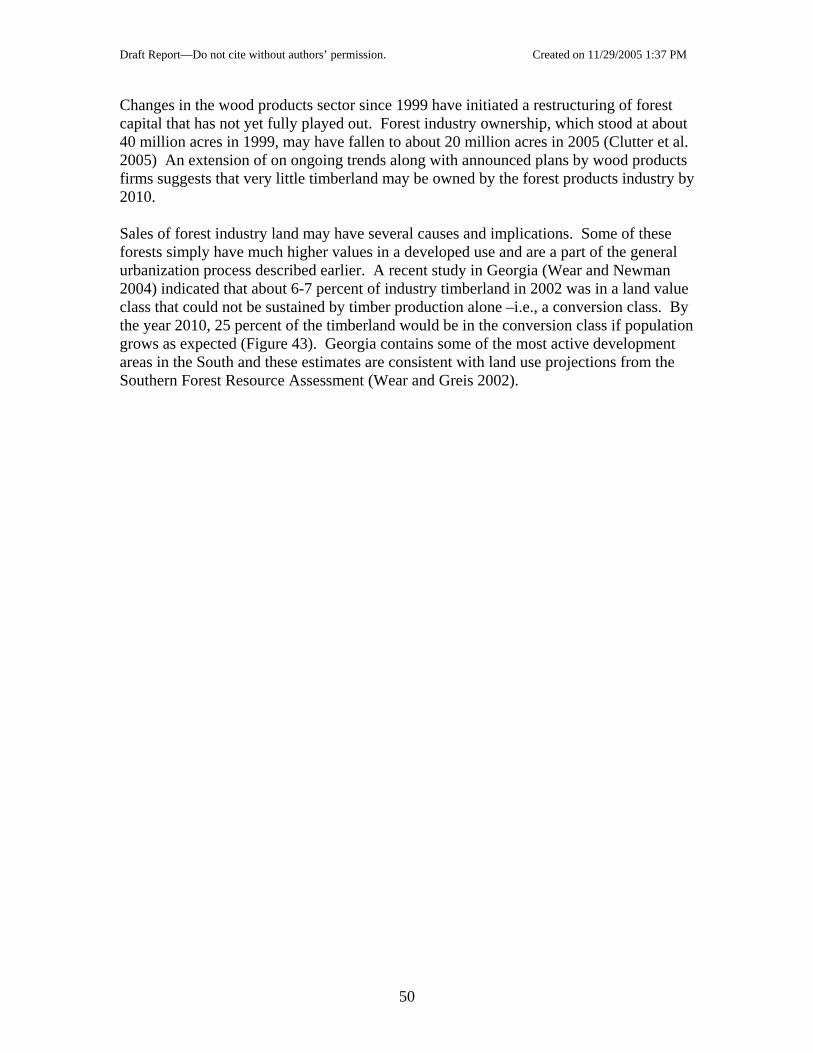
Draft Report—Do not cite without authors’ permission. Created on 11/29/2005 1:37 PM
Changes in the wood products sector since 1999 have initiated a restructuring of forest capital that has not yet fully played out. Forest industry ownership, which stood at about 40 million acres in 1999, may have fallen to about 20 million acres in 2005 (Clutter et al. 2005) An extension of on ongoing trends along with announced plans by wood products firms suggests that very little timberland may be owned by the forest products industry by 2010. Sales of forest industry land may have several causes and implications. Some of these forests simply have much higher values in a developed use and are a part of the general urbanization process described earlier. A recent study in Georgia (Wear and Newman 2004) indicated that about 6-7 percent of industry timberland in 2002 was in a land value class that could not be sustained by timber production alone –i.e., a conversion class. By the year 2010, 25 percent of the timberland would be in the conversion class if population grows as expected (Figure 43). Georgia contains some of the most active development areas in the South and these estimates are consistent with land use projections from the Southern Forest Resource Assessment (Wear and Greis 2002).
50
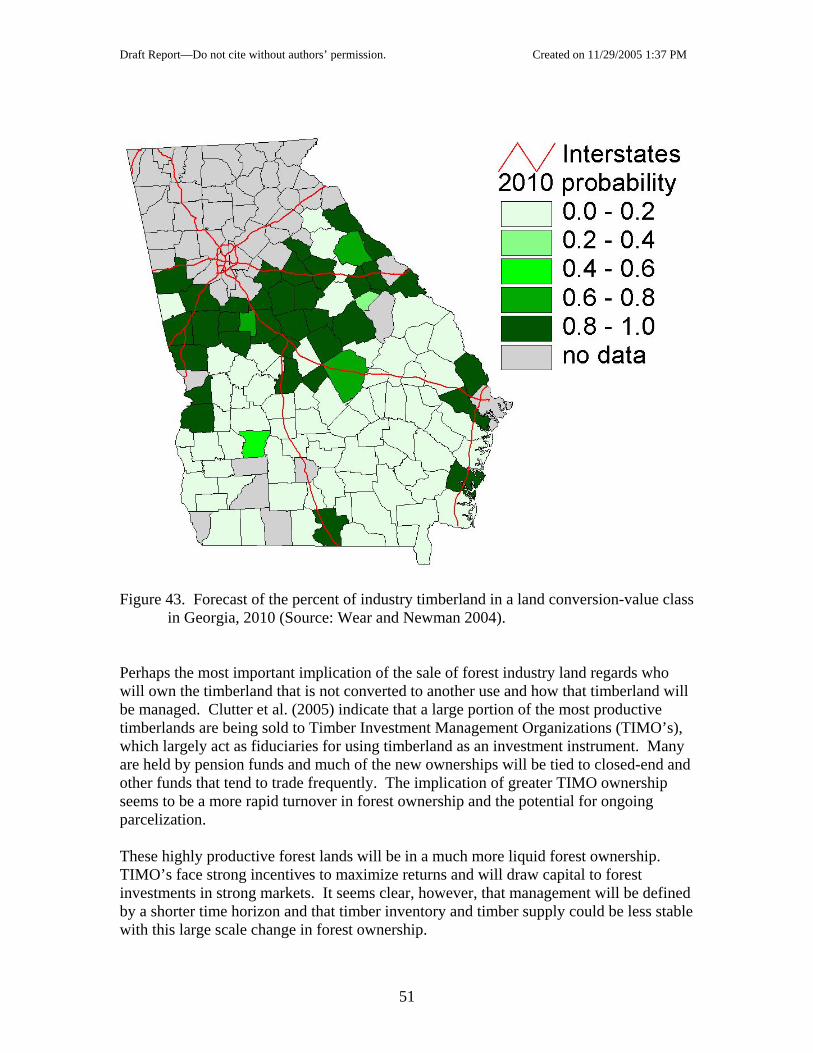
Draft Report—Do not cite without authors’ permission. Created on 11/29/2005 1:37 PM
Figure 43. Forecast of the percent of industry timberland in a land conversion-value class
in Georgia, 2010 (Source: Wear and Newman 2004). Perhaps the most important implication of the sale of forest industry land regards who will own the timberland that is not converted to another use and how that timberland will be managed. Clutter et al. (2005) indicate that a large portion of the most productive timberlands are being sold to Timber Investment Management Organizations (TIMO’s), which largely act as fiduciaries for using timberland as an investment instrument. Many are held by pension funds and much of the new ownerships will be tied to closed-end and other funds that tend to trade frequently. The implication of greater TIMO ownership seems to be a more rapid turnover in forest ownership and the potential for ongoing parcelization. These highly productive forest lands will be in a much more liquid forest ownership. TIMO’s face strong incentives to maximize returns and will draw capital to forest investments in strong markets. It seems clear, however, that management will be defined by a shorter time horizon and that timber inventory and timber supply could be less stable with this large scale change in forest ownership.
51
Draft Report—Do not cite without authors’ permission. Created on 11/29/2005 1:37 PM
Another implication of industry divestiture is the greater reliance by industry on timber produced by private landowners and the TIMO’s. This could increase the price responsiveness of the timber owning sector to demand shifts, increasing the volatility of timber prices. Furthermore, given that industry has historically accounted for a large share of pine plantations growth in area, the divestiture of these lands by industry could foretell a continued lower rate of pine plantation growth. As Prestemon and Abt (2002) indicate, fewer plantations are connected to greater total forest losses in the long run. Finally, we might speculate that the loss of industry ownership in the South could lead to lower investments in timber growing research and development. The consequences of such a pull-back are difficult to foresee but may leave the US in a worse position to compete globally in the long run, with other countries continuing such research into timber production technologies.
Key Observations--Supply
• Timberland area within the South was relatively stable through the twentieth century.
• Ongoing urbanization is focused in the Piedmont and along the coasts. Forest loss will be highest in the southeast (from Virginia to Florida.)
• Agricultural prices are such that increased timber prices or a reduction in agricultural subsidies could lead to an expansion of pine plantations on agricultural lands.
• Future scenarios have a wide variance—they range from no net loss of acres to a net loss of 31 million acres by 2040 (16 percent of forests)—depending on the future price of timber.
• In spite of strong growth in hardwood pulpwood prices there has been little investment in hardwood production (i.e., hardwood plantations).
• After accounting for Soil Bank and Conservation Reserve programs, planting of pines increased at a steady rate between 1945 and 1998.
• With the exception of Soil Bank and Conservation Reserve periods, industry has had a disproportionately high share of planting (45-70 percent of planting with only about 20 percent of timberland).
• Planting has served as both replacement and expansionary investment. In the 1990’s, levels of expansionary and replacement investment were each about one million acres per year.
• Recent declines in planting indicate a reduction in expansionary investment since the late 1990’s.
• The supply effects of recent reductions in expansionary investment will not be felt for some time.
• Forest products firms, which hold a disproportionately high share of the forest capital, have been selling much of their lands, about 50 percent by 2005.
• Some industry land sales are explained by urbanization pressures but the largest share will remain in timber production in the near term.
52

Draft Report—Do not cite without authors’ permission. Created on 11/29/2005 1:37 PM
• The shift toward TIMO management may entail more parcelization and fragmentation of timberland. It may also lead to a less stable supply of timber, more volatile timber prices, and a slower rate of increase in the area of pine plantations.
• Divestiture of industry lands could lead to lower overall investments into timber research and development, leaving the US South less able to compete against foreign producers in the long run.
53
Draft Report—Do not cite without authors’ permission. Created on 11/29/2005 1:37 PM
Conclusions and Implications
Our focus in completing this rapid assessment of timber markets in the southeastern United States has been on understanding the demand and supply factors that have played out in the markets for various timber products. The following might be considered the “meta conclusions” of our study, highlighting the most significant forces of change driving markets for timber products in the South.
1. The demand for domestically produced timber products has shifted downward in the United States. Consumption of solidwood products has not grown at the same pace as housing starts, and the per capita consumption of paper has declined over the past ten years after being relatively stable for many years. These declines in domestic production and per capita consumption of some timber products have been coupled with a strong decline in the off-shore demand for US-produced timber products. Exports of wood chips fell from its peak in 1998 to nearly zero exports in 2003.
2. The supply of domestically produced timber products has continued to expand outward since the late 1990’s. Timber supply is a function of the amount of land dedicated to forest growing and the intensity of management. The area of timberland has remained fairly constant since the 1970’s, and the area of intensively managed (planted) forests continued to expand through the 1990’s (that is, expansionary investment continued even after production and prices fell). Because timber is such a long-lived asset, supply could continue to move outward and dampen prices for years to come. The supply effects of recent declines in planting may not be felt for several more years.
3. Fundamentals of economics indicate that a substantial downward shift in demand coupled with a constant to increasing supply leads to (a) a decline in output and (b) a disproportionately strong decline in prices. This is exactly what has been observed in pulpwood markets—especially softwood pulpwood markets—since 1998.
4. An evaluation of investment of wood products firms in manufacturing capacity within the region provides insights into future production potential. Capacity for lumber production has remained strong, while capacity for paper production has declined since the late 1990’s. Indications are therefore that demand for pulpwood to produce paper may not rebound to early 1990’s levels in the foreseeable future. Long term demand for solidwood products appears strong.
5. Persistent low prices for softwood pulpwood may indicate opportunities for the manufacture of other products from this product class. Indeed, several firms have recently announced plans to build plants to produce oriented strand board in many of the areas where pulp mills have closed. Announced plants are sometimes not built, but the number of announcements indicates that expansion in this sector will provide additional demand for pulpwood in the next five years.
6. Upward pressure on hardwood pulpwood prices and downward pressure on softwood pulpwood prices combine to provide incentives to shift production toward softwoods. Indeed, after a long period of hardwood substituting for
54
Draft Report—Do not cite without authors’ permission. Created on 11/29/2005 1:37 PM
softwood in paper production, we might expect to see an increase in the share of softwood inputs.
7. Imports of hardwood chips into the South remain relatively small compared to the total consumption. However, it appears that if hardwood chip prices rise above thresholds already experienced in parts of the region (e.g., Florida), then imports from South America become a viable alternative to domestic production. This “backstop supply” of plentiful eucalyptus chips indicates that future hardwood pulpwood prices may have a ceiling in the region.
Concerns with southern timber markets have necessarily shifted from a focus on supply issues to a focus on demand issues. Forest investment, driven by both market forces and tree-planting programs, has succeeded in producing plentiful and sustainable timber supplies and supported a more than doubling of timber production over a thirty year period. Forecasting models (e.g., Prestemon and Abt 2002) indicate that the region can readily supply even more timber. While some uncertainties regarding supply may be indicated by the divestiture of forest industry lands, they are at least partially quelled by a surge of investment capital into the sector from pension funds and other sources. The big question facing the sector is how will demand respond in the future? We find little evidence for a strong rebound in pulpwood demand for paper production or a return of chip export markets. Increased production of OSB and other engineered wood products may raise demand for pulpwood sized materials but not yet to the extent that they displace declines in demand from the paper sector. This means that softwood pulpwood prices are not likely to rebound to mid 1990’s levels anytime soon. Emergence of biomass energy markets may play a role in the future but this is highly uncertain at this time.
55
Draft Report—Do not cite without authors’ permission. Created on 11/29/2005 1:37 PM
Literature Cited Clutter et al. In Process. Changing forest ownerships in the South. University of
Georgia, Warnell School of Forest Resources. Conner, Roger C. and Andrew J. Hartsell. Forest areas and conditions. 2002. Chapter 17
in (Wear and Greis, eds.) The Southern Forest Resource Assessment: Technical Report. USDA Forest Service, General Technical Report SRS-53, pp. 357-402.
Chapman, S. 2005. Data obtained by special request, compiled from State reports, 2000-2004.
Engel, C. 1999. Accounting for real U.S. exchange rate changes. Journal of Political Economy 107(3):507-538.
Fleishman, S.J., I.L. Eastin, and S.R. Shook. 1999. Material substitution trends in residential construction, 1995 vs. 1998. Center for International Trade in Forest Products Working Paper Number 73. 76 p.
Goldberg, P.K., and M.M. Knetter. 1997. Goods prices and exchange rates: what have we learned? Journal of Economic Literature 35(3):1243-1272.
Hair, D. 1963. The economic importance of timber in the United States. Washington, D.C.: USDA Forest Service Miscellaneous Publication 941. 91 p.
Haynes, Richard W. 2003. Analysis of the timber situation in the United States: 1952-2050. USDA Forest Service, Pacific Northwest Research Station, Gen Tech Report PNW-GTR-560. 254 p.
Ince, P. 2000. Industrial wood productivity in the United States, 1900-1998. USDA Forest Service Forest Products Laboratory Research Note FPL-RN-0272. 16 p.
Ince, P. Durbak, and Sendak. Johnson, T.G. and C.D. Steppleton. 2005. Southern Pulpwood Production, 2003. USDA
For. Serv. Res. Bull. SRS-101. McKeever, T. and H. Spelter, 1998. Wood-based panel plant locations and timber
availability in selected U.S. States. USDA For. Serv. Gen. Tech. Rpt. FPL-GTR-103. 53 p.
Mississippi State University Extension Service. 2005. 2003 Harvest of forest products. Available at http://msucares.com/forestry/economics/reports/2003_harvest_report.html. Accessed by authors March 16, 2005.
Moulton, R. 2000. Data obtained by special request, and compiled from state reports, 1945-1999.
Nagubadi, R., D. Zhang, J. Prestemon, and D.N. Wear. 2004. Softwood lumber products in the United States: substitutes, complements, or unrelated? Forest Science.
Newman, David H. and David N. Wear. 1993. The production economics of private forestry: A comparison of industrial and nonindustrial forest owners. American Journal of Agricultural Economics 75:674-684.
Pattanayak, S.K., R.C. Abt, A.J. Sommer, B.C. Murray, F.Cubbage, D.N. Wear, J-C. Yang, and S. Ahn. 2004. Forest forecasts: Does individual heterogeneity matter for market and landscape outcomes? Forest Policy and Economics 6(3-4):243-260.
Phelps, R.B. 1980. Timber in the United States economy, 1963, 1967, and 1972. Washington, D.C.: USDA Forest Service General Technical Report WO-21. 90 p.
56
Draft Report—Do not cite without authors’ permission. Created on 11/29/2005 1:37 PM
Powell, D.S., J.L. Faulkner, D.R. Darr, Z. Zhu, and D.W. MacCleery. 1994. Forest resources of the United States, 1992. Fort Collins, CO: USDA Forest Service General Technical Report RM-234 (Revised). 133 p.
Random Lengths. 1996. Random Lengths 1995 Yearbook: forest product market prices and statistics. Eugene, Oregon: Random Lengths Publications, Inc.
Random Lengths. 2005. Random Lengths 2004 Yearbook: forest product market prices and statistics. Eugene, Oregon: Random Lengths Publications, Inc.
Smith, W.B., J.S. Vissage, D.R. Darr, and R.M. Sheffield. 2001. Forest resources of the United States, 1997. USDA Forest Service General Technical Report NC-219. St. Paul, MN: U.S. Dept. of Agriculture, Forest Service, North Central Research Station.
Smith, W.B., P.D. Miles, J.S. Vissage, and S.A. Pugh. 2004. Forest resources of the United States, 2002. USDA Forest Service General Technical Report NC-241. St. Paul, MN: U.S. Dept. of Agriculture, Forest Service, North Central Research Station.
Spelter, H. 2001. Wood-based Panels—Supply, Trade and Consumption. In ECE/FAO Forest Products Annual Market Review 1999-2000. pp 113-130.
Spelter, H. and M. Alderman. 2003. Profile 2003: Softwood sawmills in the United States and Canada. USDA For. Serv. Res. Pap. FPL-RP-608. 79 p.
B.R. Smith, R.W. Rice, and P. Ince. 2003. Pulp capacity in the United States, 2000. USDA For. Serv. Gen. Tech. Rpt. GTR-FPL-139.
U.S. Bureau of Labor Statistics. 2005. Producer price index, industry data, obtained on 3/7/05, from http://data.bls.gov/PDQ/outside.jsp?survey=pc
U.S. Census Bureau. 2005. New privately owned housing units started, 1959-2005 (January). Data obtained on March 7, 2005, from http://www.census.gov/const/startsua.pdf
USDA Forest Service. 1958. Timber resources for America's future. Washington, D.C.: USDA Forest Service Forest Resource Report No. 14. 713 p.
USDA Forest Service. 1982. An analysis of the timber situation in the United States 1952-2030. Washington, D.C.: USDA Forest Service Forest Resource Report No. 23. 499 p.
Uusivuori, J., and J. Buongiorno. 1991. Pass through of exchange rates on prices of forest product exports from the United States to Europe and Japan. Forest Science 37(3):931-948.
Waddell, K.L., D.D. Oswald, and D.S. Powell. 1989. Forest statistics of the United States, 1987. Portland, OR: USDA Forest Service Resource Bulletin PNW-RB-168. 106 p.
Wear, D.N. 1991. Evaluating technology and policy shifts in the forest sector: Technical issues for analysis. P. 147-155 in Proceedings of the 1991 Southern Forest Economics Workshop, S.J. Chang (ed.). Washington, D.C.
Wear, D.N. 1994. Measuring investment and productivity in timber production. Forest Science 40(1):192-208.
Wear, D.N. and P.J. Parks. 1994. The economics of timber supply: An analytical synthesis of modeling approaches. Natural Resource Modeling 8(3):199-223.
Wear, D.N. and J.G. Greis. 2002. The Southern Forest Resource Assessment – Summary Report. USDA Forest Service, Southern Research Station, Gen Tech. Report SRS-53. 103 p.
Wear, D.N., and D.H. Newman. 2004. The speculative shadow over timberland values in the US South. Journal of Forestry (December): 25-31.
57

Draft Report—Do not cite without authors’ permission. Created on 11/29/2005 1:37 PM
Zhang, Y., and J. Buongiorno. 1998. Paper or plastic? The United States' demand for paper and paperboard packaging. Scandinavian Journal of Forest Research 13:54-65.
Zhang, Y., and J. Buongiorno. 1997. Communication media and demand for printing and publishing papers in the United States. Forest Science 43(3):362-377.
58
Draft Report—Do not cite without authors’ permission. Created on 11/29/2005 1:37 PM
Appendix A. Data Notes
Throughout this report, we document the sources of data upon which discussions are based. In this section we document cases where additional analysis was applied to the published data.
Recent Trends in the Forest Sector
Harvest quantities—Roundwood output for the US South is taken from the USDA Forest Service Timber Product Output system maintained by the Forest Inventory and Analysis Research Work Units. Reports of roundwood output for the region have been developed for the RPA National Inventory Database for the years 1952, 1962, 1977, 1981, 1996, and 2001 (see, e.g., Smith et al. 2001). Comparable annual pulpwood production data have been compiled for the region (see, e.g., Johnson and Steppleton). We constructed an annual series of softwood sawlog production by interpolating between the RPA reporting years based on the production of softwood lumber within the region. Prices—We constructed price indices by product class for the US South based on prices reported for substate regions by Timber Mart South. The index is an average weighted by inventory volumes of the respective regions. Prices are adjusted for inflation by the consumer price index.
Demand Factors
No entry for this section.
Supply Factors Tree planting data—Area of planting activity was taken from reports by Moulton (various years) and personal communications with analysts who have tracked the data for the final four years of the time series. To separate expansion from replacement investment, we compared planting with changes in the inventory of plantations reported for various years in Conner and Hartsell (2002). The increase in reported plantations was taken to equal the amount of expansionary investment for the period. This amount was assigned to individual years for the period based on gross planting. The remainder (total planting minus expansionary investment) was defined as replacement investment.
59