Embed Size (px)
Citation preview
The US Health Care System:Reformed at Last!
Summer Enrichment Program Orientation June, 2010
Richard Lichtenstein PhD, MPH
Department of Health Management and Policy
School of Public Health
University of Michigan

The Patient Protection and Affordable Care Act
(March 23,2010)This is historic legislation that ranks with Social
Security, Medicare and the Civil Rights Act in terms of creating social change
People have been advocating for a national health insurance plan in the US since at least 1913. They have been thwarted many, many times, but this time they were successful!
The law is certainly not “perfect,” but it moves us substantially.

Why We Need Health Insurance Reform (and more)
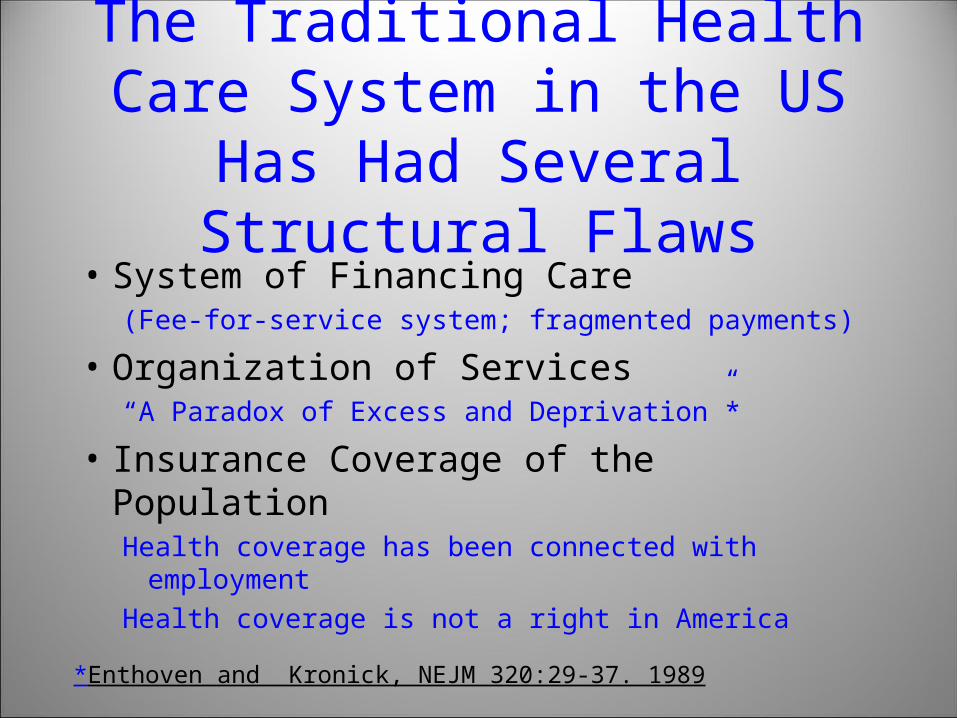
The Traditional Health Care System in the US Has Had Several Structural Flaws
• System of Financing Care(Fee-for-service system; fragmented payments)
• Organization of Services“A Paradox of Excess and Deprivation”*
• Insurance Coverage of the PopulationHealth coverage has been connected with employment
Health coverage is not a right in America
*Enthoven and Kronick, NEJM 320:29-37. 1989

PROBLEMS WE FACE AS A RESULT:
• COSTS
• ACCESS TO COVERAGE AND CARE
• QUALITY AND ACCOUNTABILITY
• RACIAL AND ECONOMIC DISPARITIES in HEALTH AND CARE
6
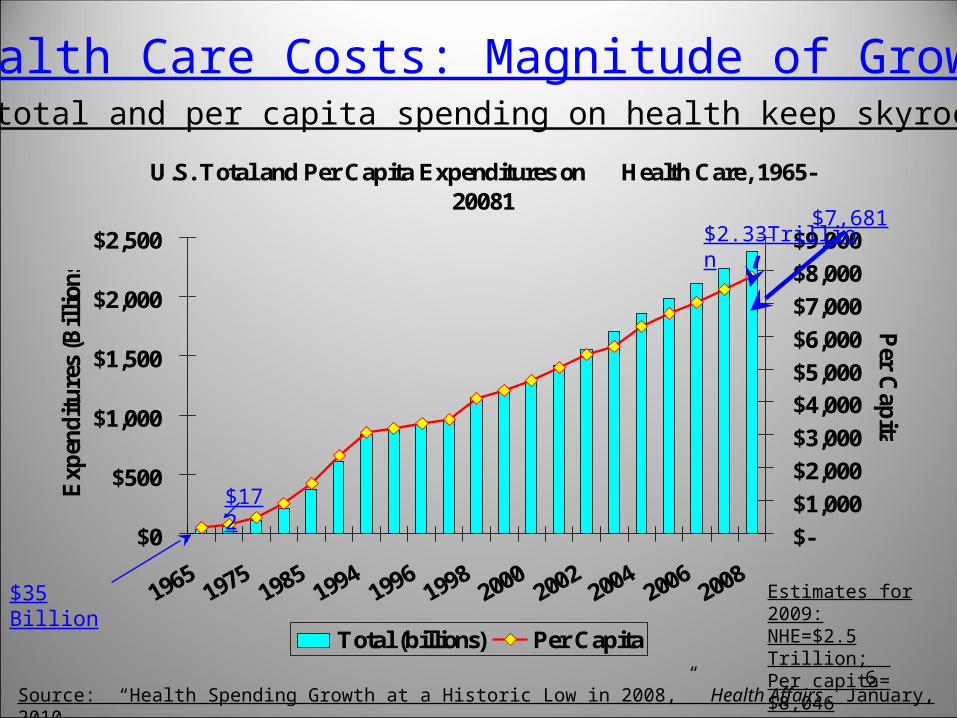
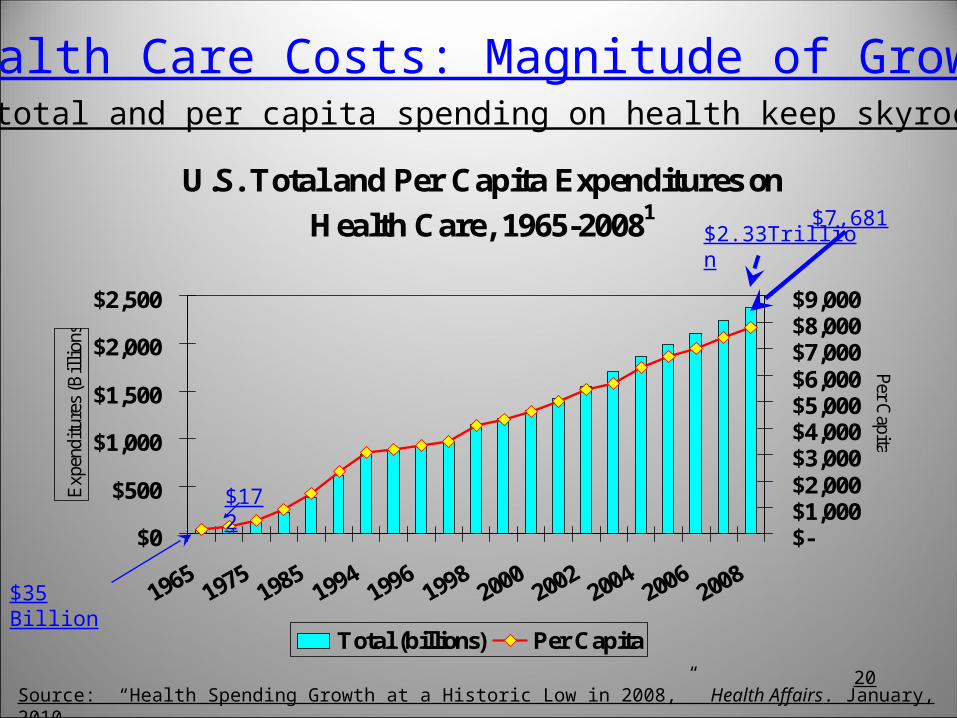
U.S. Total and Per Capita Expenditures on Health Care, 1965-20081
$0
$500
$1,000
$1,500
$2,000
$2,500
Exp
end
itu
res
(Bil
lion
s)
$-
$1,000
$2,000
$3,000
$4,000
$5,000
$6,000
$7,000
$8,000
$9,000
Per C
apita
Total (billions) Per Capita
Source: “Health Spending Growth at a Historic Low in 2008,” Health Affairs. January, 2010.
$7,681
Both total and per capita spending on health keep skyrocketing.
Health Care Costs: Magnitude of Growth
$172
$2.33Trillion
$35 Billion Estimates for 2009: NHE=$2.5 Trillion; Per capita=$8,046

The US Spends the Highest Fraction of National Income on Health
OECD Health Data 2008. Latest year of data available is 2006
0%2%4%6%8%
10%12%14%16%
Total expenditure on health (% of GDP)
For US, % of GDP was 16.2% in 2008. The estimate for 2009 is 17.3%

Access to Care

The number of uninsured people in the US is unacceptably high and is
rising quickly in this recession• In 2008 there were about 46 million
uninsured and over 70 million underinsured people in the US
• The number of uninsured would have risen to about 55 million by the end of 2019
• Being Uninsured is very bad for your health!
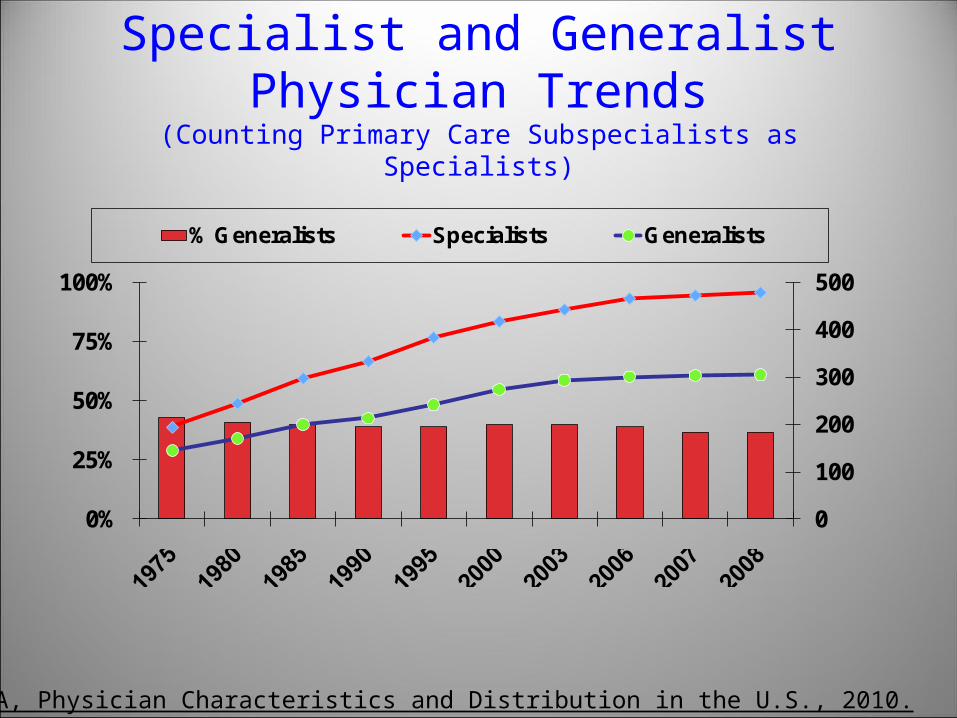
Specialist and Generalist Physician Trends
(Counting Primary Care Subspecialists as Specialists)
0
100
200
300
400
500
0%
25%
50%
75%
100%
% Generalists Specialists Generalists
Source: AMA, Physician Characteristics and Distribution in the U.S., 2010.

Projection of RN’s Supply vs. Demand
Quality“Serious and widespread quality problems
exist throughout American medicine. These problems…occur in small and large communities alike, in all parts of the country... Very large numbers of Americans are harmed as a result.”*
* Quoted in: Berwick, D.M. (2002). "A User’s Manual for the IOM’s 'Quality Chasm' Report." Health Affairs 21(3):80-90.
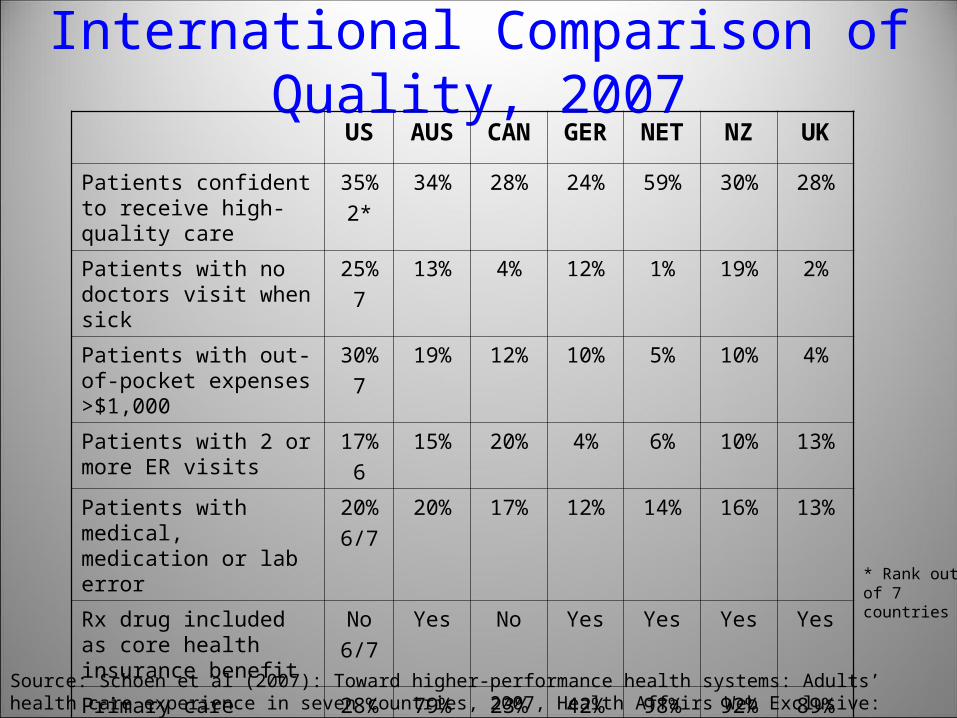
International Comparison of Quality, 2007US AUS CAN GER NET NZ UK
Patients confident to receive high-quality care
35%
2*
34% 28% 24% 59% 30% 28%
Patients with no doctors visit when sick
25%
7
13% 4% 12% 1% 19% 2%
Patients with out-of-pocket expenses >$1,000
30%
7
19% 12% 10% 5% 10% 4%
Patients with 2 or more ER visits
17%
6
15% 20% 4% 6% 10% 13%
Patients with medical, medication or lab error
20%
6/7
20% 17% 12% 14% 16% 13%
Rx drug included as core health insurance benefit
No
6/7
Yes No Yes Yes Yes Yes
Primary care physicians using electronic medical records
28%
6
79% 23% 42% 98% 92% 89%
Source: Schoen et al (2007): Toward higher-performance health systems: Adults’ health care experience in seven countries, 2007, Health Affairs Web Exclusive: w717-w734.
* Rank out of 7 countries

Racial and Economic Disparities

Infant Mortality Rates by Race*United States, 1970-2005
0
10
20
30
40
1970
1980
1981
1982
1983
1984
1985
1986
1987
1988
1989
1990
1991
1992
1993
1994
1995
1996
1997
1998
1999
2000
2001
2002
2003
2004
2005
All races White Black
Source: Health, United States, 2008, Table 21
Dea
ths
per
1,0
00 L
ive
Bir
ths
*Race of mother
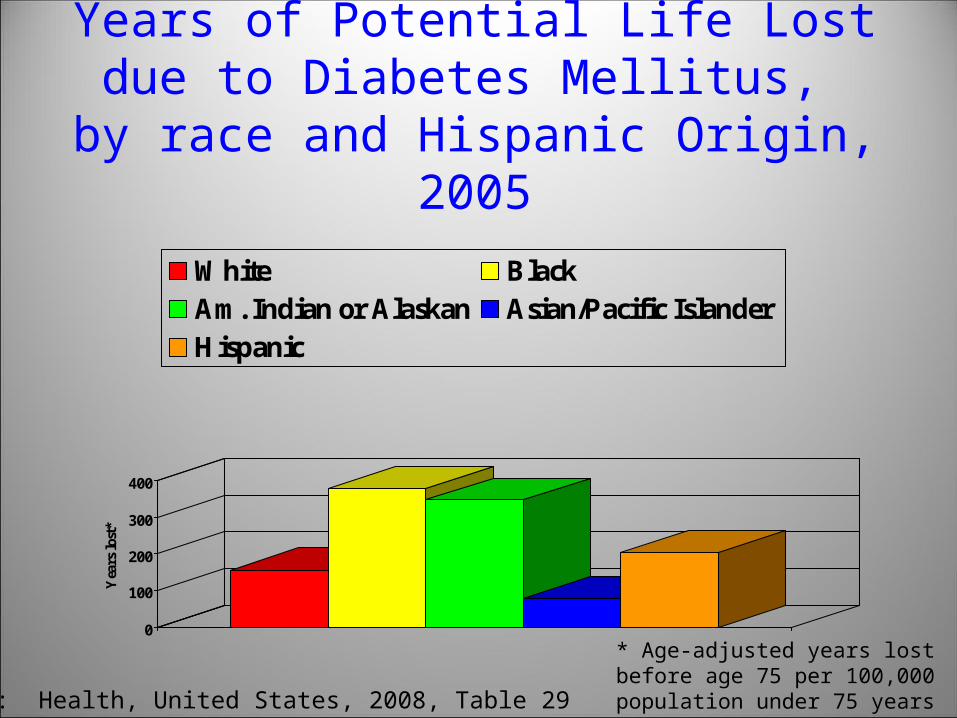
Years of Potential Life Lostdue to Diabetes Mellitus,
by race and Hispanic Origin, 2005
0
100
200
300
400
Yea
rs l
ost*
White BlackAm. Indian or Alaskan Asian/Pacific IslanderHispanic
Source: Health, United States, 2008, Table 29
* Age-adjusted years lost before age 75 per 100,000 population under 75 years of age.

Current Distribution of Health Insurance Coverage in the US

Types of US Financing and Number of People Covered, by Category
Note: Numbers do not add to total population because some persons fall in more than one category.Medicare data is as of July 2008 (Source: Kaiser Family Foundation – based on Mathematica Policy Research analysis of CMS State/County Market Penetration Files, July 2008). Latest Medicaid data is for fiscal year 2006 (Source: The Urban Institute and Kaiser Commission on Medicaid and the Uninsured – based on data from Medicaid Statistical Information System (MSIS) reports from the Centers for Medicare and Medicaid Services (CMS), 2009).Remaining data is for 2007 (Source: Kaiser Family Foundation – based on the Census Bureau's March 2007 and 2008 Current Population Survey).
47% of total spending 53% of total

Major Problems We Face in Financing Health Care in 2010
20
U.S. Total and Per Capita Expenditures on
Health Care, 1965-20081
$0
$500
$1,000
$1,500
$2,000
$2,500
Exp
endi
ture
s (B
illi
ons)
$-$1,000$2,000$3,000$4,000$5,000$6,000$7,000$8,000$9,000
Per C
apita
Total (billions) Per Capita
Source: “Health Spending Growth at a Historic Low in 2008,” Health Affairs. January, 2010.
$7,681
Both total and per capita spending on health keep skyrocketing.
Health Care Costs: Magnitude of Growth
$172
$2.33Trillion
$35 Billion

Employer Sponsored Insurance
0%
20%
40%
60%
80%
100%
120%
1999 2000 2001 2002 2003 2004 2005 2006 2007 2008
Health Insurance Premiums Workers' Earnings
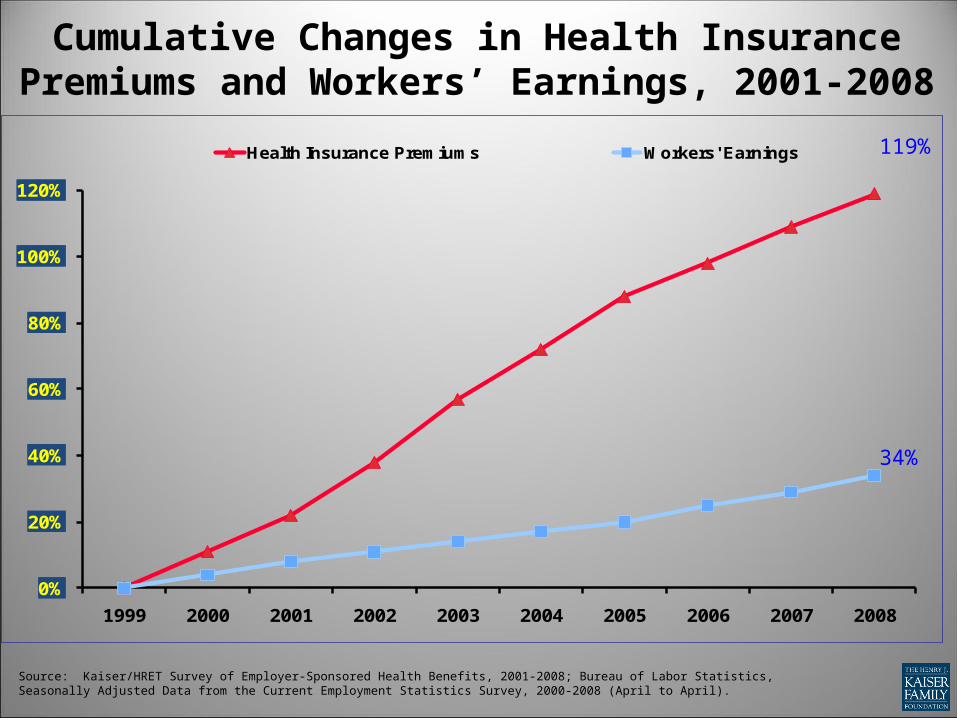
Cumulative Changes in Health Insurance Premiums and Workers’ Earnings, 2001-
2008
Source: Kaiser/HRET Survey of Employer-Sponsored Health Benefits, 2001-2008; Bureau of Labor Statistics, Seasonally Adjusted Data from the Current Employment Statistics Survey, 2000-2008 (April to April).
119%
34%
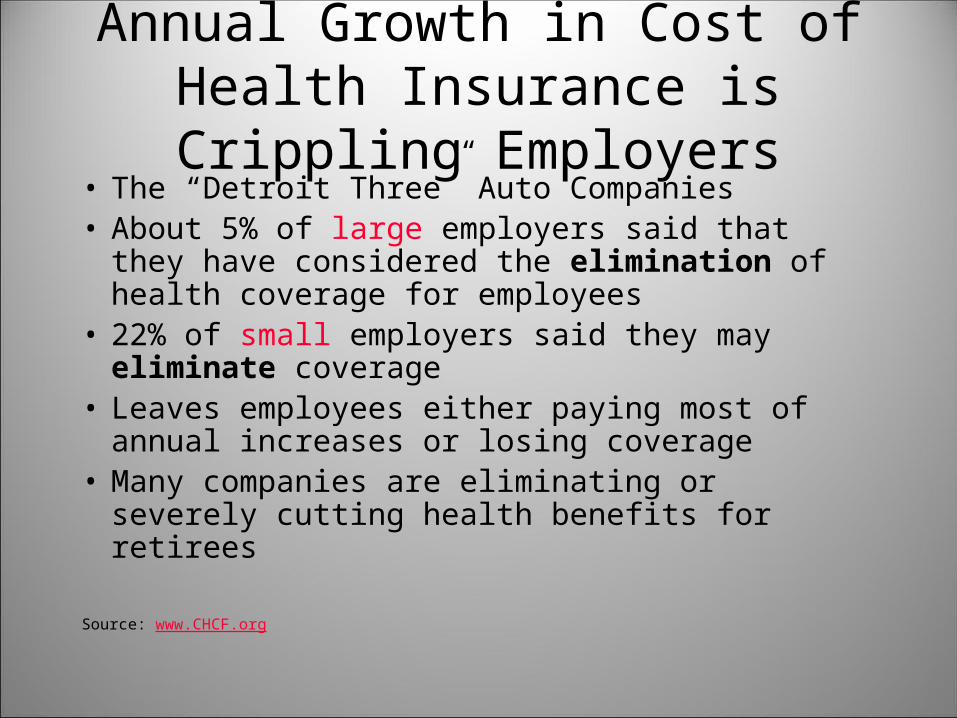
Annual Growth in Cost of Health Insurance is Crippling Employers
• The “Detroit Three” Auto Companies• About 5% of large employers said that they have
considered the elimination of health coverage for employees
• 22% of small employers said they may eliminate coverage
• Leaves employees either paying most of annual increases or losing coverage
• Many companies are eliminating or severely cutting health benefits for retirees
Source: www.CHCF.org

Medicare

Medicare• 1965 amendment to the Social Security Act of
1935 (Title XVIII)• Social Insurance for the elderly and disabled.
Nationwide eligibility and benefits.• A Defined Benefit Plan with no limit to annual
spending• Covers 45 million people: over-65, disabled, people
with ESRD, ALS• In 2009, Medicare spending was (approx) $507
billion (13 % of the federal budget)
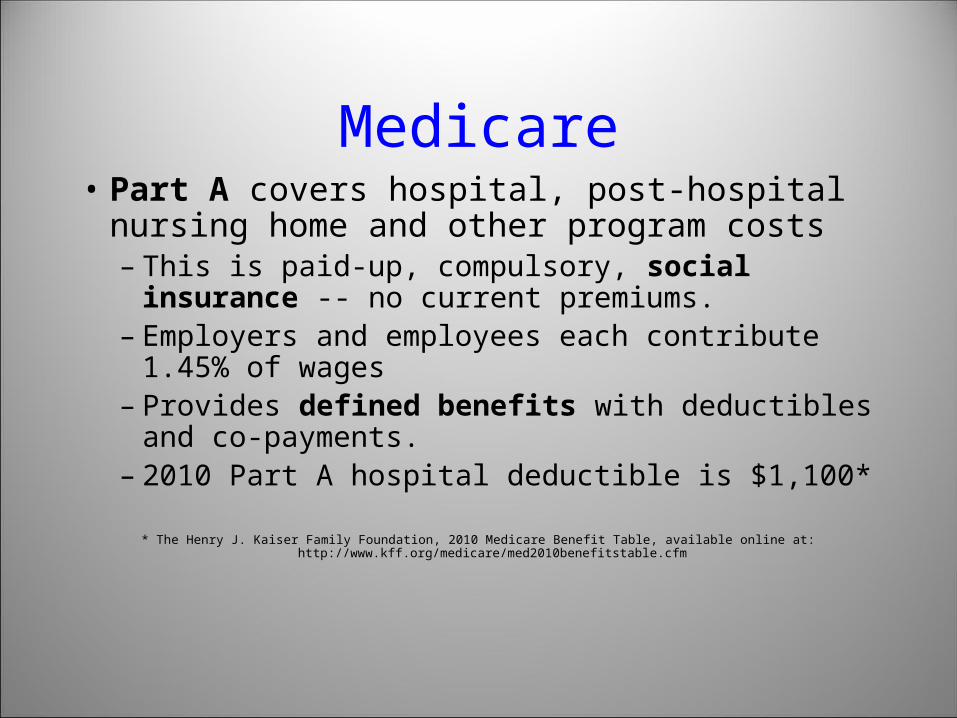
Medicare• Part A covers hospital, post-hospital nursing
home and other program costs– This is paid-up, compulsory, social insurance -- no
current premiums. – Employers and employees each contribute 1.45% of
wages– Provides defined benefits with deductibles and co-
payments. – 2010 Part A hospital deductible is $1,100*
* The Henry J. Kaiser Family Foundation, 2010 Medicare Benefit Table, available online at: http://www.kff.org/medicare/med2010benefitstable.cfm
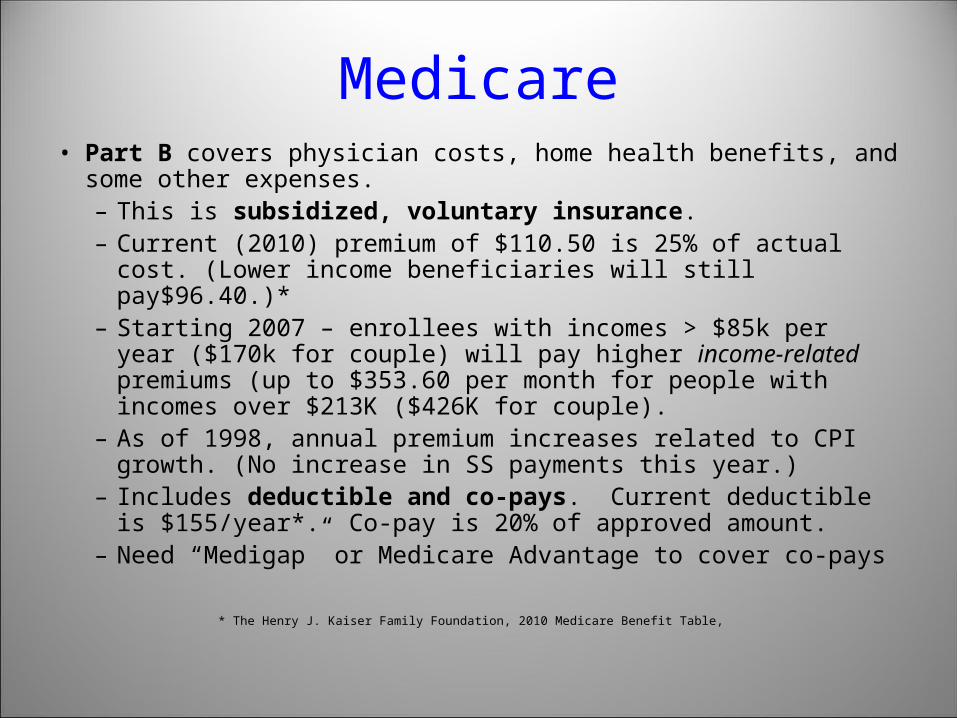
Medicare• Part B covers physician costs, home health benefits, and some other
expenses.– This is subsidized, voluntary insurance. – Current (2010) premium of $110.50 is 25% of actual cost.
(Lower income beneficiaries will still pay$96.40.)*– Starting 2007 – enrollees with incomes > $85k per year ($170k
for couple) will pay higher income-related premiums (up to $353.60 per month for people with incomes over $213K ($426K for couple).
– As of 1998, annual premium increases related to CPI growth. (No increase in SS payments this year.)
– Includes deductible and co-pays. Current deductible is $155/year*. Co-pay is 20% of approved amount.
– Need “Medigap” or Medicare Advantage to cover co-pays
* The Henry J. Kaiser Family Foundation, 2010 Medicare Benefit Table,
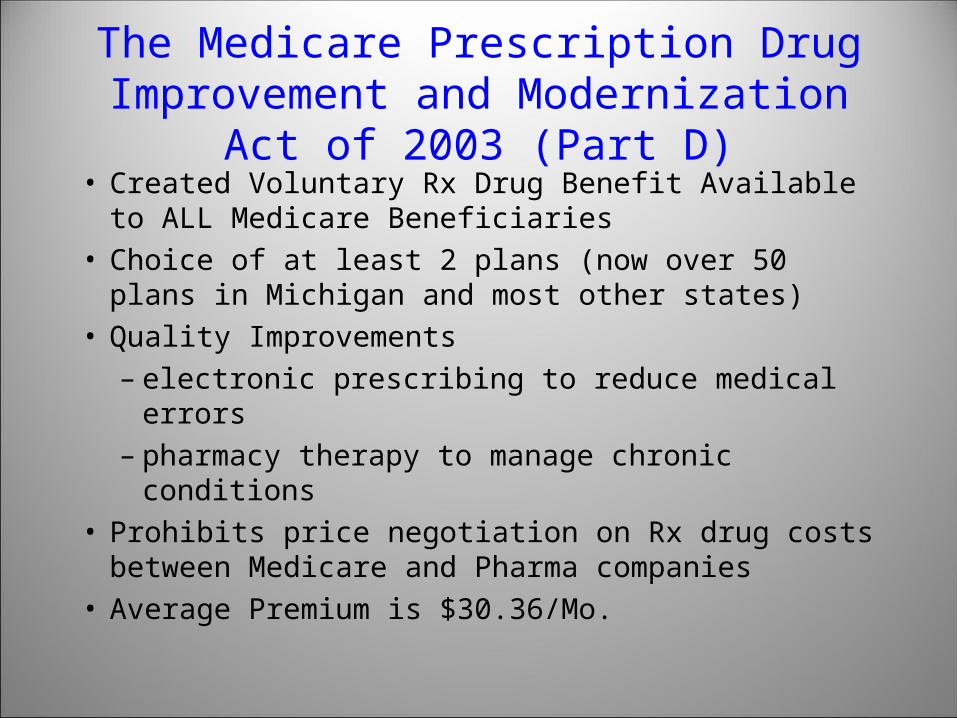
The Medicare Prescription Drug Improvement and Modernization Act of 2003 (Part D)
• Created Voluntary Rx Drug Benefit Available to ALL Medicare Beneficiaries
• Choice of at least 2 plans (now over 50 plans in Michigan and most other states)
• Quality Improvements– electronic prescribing to reduce medical errors– pharmacy therapy to manage chronic conditions
• Prohibits price negotiation on Rx drug costs between Medicare and Pharma companies
• Average Premium is $30.36/Mo.
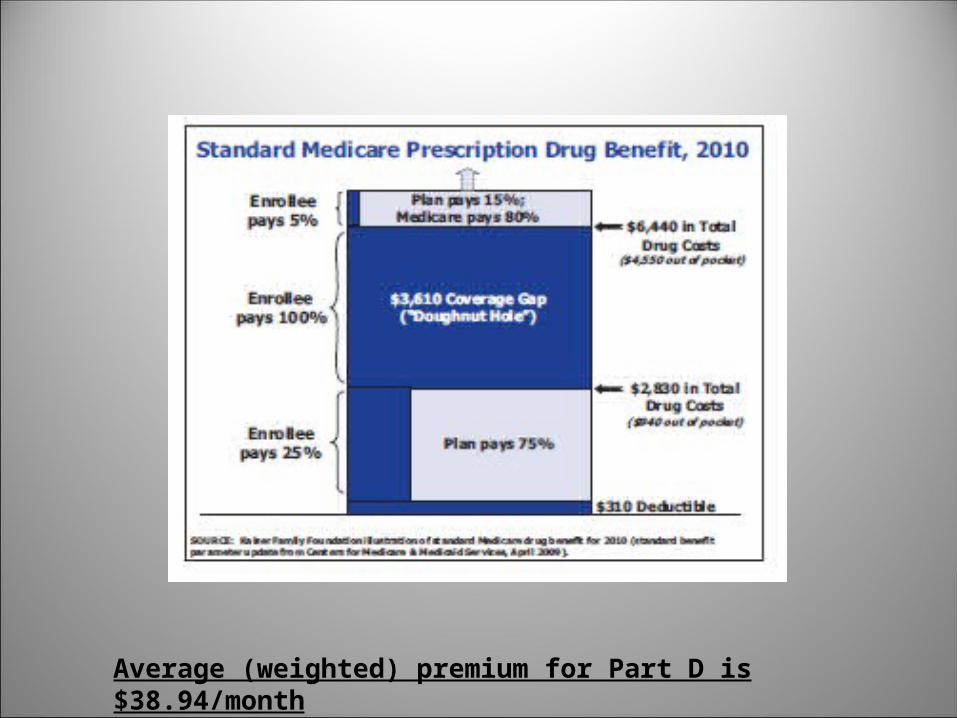
Average (weighted) premium for Part D is $38.94/month
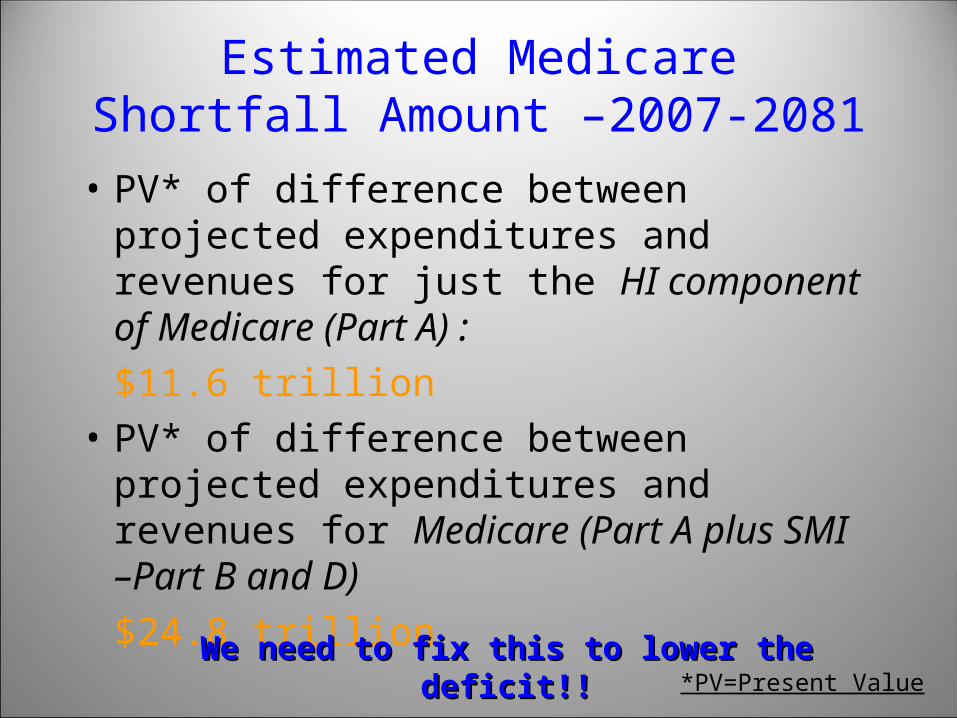
Estimated Medicare Shortfall Amount –2007-2081
• PV* of difference between projected expenditures and revenues for just the HI component of Medicare (Part A) :
$11.6 trillion
• PV* of difference between projected expenditures and revenues for Medicare (Part A plus SMI –Part B and D)
$24.8 trillion
*PV=Present ValueWe need to fix this to lower the deficit!!We need to fix this to lower the deficit!!
Medicaid

Major Features of Medicaid Structure
1. Federal-State Matching Program• Feds set Standards, States define program and
manage it
2. Only certain low-income people are eligible3. States Select Benefit Package (within Fed.
Guidelines)4. There are 56 different Medicaid Programs5. In 2009, Medicaid spent approx. $378.3
Billion
Aged Blind
DisabledAFDC/TANF
Other Kids Everyone else
PregnantWomen
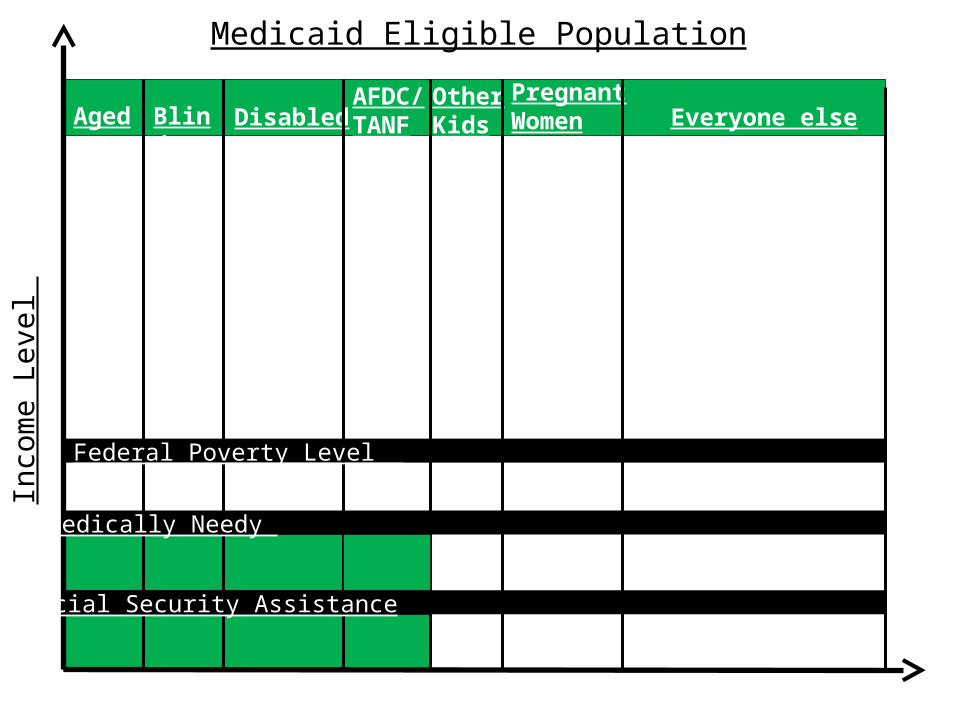
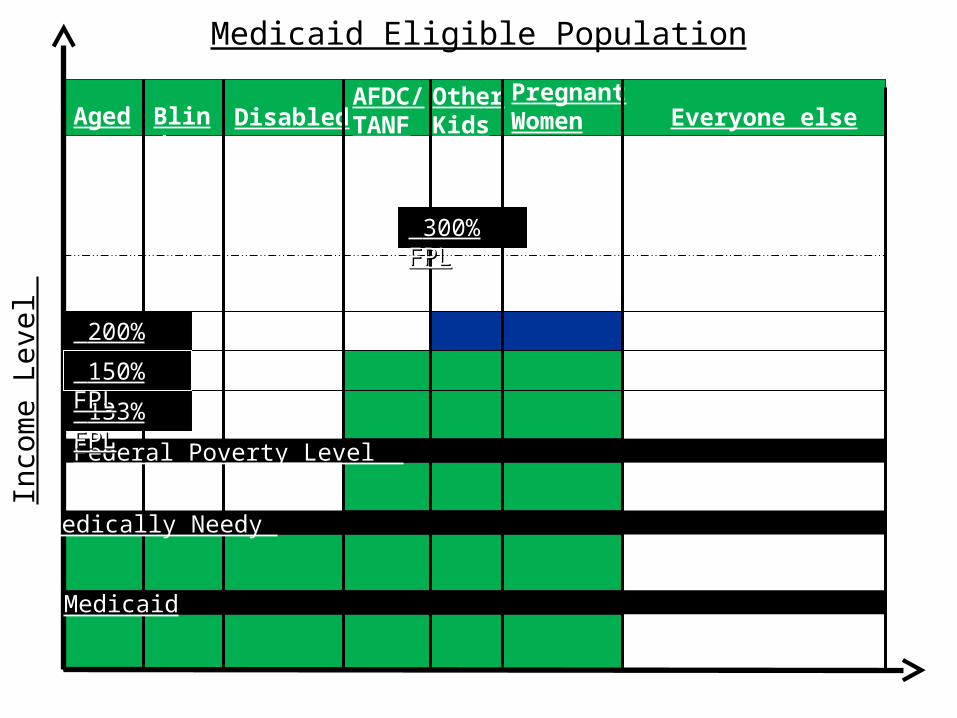
Medicaid Eligible PopulationIn
com
e L
evel
Federal Poverty Level
Medically Needy
Social Security Assistance

Aged Blind
DisabledAFDC/TANF
Other Kids Everyone else
PregnantWomen
Medicaid Eligible PopulationIn
com
e L
evel
Federal Poverty Level
Medically Needy
Medicaid
133% 133% FPLFPL
150% 150% FPLFPL
200% 200% FPLFPL
300% 300% FPLFPL
Health Health ReformReform
SCHIPSCHIP
133% 133% FPLFPL
133% 133% FPLFPL
200% 200% FPLFPL
300% 300% FPLFPL
150% 150% FPLFPL

Aged Blind
DisabledAFDC/TANF
Other Kids Everyone else
PregnantWomen
Medicaid Eligible PopulationIn
com
e L
evel
Federal Poverty Level
Medically Needy
Medicaid
133% 133% FPLFPL

Aged Blind
DisabledAFDC/TANF
Other Kids Everyone else
PregnantWomen
Medicaid Eligible PopulationIn
com
e L
evel
Federal Poverty Level
Medically Needy
Medicaid
133% 133% FPLFPL
150% 150% FPLFPL

Aged Blind
DisabledAFDC/TANF
Other Kids Everyone else
PregnantWomen
Medicaid Eligible PopulationIn
com
e L
evel
Federal Poverty Level
Medically Needy
Medicaid
200% 200% FPLFPL
SCHIPSCHIP
133% 133% FPLFPL
150% 150% FPLFPL
Aged Blind
DisabledAFDC/TANF
Other Kids Everyone else
PregnantWomen
Medicaid Eligible PopulationIn
com
e L
evel
Federal Poverty Level
Medically Needy
Medicaid
300% 300% FPLFPL
133% 133% FPLFPL
200% 200% FPLFPL 150% 150% FPLFPL
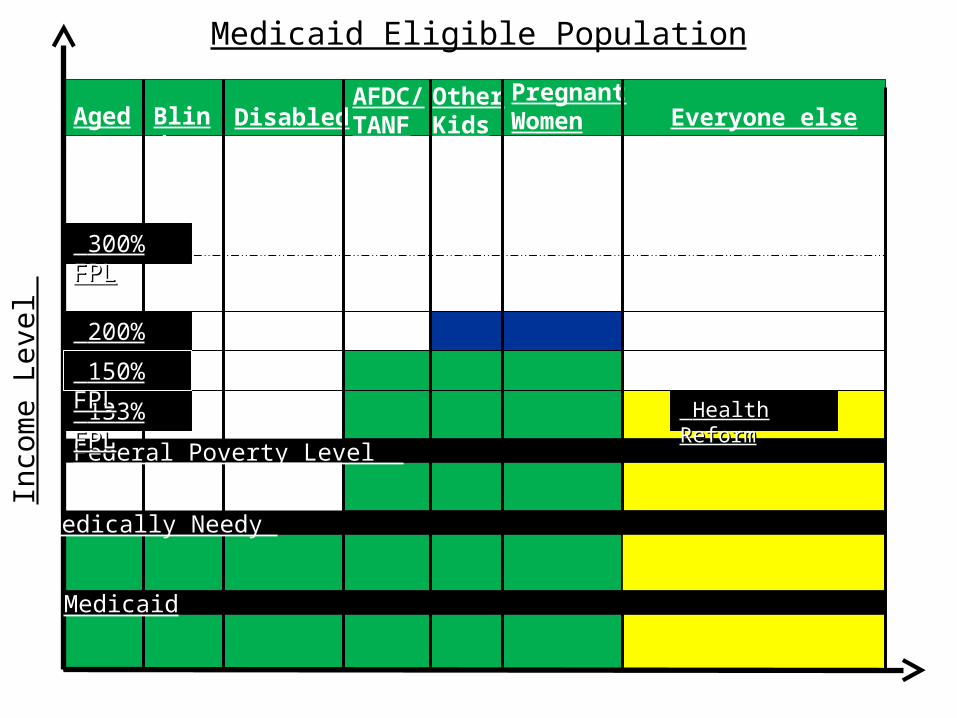
Aged Blind
DisabledAFDC/TANF
Other Kids Everyone else
PregnantWomen
Medicaid Eligible PopulationIn
com
e L
evel
Federal Poverty Level
Medically Needy
Medicaid
Health Health ReformReform
133% 133% FPLFPL
200% 200% FPLFPL
300% 300% FPLFPL
150% 150% FPLFPL
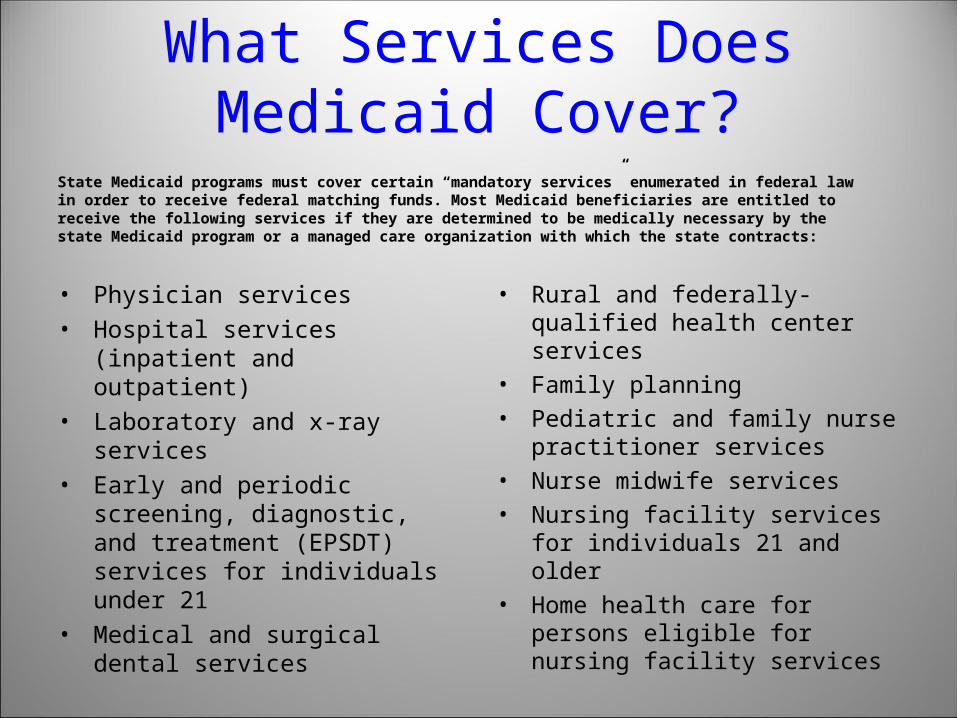
What Services Does Medicaid Cover?
State Medicaid programs must cover certain “mandatory services” enumerated in federal law in order to receive federal matching funds. Most Medicaid beneficiaries are entitled to receive the following services if they are determined to be medically necessary by the state Medicaid program or a managed care organization with which the state contracts:
• Physician services
• Hospital services (inpatient and outpatient)
• Laboratory and x-ray services
• Early and periodic screening, diagnostic, and treatment (EPSDT) services for individuals under 21
• Medical and surgical dental services
• Rural and federally-qualified health center services
• Family planning
• Pediatric and family nurse practitioner services
• Nurse midwife services
• Nursing facility services for individuals 21 and older
• Home health care for persons eligible for nursing facility services

What Services Does Medicaid Cover?
States can choose to cover certain additional services and are entitled to receive federal matching funds for these “optional” services. Commonly offered optional services include:
• Prescription drugs
• Clinic services
• Dental and vision services and supplies
• Prosthetic devices
• Physical therapy and rehab services
• TB-related services
• Primary care case management
• Nursing facility services for individuals under 21
• Intermediate care facilities for individuals with mental retardation (ICF/MR)services
• Home-and community-based care services
• Respiratory care services for ventilator-dependent individuals
• Personal care services
• Hospice

Medicaid Has Many Problems, Yet Plays a Major Role in Health
Reform Proposals• Major part of state budgets, leading to cutbacks across the country
•Dropping recipient groups and benefits
•Low reimbursement rates—Low physician participation
•Unequal across states
•Reform relies heavily on Medicaid to cover the low-income uninsured. Governors are worried.
The Uninsured


The Uninsured as Compared to the Insured:
• Have poorer health status overall.• Use fewer health care services overall.• Less likely to have a medical home/ receive preventive
care.• More likely to delay seeking care.• More likely to enter treatment at a more serious stage
of illness.• Less likely to control chronic diseases adequately.• Less likely to receive costly, high tech interventions for
illnesses.• More likely to die in hospital and outside of hospital.• Pay 2.5 times more for health care than the insured
Hadley, J. “Sicker and Poorer—The Consequences of Being Uninsured: A Review of the Research on the Relationship between Health Insurance, Medical Care Use, Health, Work, and Income.” Med Care Res Rev 2003; 60; 3

Major Features of The Patient Protection and Affordable Care Act
of 20101. Individual Mandate: Everyone must have
insurance, or face a penalty if they don’t purchase a plan (penalty is $95 in 2014increasing to $695 in 2016, or 2.5% of income by 2016).
a. Subsides to households below 250% of FPL

The Patient Protection and Affordable Care Act
2. Employer Contribution: Penalizes companies with over 50 workers who don’t provide insurance ($2,000 per worker), but exempts paying penalty for first 30 workers.
a. Tax credits for small employers (<25 workers, average wage < $50K)to pay for insurance

The Patient Protection and Affordable Care Act
3. Insurance Reform: Covers dependents up to 26 years old; guaranteed issue -- companies cannot exclude pre-existing conditions; no recission; no annual or lifetime caps, etc. Feds can regulate insurance company rate increases and unfair practices. Starts in 2014 (Changes for children already starting.)

The Patient Protection and Affordable Care Act
3a. Creates (Interim) High Risk Pools for those with pre-existing conditions and no HI for six months (run either by states or the federal government). Scheduled to start September 1, 2010. Many states are refusing to take this on due to costs.

The Patient Protection and Affordable Care Act
4. Insurance Exchanges: Individuals and employees of small employers can purchase insurance through State Level exchanges. These will all be private plans, there is no “Public Option.” Different levels of coverage: Bronze, Silver, Gold, Platinum and Catastrophic. Starts in 2014
5. Medicaid Expansion: Medicaid will cover everyone under 133% of FPL, including childless adults. Feds cover 100% of costs for newly eligible (2014-7), then 95% (2018-9), then 90% of costs after 2020. Starts in 2014.
a. Reauthorizes CHIP until 2019b. Raises Medicaid Rates to Medicare Rates for Primary Care
Providers

The Patient Protection and Affordable Care Act
6. Medicare Changes: No Part D doughnut hole by 2020. Reimbursed $250 this year if you reach the doughnut hole.
a. Increases Medicare Payroll Tax to 2.35% from 1.45% for the affluent (over $200K/year per individual ($250k couple). Additional 3.8% tax on unearned income over $200k/year per individual ($250k couple).

The Patient Protection and Affordable Care Act
7. Financing: Medicare increases. Also, starting in 2018, excise tax on high coverage plans (>$27,500 for family). At individual and small group level--Subsidies and tax credits. Individual and employer penalties for not purchasing insurance. Elimination of “excess payments” to Medicare Advantage Programs.

The Patient Protection and Affordable Care Act
8. Prevention and Public Health. Creates National Prevention, Health Promotion and Public Health Council to coordinate federal wellness programming. Disseminate evidence-based preventive services and community preventive services. $7 Billion allocation from 2010-2015 plus $2 Billion per year after 2015.

The Patient Protection and Affordable Care Act
9. Long-term Care. “Community Living Assistance Services and Supports” (CLASS). Voluntary payroll deductions for long-term care assistance. After 5-year vesting period, all participants would be eligible for average of $50/day for non-medical support services for people with functional disabilities. Increase Medicaid support for home and community-based services programs. Nursing homes required to disclose more information to the public.

The Patient Protection and Affordable Care Act of 2010
10. Workforce. Increased funding for Primary Care residencies and for primary care practitioners. Addresses nursing shortage by increasing capacity for education programs, supporting training programs, etc. Funding for training that employs medical home and disease management models.
11. Community Health Centers. $11 billion additional funding over 5 years. School-based health centers, nurse clinics, etc. encouraged.
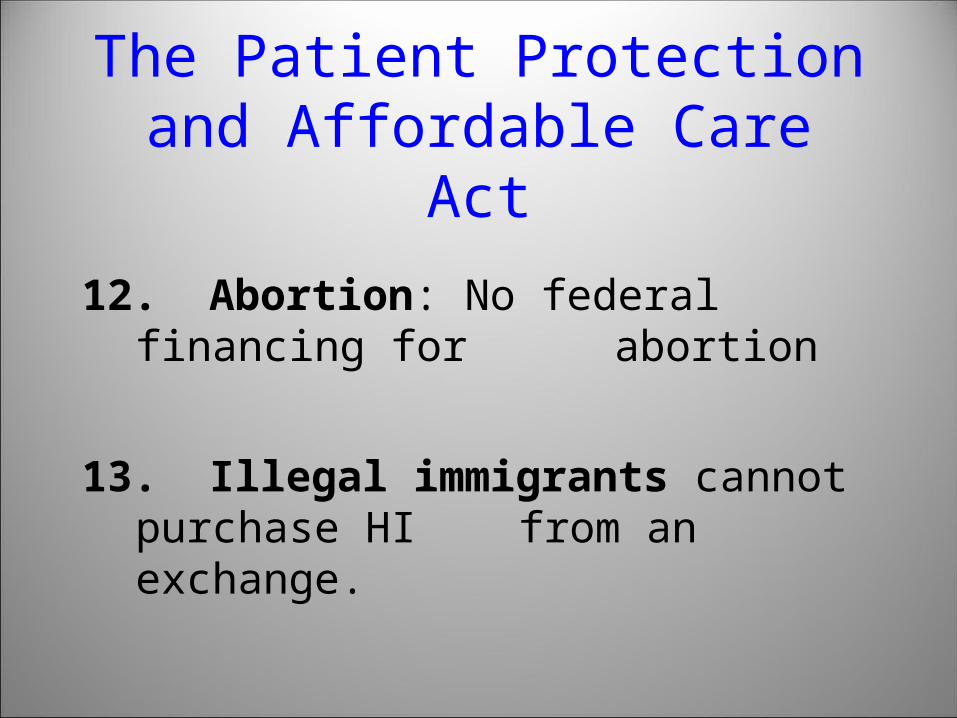
The Patient Protection and Affordable Care Act
12. Abortion: No federal financing for abortion
13. Illegal immigrants cannot purchase HI from an exchange.
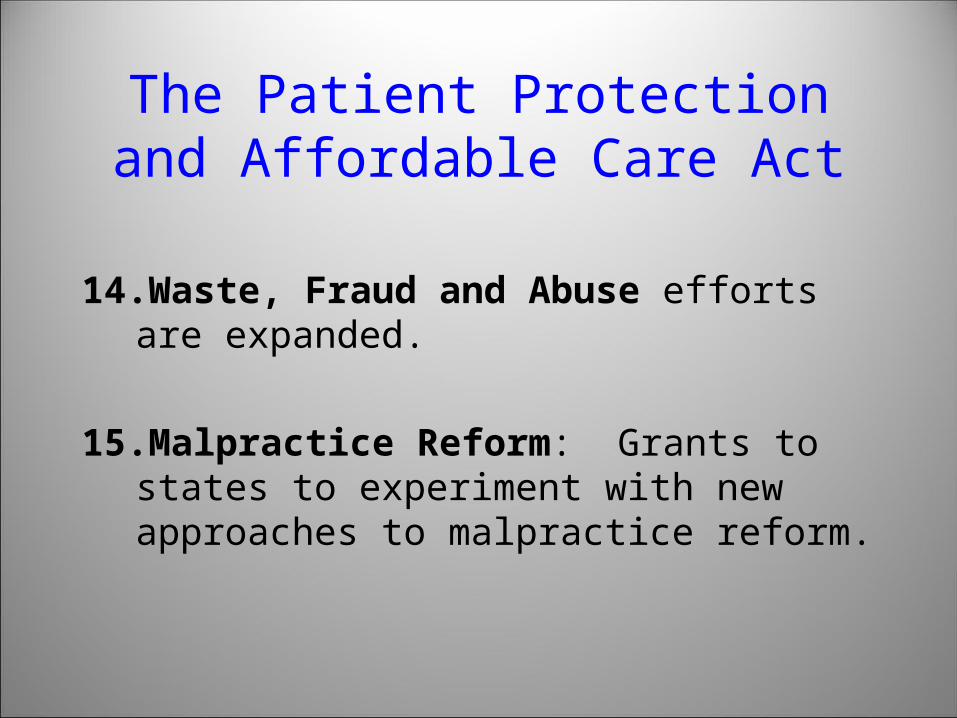
The Patient Protection and Affordable Care Act
14. Waste, Fraud and Abuse efforts are expanded.
15. Malpractice Reform: Grants to states to experiment with new approaches to malpractice reform.


![Lichtenstein v. Lichtenstein · [Cite as Lichtenstein v.Lichtenstein, 2020-Ohio-5080.] COURT OF APPEALS OF OHIO EIGHTH APPELLATE DISTRICT COUNTY OF CUYAHOGA RYAN LICHTENSTEIN, : Plaintiff-Appellee,](https://img.pdfslide.us/doc/110x75/60903f096995511fe42a0d9e/lichtenstein-v-cite-as-lichtenstein-vlichtenstein-2020-ohio-5080-court-of.jpg)