Embed Size (px)
Citation preview

2 Small Arms Survey Working Paper 14 Brauer The US Firearms Industry: Production and Supply 3
Copyright
Published in Switzerland by the Small Arms Survey
© Small Arms Survey, Graduate Institute of International and Development Studies, Geneva 2013
Published in February 2013
All rights reserved. No part of this publication may be reproduced, stored in a retrieval system, or transmitted, in any form or by any means, without the prior permission in writing of the Small Arms Survey, or as expressly permitted by law, or under terms agreed with the appropriate reprographics rights organization. Enquiries concerning reproduction outside the scope of the above should be sent to the Publications Manager, Small Arms Survey, at the address below.
Small Arms Survey Graduate Institute of International and Development Studies 47 Avenue Blanc, 1202 Geneva, Switzerland
Copy-edited by Alex Potter ([email protected])Proofread by Donald Strachan
Typeset in Optima and Palatino by Frank Benno Junghanns www.raumfisch.de/sign
Printed in France by GPS
ISBN 978-2-9700856-0-7ISSN 1661-4445

2 Small Arms Survey Working Paper 14 Brauer The US Firearms Industry: Production and Supply 3
The Small Arms Survey
The Small Arms Survey is an independent research project located at the Graduate Institute of International and Development Studies in Geneva, Switzerland. Established in 1999, the project is supported by the Swiss Federal Department of Foreign Affairs and current contributions from the Governments of Australia, Belgium, Canada, Denmark, Finland, Germany, the Netherlands, Norway, Sweden, the United Kingdom, and the United States. The Survey is grateful for past support received from the Governments of France, New Zealand, and Spain. The Survey also wishes to acknowledge the financial assistance it has received over the years from different United Nations agencies, programmes, and institutes.
The objectives of the Small Arms Survey are: to be the principal source of public information on all aspects of small arms and armed violence; to serve as a resource centre for governments, policy-makers, researchers, and activists; to monitor national and international initiatives (governmental and non-governmental) on small arms; to support efforts to address the effects of small arms proliferation and misuse; and to act as a clearinghouse for the sharing of information and the dissemination of best practices. The Survey also sponsors field research and information-gathering efforts, especially in affected states and regions. The project has an international staff with ex pertise in security studies, political science, law, economics, develop-ment studies, sociology, and criminology, and collaborates with a network of researchers, partner institutions, non-governmental organizations, and govern ments in more than 50 countries.
Small Arms Survey Graduate Institute of International and Development Studies 47 Avenue Blanc, 1202 Geneva, Switzerland
t + 41 22 908 5777 f + 41 22 732 2738 e [email protected] www.smallarmssurvey.org
4 Small Arms Survey Working Paper 14 Brauer The US Firearms Industry: Production and Supply 5
Table of contents
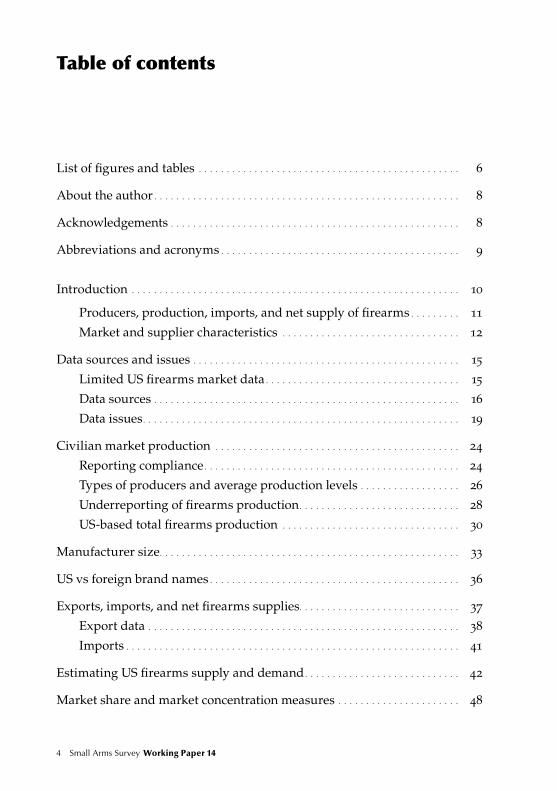
List of figures and tables . . . . . . . . . . . . . . . . . . . . . . . . . . . . . . . . . . . . . . . . . . . . . . . 6
About the author . . . . . . . . . . . . . . . . . . . . . . . . . . . . . . . . . . . . . . . . . . . . . . . . . . . . . . . 8
Acknowledgements . . . . . . . . . . . . . . . . . . . . . . . . . . . . . . . . . . . . . . . . . . . . . . . . . . . . 8
Abbreviations and acronyms . . . . . . . . . . . . . . . . . . . . . . . . . . . . . . . . . . . . . . . . . . . 9
Introduction . . . . . . . . . . . . . . . . . . . . . . . . . . . . . . . . . . . . . . . . . . . . . . . . . . . . . . . . . . . 10
Producers, production, imports, and net supply of firearms . . . . . . . . . 11
Market and supplier characteristics . . . . . . . . . . . . . . . . . . . . . . . . . . . . . . . . 12
Data sources and issues . . . . . . . . . . . . . . . . . . . . . . . . . . . . . . . . . . . . . . . . . . . . . . . . 15
Limited US firearms market data . . . . . . . . . . . . . . . . . . . . . . . . . . . . . . . . . . . 15
Data sources . . . . . . . . . . . . . . . . . . . . . . . . . . . . . . . . . . . . . . . . . . . . . . . . . . . . . . . 16
Data issues. . . . . . . . . . . . . . . . . . . . . . . . . . . . . . . . . . . . . . . . . . . . . . . . . . . . . . . . . 19
Civilian market production . . . . . . . . . . . . . . . . . . . . . . . . . . . . . . . . . . . . . . . . . . . . 24
Reporting compliance . . . . . . . . . . . . . . . . . . . . . . . . . . . . . . . . . . . . . . . . . . . . . . 24
Types of producers and average production levels . . . . . . . . . . . . . . . . . . 26
Underreporting of firearms production. . . . . . . . . . . . . . . . . . . . . . . . . . . . . 28
US-based total firearms production . . . . . . . . . . . . . . . . . . . . . . . . . . . . . . . . 30
Manufacturer size. . . . . . . . . . . . . . . . . . . . . . . . . . . . . . . . . . . . . . . . . . . . . . . . . . . . . . 33
US vs foreign brand names . . . . . . . . . . . . . . . . . . . . . . . . . . . . . . . . . . . . . . . . . . . . . 36
Exports, imports, and net firearms supplies. . . . . . . . . . . . . . . . . . . . . . . . . . . . . 37
Export data . . . . . . . . . . . . . . . . . . . . . . . . . . . . . . . . . . . . . . . . . . . . . . . . . . . . . . . . 38
Imports . . . . . . . . . . . . . . . . . . . . . . . . . . . . . . . . . . . . . . . . . . . . . . . . . . . . . . . . . . . . 41
Estimating US firearms supply and demand. . . . . . . . . . . . . . . . . . . . . . . . . . . . 42
Market share and market concentration measures . . . . . . . . . . . . . . . . . . . . . . 48
4 Small Arms Survey Working Paper 14 Brauer The US Firearms Industry: Production and Supply 5
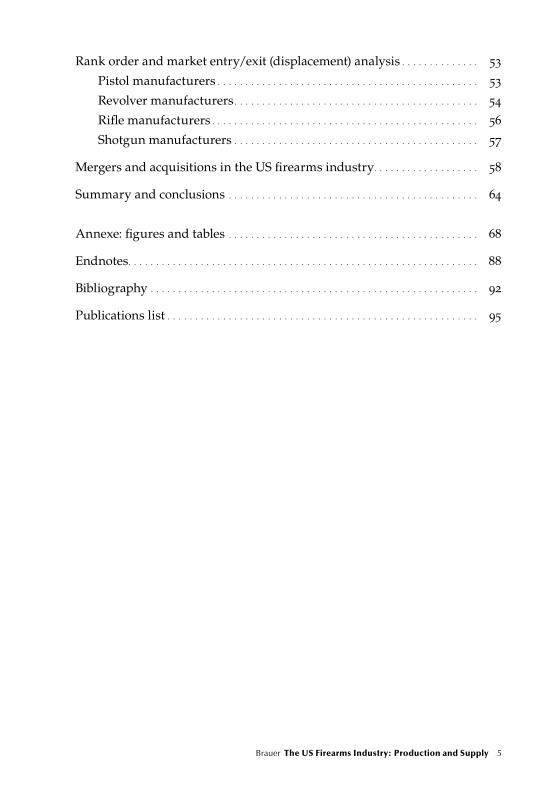
Rank order and market entry/exit (displacement) analysis . . . . . . . . . . . . . . 53
Pistol manufacturers . . . . . . . . . . . . . . . . . . . . . . . . . . . . . . . . . . . . . . . . . . . . . . . 53
Revolver manufacturers . . . . . . . . . . . . . . . . . . . . . . . . . . . . . . . . . . . . . . . . . . . . 54
Rifle manufacturers . . . . . . . . . . . . . . . . . . . . . . . . . . . . . . . . . . . . . . . . . . . . . . . . 56
Shotgun manufacturers . . . . . . . . . . . . . . . . . . . . . . . . . . . . . . . . . . . . . . . . . . . . 57
Mergers and acquisitions in the US firearms industry. . . . . . . . . . . . . . . . . . . 58
Summary and conclusions . . . . . . . . . . . . . . . . . . . . . . . . . . . . . . . . . . . . . . . . . . . . . 64
Annexe: figures and tables . . . . . . . . . . . . . . . . . . . . . . . . . . . . . . . . . . . . . . . . . . . . . 68
Endnotes. . . . . . . . . . . . . . . . . . . . . . . . . . . . . . . . . . . . . . . . . . . . . . . . . . . . . . . . . . . . . . . 88
Bibliography . . . . . . . . . . . . . . . . . . . . . . . . . . . . . . . . . . . . . . . . . . . . . . . . . . . . . . . . . . . 92
Publications list . . . . . . . . . . . . . . . . . . . . . . . . . . . . . . . . . . . . . . . . . . . . . . . . . . . . . . . . 95
6 Small Arms Survey Working Paper 14 Brauer The US Firearms Industry: Production and Supply 7
List of figures and tables
Figures
1 Number of US pistol producers, 1986–2010 . . . . . . . . . . . . . . . . . . . . . . . 27
2 Total US firearms production, 1946–2010 . . . . . . . . . . . . . . . . . . . . . . . . . 30
3 USCB and ATF firearms export numbers, 1986–2010 . . . . . . . . . . . . . 39
4 Estimated US net imports of non-military firearms, 1980–2010 . . . 41
5 Commercial US firearms supplies per 100,000 people, 1989–2010 . 47
6 Market concentration of the top four firms, 1986–2010 (total production) . . . . . . . . . . . . . . . . . . . . . . . . . . . . . . . . . . . . . . . . . . . . . . . . . . . . . 50
7 Market concentration of the top eight firms, 1986–2010 (total production) . . . . . . . . . . . . . . . . . . . . . . . . . . . . . . . . . . . . . . . . . . . . . . . . . . . . . 50
8 Market concentration, 1986–2010 (HHI) . . . . . . . . . . . . . . . . . . . . . . . . . . 51
A1 Number of pistol producers, 1986–2010 . . . . . . . . . . . . . . . . . . . . . . . . . . 68
A2 Number of revolver producers, 1986–2010 . . . . . . . . . . . . . . . . . . . . . . . . 68
A3 Number of rifle producers, 1986–2010 . . . . . . . . . . . . . . . . . . . . . . . . . . . . 69
A4 Number of shotgun producers, 1986–2010. . . . . . . . . . . . . . . . . . . . . . . . 69
A5 Average unit production by pistol makers, 1986–2010 . . . . . . . . . . . . 70
A6 Average unit production by top 10 and top 20 pistol makers, 1986–2010 . . . . . . . . . . . . . . . . . . . . . . . . . . . . . . . . . . . . . . . . . . . . . . . . . . . . . . . 70
A7 Average unit production by revolver makers, 1986–2010 . . . . . . . . . . 71
A8 Average unit production by top 10 and top 20 revolver makers, 1986–2010 . . . . . . . . . . . . . . . . . . . . . . . . . . . . . . . . . . . . . . . . . . . . . . . . . . . . . . . 71
A9 Average unit production by rifle makers, 1986–2010 . . . . . . . . . . . . . . 72
A10 Average unit production by top 10 and top 20 rifle makers, 1986–2010 . . . . . . . . . . . . . . . . . . . . . . . . . . . . . . . . . . . . . . . . . . . . . . . . . . . . . . . 72
6 Small Arms Survey Working Paper 14 Brauer The US Firearms Industry: Production and Supply 7
A11 Average unit production by shotgun makers, 1986–2010 . . . . . . . . . . 73
A12 Average unit production by top 10 and top 20 shotgun makers, 1986–2010 . . . . . . . . . . . . . . . . . . . . . . . . . . . . . . . . . . . . . . . . . . . . . . . . . . . . . . . 73
A13 Total US handgun and long-gun unit production per 100,000 people, 1946–2010. . . . . . . . . . . . . . . . . . . . . . . . . . . . . . . . . . . . . . . . . . . . . . . . 74
A14 US gun unit production by weapon type, 1946–2010. . . . . . . . . . . . . . 74
A15 US gun unit production per 100,000 people by weapon type, 1946–2010 . . . . . . . . . . . . . . . . . . . . . . . . . . . . . . . . . . . . . . . . . . . . . . . . . . . . . . . 75
Tables
1 Total number of US firearms manufacturers, 1986–2010, by product category . . . . . . . . . . . . . . . . . . . . . . . . . . . . . . . . . . . . . . . . . . . . . 26
2 Size distribution of annual firearms unit production, 1986–2010 . . 33
3 Total production of large-scale firearms brands, 1986–2010 . . . . . . . 34
4 Estimating US non-military firearms supply and demand, 2010 . . 37
5 Total number of NICS checks, 1998–2010 . . . . . . . . . . . . . . . . . . . . . . . . . 43
6 Estimating US civilian market firearms purchases by source of supply, 1999–2010. . . . . . . . . . . . . . . . . . . . . . . . . . . . . . . . . . . . . . . . . . . . . . . . 45
7 Top rifle makers’ unit production and market share, 2010 . . . . . . . . 63
A1 Market entry and exit among the top 20 pistol maker rankings, 1986–2010 . . . . . . . . . . . . . . . . . . . . . . . . . . . . . . . . . . . . . . . . . . . . . . . . . . . . . . . 76
A2 Market entry and exit among the top 20 revolver maker rankings, 1986–2010 . . . . . . . . . . . . . . . . . . . . . . . . . . . . . . . . . . . . . . . . . . . . . . . . . . . . . . . 78
A3 Market entry and exit among the top 20 rifle maker rankings, 1986–2010 . . . . . . . . . . . . . . . . . . . . . . . . . . . . . . . . . . . . . . . . . . . . . . . . . . . . . . . 82
A4 Market entry and exit among the top 20 shotgun maker rankings, 1986–2010 . . . . . . . . . . . . . . . . . . . . . . . . . . . . . . . . . . . . . . . . . . . . . . . . . . . . . . . 85

8 Small Arms Survey Working Paper 14 Brauer The US Firearms Industry: Production and Supply 9
About the author
Jurgen Brauer, Ph.D., is a professor of economics at the Hull College of Busi-
ness, Georgia Regents University, and co-editor of the Economics of Peace and
Security Journal. His recent books include Castles, Battles, and Bombs: How
Economics Explains Military History (with H. van Tuyll; University of Chicago
Press, 2008), War and Nature: The Environmental Consequences of War in a Glo-
balized World (Altamira Press, 2009), and Peace Economics: A Macroeconomic
Primer for Violence-afflicted States (with J. Paul Dunne; US Institute of Peace
Press, 2012). A native Berliner, Brauer has held visiting professorships in Aus-
tralia, Colombia, South Africa, Spain, and Thailand. He may be reached at
[email protected] or via http://StoneGardenEconomics.com.
Acknowledgements
Excellent research assistance by Manja Jonas is gratefully acknowledged,
as is financial support from the Hull College of Business, the Small Arms
Survey, and Meltwater News. For highly professional and helpful comments
on a draft version of this paper, I warmly thank my colleagues Peter Hall,
Stefan Markowski, Nicolas Marsh, and Matt Schroeder. Relatedly, I thank
James Bevan for crucial guidance and editorial advice to shepherd the paper
through to publication.
8 Small Arms Survey Working Paper 14 Brauer The US Firearms Industry: Production and Supply 9
Abbreviations and acronyms
AFMER Annual Firearms Manufacturing and Export Report
ATF Bureau of Alcohol, Tobacco, Firearms, and Explosives
Customs US Customs and Border Protection
FAET Firearms and ammunition excise tax
FBI Federal Bureau of Investigation
FFL Federal firearms licence
GIS Geographic information system
HHI Herfindahl-Hirschman Index
IRS Internal Revenue Service
MSGF Multiple gun sales factor
NAICS North American Industrial Classification System
NICS National Instant Criminal Background Check System
RDS Region, District, Sequence
Ruger Sturm, Ruger & Co. Inc.
SEC US Securities and Exchange Commission
USCB US Census Bureau
USITC US International Trade Commission
10 Small Arms Survey Working Paper 14 Brauer The US Firearms Industry: Production and Supply 11
Introduction
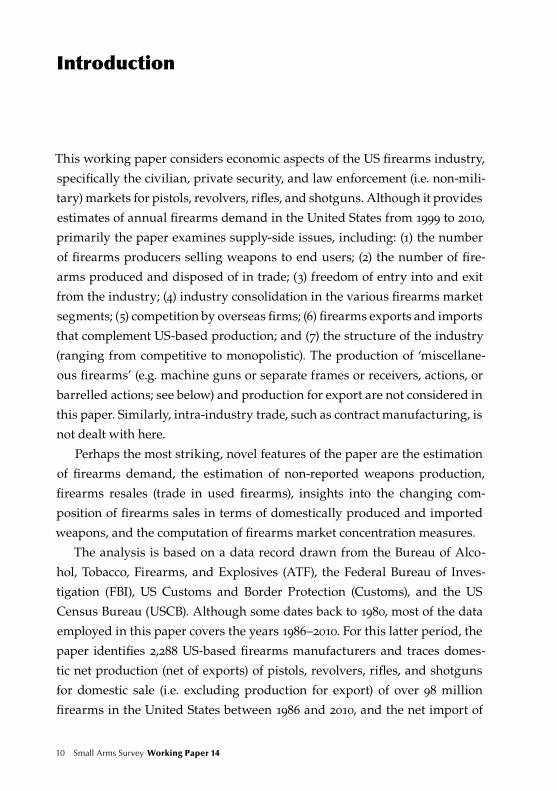
This working paper considers economic aspects of the US firearms industry,
specifically the civilian, private security, and law enforcement (i.e. non-mili-
tary) markets for pistols, revolvers, rifles, and shotguns. Although it provides
estimates of annual firearms demand in the United States from 1999 to 2010,
primarily the paper examines supply-side issues, including: (1) the number
of firearms producers selling weapons to end users; (2) the number of fire-
arms produced and disposed of in trade; (3) freedom of entry into and exit
from the industry; (4) industry consolidation in the various firearms market
segments; (5) competition by overseas firms; (6) firearms exports and imports
that complement US-based production; and (7) the structure of the industry
(ranging from competitive to monopolistic). The production of ‘miscellane-
ous firearms’ (e.g. machine guns or separate frames or receivers, actions, or
barrelled actions; see below) and production for export are not considered in
this paper. Similarly, intra-industry trade, such as contract manufacturing, is
not dealt with here.
Perhaps the most striking, novel features of the paper are the estimation
of firearms demand, the estimation of non-reported weapons production,
firearms resales (trade in used firearms), insights into the changing com-
position of firearms sales in terms of domestically produced and imported
weapons, and the computation of firearms market concentration measures.
The analysis is based on a data record drawn from the Bureau of Alco-
hol, Tobacco, Firearms, and Explosives (ATF), the Federal Bureau of Inves-
tigation (FBI), US Customs and Border Protection (Customs), and the US
Census Bureau (USCB). Although some dates back to 1980, most of the data
employed in this paper covers the years 1986–2010. For this latter period, the
paper identifies 2,288 US-based firearms manufacturers and traces domes-
tic net production (net of exports) of pistols, revolvers, rifles, and shotguns
for domestic sale (i.e. excluding production for export) of over 98 million
firearms in the United States between 1986 and 2010, and the net import of
10 Small Arms Survey Working Paper 14 Brauer The US Firearms Industry: Production and Supply 11
probably at least 48 million firearms more for the same years. The result has
been a domestic supply of about six million newly produced or imported
firearms per year during the 25-year period covered in the paper.
Despite the limited scope of the study, centred as it is around numbers of
firearms producers and quantities of firearms produced, the paper generates
a great deal of new information based on data that is excruciatingly difficult
to access, assemble, assess, and process. Recognizing that different readers
will have different interests in the issues, the main findings may be grouped
into two categories: (1) producers, production, imports, and net supply of
firearms to the US market; and (2) market and supplier characteristics.
Producers, production, imports, and net supply of firearms
• Judged by ATF reports, the frequency and size of data revisions, and inter-
views with ATF personnel, it appears that firearms production reporting
compliance with US law among manufacturers of firearms has been
improving. An estimate for the ten-year period 2001–10 suggests under-
reporting of about 320,000 weapons. While large in absolute numbers, this
amounts to less than 1 per cent of overall reported production.
• For the civilian, private security, and law enforcement markets, from 1986
to 2010 some 2,288 US-based producers of civilian firearms have been iden-
tified, possibly the most extensive public record yet in existence.1
• The production of firearms for domestic, non-military use is highly cycli-
cal, particularly for the pistol segment of the market, having oscillated
between three million and 5.5 million firearms per year since 1980.
• During the period 1986–2010 overall production of 106,079,100 weapons is
reported (i.e. including miscellaneous and exported firearms), or about
4.24 million firearms for each of the 25 years in the database.
• Handgun production (pistols and revolvers) declined by about 10 per cent
between 1993 and 2010 when measured in per capita terms. In contrast, in
2008, 2009, and 2010 per capita rifle production reached its highest levels
since 1986.
• Firearms imports into the United States have risen almost linearly, from
around 500,000 units in the early 1980s to about 3.5 million units by 2010.2
12 Small Arms Survey Working Paper 14 Brauer The US Firearms Industry: Production and Supply 13
US firearms producers have come under considerable import competition
pressure not unlike that experienced by other branches of US manu-
facturing.
• The annual firearms supply (production for domestic use plus imports)
per 100,000 people has stayed fairly constant (2,258 in 1989, as compared to
2,272 in 2008), and has increased remarkably since then (2,674 in 2010).
However, the composition of the firearms supply sources has changed
markedly. In 1989 about 80 per cent of firearms came from domestic
sources; this figure fell steadily to between 55 and 65 per cent in the late
2000s.
• An estimate of US domestic firearms resales via licensed firearms dealers
(i.e. trade in ‘used’ weapons) suggests the resale of about 1.5 million units
in 2010 alone. For the average of the years 1999–2010, domestically pro-
duced new and imported weapons satisfied an estimated 75 per cent of US
market demand, while resales of ‘used’ weapons satisfied the remaining
25 per cent.3
Market and supplier characteristics
• From 1980 to 2010 the industry went through severe business cycles, with
reported production levels both declining and rising by 50 per cent within
very short time periods, possibly posing severe challenges to the manage-
ment of firearms firms.
• For the 1986–2010 period around half of all US firearms manufacturers
reported production levels of between one and nine weapons per year.4
Only a small percentage of firms—between 1.3 and 7.5 per cent—produced
more than 100,000 weapons per year.
• Three brands (Sturm, Ruger & Co. Inc. (hereafter Ruger), Remington, and
Smith & Wesson) each produced ten million or more weapons over the
entire 1986–2010 period, or about 41 per cent of all domestically produced
firearms for domestic use documented in this paper (40 million out of 98.2
million).
• Almost all manufacturers specialize in the production of only one weapon
type. On the whole, the industry is highly segmented into one of four
12 Small Arms Survey Working Paper 14 Brauer The US Firearms Industry: Production and Supply 13
product categories (pistols, revolvers, rifles, and shotguns), but since 2007
a number of firms have branched into other product segments.
• Non-US brands have encroached on the US market and have firmly estab-
lished themselves, particularly pistol manufacturers. In 2010, for example,
three of the top five firms were non-US brands (Sig Sauer, Beretta, and
Taurus).
• Recent mergers and acquisitions activity has been substantial, particularly
in the rifle market, but apparently has not (yet) breached any threshold
required for the US Department of Justice to initiate anti-trust investiga-
tions.
• In the pistol market considerable market entry and exit—and inter-rank
mobility among each year’s top 20 firms—can be observed for the 1986–
2010 period. The very top ranks of pistol manufacturers, however, have
remained fairly stable over time.
• The revolver market is a stable oligopoly dominated by Ruger and Smith &
Wesson, which have been the top two producers since 1986. Similarly, the
top four producers have remained virtually unchanged since 1996.
• The rifle market features one parent firm that in 2010 held more than one-
third of the market.
• The shotgun market is a solid duopoly, with the two leading sellers, O. F.
Mossberg/Maverick and Remington Arms, sharing 91 per cent of the mar-
ket in 2010.
The paper pays particular attention to a thorough understanding of the detail
and limitations of the data on which its findings are based. The economic
study of the modern US civilian firearms industry is far from complete—
indeed, it has barely begun—and may require considerable resources if it
is to be developed further. In particular, information on firms’ production
costs and firearms market prices will be needed to begin a fuller economic
analysis of the market.
The paper proceeds as follows. Because of their intricate nature and over-
whelming importance to the study, data sources and issues are initially dis-
cussed at length. This is followed by sections discussing firearms production
levels and the size of firearms-manufacturing firms; a brief section on import

14 Small Arms Survey Working Paper 14 Brauer The US Firearms Industry: Production and Supply 15
competition; extensive sections on firearms imports and total firearms sup-
ply and demand; an analysis of manufacturers’ market shares and market
concentration measures; an analysis of market entry and exit, as well as a
rank order and inter-rank mobility analysis; and a discussion of recent merg-
ers and acquisitions in the industry. A summary and discussion of the con-
clusions reached complete the working paper.
14 Small Arms Survey Working Paper 14 Brauer The US Firearms Industry: Production and Supply 15
Data sources and issues
In order to appreciate the detail—and potential limitations—of the findings,
this section discusses data sources and issues in some depth.
Limited US firearms market data
No comprehensive economic studies of the US firearms industry have been
attempted in recent decades.5 Primarily, this would seem to be due to the
paucity of credible data and the difficulty of accessing it. This is true for data
pertaining to both the market as a whole and individual companies.6
As for any other market analysis, a comprehensive economic study of the
firearms industry would require information about quantities sold, prices
charged, revenues obtained, costs incurred, innovations made, regulations
imposed, profits gained, and other relevant data. It would also necessitate
access to information on the structure of the industry, e.g. the degree to which
it is competitive or not; how industry structure may have changed over the
years and why; the degree of industry segmentation into distinct product or
customer niches; and whether segmentation is contested (i.e. whether com-
panies encroach on one another’s turf in an attempt to gain cross-segment
market share). Such a study, furthermore, would require information on the
role of innovation in firearms platforms, ammunition, and accessories, and
the underlying drivers of successful innovation. Much of this has been done
for many industries—from health care to beer—but not for the firearms
industry, at least not in the public domain. Data limitations make such a full
study unfeasible as yet, particularly in terms of production costs and market
prices.
Every five years the USCB collects economic census statistics for each
industry in the United States. In late 2010 the bureau published the latest
numbers for ‘Small Arms Manufacturing’ under the North American Indus-
trial Classification System (NAICS) code 332994, with data pertaining to 2007
16 Small Arms Survey Working Paper 14 Brauer The US Firearms Industry: Production and Supply 17
(USCB, 2010a; 2010b).7 The census records 212 employers operating in this
sector, with 224 ‘employer establishments’ and 11,399 employees, a payroll of
nearly USD 507 million, and sales revenues of over USD 2,742 million. It lists
value-added as over USD 1,814 million,8 costs of materials as approximately
USD 988 million, and capital investment as nearly USD 111 million (USCB,
2010b).9 While this census data appears to be specific and detailed, it also
seems to be incomplete. We know this because the 2007 records from the
ATF indicate some 412 US rifle manufacturers alone (see Figure A3), not to
mention distinct pistol, revolver, and shotgun manufacturers.
This discrepancy is a clear indication that a study of the US firearms
industry needs to expand the scope of its enquiry beyond the limited exist-
ing ‘industry’ data sources. This paper advances knowledge of certain eco-
nomic aspects of the industry and in particular deals with the number of
producers, firearms industry structure, and quantities of non-military fire-
arms produced in the United States in the period 1980–2010.10 No attempt has
been made to convert quantities into market dollar values.
The paper does little to address production costs, location decisions, mar-
ket prices, total revenue, firearms innovation, or even the effect of govern-
ment regulation on firms’ supply and customers’ demand behaviour. At
present, much of this information is not available at the industry level.
Data sources
The analysis presented in this paper relies heavily on raw data obtained from
the ATF, formerly an agency of the US Department of the Treasury. In 2003
the law enforcement functions of the ATF were transferred to the US Depart-
ment of Justice, while the tax and trade functions remained with the Treas-
ury (ATF, n.d.a). The ATF collects data supplied by US firearms manufactur-
ers, which are required to obtain a federal firearms licence (FFL) and report
annually on calendar-year-based commercial sales (18 USC, para. 923(g)(5)
(A); see ATF, 2005, p. 17), i.e. excluding intra-industry trade, such as contract
manufacturing, and military sales. The ATF then collates the information in
its Annual Firearms Manufacturing and Export Report (AFMER); starting with
data year 1998, it has placed AFMER online in PDF format.
16 Small Arms Survey Working Paper 14 Brauer The US Firearms Industry: Production and Supply 17
There are nine types of FFLs. With categories 04 and 05 unassigned, they are:
01 Dealer in Firearms Other Than Destructive Devices (Includes Gunsmiths);
02 Pawnbroker in Firearms Other Than Destructive Devices; 03 Collector of
Curios and Relics; 06 Manufacturer of Ammunition for Firearms; 07 Manu-
facturer of Firearms Other Than Destructive Devices; 08 Importer of Fire-
arms Other Than Destructive Devices; 09 Dealer in Destructive Devices; 10
Manufacturer of Destructive Devices; and 11 Importer of Destructive Devices
(ATF, n.d.b).11
Reporting is mandated by law for FFL holders in categories 07 and 10:
Those Federal Firearms Licensees who hold either a Type 07 (manufacture of
firearms), or a Type 10 (manufacture of destructive devices) [license] must file
in compliance with 27 CFR § 478.126, on an annual basis (ATF, n.d.c, p. 2).
Due to the Trade Secrets Act, the publication of AFMER is delayed by more
than a year. For example, data for calendar year 2010 was due to be reported
to the ATF by 1 April 2011 and was released to the public in early February
2012. At the time of writing, 2010 data was the latest available. Data for addi-
tional years, back to 1986, was obtained via a Freedom of Information Act
request lodged with the ATF in November 2008.
AFMER states that
[f]or purposes of this report only, ‘production’ is defined as: Firearms, including
separate frames or receivers, actions or barreled actions, manufactured and
disposed of in commerce during the calendar year (e.g. ATF, 2009).
The word ‘production’ is unfortunate and the use of the conjunction ‘and’
potentially confusing. In fact, the definition refers specifically to sales into
commerce, i.e. to wholesalers, retailers, or directly to end users, whether
from current-year production or from prior-year inventories.12 The phrase
‘separate frames or receivers, actions or barreled actions’ refers to items cap-
tured in the ‘miscellaneous firearms’ category. This paper focuses on com-
plete firearms only (pistols, revolvers, rifles, and shotguns). Machine guns
18 Small Arms Survey Working Paper 14 Brauer The US Firearms Industry: Production and Supply 19
manufactured for the non-military market are complete firearms, of course,
but the ‘miscellaneous firearms’ category does not identify them separately
and so they are not dealt with here.
For each manufacturing site, the ATF assigns and AFMER uses a ‘Region,
District, Sequence’ (RDS) key. This is not a permanent manufacturer or man-
ufacturing site ID number. An FFL is issued to a specific legal entity with
respect to a specific manufacturing location (the ‘premises’ or ‘establish-
ment’). If a manufacturer changes location, a new FFL would be required,
resulting in a new RDS key. Similarly, if a licensee changes its business name,
one licence would be retired and a new one issued, resulting in a new RDS
key, even if the location of the manufacturing site remains the same. AFMER
also contains the name, street address, city, and state of the FFL holder and
the self-reported level of unit production.
The ATF conducts on-site inspections of each manufacturer and this
includes a check of the manufacturer’s records. At present, the bureau
attempts to visit manufacturers about once every five years. If errors in the
records are found, a correction should eventually enter a revised AFMER.
Thus, the last five years of AFMER reports may not be wholly accurate and in
the past have been subject to considerable change.
For the research reported here the information on the licensees’ names
and units produced has been recorded in a database consisting of over 13,000
entries. Eventual entry of the RDS key (such as it is), street address, city, and
state will be important for Geographic Information Systems (GIS) mapping
and spatial analysis of location patterns.
Each AFMER contains sections regarding quantities of firearms pro-
duced, i.e. production of pistols (by calibre: .22, .25, .32, .380, 9 mm, .50, and
total); revolvers (by calibre: .22, .32, .357, .38, .44, .50, total); rifles (totals only);
shotguns (totals only); and miscellaneous firearms (totals only). Exports for
each of these categories are reported in additional AFMER sections. In this
paper miscellaneous firearms are not analysed and exports are analysed
only in conjunction with attempts to understand firearms trade and import
data.
Because the data reported is from manufacturers, unit sales for the larger
firms will mostly refer to sales to wholesalers, retailers, private security
18 Small Arms Survey Working Paper 14 Brauer The US Firearms Industry: Production and Supply 19
firms, and law enforcement agencies at the local, state, and federal levels,
but excluding the US armed forces. For smaller manufacturers (often craft
producers), most sales are probably direct non-military end-user sales in the
United States and abroad.
Detailed unit production data pertaining to pistol, revolver, rifle, and
shotgun manufacturing for 2,288 US-based firearms manufacturers was
obtained from the ATF for the 25-year period 1986–2010 (Table 1). This would
appear to be the most extensive record yet available in the public domain.
Further data dating back to 1980 was available in summary form—i.e. not
by manufacturer—from another source, Shooting Industry magazine (Thur-
man, 2001, p. 34). Prior to that, some data reaching back to 1946, also in sum-
mary form only, was available from the website of the Violence Policy Center
(1946–79). Because of questions about the reliability of this data, it is not used
for any detailed analysis in this paper. ATF records were not made avail-
able in electronic format, only as paper copies. Therefore data for about 106
million firearms in all were hand-entered for processing. Cross-validation
computations show that data entry errors are minute in magnitude and can
safely be ignored (details are discussed later in this paper).
Additional data was obtained from Customs, the FBI, and other sources.
This data is discussed later in the paper.
Data issues
The veracity of ATF unit production data cannot be established independ-
ently. Innocuous data reporting or data entry errors cannot ordinarily be
detected. In one instance, however, it is clear that exports for 2006 are incor-
rectly reported: the domestic pistol production numbers for Beretta USA
Corp. and Cobra Enterprises of Utah Inc. (74,791 and 42,551 units, respec-
tively) are exactly the same as the companies’ reported pistol export num-
bers. A query lodged with the ATF confirmed that the data entry is correct
and that it was the companies who incorrectly reported the numbers. As
the ATF cannot arbitrarily correct company-supplied data, the numbers will
remain incorrect until a site inspection leads to the issuing of revised data or
until the companies themselves note and correct the error.
20 Small Arms Survey Working Paper 14 Brauer The US Firearms Industry: Production and Supply 21
In spite of a legal mandate to report, even large, very prominent manu-
facturers do not always report to the ATF. For example, Marlin Firearms Co.,
ordinarily ranked among the top three rifle manufacturers, did not report
rifle production in the original 2005 AFMER. For the bracketing years of 2004
and 2006 the company reported rifle production of 228,092 and 266,761 units,
respectively. Total rifle production across all reporting companies for 2005
of 1,142,472 units would therefore appear to have been underreported by
Marlin’s ‘usual’ share of 200,000 or more weapons. This reporting oversight
was later corrected and a revised 2005 AFMER issued. Later sections of this
paper estimate the total underreporting of firearms production for the years
2001–10.
Similarly, many companies report weapons production in one year, then
disappear from the ATF data record as if they had ceased operations, only
to reappear in later years. The presumption must be either that these firms
were in continuous operation and failed consistently to report to the ATF or
operated as contract manufacturers in the intervening years. For example,
Briley Manufacturing Inc. of Houston, Texas reports pistol production in
1991 and then again for 2005–09. Data for the intervening years is missing.
Moreover, Briley describes itself on its website as a pistol, rifle, and shotgun
manufacturer (Briley Manufacturing Inc., n.d.), but in the AFMER reports it
shows up only in the pistol and rifle categories (as well as in the pistol, rifles,
and miscellaneous firearms export categories). One would be compelled to
conclude that Briley produces shotguns only for military customers or as a
contractor for other manufacturers. Companies that report only exports in
one or more categories without corresponding entries on the ‘domestic’ side
of the ledger are not included in the analysis conducted for this paper, as the
focus is on firearms retained for the US market.
As mentioned, the ATF data is available only in PDF format and for the
most part cannot be copied electronically into a spreadsheet or other data-
gathering software. This situation required hand-entering the data.13 While
this took a great deal of time, it also became clear that many firms report in
different years under slightly varying licensee names, such as Company X
Inc., Company X Corp., Company X Corp. Inc., Company X LLC, or, simply,
Company X. In these cases the study consolidated data records for firms
20 Small Arms Survey Working Paper 14 Brauer The US Firearms Industry: Production and Supply 21
that evidently were the same operation, even if the company name changed
slightly from year to year. The availability of physical addresses for the com-
panies facilitated this task. When in doubt, the original data record was left
unchanged.
Combining data records, however, can also complicate the picture. For
example, from 1986 to 1991 Thompson Center Arms Co. Inc., a prominent
rifle maker, was listed as a division of KW Thompson Tools Co. Inc. Since
then the firm has been listed under the Thompson Center name, even after
it was acquired in 2007 by Smith & Wesson Holding Corp. (In the trade, the
brand is often referred to by its technically more correct designation, Thomp-
son/Center.) One can argue that three records should be kept for what legally
were three distinct companies. But, because the Thompson Center firearms
brand is continuous, it can also be argued that a single record should be kept.
For this study, it was decided to retain the brand identity whenever possi-
ble. Thus, Smith & Wesson, Remington, and other very prominent firearms
brands that have changed ownership repeatedly (and sometimes changed
their legal names, either slightly or substantially) are recorded and analysed
under a unified name that carries the brand forward.
However, for some companies’ change in location, name, or both it was
difficult or altogether impossible to infer continuity. For example, the pis-
tol manufacturer Bryco Arms is listed in the ATF record until 2004. The
firm went bankrupt and was acquired by one of its foremen, Paul J. Jimenez,
recorded by the ATF as ‘Jimenez Paul J’ (Butterfield, 2004). In the record both
Bryco and Jimenez are listed for 2004 under the same street address in Costa
Mesa, California. But in 2006 Jimenez changed the company name and loca-
tion, with the firm becoming Jimenez Arms Inc. of Las Vegas, Nevada and
later of Henderson, Nevada (with a new RDS key). To the uninitiated, it may
appear that there are four firms with four different RDS keys. Arguably,
however, cases like this reflect one continuous operation and can be uncov-
ered only through painstaking company-by-company research. (In the end
it was decided to treat Bryco as an entity separate from the Jimenez entities.)
A small number of companies operate more than one production site.
These include major companies, such as Ruger and Remington, but also
a number of small-scale producers. The ATF maintains a separate record,
22 Small Arms Survey Working Paper 14 Brauer The US Firearms Industry: Production and Supply 23
or RDS key, for each production location (or ‘premises’, or ‘establishment’).
Where detected, the study combined data records into a single entry for the
relevant year and weapons category.
One problem of major proportions that has significant implications
concerns the ATF’s reporting of data according to the FFL licensee. Thus,
a hypothetical ‘Brauer Holdings’ could own five firearms manufacturers—
Harris Arms, Jones Arms, Miller Arms, Smith Arms, and White Arms—each
reporting to the ATF as a separate firearms-manufacturing establishment.
This study thus reports firm evidence that the market for rifles, for example,
is substantially more concentrated than suggested by ATF data alone. Spe-
cifically, a single parent company owns at least five prominent rifle brands
that in 2010 accounted for more than one-third of the entire US non-military
rifle market (see Table 7).
Between 1986 and 2010 ATF records report non-export production (dis-
posal into commerce from current-year production or prior-year inventories)
of 98,153,716 pistols, revolvers, rifles, and shotguns—an average of 3.92 mil-
lion firearms for each of the 25 years. As mentioned, data had to be hand-
entered, raising the possibility of data entry errors. Cross-validation compu-
tations show, however, that, of the 30,250,858 pistols produced, all but 11 can
be traced to specific companies, so that data entry error is minute. All of the
11,645,188 revolvers, 34,652,605 rifles, and 21,605,065 shotguns are accounted
for in the database.
The study also experienced severe data problems in relation to import
and export numbers. Gabelnick, Haug, and Lumpe (2006) reported import
data for the seven-year period 1998–2004, referencing Customs. To match
the ATF record, the present study constructed a firearms import and export
time series going back to 1980. In order to do this the author purchased vari-
ous data series from 1980 onward and then pieced them together. Because
of changes in data classifications under the US tariff structure, however, it
proved impossible to exclude military weapons from the record or to sepa-
rate pistols from revolvers. Thus, the international trade data includes an
unknown, but probably relatively small, number of military weapons.14
An initial attempt to reverse compute firearms unit sales at the wholesale
level by using federal firearms and ammunition excise tax (FAET) records
22 Small Arms Survey Working Paper 14 Brauer The US Firearms Industry: Production and Supply 23
failed. This does not mean that this is an impossible task, only that some additional expenditure of time would be necessary—with an as-yet uncer-tain outcome. Of special note here is, firstly, that one will need to use tax liability rather than taxes collected data and, secondly, that the FAET data is subject to very substantial revisions over time and, of course, needs to be adjusted for inflation. Thirdly, an unknown quantity of weapons sales is tax exempt. Fourthly, data prior to 1991 was collected by a different agency, the Internal Revenue Service (IRS), to the one that has collected the data since then, the Alcohol and Tobacco Trade and Tax Bureau. The IRS does have records on taxes collected, but—it appears at this point in the research—not on taxes assessed.
In terms of market demand, data on the number of criminal background checks of potential firearms end customers via the National Instant Criminal Background Check System (NICS) is available on the FBI website (FBI, n.d.). This data is also problematic because background checks do not equate to firearms purchases. Nonetheless, as detailed later, the study shows how one may approximate the demand for non-military firearms in the United States from the NICS data.
The study obtained merger and acquisitions information in part through Meltwater News, an Internet-based news aggregator. At the time, Meltwater indexed more than 30,000 business, trade, and general publications accord-ing to search criteria entered by the user. The present study included writing search codes for some of the major firearms manufacturers, but obtained few hits relevant to production-related information, even for major compa-nies. Because ownership shares of the overwhelming majority of firearms manufacturers are not publicly traded, these firms are not required by law to reveal information about their operations that would have been relevant to this study. As a result, much of the trade news consists of little more than recycled press releases and advertisements for company products or product reviews. In addition, many—indeed, most—search results referenced a com-pany’s products as part of a crime news story and this was not relevant to this study. Nonetheless, on occasion the Meltwater-enabled searches located important information that, combined with further Internet-based searches, began to reveal large-scale merger and acquisitions activity in 2007. This is addressed in detail later in the paper.
24 Small Arms Survey Working Paper 14 Brauer The US Firearms Industry: Production and Supply 25
Civilian market production
This section presents the study’s findings related to producers and overall
non-export production of pistols, revolvers, rifles, and shotguns by US fire-
arms manufacturers for the civilian, private security, and law enforcement
markets. Data on military-related production may in principle be derived
from US Department of Defense procurement records but, beyond an explor-
atory foray, this has not been pursued for the present study. This section
first discusses reporting compliance, followed by a discussion of types of
producers, and total and average production levels. It also estimates possible
underreporting of firearms manufactured and discusses business cycles in
the US firearms market between 1980 and 2010.
Reporting complianceMonthly lists of FFL licensees are now available on the ATF website. The
January 2010 list, for example, contains records for 60,602 licence holders. Of
these, 3,718 licensees held licence type 07 (‘Manufacture of Firearms’), and
224 held type 10 (‘Manufacture of Destructive Devices’), for a total of 3,942
licensees mandated to report production levels. Assuming that all licensees
were in operation in 2009, one would expect 3,942 producers to be listed in
the 2009 AFMER, but in fact only about 1,000 are listed. Even allowing for
double counting, such as when one licence holder produces in several of the
pistol, revolver, rifle, shotgun, and miscellaneous firearms categories, this
would suggest a ‘raw’ reporting rate of only about 26 per cent. Presumably,
most of the remainder is accounted for by intra-industry trade, but data for
actual reporting compliance is not made available by the ATF.
According to ATF instructions on ATF E-Form 5300.11,
[t]hose Federal Firearms Licensees who hold either a [type 07 or type 10 licence]
must file in compliance with 27 CFR § 478.126., on an annual basis …. Even
if there has been no production, an annual report must be filed (ATF, n.d.c).
24 Small Arms Survey Working Paper 14 Brauer The US Firearms Industry: Production and Supply 25
Interviews with AFMER-related officials at the ATF suggest that, even when
the bureau has done so from time to time in the past, ordinarily it does not
choose to publish the licensee names of ‘zero production’ establishments. For
the two years for which the ATF itself reported compliance rates, they were
in the mid-70 per cent range (the original, unrevised ATF, 2004; 2005). An
ATF fact sheet of June 2008 posted on the bureau’s website reveals that it
views compliance and firearms inventory management and control as some-
what of a problem:
In Fiscal Year 2007, ATF conducted approximately 10,000 compliance in-
spections. More than 40 percent of the licensees inspected were determined to
be in full compliance with the law and regulations and no violations were
cited. Approximately 100 federal firearms licenses were revoked or were de-
nied renewal due to willful violations of the GCA [Gun Control Act]. This
figure is approximately 1 percent of the number of licensees inspected .... To
assist licensees in achieving and maintaining compliance, ATF conducts re-
call inspections on all licensees who have committed violations that warrant-
ed a warning conference. In 2007, recall inspections resulted in an overall
85-percent reduction in the total instances of violations. Recall inspections
also resulted in a 78-percent reduction in disclosed prohibited sales and a
90-percent decrease in inventory discrepancies (ATF, 2008).
If ‘more than 40 percent’ of licensees were in ‘full compliance’, then about 60
per cent were not. Nonetheless, because there is no obvious reason why com-
pliance would shift from year to year in systematic ways, one may assume
that, even though the total number of firearms produced is underreported,
it may be underreported in a consistent way. If this is correct, then some of
this paper’s observations—regarding firearms production business cycles,
for instance—would hold in substance, even if not in numbers. Moreover,
exceptions notwithstanding, compliance problems appear to affect small-
scale producers far more often than the larger, well-known companies, so
that any quantitative effect of non-reporting may not be overly large in rela-
tion to the total firearms unit production captured in the ATF record.
26 Small Arms Survey Working Paper 14 Brauer The US Firearms Industry: Production and Supply 27
Types of producers and average production levels
From the 1986–2010 ATF record this study identified 2,228 federal firearms
licensees (‘firms’). Of these firms, 721 produced pistols, 133 produced revolv-
ers, 1,817 produced rifles, and 332 produced shotguns, giving a total of 3,003
firms, which implies that a number of them produced in more than one prod-
uct category.
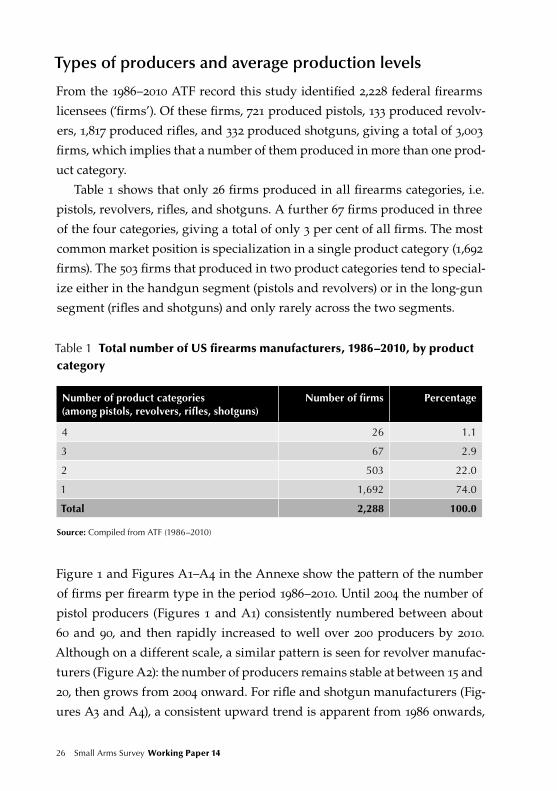
Table 1 shows that only 26 firms produced in all firearms categories, i.e.
pistols, revolvers, rifles, and shotguns. A further 67 firms produced in three
of the four categories, giving a total of only 3 per cent of all firms. The most
common market position is specialization in a single product category (1,692
firms). The 503 firms that produced in two product categories tend to special-
ize either in the handgun segment (pistols and revolvers) or in the long-gun
segment (rifles and shotguns) and only rarely across the two segments.
Table 1 Total number of US firearms manufacturers, 1986–2010, by product category
Number of product categories (among pistols, revolvers, rifles, shotguns)
Number of firms Percentage
4 26 1.1
3 67 2.9
2 503 22.0
1 1,692 74.0
Total 2,288 100.0
Source: Compiled from ATF (1986–2010)
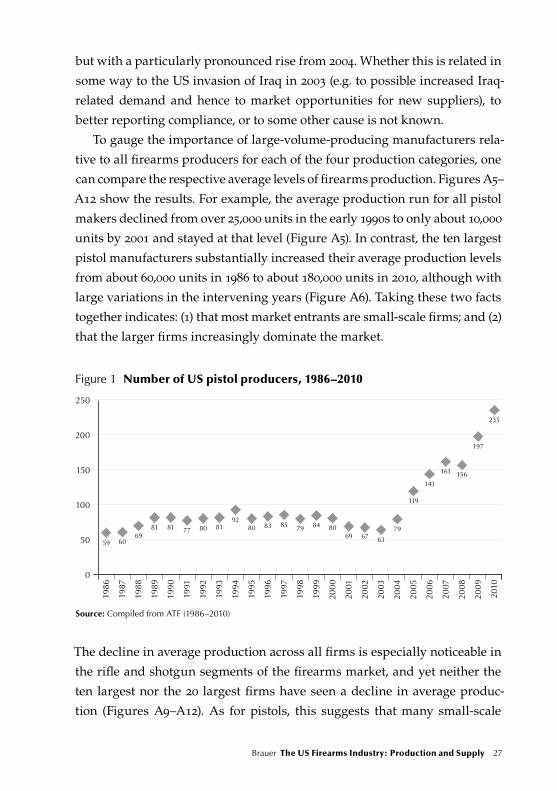
Figure 1 and Figures A1–A4 in the Annexe show the pattern of the number
of firms per firearm type in the period 1986–2010. Until 2004 the number of
pistol producers (Figures 1 and A1) consistently numbered between about
60 and 90, and then rapidly increased to well over 200 producers by 2010.
Although on a different scale, a similar pattern is seen for revolver manufac-
turers (Figure A2): the number of producers remains stable at between 15 and
20, then grows from 2004 onward. For rifle and shotgun manufacturers (Fig-
ures A3 and A4), a consistent upward trend is apparent from 1986 onwards,
26 Small Arms Survey Working Paper 14 Brauer The US Firearms Industry: Production and Supply 27
but with a particularly pronounced rise from 2004. Whether this is related in
some way to the US invasion of Iraq in 2003 (e.g. to possible increased Iraq-
related demand and hence to market opportunities for new suppliers), to
better reporting compliance, or to some other cause is not known.
To gauge the importance of large-volume-producing manufacturers rela-
tive to all firearms producers for each of the four production categories, one
can compare the respective average levels of firearms production. Figures A5–
A12 show the results. For example, the average production run for all pistol
makers declined from over 25,000 units in the early 1990s to only about 10,000
units by 2001 and stayed at that level (Figure A5). In contrast, the ten largest
pistol manufacturers substantially increased their average production levels
from about 60,000 units in 1986 to about 180,000 units in 2010, although with
large variations in the intervening years (Figure A6). Taking these two facts
together indicates: (1) that most market entrants are small-scale firms; and (2)
that the larger firms increasingly dominate the market.
Figure 1 Number of US pistol producers, 1986–2010
2010
200
150
250
100
50
0
1992
1986
1993
1987
1994
1988
1995
1989
1996
1990
1997
1991
1998
1999
2000
2001
2002
2003
2004
2005
2006
2007
2008
2009
59 6069
81 81 77 80 8192
80 83 85 79 84 8069 67 63
79
119
143
161 156
197
235
Source: Compiled from ATF (1986–2010)
The decline in average production across all firms is especially noticeable in
the rifle and shotgun segments of the firearms market, and yet neither the
ten largest nor the 20 largest firms have seen a decline in average produc-
tion (Figures A9–A12). As for pistols, this suggests that many small-scale
28 Small Arms Survey Working Paper 14 Brauer The US Firearms Industry: Production and Supply 29
producers entered the market in later years (or that reporting compliance
improved). The small firms may not have much of a purely commercial inter-
est in firearms production and sales: they may be hobbyists or craft pro-
ducers. Nonetheless, they are required to be in possession of an FFL and to
report their production.
Over the 25-year data record only 26 of the 2,288 firms in the dataset
reported production in all four weapons categories: pistols, revolvers, rifles,
and shotguns (Table 1). Among the major manufacturers, this includes only
Bushmaster Firearms International, Colt’s Manufacturing, Smith & Wesson,
and Ruger. A further 67 firms reported production in three weapons cat-
egories, including Beretta USA, Remington, Savage Arms, and Thompson
Center. For the most part, however, manufacturers specialize in only one
firearms category and as a result, and with the exception of the largest firms,
the industry appears to be strongly segmented into four product categories.
However, since 2007 an increasing number of firms reported production in
multiple product categories, perhaps reflecting an attempt to gain economies
of scope by branching into other product segments.
Underreporting of firearms production
As mentioned, reporting compliance may be poor. At least three types of
non-compliance appear commonplace. Firstly, some firms never report data
to the ATF in time. Secondly, many firms appear to ‘skip’ reporting for cer-
tain years. Thirdly, some firms seem to adopt ‘censored’ reporting in which
they do not report in the first year or first few years of operation; subse-
quently report continuously for a period of time; and then do not report for
the final year or final few years before going out of business. In this third
case firms are said to ‘censor’ the first and last year or years of their opera-
tions in the ATF record.
In the first case the ATF holds no (timely) records of firms that fail to
report, and the bureau’s documents therefore underreport firearms pro-
duction. This is also true of censored reporting: there is no record for the
censored years and firearms production is therefore underreported. In
the second case, however, it is possible to gain an idea of the magnitude of
28 Small Arms Survey Working Paper 14 Brauer The US Firearms Industry: Production and Supply 29
underreporting. Even though firms may skip reporting in certain years, their
production can be approximated from reported unit production in adjacent
years (e.g. a firm does not report in 2007, but numbers for 2006 and 2008 can
be used as proxies).
For example, the ATF record shows that Taurus International Manufac-
turing Inc. did not report in 2003. For 2002 and 2004 the company reported
annual production of around 11,000–12,000 pistols. It seems fair to assume
that the firm also produced about this number of pistols in the unreported
year, 2003. Averaging the numbers from the surrounding years would sug-
gest a missing report in the order of 11,500 Taurus pistols for 2003. Filling in
the ‘n/a’ entries in this way for companies that were top-25 producers in 2010,
Taurus, Sig Sauer, Cobra, Springfield, and Phoenix, suggests non-reporting of
at least 162,435 pistols over the ten-year period 2001–10, or an additional 1.4
per cent on top of reported production.
Jimenez, Glock, STI International Inc., and Masterpiece Arms Inc. may be
examples of censored reporting. As mentioned, Jimenez (ranked 12 in 2010)
is the successor firm to Bryco (which reported, but dropped out of the top
25). Since Bryco’s numbers are in the record, no adjustment is needed, but
this would not be obvious to the casual observer. The case of Glock (ranked
14 in 2010) is interesting because the firm imported firearms into the United
States before 2005. Yet, while importers of firearms are required to possess a
valid FFL licence, the AFMER reports do not capture imports, only US-based
production.
STI and Masterpiece reported for 2009 (ranked 23rd and 24th, respectively),
but not for 2010. As of 11 March 2012 both maintained active websites adver-
tising their products so that the 2010 estimated pistol underreporting, based
solely on the top 25 ATF-reporting firms for 2010, is a minimum number. (In
2009 STI and Masterpiece reported pistol production just shy of 10,000 units
each. If they produced at similar levels in 2010, the underreporting of pistol
production in 2010 would correspondingly rise to about 180,000 units.)
Applying this procedure to all four firearms categories for the years 2001–10
suggests underreporting of 1.4 per cent for pistol manufacture (162,435 weap-
ons); 0.7 per cent for revolvers (27,724 weapons); 0.7 per cent for rifles (105,460
weapons); and 0.3 per cent for shotguns (22,895 weapons). Combined, the
30 Small Arms Survey Working Paper 14 Brauer The US Firearms Industry: Production and Supply 31
numbers suggest underreporting of at least 318,513 firearms for the ten-year
period 2001–10, or about 32,000 per year.
Combined with the relatively slack reporting compliance, these figures
suggest a significant understatement of firearms production in the United
States in the official record, at least in absolute terms. Of course, this not only
complicates an external understanding of the industry, but limits the ability
of the industry to understand itself.
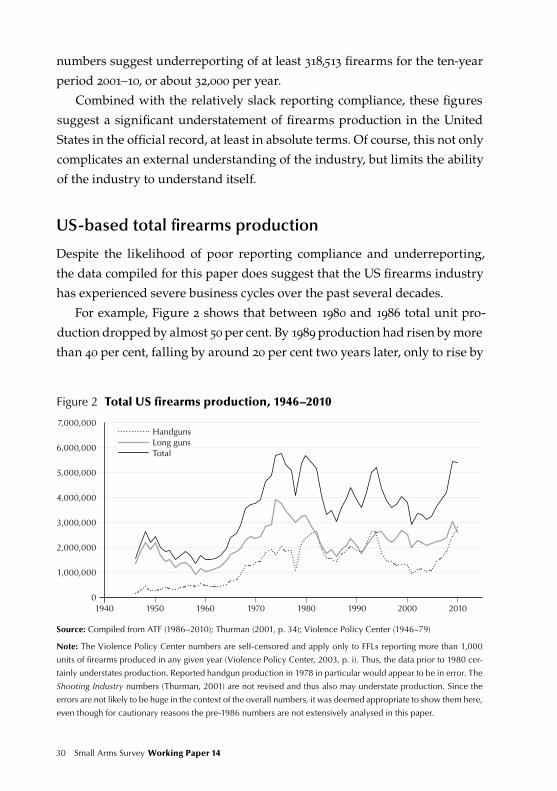
US-based total firearms production
Despite the likelihood of poor reporting compliance and underreporting,
the data compiled for this paper does suggest that the US firearms industry
has experienced severe business cycles over the past several decades.
For example, Figure 2 shows that between 1980 and 1986 total unit pro-
duction dropped by almost 50 per cent. By 1989 production had risen by more
than 40 per cent, falling by around 20 per cent two years later, only to rise by
Figure 2 Total US firearms production, 1946–2010
4,000,000
3,000,000
7,000,000
6,000,000
5,000,000
2,000,000
1,000,000
01940 1950 1960 1970 1980 1990 2000 2010
HandgunsLong gunsTotal
Source: Compiled from ATF (1986–2010); Thurman (2001, p. 34); Violence Policy Center (1946–79)
Note: The Violence Policy Center numbers are self-censored and apply only to FFLs reporting more than 1,000
units of firearms produced in any given year (Violence Policy Center, 2003, p. i). Thus, the data prior to 1980 cer-
tainly understates production. Reported handgun production in 1978 in particular would appear to be in error. The
Shooting Industry numbers (Thurman, 2001) are not revised and thus also may understate production. Since the
errors are not likely to be huge in the context of the overall numbers, it was deemed appropriate to show them here,
even though for cautionary reasons the pre-1986 numbers are not extensively analysed in this paper.
30 Small Arms Survey Working Paper 14 Brauer The US Firearms Industry: Production and Supply 31
almost 50 per cent again in 1994. By 2001 production had dropped by one-
third—the first time since the late 1960s that fewer than three million units
had been manufactured. From then, production rose to around 5.5 million
units in 2010.
From the point of view of the firms competing in this market, these dras-
tic variations in production levels may pose a challenge, because they are
likely to make capital, debt, labour, production, research and development,
marketing, revenue, and other forms of planning and management diffi-
cult—and more so because most firms engage in single-firearms-segment
production. Moreover, few firms are part of a conglomerate that might be
able to ride out business cycles with counter-cyclical activity in other busi-
ness areas.
Without better information, however, it is difficult to ascertain the impact
of market volatility on the firms, particularly information regarding pro-
duction technology, costs, prices, and profits. Market volatility might pose
only minor problems if firms had flexible production methods and/or con-
stant returns-to-scale technology, or if price mark-ups reflected market
power, which is a distinct possibility, given the duopoly or oligopoly struc-
tures noted later in the paper. Although Hall, Markowski, and Brauer (2008)
believe that industry profitability is not stellar, in principle these attributes
could permit firms to vary the scale of production without necessarily affect-
ing their profit rates.15 Thus, without knowing more about the technology of
production and the flexibility of input supplies, one cannot say whether or
not the industry should consider demand volatility a cause for concern. Fur-
thermore, since the early-to-mid-1990s it appears to be primarily the pistol
market that drives overall firearms market volatility, and it is this market
that foreign brand names have penetrated most successfully. Volatility in the
overall market may be a statistical figment, then, with potential concerns for
US manufacturers to be found in the pistol market only. At any rate, it would
be of interest for future research to understand firms’ management better
with regard to demand fluctuations, responses to government regulations,
and inroads made by foreign competition.
Figure 2 shows an especially pronounced increase and then drop in fire-
arms production that coincided with President Clinton’s administration.
32 Small Arms Survey Working Paper 14 Brauer The US Firearms Industry: Production and Supply 33
This drop is almost entirely accounted for by the handgun segment (pistols
and revolvers). In President George W. Bush’s first term (2001–04), production
was constant and then increased rapidly during his second term (2005–08).
Despite this latter increase in production, per capita handgun produc-
tion—a unit of measurement that is rarely considered—declined by around
10 per cent in 2010 compared to 1993 (see Figure A13). In contrast, by 2010 per
capita rifle production again rose to the high levels of the 1970s and early
1980s (Figure A15). From the early 1980s to the early 1990s handguns and
long guns (rifles and shotguns) sold in roughly equal numbers (see Figure
2). Because of the pronounced drop in pistol sales during the Clinton admin-
istration, overall handgun production dropped far below the fairly constant
number of long-gun sales during the early 1990s to mid-2000s. But, since then,
handgun sales have again reached the levels of long-gun production.
As noted, volatility in the market stems primarily from the pistol segment
(see Figures A14 and A15 for a disaggregation of the data by weapon type). By
contrast, relative to the other segments, the rifle market was fairly stable in
per capita numbers for almost 25 years from the early 1980s to the mid-2000s
and has seen a drastic increase only since then. The shotgun and revolver
segments show slow, sustained declines since the mid-1990s (for revolvers
since the mid-1980s), but with recent stabilization and even somewhat of a
per capita increase since the mid-2000s.
32 Small Arms Survey Working Paper 14 Brauer The US Firearms Industry: Production and Supply 33
Manufacturer size
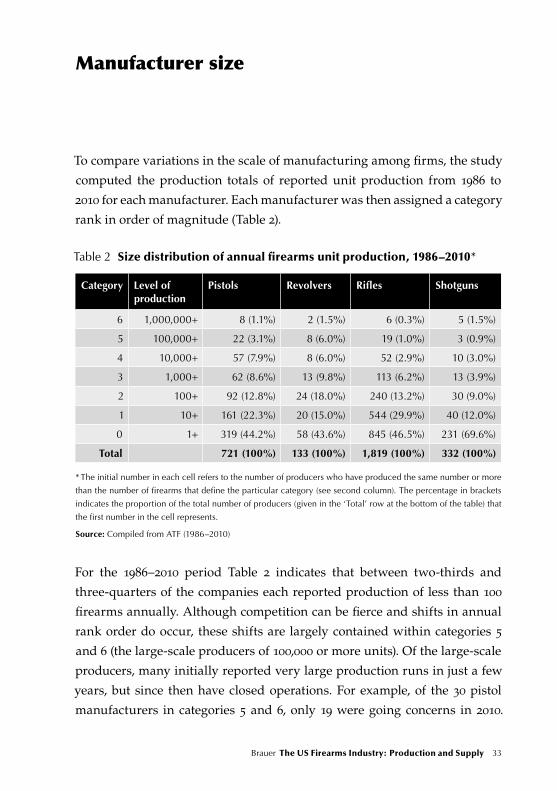
To compare variations in the scale of manufacturing among firms, the study
computed the production totals of reported unit production from 1986 to
2010 for each manufacturer. Each manufacturer was then assigned a category
rank in order of magnitude (Table 2).
Table 2 Size distribution of annual firearms unit production, 1986–2010*
Category Level of production
Pistols Revolvers Rifles Shotguns
6 1,000,000+ 8 (1.1%) 2 (1.5%) 6 (0.3%) 5 (1.5%)
5 100,000+ 22 (3.1%) 8 (6.0%) 19 (1.0%) 3 (0.9%)
4 10,000+ 57 (7.9%) 8 (6.0%) 52 (2.9%) 10 (3.0%)
3 1,000+ 62 (8.6%) 13 (9.8%) 113 (6.2%) 13 (3.9%)
2 100+ 92 (12.8%) 24 (18.0%) 240 (13.2%) 30 (9.0%)
1 10+ 161 (22.3%) 20 (15.0%) 544 (29.9%) 40 (12.0%)
0 1+ 319 (44.2%) 58 (43.6%) 845 (46.5%) 231 (69.6%)
Total 721 (100%) 133 (100%) 1,819 (100%) 332 (100%)
* The initial number in each cell refers to the number of producers who have produced the same number or more
than the number of firearms that define the particular category (see second column). The percentage in brackets
indicates the proportion of the total number of producers (given in the ‘Total’ row at the bottom of the table) that
the first number in the cell represents.
Source: Compiled from ATF (1986–2010)
For the 1986–2010 period Table 2 indicates that between two-thirds and
three-quarters of the companies each reported production of less than 100
firearms annually. Although competition can be fierce and shifts in annual
rank order do occur, these shifts are largely contained within categories 5
and 6 (the large-scale producers of 100,000 or more units). Of the large-scale
producers, many initially reported very large production runs in just a few
years, but since then have closed operations. For example, of the 30 pistol
manufacturers in categories 5 and 6, only 19 were going concerns in 2010.
34 Small Arms Survey Working Paper 14 Brauer The US Firearms Industry: Production and Supply 35
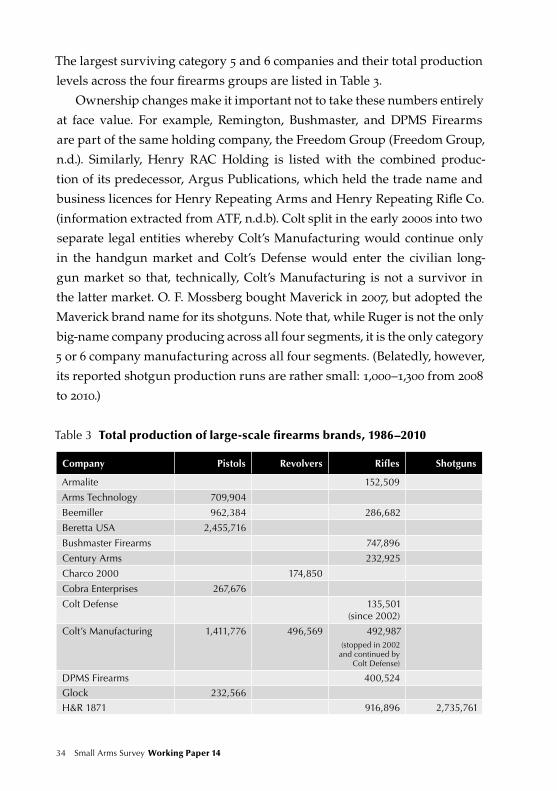
The largest surviving category 5 and 6 companies and their total production
levels across the four firearms groups are listed in Table 3.
Ownership changes make it important not to take these numbers entirely
at face value. For example, Remington, Bushmaster, and DPMS Firearms
are part of the same holding company, the Freedom Group (Freedom Group,
n.d.). Similarly, Henry RAC Holding is listed with the combined produc-
tion of its predecessor, Argus Publications, which held the trade name and
business licences for Henry Repeating Arms and Henry Repeating Rifle Co.
(information extracted from ATF, n.d.b). Colt split in the early 2000s into two
separate legal entities whereby Colt’s Manufacturing would continue only
in the handgun market and Colt’s Defense would enter the civilian long-
gun market so that, technically, Colt’s Manufacturing is not a survivor in
the latter market. O. F. Mossberg bought Maverick in 2007, but adopted the
Maverick brand name for its shotguns. Note that, while Ruger is not the only
big-name company producing across all four segments, it is the only category
5 or 6 company manufacturing across all four segments. (Belatedly, however,
its reported shotgun production runs are rather small: 1,000–1,300 from 2008
to 2010.)
Table 3 Total production of large-scale firearms brands, 1986–2010
Company Pistols Revolvers Rifles Shotguns
Armalite 152,509
Arms Technology 709,904
Beemiller 962,384 286,682
Beretta USA 2,455,716
Bushmaster Firearms 747,896
Century Arms 232,925
Charco 2000 174,850
Cobra Enterprises 267,676
Colt Defense 135,501 (since 2002)
Colt’s Manufacturing 1,411,776 496,569 492,987 (stopped in 2002
and continued by Colt Defense)
DPMS Firearms 400,524
Glock 232,566
H&R 1871 916,896 2,735,761
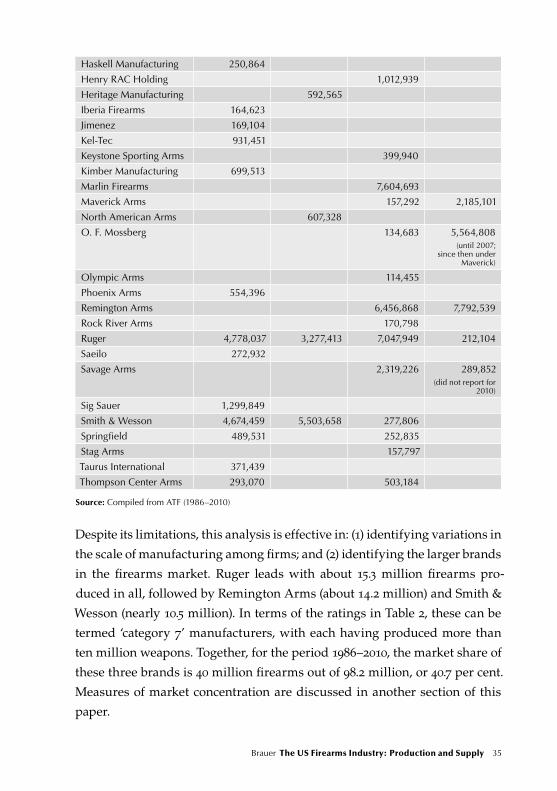
34 Small Arms Survey Working Paper 14 Brauer The US Firearms Industry: Production and Supply 35
Haskell Manufacturing 250,864
Henry RAC Holding 1,012,939
Heritage Manufacturing 592,565
Iberia Firearms 164,623
Jimenez 169,104
Kel-Tec 931,451
Keystone Sporting Arms 399,940
Kimber Manufacturing 699,513
Marlin Firearms 7,604,693
Maverick Arms 157,292 2,185,101
North American Arms 607,328
O. F. Mossberg 134,683 5,564,808 (until 2007;
since then under Maverick)
Olympic Arms 114,455
Phoenix Arms 554,396
Remington Arms 6,456,868 7,792,539
Rock River Arms 170,798
Ruger 4,778,037 3,277,413 7,047,949 212,104
Saeilo 272,932
Savage Arms 2,319,226 289,852 (did not report for
2010)
Sig Sauer 1,299,849
Smith & Wesson 4,674,459 5,503,658 277,806
Springfield 489,531 252,835
Stag Arms 157,797
Taurus International 371,439
Thompson Center Arms 293,070 503,184
Source: Compiled from ATF (1986–2010)
Despite its limitations, this analysis is effective in: (1) identifying variations in
the scale of manufacturing among firms; and (2) identifying the larger brands
in the firearms market. Ruger leads with about 15.3 million firearms pro-
duced in all, followed by Remington Arms (about 14.2 million) and Smith &
Wesson (nearly 10.5 million). In terms of the ratings in Table 2, these can be
termed ‘category 7’ manufacturers, with each having produced more than
ten million weapons. Together, for the period 1986–2010, the market share of
these three brands is 40 million firearms out of 98.2 million, or 40.7 per cent.
Measures of market concentration are discussed in another section of this
paper.
36 Small Arms Survey Working Paper 14 Brauer The US Firearms Industry: Production and Supply 37
US vs foreign brand names
When studying firm-by-firm annual records from 1986 onwards, it becomes
clear that non-US brands have gradually encroached on the US market and
currently are firmly established in it, at least among pistol manufacturers. It
is important to understand that, in order to be captured in the ATF record,
these firms must have established firearms manufacturing facilities in the
United States and should not simply be importing weapons from abroad.
Thus, according to the ATF, in 1986 only the Italian firm Beretta ranked
among the top pistol makers (at rank 6). By 2010 the top-ranking manufac-
turers included five foreign brand names, including the German Sig Sauer
(rank 3), Beretta (4), the Brazilian Taurus (5), the Austrian Glock (14), and the
Belgian FN (Herstal) Manufacturing (22). Among rifle manufacturers, large
US brands still predominate, but a reading of the trade literature indicates
that currently components are frequently sourced from countries such as the
Russian Federation, Turkey, and Mexico. The next section addresses penetra-
tion of the US firearms market by genuine imports, i.e. those not captured
by the ATF. In addition to domestically produced and retained weapons (i.e.
net of exports), these imports constitute a second source of supply to the US
market.
36 Small Arms Survey Working Paper 14 Brauer The US Firearms Industry: Production and Supply 37
Exports, imports, and net firearms supplies
Annual US-based production does not constitute total market supply. This
is because some US-manufactured firearms are exported and some non-US-
manufactured firearms are imported. Understanding the firearms market
therefore requires one to obtain a sense of the magnitude of market demand
and the supply of imported firearms, plus domestically produced firearms
net of exports (newly produced, domestically retained firearms). But, due to
discrepancies between the numbers reported by the ATF and Customs, it is
not easy to estimate either net market supply or demand. Further, it is essen-
tial to distinguish between used firearms that enter the market for resale
and those that have been newly manufactured—abroad or at home—for US
domestic sale.
This section of the paper discusses how one may estimate firearms sup-
plies net of exports to the United States. The following section then discusses
how to estimate demand for firearms, including used firearms. The logic
used is rather intricate and so it may help to visualize the procedure with the
assistance of Table 4.
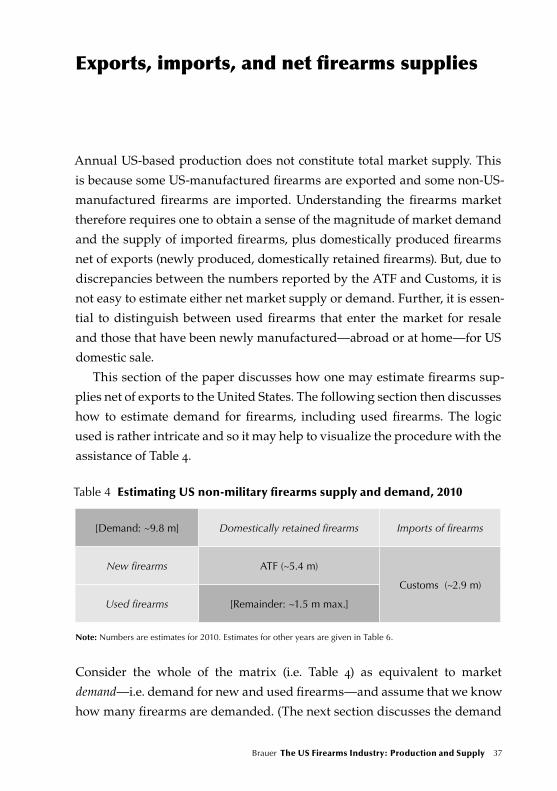
Table 4 Estimating US non-military firearms supply and demand, 2010
[Demand: ~9.8 m] Domestically retained firearms Imports of firearms
New firearms ATF (~5.4 m)
Customs (~2.9 m)
Used firearms [Remainder: ~1.5 m max.]
Note: Numbers are estimates for 2010. Estimates for other years are given in Table 6.
Consider the whole of the matrix (i.e. Table 4) as equivalent to market
demand—i.e. demand for new and used firearms—and assume that we know
how many firearms are demanded. (The next section discusses the demand
38 Small Arms Survey Working Paper 14 Brauer The US Firearms Industry: Production and Supply 39
estimation. As explained in conjunction with Table 6, for 2010 this turned
out to be about 9.8 million firearms, indicated by the expression placed in
square brackets in the top-left, dark-grey-shaded cell of Table 4.) On the
supply side, ATF records contain information on US-based firearms manu-
facturers’ annual domestic production and their exports, so that it is a simple
matter to place the number of domestically retained firearms, labelled ‘ATF’,
in Table 4 as well. This amounted to about 5.4 million weapons in 2010. As
discussed in detail in the following two sub-sections, from Customs data
one can obtain numbers for the import of firearms. For 2010 this amounted
to about 2.9 million civilian market (i.e. non-military) firearms.
Unfortunately, Customs does not differentiate between new and used
imported weapons. Nonetheless, as may be seen from Table 4, if total demand
for new and used firearms equals 9.8 million weapons, and 2.9 million of
these are supplied by net imports, then the domestically supplied portion
must be the remaining 6.9 million. But we know from ATF figures that, of
these 6.9 million, 5.4 million were supplied as ‘new’. Therefore, the number
for the used, non-imported firearms component of the market—the size of
the resale market—must be the remainder of about 1.5 million firearms. (An
important caveat is that this applies exclusively to used firearms sales via
federally licensed firearms outlets; see the next main section for details.)
Having laid out the logic of the argument, the following two sub-sections
discuss export and import data so that net import supply may be computed.
The following main section then discusses the details of estimating the
remainder of supply and market demand.
Export data
Figure 3 displays USCB export data and also export data compiled by the
ATF. On the whole, the USCB reports a far higher number of firearms exports
than does the ATF and the difference is not uniform from year to year. In
fact, the difference between the two datasets has been growing steadily from
under 100,000 weapons in the mid-1980s to about 300,000 weapons by 2010
(see Figure 3). The discrepancy relates to a number of features of the data-
collecting agencies and to the data itself.
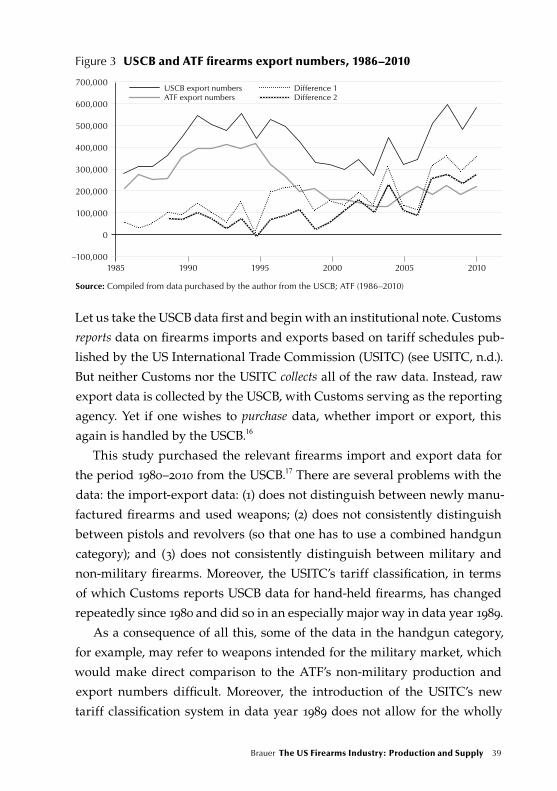
38 Small Arms Survey Working Paper 14 Brauer The US Firearms Industry: Production and Supply 39
Figure 3 USCB and ATF firearms export numbers, 1986–2010
400,000
300,000
700,000
600,000
500,000
200,000
100,000
–100,000
0
1985 1990 1995 2000 2005 2010
USCB export numbers Difference 1ATF export numbers Difference 2
Source: Compiled from data purchased by the author from the USCB; ATF (1986–2010)
Let us take the USCB data first and begin with an institutional note. Customs
reports data on firearms imports and exports based on tariff schedules pub-
lished by the US International Trade Commission (USITC) (see USITC, n.d.).
But neither Customs nor the USITC collects all of the raw data. Instead, raw
export data is collected by the USCB, with Customs serving as the reporting
agency. Yet if one wishes to purchase data, whether import or export, this
again is handled by the USCB.16
This study purchased the relevant firearms import and export data for
the period 1980–2010 from the USCB.17 There are several problems with the
data: the import-export data: (1) does not distinguish between newly manu-
factured firearms and used weapons; (2) does not consistently distinguish
between pistols and revolvers (so that one has to use a combined handgun
category); and (3) does not consistently distinguish between military and
non-military firearms. Moreover, the USITC’s tariff classification, in terms
of which Customs reports USCB data for hand-held firearms, has changed
repeatedly since 1980 and did so in an especially major way in data year 1989.
As a consequence of all this, some of the data in the handgun category,
for example, may refer to weapons intended for the military market, which
would make direct comparison to the ATF’s non-military production and
export numbers difficult. Moreover, the introduction of the USITC’s new
tariff classification system in data year 1989 does not allow for the wholly
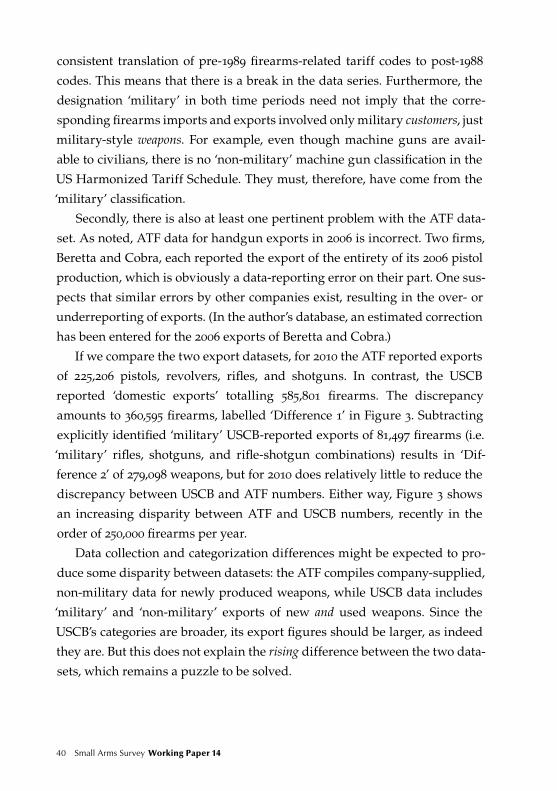
40 Small Arms Survey Working Paper 14 Brauer The US Firearms Industry: Production and Supply 41
consistent translation of pre-1989 firearms-related tariff codes to post-1988
codes. This means that there is a break in the data series. Furthermore, the
designation ‘military’ in both time periods need not imply that the corre-
sponding firearms imports and exports involved only military customers, just
military-style weapons. For example, even though machine guns are avail-
able to civilians, there is no ‘non-military’ machine gun classification in the
US Harmonized Tariff Schedule. They must, therefore, have come from the
‘military’ classification.
Secondly, there is also at least one pertinent problem with the ATF data-
set. As noted, ATF data for handgun exports in 2006 is incorrect. Two firms,
Beretta and Cobra, each reported the export of the entirety of its 2006 pistol
production, which is obviously a data-reporting error on their part. One sus-
pects that similar errors by other companies exist, resulting in the over- or
underreporting of exports. (In the author’s database, an estimated correction
has been entered for the 2006 exports of Beretta and Cobra.)
If we compare the two export datasets, for 2010 the ATF reported exports
of 225,206 pistols, revolvers, rifles, and shotguns. In contrast, the USCB
reported ‘domestic exports’ totalling 585,801 firearms. The discrepancy
amounts to 360,595 firearms, labelled ‘Difference 1’ in Figure 3. Subtracting
explicitly identified ‘military’ USCB-reported exports of 81,497 firearms (i.e.
‘military’ rifles, shotguns, and rifle-shotgun combinations) results in ‘Dif-
ference 2’ of 279,098 weapons, but for 2010 does relatively little to reduce the
discrepancy between USCB and ATF numbers. Either way, Figure 3 shows
an increasing disparity between ATF and USCB numbers, recently in the
order of 250,000 firearms per year.
Data collection and categorization differences might be expected to pro-
duce some disparity between datasets: the ATF compiles company-supplied,
non-military data for newly produced weapons, while USCB data includes
‘military’ and ‘non-military’ exports of new and used weapons. Since the
USCB’s categories are broader, its export figures should be larger, as indeed
they are. But this does not explain the rising difference between the two data-
sets, which remains a puzzle to be solved.
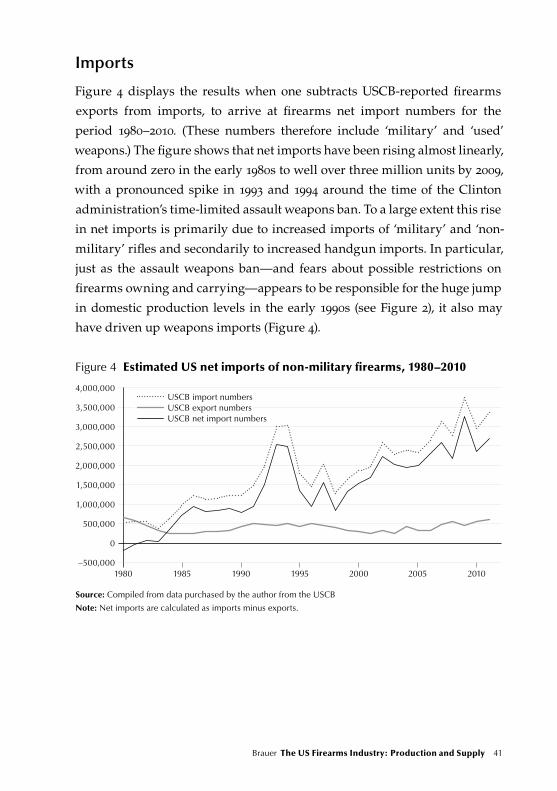
40 Small Arms Survey Working Paper 14 Brauer The US Firearms Industry: Production and Supply 41
Imports
Figure 4 displays the results when one subtracts USCB-reported firearms
exports from imports, to arrive at firearms net import numbers for the
period 1980–2010. (These numbers therefore include ‘military’ and ‘used’
weapons.) The figure shows that net imports have been rising almost linearly,
from around zero in the early 1980s to well over three million units by 2009,
with a pronounced spike in 1993 and 1994 around the time of the Clinton
administration’s time-limited assault weapons ban. To a large extent this rise
in net imports is primarily due to increased imports of ‘military’ and ‘non-
military’ rifles and secondarily to increased handgun imports. In particular,
just as the assault weapons ban—and fears about possible restrictions on
firearms owning and carrying—appears to be responsible for the huge jump
in domestic production levels in the early 1990s (see Figure 2), it also may
have driven up weapons imports (Figure 4).
Figure 4 Estimated US net imports of non-military firearms, 1980–2010
2,500,000
2,000,000
4,000,000
3,500,000
3,000,000
1,500,000
1,000,000
500,000
–500,000
0
1980 1985 1990 1995 2000 2005 2010
USCB import numbersUSCB export numbersUSCB net import numbers
Source: Compiled from data purchased by the author from the USCB
Note: Net imports are calculated as imports minus exports.
42 Small Arms Survey Working Paper 14 Brauer The US Firearms Industry: Production and Supply 43
Estimating US firearms supply and demand
A long-standing goal of researchers has been to compute US non-military
firearms demand and, separately, to estimate the ‘new’ and ‘used’ compo-
nents of this demand. The preceding section discussed the logic of a method
for achieving this goal (see the discussion in conjunction with Table 4). This
section discusses the details.
One can combine various pieces of information from the ATF, USCB, and
FBI to arrive at an approximation of which proportion of the US civilian fire-
arms market is filled by ‘new, domestically produced and retained’ and by
‘new and used imported’ weapons, and, therefore, which portion must be
filled by ‘used domestically produced’ (i.e. resold or used) weapons. Neither
the logic nor the numerical approximations are entirely airtight, but for the
first time in the literature provide a sense of the likely order of magnitude
involved.
The reasoning begins with information gleaned from the FBI’s NICS,
implemented as from November 1998. Monthly data through December 2010
is listed in Table 5 and shows, for example, 1,023,102 background checks con-
ducted in May 2009. The number of background checks cannot, however, be
equated with firearms purchases. For example, from November 1998 to Feb-
ruary 2012 NICS recorded ten million so-called ‘permit’ checks for the state
of Kentucky. For the same state it also recorded more than one million addi-
tional ‘handgun’ checks and 1.6 million ‘long gun’ checks. A ‘permit’ refers
to a firearms-carrying licence issued by the state of Kentucky. The state
checks monthly whether any of its permit holders may no longer be eligible
for gun ownership, e.g. as a result of having committed a felony. Thus, Ken-
tucky’s permit checks amount to continued eligibility checks that are wholly
unrelated to a prospective customer’s intent to purchase a firearm from a
licensed dealer. Similarly, Utah’s permits are checked every 90 days against
FBI records. Each state maintains its own rules regarding the frequency, if
any, with which its issued permits are checked against FBI records.18 Thus,
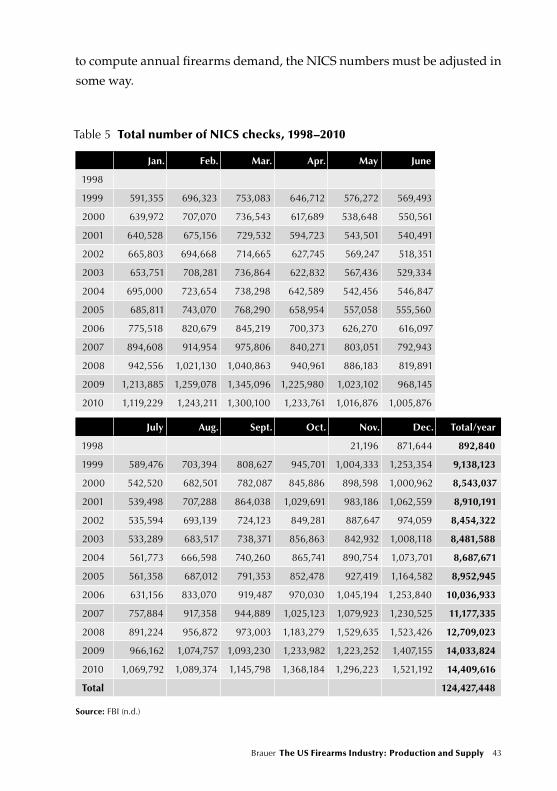
42 Small Arms Survey Working Paper 14 Brauer The US Firearms Industry: Production and Supply 43
to compute annual firearms demand, the NICS numbers must be adjusted in
some way.
Table 5 Total number of NICS checks, 1998–2010
Jan. Feb. Mar. Apr. May June
1998
1999 591,355 696,323 753,083 646,712 576,272 569,493
2000 639,972 707,070 736,543 617,689 538,648 550,561
2001 640,528 675,156 729,532 594,723 543,501 540,491
2002 665,803 694,668 714,665 627,745 569,247 518,351
2003 653,751 708,281 736,864 622,832 567,436 529,334
2004 695,000 723,654 738,298 642,589 542,456 546,847
2005 685,811 743,070 768,290 658,954 557,058 555,560
2006 775,518 820,679 845,219 700,373 626,270 616,097
2007 894,608 914,954 975,806 840,271 803,051 792,943
2008 942,556 1,021,130 1,040,863 940,961 886,183 819,891
2009 1,213,885 1,259,078 1,345,096 1,225,980 1,023,102 968,145
2010 1,119,229 1,243,211 1,300,100 1,233,761 1,016,876 1,005,876
July Aug. Sept. Oct. Nov. Dec. Total/year
1998 21,196 871,644 892,840
1999 589,476 703,394 808,627 945,701 1,004,333 1,253,354 9,138,123
2000 542,520 682,501 782,087 845,886 898,598 1,000,962 8,543,037
2001 539,498 707,288 864,038 1,029,691 983,186 1,062,559 8,910,191
2002 535,594 693,139 724,123 849,281 887,647 974,059 8,454,322
2003 533,289 683,517 738,371 856,863 842,932 1,008,118 8,481,588
2004 561,773 666,598 740,260 865,741 890,754 1,073,701 8,687,671
2005 561,358 687,012 791,353 852,478 927,419 1,164,582 8,952,945
2006 631,156 833,070 919,487 970,030 1,045,194 1,253,840 10,036,933
2007 757,884 917,358 944,889 1,025,123 1,079,923 1,230,525 11,177,335
2008 891,224 956,872 973,003 1,183,279 1,529,635 1,523,426 12,709,023
2009 966,162 1,074,757 1,093,230 1,233,982 1,223,252 1,407,155 14,033,824
2010 1,069,792 1,089,374 1,145,798 1,368,184 1,296,223 1,521,192 14,409,616
Total 124,427,448
Source: FBI (n.d.)
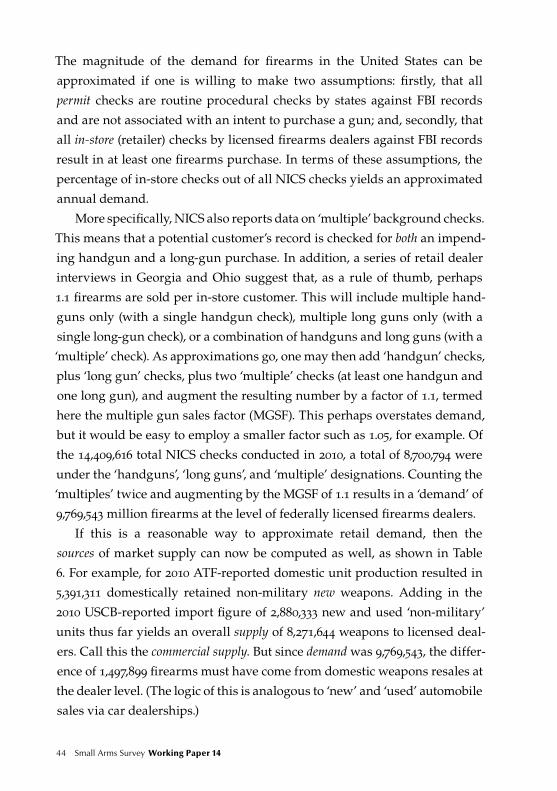
44 Small Arms Survey Working Paper 14 Brauer The US Firearms Industry: Production and Supply 45
The magnitude of the demand for firearms in the United States can be
approximated if one is willing to make two assumptions: firstly, that all
permit checks are routine procedural checks by states against FBI records
and are not associated with an intent to purchase a gun; and, secondly, that
all in-store (retailer) checks by licensed firearms dealers against FBI records
result in at least one firearms purchase. In terms of these assumptions, the
percentage of in-store checks out of all NICS checks yields an approximated
annual demand.
More specifically, NICS also reports data on ‘multiple’ background checks.
This means that a potential customer’s record is checked for both an impend-
ing handgun and a long-gun purchase. In addition, a series of retail dealer
interviews in Georgia and Ohio suggest that, as a rule of thumb, perhaps
1.1 firearms are sold per in-store customer. This will include multiple hand-
guns only (with a single handgun check), multiple long guns only (with a
single long-gun check), or a combination of handguns and long guns (with a
‘multiple’ check). As approximations go, one may then add ‘handgun’ checks,
plus ‘long gun’ checks, plus two ‘multiple’ checks (at least one handgun and
one long gun), and augment the resulting number by a factor of 1.1, termed
here the multiple gun sales factor (MGSF). This perhaps overstates demand,
but it would be easy to employ a smaller factor such as 1.05, for example. Of
the 14,409,616 total NICS checks conducted in 2010, a total of 8,700,794 were
under the ‘handguns’, ‘long guns’, and ‘multiple’ designations. Counting the
‘multiples’ twice and augmenting by the MGSF of 1.1 results in a ‘demand’ of
9,769,543 million firearms at the level of federally licensed firearms dealers.
If this is a reasonable way to approximate retail demand, then the
sources of market supply can now be computed as well, as shown in Table
6. For example, for 2010 ATF-reported domestic unit production resulted in
5,391,311 domestically retained non-military new weapons. Adding in the
2010 USCB-reported import figure of 2,880,333 new and used ‘non-military’
units thus far yields an overall supply of 8,271,644 weapons to licensed deal-
ers. Call this the commercial supply. But since demand was 9,769,543, the differ-
ence of 1,497,899 firearms must have come from domestic weapons resales at
the dealer level. (The logic of this is analogous to ‘new’ and ‘used’ automobile
sales via car dealerships.)
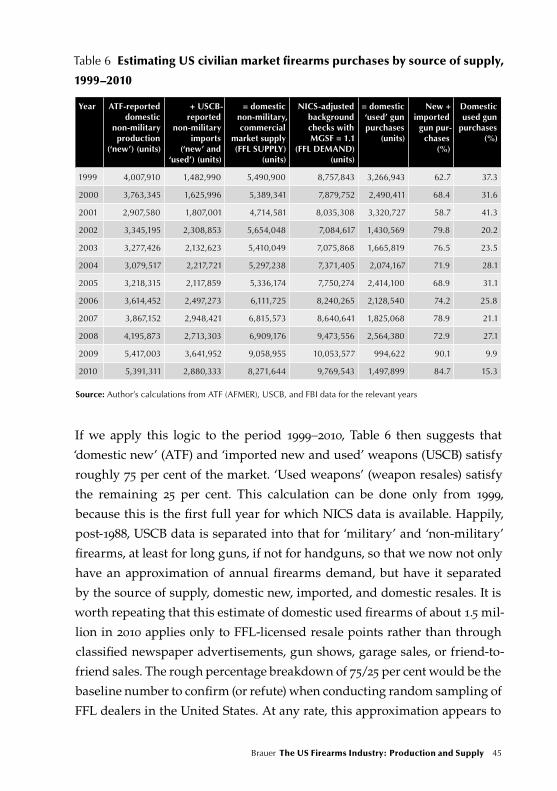
44 Small Arms Survey Working Paper 14 Brauer The US Firearms Industry: Production and Supply 45
Table 6 Estimating US civilian market firearms purchases by source of supply,
1999–2010
Year ATF-reported domestic
non-military production
(‘new’) (units)
+ USCB-reported
non-military imports
(‘new’ and ‘used’) (units)
= domestic non-military, commercial
market supply (FFL SUPPLY)
(units)
NICS-adjusted background checks with MGSF = 1.1
(FFL DEMAND) (units)
= domestic ‘used’ gun purchases
(units)
New + imported
gun pur-chases
(%)
Domestic used gun
purchases (%)
1999 4,007,910 1,482,990 5,490,900 8,757,843 3,266,943 62.7 37.3
2000 3,763,345 1,625,996 5,389,341 7,879,752 2,490,411 68.4 31.6
2001 2,907,580 1,807,001 4,714,581 8,035,308 3,320,727 58.7 41.3
2002 3,345,195 2,308,853 5,654,048 7,084,617 1,430,569 79.8 20.2
2003 3,277,426 2,132,623 5,410,049 7,075,868 1,665,819 76.5 23.5
2004 3,079,517 2,217,721 5,297,238 7,371,405 2,074,167 71.9 28.1
2005 3,218,315 2,117,859 5,336,174 7,750,274 2,414,100 68.9 31.1
2006 3,614,452 2,497,273 6,111,725 8,240,265 2,128,540 74.2 25.8
2007 3,867,152 2,948,421 6,815,573 8,640,641 1,825,068 78.9 21.1
2008 4,195,873 2,713,303 6,909,176 9,473,556 2,564,380 72.9 27.1
2009 5,417,003 3,641,952 9,058,955 10,053,577 994,622 90.1 9.9
2010 5,391,311 2,880,333 8,271,644 9,769,543 1,497,899 84.7 15.3
Source: Author’s calculations from ATF (AFMER), USCB, and FBI data for the relevant years
If we apply this logic to the period 1999–2010, Table 6 then suggests that
‘domestic new’ (ATF) and ‘imported new and used’ weapons (USCB) satisfy
roughly 75 per cent of the market. ‘Used weapons’ (weapon resales) satisfy
the remaining 25 per cent. This calculation can be done only from 1999,
because this is the first full year for which NICS data is available. Happily,
post-1988, USCB data is separated into that for ‘military’ and ‘non-military’
firearms, at least for long guns, if not for handguns, so that we now not only
have an approximation of annual firearms demand, but have it separated
by the source of supply, domestic new, imported, and domestic resales. It is
worth repeating that this estimate of domestic used firearms of about 1.5 mil-
lion in 2010 applies only to FFL-licensed resale points rather than through
classified newspaper advertisements, gun shows, garage sales, or friend-to-
friend sales. The rough percentage breakdown of 75/25 per cent would be the
baseline number to confirm (or refute) when conducting random sampling of
FFL dealers in the United States. At any rate, this approximation appears to
46 Small Arms Survey Working Paper 14 Brauer The US Firearms Industry: Production and Supply 47
be the first data-based attempt in the literature to derive an order of magni-
tude of the possible unit size of domestic firearms resales.19
ATF data on ‘domestically retained, new, non-military production’ and
the import numbers from the USCB can also be used to compute the per
capita source of supply (domestic or foreign) and the changing composition of
commercial supplies. The results are shown in Figure 5. (Due to the break
in the time series, the USCB data is displayed only from 1989.) The numbers
suggest that the domestically produced supply of new, non-military firearms
decreased from around 1,769 per 100,000 people in 1989 to 1,020 per 100,000
people in 2001. Since then, this rate has increased to 1,743 per 100,000 people
in 2010. In contrast, imports of non-military firearms increased from 489 per
100,000 people in 1989 to 931 per 100,000 people in 2010. Total commercial
supply per 100,000 people stayed about constant (2,258 in 1989, compared
to 2,272 in 2008, albeit with a large increase by 2010 to 2,674). The weapons’
source composition, however, has changed markedly. In 1989 domestic manu-
facturers provided 78.4 per cent of the firearms. This percentage has fallen
steadily to 55–65 per cent in the late 2000s.
It may be said, then, that the research reported in this paper has docu-
mented a fundamental change in the supply side of the US firearms market.
It finds massive—and massively increasing—firearms imports. It also finds
an increasing presence of non-US brand names that have established manu-
facturing facilities in the United States and, with this, increasing market
penetration by foreign brand names against US brand names. So far, these
observations would appear to be restricted to the pistol market in particular,
but as noted above, US rifle manufacturers increasingly appear to source
parts from abroad. Moreover, according to the USCB data, non-military long-
gun imports have more than doubled from a level of about 600,000 in the very
early 1990s to above 1.2 million by the late 2000s. As foreign brand names as
such are not prominent on the US civilian long-gun market, one suspects
that the established US brands simply import large numbers of overseas-pro-
duced long guns, and this would need to be confirmed in separate research.
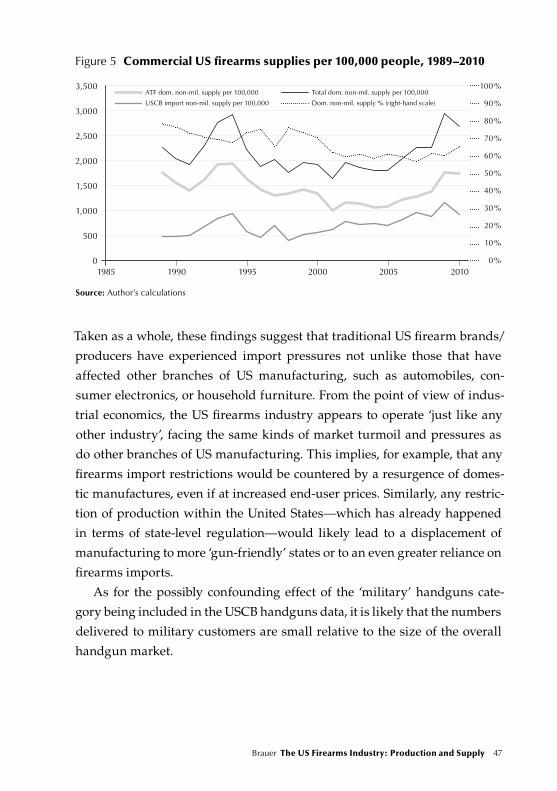
46 Small Arms Survey Working Paper 14 Brauer The US Firearms Industry: Production and Supply 47
Figure 5 Commercial US firearms supplies per 100,000 people, 1989–2010
2,000
1,500
3,500 100 %
90 %
80 %
70 %
60 %
50 %
40 %
30 %
20 %
10 %
0 %
3,000
2,500
1,000
500
01985 1990 1995 2000 2005 2010
Total dom. non-mil. supply per 100,000
Dom. non-mil. supply % (right-hand scale)
ATF dom. non-mil. supply per 100,000
USCB import non-mil. supply per 100,000
Source: Author’s calculations
Taken as a whole, these findings suggest that traditional US firearm brands/
producers have experienced import pressures not unlike those that have
affected other branches of US manufacturing, such as automobiles, con-
sumer electronics, or household furniture. From the point of view of indus-
trial economics, the US firearms industry appears to operate ‘just like any
other industry’, facing the same kinds of market turmoil and pressures as
do other branches of US manufacturing. This implies, for example, that any
firearms import restrictions would be countered by a resurgence of domes-
tic manufactures, even if at increased end-user prices. Similarly, any restric-
tion of production within the United States—which has already happened
in terms of state-level regulation—would likely lead to a displacement of
manufacturing to more ‘gun-friendly’ states or to an even greater reliance on
firearms imports.
As for the possibly confounding effect of the ‘military’ handguns cate-
gory being included in the USCB handguns data, it is likely that the numbers
delivered to military customers are small relative to the size of the overall
handgun market.
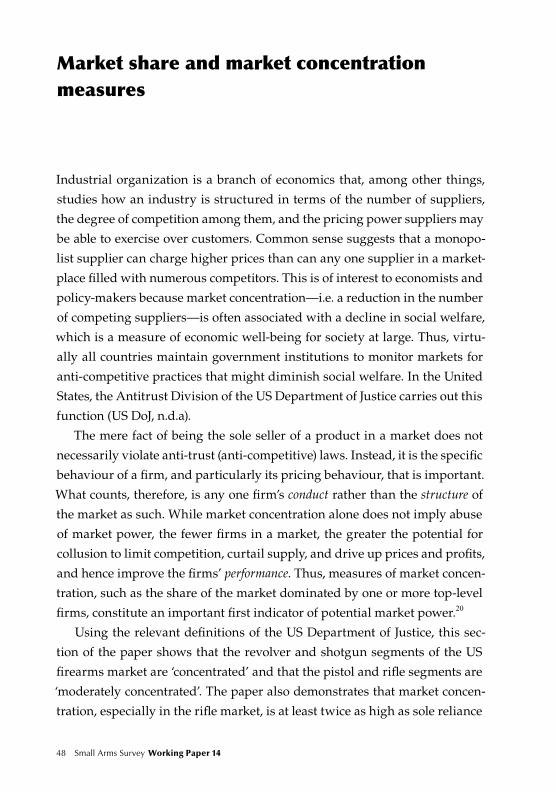
48 Small Arms Survey Working Paper 14 Brauer The US Firearms Industry: Production and Supply 49
Market share and market concentration measures
Industrial organization is a branch of economics that, among other things,
studies how an industry is structured in terms of the number of suppliers,
the degree of competition among them, and the pricing power suppliers may
be able to exercise over customers. Common sense suggests that a monopo-
list supplier can charge higher prices than can any one supplier in a market-
place filled with numerous competitors. This is of interest to economists and
policy-makers because market concentration—i.e. a reduction in the number
of competing suppliers—is often associated with a decline in social welfare,
which is a measure of economic well-being for society at large. Thus, virtu-
ally all countries maintain government institutions to monitor markets for
anti-competitive practices that might diminish social welfare. In the United
States, the Antitrust Division of the US Department of Justice carries out this
function (US DoJ, n.d.a).
The mere fact of being the sole seller of a product in a market does not
necessarily violate anti-trust (anti-competitive) laws. Instead, it is the specific
behaviour of a firm, and particularly its pricing behaviour, that is important.
What counts, therefore, is any one firm’s conduct rather than the structure of
the market as such. While market concentration alone does not imply abuse
of market power, the fewer firms in a market, the greater the potential for
collusion to limit competition, curtail supply, and drive up prices and profits,
and hence improve the firms’ performance. Thus, measures of market concen-
tration, such as the share of the market dominated by one or more top-level
firms, constitute an important first indicator of potential market power.20
Using the relevant definitions of the US Department of Justice, this sec-
tion of the paper shows that the revolver and shotgun segments of the US
firearms market are ‘concentrated’ and that the pistol and rifle segments are
‘moderately concentrated’. The paper also demonstrates that market concen-
tration, especially in the rifle market, is at least twice as high as sole reliance
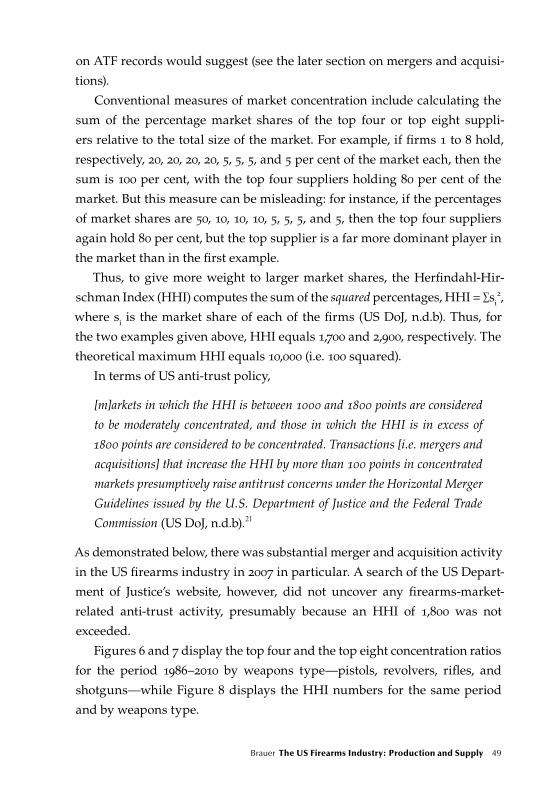
48 Small Arms Survey Working Paper 14 Brauer The US Firearms Industry: Production and Supply 49
on ATF records would suggest (see the later section on mergers and acquisi-
tions).
Conventional measures of market concentration include calculating the
sum of the percentage market shares of the top four or top eight suppli-
ers relative to the total size of the market. For example, if firms 1 to 8 hold,
respectively, 20, 20, 20, 20, 5, 5, 5, and 5 per cent of the market each, then the
sum is 100 per cent, with the top four suppliers holding 80 per cent of the
market. But this measure can be misleading: for instance, if the percentages
of market shares are 50, 10, 10, 10, 5, 5, 5, and 5, then the top four suppliers
again hold 80 per cent, but the top supplier is a far more dominant player in
the market than in the first example.
Thus, to give more weight to larger market shares, the Herfindahl-Hir-
schman Index (HHI) computes the sum of the squared percentages, HHI = ∑si2,
where si is the market share of each of the firms (US DoJ, n.d.b). Thus, for
the two examples given above, HHI equals 1,700 and 2,900, respectively. The
theoretical maximum HHI equals 10,000 (i.e. 100 squared).
In terms of US anti-trust policy,
[m]arkets in which the HHI is between 1000 and 1800 points are considered
to be moderately concentrated, and those in which the HHI is in excess of
1800 points are considered to be concentrated. Transactions [i.e. mergers and
acquisitions] that increase the HHI by more than 100 points in concentrated
markets presumptively raise antitrust concerns under the Horizontal Merger
Guidelines issued by the U.S. Department of Justice and the Federal Trade
Commission (US DoJ, n.d.b).21
As demonstrated below, there was substantial merger and acquisition activity
in the US firearms industry in 2007 in particular. A search of the US Depart-
ment of Justice’s website, however, did not uncover any firearms-market-
related anti-trust activity, presumably because an HHI of 1,800 was not
exceeded.
Figures 6 and 7 display the top four and the top eight concentration ratios
for the period 1986–2010 by weapons type—pistols, revolvers, rifles, and
shotguns—while Figure 8 displays the HHI numbers for the same period
and by weapons type.
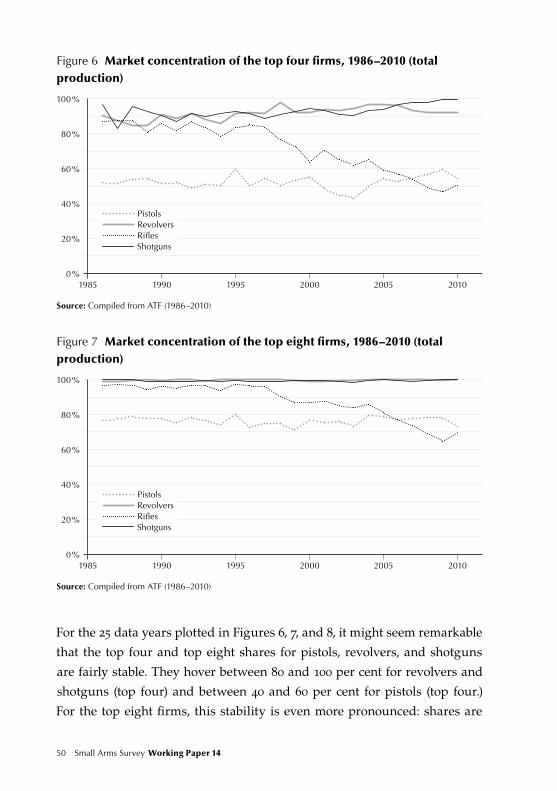
50 Small Arms Survey Working Paper 14 Brauer The US Firearms Industry: Production and Supply 51
For the 25 data years plotted in Figures 6, 7, and 8, it might seem remarkable
that the top four and top eight shares for pistols, revolvers, and shotguns
are fairly stable. They hover between 80 and 100 per cent for revolvers and
shotguns (top four) and between 40 and 60 per cent for pistols (top four.)
For the top eight firms, this stability is even more pronounced: shares are
Figure 6 Market concentration of the top four firms, 1986–2010 (total production)
40 %
20 %
100 %
80 %
60 %
0 %1985 1990 1995 2000 2005 2010
PistolsRevolversRiflesShotguns
Source: Compiled from ATF (1986–2010)
Figure 7 Market concentration of the top eight firms, 1986–2010 (total production)
40 %
20 %
100 %
80 %
60 %
0 %1985 1990 1995 2000 2005 2010
PistolsRevolversRiflesShotguns
Source: Compiled from ATF (1986–2010)
50 Small Arms Survey Working Paper 14 Brauer The US Firearms Industry: Production and Supply 51
virtually 100 per cent for revolvers and shotguns, and between 70 and 80
per cent for pistols. Moreover, since the early 2000s the shotgun market has
become markedly more concentrated. By 2010 two brands, Maverick and
Remington, held 91 per cent of the shotgun market. These two brands now
form a duopoly in this market.
An exception to this market concentration appears to occur in the rifle
market, in which the top four concentration ratio was above 80 per cent until
1997 and since then appears to have dropped to below 50 per cent by 2010.
In terms of the top eight rifle manufacturers, the percentage was above 90
per cent until 1997 and since then appears to have fallen to about 70 per cent.
This might suggest that the increasing number of firms in the rifle market
(see Figure A3) has contributed to competitive pressure and loss of market
concentration. This would appear to be corroborated by the number of rifles
produced by the top ten firms (Figure A10), a number that since the early
1990s has oscillated between 100,000 and 140,000 units, with an average of
about 120,000. Except for during the late 2000s, the total number of rifles
produced has oscillated around 1.3 million units, with no apparent upward
trend since the mid-1990s, certainly not in terms of units per 100,000 people.
The average for the period 1986–2010 comes to around 500 rifles per 100,000
(Figures A14 and A15). If the top rifle makers produce roughly the same
Figure 8 Market concentration, 1986–2010 (HHI)
4,000
2,000
10,000
8,000
6,000
01985 1990 1995 2000 2005 2010
Pistols HHIRevolvers HHIRifles HHIShotguns HHI
Source: Compiled from ATF (1986–2010)
52 Small Arms Survey Working Paper 14 Brauer The US Firearms Industry: Production and Supply 53
number of rifles, but the total number of rifle manufacturers increases, then
it follows that the market power of the top firms falls, which is what the ATF
numbers appear to show. But the number of firms has increased in the other firearms market seg-
ments as well, so this cannot be the whole explanation. In the mergers and
acquisitions section of this paper it will be shown that the rifle market is in
fact ‘moderately concentrated’, with the top (parent) firm holding 35.7 per
cent of the market in 2010 and the second firm holding another 12.9 per cent.
The HHI measures complement the top four and top eight concentration
measures. For example, in 2010 the revolver and shotgun markets are ‘con-
centrated’ with HHIs of 3,022 and 4,290, respectively. The pistol market has
oscillated around a near-competitive 1,000 for the entire 1986–2010 period.
The rifle market started at a ‘concentrated’ HHI of 2,454 in 1986 and since
then appears to have fallen to a rather competitive 793 in 2010. As noted, the
section on mergers and acquisitions will show that this is the result of a sta-
tistical anomaly and is due to the way in which the ATF collects and reports
data. Actual market concentration in the rifle market is far higher than ATF
data suggests. By themselves, the top two firms command a joint 50 per cent
of the market and their corresponding HHI alone equals 1,441 (i.e. 35.72 +
12.92) (for details, see Table 7).
52 Small Arms Survey Working Paper 14 Brauer The US Firearms Industry: Production and Supply 53
Rank order and market entry/exit (displace-ment) analysis
Based on the ATF dataset, this section examines entry into and exit from
the top ranks of the US non-military firearms market. With low capital and
other entry requirements, one would expect to see ease of market entry by
new firms, just as one would expect ease of market exit by underperforming
firms. Moreover, in a vibrant market one would expect that innovative, com-
petitive suppliers advance within the rank order of competitors, selling large
quantities of firearms, whereas not-so-nimble or less-efficient manufacturers
would be expected to lose favour with customers and fall in the rankings.
This section does find a considerable degree of market entry and exit, but
it also finds considerable stability in the ranks of top-level companies and,
by focusing on ownership rather than brands, finds instances where there is
less change than the ATF record might at first suggest.
Pistol manufacturers
Table A1 (placed in the Annexe because of its size) presents the top-20-ranked
FFL holders (‘firms’) among pistol manufacturers for each year of the 25-year
period from 1986 to 2010.
In 1986 the top-ranked producer was Raven Arms and the 20th-ranked
was Essex Arms Corp. One year later, in 1987, three firms had disappeared
from the top-20 record, i.e. three other firms displaced them by entering the
ranks of the top 20. These three firms—International Die Casting, Spring-
field, and AMAC—are listed in the shaded cells for the year 1987.
The bottom line of Table A1 lists for each year the number of top-20 dis-
placements (exits and, therefore, entries). In all, 69 firms are listed: 20 in the
original 1986 top-20 list and 49 since then. Re-entries are not double-counted.
For example, in 1988 Grendel ranked in 19th place, then dropped to 22nd (1989),
23rd (1990), and was again 23rd (1991), before re-entering the top 20 in 18th place
54 Small Arms Survey Working Paper 14 Brauer The US Firearms Industry: Production and Supply 55
in 1992, but it is counted only once. (However, if an existing top-20 firm
neglected to report data, for example Springfield in 2004, this would open up
a fictitious top-20 spot to be filled.)
Table A1 reflects underlying problems with ATF data. For example, Bryco
was ranked third in 2004 and then completely disappears from the record.
The reason for this is that the company went bankrupt due to a legal rul-
ing against it. But, as noted, it reopened under new ownership and a new
name (Jimenez Paul J) when Paul Jimenez, formerly a Bryco foreman, bought
Bryco’s assets. Jimenez ranked tenth in 2005.
Data problems notwithstanding, it appears that, of the original top 20 firms
in 1986, only 5 (25 per cent) survived to 2010 (Ruger, Colt’s Manufacturing,
Smith & Wesson, Beretta, and Arms Technology). Of these, the first four also
constituted part of the original top six and only one of them (Colt’s) has since
fallen on hard times, dropping steadily from fourth rank in 1986 to 16th in 2010.
The data also shows firms in ascendance. Beemiller entered the rankings
as number 12 in 1993, rose as high as third rank in 2003, and since then has
dropped to rank 9 in 2010. Cobra rose from rank 20 in 2001 to rank 8 in 2009
and to 15 in 2010. In contrast, Taurus entered the rankings as number 14 in
1993 and had stable rankings until 2010, when it moved up to fifth rank.
As a whole, the data for the pistol makers suggest that inter-rank mobil-
ity can be readily observed. Manufacturers cannot take their customers or
market position for granted. Firms do compete for business and companies
can fall out of favour with their customers. To stay ‘on top of the game’, deft
management would appear to be a necessary ingredient of firm survival in a
heavily cyclical, competitive market with domestic and foreign challengers
entering with relative ease.
Revolver manufacturers
The market top-20 entry/exit situation is somewhat different in the case
of revolvers. Table A2 (also in the Annexe) lists 117 companies reporting
revolver production. Smith & Wesson, Ruger, Colt’s Manufacturing, and
Freedom Arms are listed for all 25 years (forming 20 per cent of the original
54 Small Arms Survey Working Paper 14 Brauer The US Firearms Industry: Production and Supply 55
top 20 in 1986). The first two have consistently held the number 1 and 2 ranks
for all 25 years.
In 1992 and 1993 three companies appeared in the top 20 rankings that,
together with Smith & Wesson and Ruger, have developed into a remarkably
consistent oligopoly for revolver production, consistently holding ranks 1 to
5 since 2001. The additional three companies are Charco 2000, Heritage Man-
ufacturing, and North American Arms. Together, they are the only firms
each producing or having produced in the tens of thousands of revolvers
each year (category 4 firms in terms of Table 2).
Even in the case of revolvers, however, there is competitive movement.
Both Colt’s Manufacturing and Freedom Arms have consistently declin-
ing production (Colt’s from a high of nearly 53,000 revolvers in 1994 to just
2,086 in 2010; Freedom Arms from over 10,000 in 1987 to just 387 in 2010)
and have been eclipsed by several other firms in the rankings. The current
sixth-ranked firm, US Firearms Manufacturing, produced 12,007 revolvers
in 2010, whereas the fifth-ranked firm, Charco 2000, produced 24,789 units
in that year.
The top four firms have been virtually unchanged since 1996, when Her-
itage entered the fourth rank. Moreover, the top two, Smith & Wesson and
Ruger, have held the number 1 and 2 ranks since 1986, thus constituting a
clear case of a market-leading duopoly. In terms of Table 2 ratings, each of
these two firms is a category 5 producer (100,000 units per year).
Below rank 10, the revolver market amounts to small-scale production,
from category 0 (single digits) to category 2 (hundreds). Despite the initial
impression that Table A2 might convey, there is little relevant inter-rank
mobility in the revolver market. Instead, it is a top-level duopoly, followed
in a second tier by an oligopoly of a handful of companies. Market entry is
easy as such, but evidently it is far from easy to break into the top tier. Of
note, however, is that two prominent pistol manufacturers recently reported
revolver production as well. They are Magnum Research since 2005—but
bought by Kahr Arms in 2010 (Kahr Arms, 2010)—and Cobra Enterprises
since 2009. It remains to be seen if there is an attempt here to reap economies
of scope based on the general strength of the brands.
56 Small Arms Survey Working Paper 14 Brauer The US Firearms Industry: Production and Supply 57
Rifle manufacturers
Regarding rifle production (Table A3), several firms have continuously occu-
pied the top 20 positions over the 25-year period. These firms include Marlin,
Ruger, Remington, and Savage, usually the first- to fourth-ranked firms in
each of the past ten years. They also include Thompson Center and Spring-
field, which occasionally have wandered into the top 20 positions. Another
firm, US Repeating Arms, is formerly the producer of the Winchester rifle
brand, under licence from the trademark holder, Olin Corp., and usually
ranked in fourth or fifth place. It last appeared in the record in rank 6 in
2005, with 88,743 units produced. In 2006 Olin signed up with a new trade-
mark licensee, Browning of Morgan, Utah, itself a subsidiary of FN Herstal,
Belgium, but neither Browning nor FN Herstal reported civilian rifle produc-
tion to the ATF in 2006, 2007, or 2008. Instead, FN Herstal’s US manufacturing
branch in Columbia, South Carolina, called FN Manufacturing, first began
to report civilian rifle production of 5,038 units in 2008, and then 21,878 and
19,816 units in 2009 and 2010, respectively. This is where the Winchester
Model 70 rifle is now manufactured.22
The top-20 listing for the rifle market is particularly difficult to decipher.
From 2007 onwards, for example, the Marlin, Remington, H&R 1871, Bush-
master, and DPMS Firearms brands all belonged to a single company, Free-
dom Group. Likewise, Smith & Wesson Holding acquired Thompson Center
Arms, and then entered the top-20 rifle rankings only in 2007. Thompson
Center’s ranking then declined, while Smith & Wesson’s increased, perhaps
an indication that the Thompson Center brand is gradually being absorbed.
O. F. Mossberg, primarily known as a shotgun producer, acquired Mav-
erick and rebranded itself under the latter’s name. Thus, Mossberg dropped
out of a respectable rifle ranking (11th in 2007), to be replaced by a seemingly
‘new’ Maverick (ninth in 2008 and 2009, and seventh in 2010).
A focus on brands rather than ownership therefore distorts an under-
standing of entry and exit in rifle production. While the very top ranks
appear stable among just four brands, below the top tier there is an illusion of
considerable entry and exit. As reflected in the declining top four, top eight,
and HHI scores in Figures 6, 7, and 8, respectively, competition in the rifle
56 Small Arms Survey Working Paper 14 Brauer The US Firearms Industry: Production and Supply 57
market appears to have increased. However, the rifle market is less competi-
tive when viewed in terms of ownership rather than brands. An additional
interesting aspect of the rifle market is that in recent years a number of tradi-
tional pistol makers have entered the market, including the aforementioned
Smith & Wesson, but also Kel-Tec, Kimber Manufacturing, Saeilo (maker of
Kahr pistols), and Sig Sauer. Thus, there is movement between and among
traditional rifle brands and segment entry by pistol producers.
Shotgun manufacturers
Regarding the shotgun market (Table A4), O. F. Mossberg and Maverick now
operate jointly under the Maverick brand name (but Mossberg ownership),
so it might be treated as a continuous operation across all 25 years in the
dataset. Similarly, Remington, Ruger, and Savage are in the record for the
entire time period (although with the latter not reporting in 2010). In the
same way as for rifles, US Repeating Arms (i.e. the Winchester brand) was
in the record through 2005 (with 30,517 units) and then was brought under
the Browning/FN (Herstal) Manufacturing licence. It appears, however, that
the shotguns are now manufactured in Belgium and then imported into the
United States, in which case they would not be recorded by the ATF.
When examining production volume rather than ranks, one finds that
only three firms ever produced in the category 5 range (hundreds of thou-
sands of shotguns annually; see Table 2): they are Mossberg/Maverick, Rem-
ington, and H&R 1871 (now, together with Remington, part of Freedom
Group). Other firms that are top ranked, such as Savage and Ruger, produce
in the very low thousands (category 3), with annual production of around
1,000–1,500 shotguns. When Beretta started shotgun production in the
United States in 2002 its production was just 333 shotguns. This increased to
7,553 shotguns by 2004 and was 5,191 by 2010. Currently the shotgun market
is a clear duopoly (Maverick and Remington).
58 Small Arms Survey Working Paper 14 Brauer The US Firearms Industry: Production and Supply 59
Mergers and acquisitions in the US firearms industry
In 2007 US-based Cerberus Capital Management LP, a private equity firm,
bought an 80.1 per cent equity interest in the automobile maker Chrysler
from DaimlerChrysler. In that year Cerberus started out on a route that led
it to also become the country’s largest firearms maker. The maze of corpo-
rate entities involved is complex. Cerberus created an entity called American
Heritage Arms LLC (later, American Heritage Arms Inc.). In turn, American
Heritage Arms bought 100 per cent of an entity called RACI Holding Inc.,
which in turn owned 100 per cent of Remington Arms Co. Inc. Subsequently,
towards the end of 2007, Cerberus announced that its new Remington unit
had acquired Marlin Firearms Co. and its facilities in North Haven, Con-
necticut, and Gardner, Maine. The deal was formally closed on 31 January
2008.23 In 2007 Cerberus also bought Bushmaster Firearms of Windham,
Maine, a prominent producer of military-style AR-15 and M16 rifles, and
DPMS Panther Arms of St. Cloud, Minnesota, also a well-respected maker
of the AR-15 and M16-style rifles. Furthermore, in 2007 Bushmaster in turn
acquired Cobb Manufacturing of Dallas, Georgia, a manufacturer of tacti-
cal rifles, and announced the formation of a joint venture with Iron Brigade
Armory Ltd., which would later be branded Bushmaster Custom Shop by
Iron Brigade, located in Jacksonville, North Carolina.
Assembled into an entity called Freedom Group Inc., all of these prop-
erties were readied for sale via a public share offering. This happened on
20 October 2009, when Freedom Group filed a registration statement with
the US Securities and Exchange Commission (SEC). But then on 1 April 2011
Freedom Group filed a registration withdrawal request. Apparently the com-
pany is to remain private after all (US SEC, n.d.).
Since then, Freedom Group has acquired other brands. On 5 June 2009 it
closed a deal to acquire Dakota Arms, a shotgun maker, which also includes
the Nesika Bay Precision, Miller Arms, and Dan Walter brands, while retaining
58 Small Arms Survey Working Paper 14 Brauer The US Firearms Industry: Production and Supply 59
Remington’s military and ammunition divisions (Freedom Group, 2010).
Also in 2009, Freedom Group bought EOTAC, a ‘tactical apparel’ manufac-
turer located in West Columbia, South Carolina, and Advanced Armaments
Group of Lawrenceville/Norcross, Georgia, a maker of military-grade
ammunition. Freedom Group also owns INTC, another military-grade
ammunition maker, and Barnes Bullets LLC was acquired in 2009 as well.
The group also purchased a 75 per cent stake in Mountain Khakis, another
apparel maker. (Remington itself, incidentally, introduced another ammu-
nition brand, UMC, when Cerberus acquired the firm.) Freedom Group,
through Remington, has an extensive line of military and law enforcement
products and sales. Freedom Group’s objective is to produce firearms and
ammunition in the military, law enforcement, private security, and civilian
markets, both domestically and abroad. On its website it mentions sales in
over 80 countries (Freedom Group, n.d.). The firm is branching into pistol
production as well, in part via a new Freedom Group subsidiary established
in 2008 called E-RPC LLC, which markets and distributes the Remington
M1911 pistol. Further, in early 2012 Freedom Group announced the purchase
of Para USA, a pistol maker appearing in the ATF record for the first time
only in 2009 (Shooting Industry, 2012, p. 8).
In addition to horizontal integration (acquiring firms in the same line of
business) and further expansion into complementary products (ammunition
and apparel), Freedom Group also undertook a modicum of vertical integra-
tion (acquiring suppliers or distributors). On 22 September 2009 it acquired
S&K Industries Inc., a wooden-gunstock manufacturing concern located in
Lexington, Lafayette County, Missouri (near Kansas City) (Freedom Group,
2010, p. 14). This company produced gunstocks for a number of the major
firearms manufacturers in the country, including for Remington since 1986.
It is unclear whether, following its acquisition, S&K Industries still produces
for customers outside of the Freedom Group family. What is certain (via
a manager profile posted on LinkedIn) is that, upon acquisition, Reming-
ton’s H&R-brand wood-gunstock production was moved to the former S&K
Industries (see Jackson, n.d.). In addition, Freedom Group has a division that
produces firearms metal components. Clearly, Cerberus/Freedom Group has
implemented an elaborate strategy of broad-spectrum asset acquisition and
60 Small Arms Survey Working Paper 14 Brauer The US Firearms Industry: Production and Supply 61
consolidation. On its website it now refers to itself as the ‘Largest Manufac-
turer of Commercial Firearms and Ammunition’ (see Freedom Group, n.d.).
The acquisitions of Bushmaster and DPMS in particular signal that Cer-
berus/Freedom Group might aim not only to dominate the civilian rifle mar-
ket, but perhaps also to break into the military rifle market, currently led by
Colt’s Defense of West Hartford, Connecticut, and FN Herstal’s US subsidiary,
FN Manufacturing, of Columbia, South Carolina. Cerberus/Freedom Group
literature prominently states that it hopes to regain military market share
from companies headquartered in foreign countries (Freedom Group, 2010,
p. 4 and repeated throughout the document). Arguably, this is about as con-
vincing as Ford or General Motors wishing to reclaim market share from
Toyota or Honda just because the former are headquartered in the United
States and the latter in Japan. In the end, it is not marketing ambitions but
costs, prices, and profits that count. Unsurprisingly, then, Freedom Group
has already begun to move manufacturing sites around. Marlin’s facility in
Gardner, Maine, is now closed; its North Haven, Connecticut, plant was to
close by June 2011. Remington’s UMC ammunition factory in Bridgeport,
Connecticut is also designated for closure. Upon acquisition, Barnes Bul-
lets was relocated to Mona, Utah. Freedom Group is also beginning to con-
solidate—or at least to streamline—acquired brands. The L. C. Smith and
New England Firearms brands, for example, are being phased out. Freedom
Group also sold its target shooting business and associated facilities that it
owned in Ada, Oklahoma, and Findlay, Ohio.
In all, Freedom Group now appears to operate at least 14 facilities with
over 3,000 employees and net sales of about USD 550 million and USD 650
million in 2010 and 2009, respectively (Freedom Group, n.d.). Identified as
the controlling entity in the 20 October 2009 SEC filing, at the time of writing
Cerberus is still the controlling entity of Freedom Group.
Industry consolidation did not end with the Cerberus–Freedom Group
acquisitions. On 3 January 2007 handgun maker Smith & Wesson Holding
Corp. acquired the rifle maker Thompson/Center Arms (Smith & Wesson,
2007). US Repeating Arms, formerly the maker of the Winchester rifle mod-
els under trademark licence from Olin Corp., was closed and a new licence
agreement concluded with Browning, a division of FN Herstal. Keystone
60 Small Arms Survey Working Paper 14 Brauer The US Firearms Industry: Production and Supply 61
Sporting Arms Inc. of Milton, Pennsylvania, the producer of the Davey
Crickett rifles (specifically marketed to children to encourage interest in the
shooting sports), took over the Chipmunk product line from Rogue Rifle Co.
This company then closed down.24 O. F. Mossberg acquired Maverick Arms
and now operates under the Maverick brand name.
Following a wave of lawsuits in the late 1990s and early 2000s, Colt’s Man-
ufacturing struck an agreement regarding firearms safety with the outgo-
ing Clinton administration. Subsequently Colt suffered a severe customer
backlash, as a consequence of which the company split in 2002 into Colt’s
Manufacturing and Colt Defense.25 The latter then replaced the former in the
civilian rifle rankings while keeping its military rifle line. Both Colt’s Manu-
facturing and Colt Defense seem no longer to produce civilian shotguns, but
the former remains in the civilian revolver business, while struggling in the
civilian pistol market.
Argus Publications Inc. was the licensee for the Henry Repeating Rifle. In
2009, when primary ownership changed from father to son, this became the
licensee Henry RAC Holding Inc., retaining the former Argus’s fifth rank.
While there is no complete public data on overall US firearms produc-
tion (commercial and military), one can nonetheless gain a sense of the mar-
ket power that Freedom Group has acquired. Using 2010 ATF data, it would
appear that the firm holds more than a one-third share of the overall unit
sales of rifles, nearly three times its nearest competitor, Ruger (see Table 7).
Regarding pistol manufacturers, Beemiller, Haskell, and Iberia, each spe-
cializing in different calibre pistols, all appear on the January 2010 FFL list
with the business name of Hi-Point Firearms, which gives that entity the
number 9, 19, and 21 ranks in pistol manufacturing—a combined 5.7 per cent
market share, or fifth rank, in 2010. Kahr Arms acquired Auto-Ordnance in
1999. Kahr also produces under the licence names Saeilo Inc. and SMI-MA
Inc.; Saeilo is ranked tenth in the pistol rankings for 2010. (Auto-Ordnance
disappeared from the ATF list after 1999.) In 2010 Saeilo/Kahr Arms acquired
Magnum Research and thus gained entry into the large-calibre segment of
the handgun market.
Saeilo/Kahr Arms presents an interesting story because of its complex
web of cross-ownerships. From an undated court document (CoM, n.d.)
62 Small Arms Survey Working Paper 14 Brauer The US Firearms Industry: Production and Supply 63
of a lawsuit filed against Kahr Arms, but evidently drawn up in the early
2000s, defendants are listed as follows (using the court document’s spell-
ings and capitalizations): KAHR INC., D/B/A; KAHR ARMS, INC.; KAHR
AUTO ORDNANCE CORP.; SAEILO, INC.; SAEILO MACHINERY MA, INC.;
SAEILO MACHINERY USA, INC.; SAEILO MANUFACTURING INDUS-
TRIES; MACHINE INDUSTRIES, INC.; SAEILO EQUITY HOLDINGS, LLP;
and ONE UP ENTERPRISES, INC., the last one being the business arm of the
Unification Church. The son of the church’s founder is the founder, designer,
and lead shareholder of Kahr Arms.
Numerous other examples of merger and acquisition activity could be
cited, but not systematically and quantitatively. This is because the vast
majority of firms are privately held and there is no unified public record
to draw on. Nonetheless, it appears clear that in the late 2000s substantial
merger and acquisition activity took place and that a number of companies
took measures to reposition themselves in the market. There is evidence of
horizontal integration not only within product categories (i.e. pistols or rifles),
but also across product categories and, evidently, an attempt by Cerberus/
Freedom Group to position itself for both the military market and the civil-
ian, law enforcement, and private security markets. In addition, virtually
all of the major firms have branched into production and sales of firearms
parts and accessories, and even into clothing for articles such as T-shirts and
hats. Savage Arms, a leading rifle maker, has branched into the ownership
of shooting ranges.
If it were possible to trace accurately underlying ownership rather than
FFL licence holders, the various segments in the firearms market would turn
out to be more concentrated than they already are.
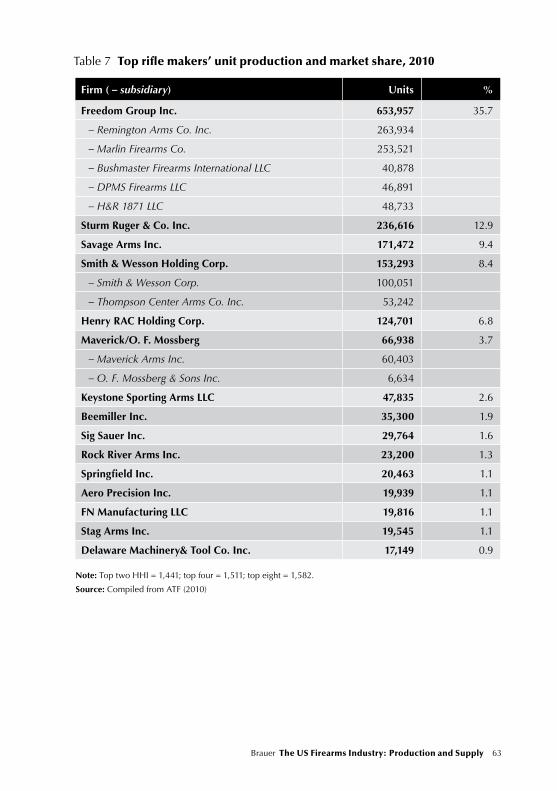
62 Small Arms Survey Working Paper 14 Brauer The US Firearms Industry: Production and Supply 63
Table 7 Top rifle makers’ unit production and market share, 2010
Firm ( – subsidiary) Units %
Freedom Group Inc. 653,957 35.7
– Remington Arms Co. Inc. 263,934
– Marlin Firearms Co. 253,521
– Bushmaster Firearms International LLC 40,878
– DPMS Firearms LLC 46,891
– H&R 1871 LLC 48,733
Sturm Ruger & Co. Inc. 236,616 12.9
Savage Arms Inc. 171,472 9.4
Smith & Wesson Holding Corp. 153,293 8.4
– Smith & Wesson Corp. 100,051
– Thompson Center Arms Co. Inc. 53,242
Henry RAC Holding Corp. 124,701 6.8
Maverick/O. F. Mossberg 66,938 3.7
– Maverick Arms Inc. 60,403
– O. F. Mossberg & Sons Inc. 6,634
Keystone Sporting Arms LLC 47,835 2.6
Beemiller Inc. 35,300 1.9
Sig Sauer Inc. 29,764 1.6
Rock River Arms Inc. 23,200 1.3
Springfield Inc. 20,463 1.1
Aero Precision Inc. 19,939 1.1
FN Manufacturing LLC 19,816 1.1
Stag Arms Inc. 19,545 1.1
Delaware Machinery& Tool Co. Inc. 17,149 0.9
Note: Top two HHI = 1,441; top four = 1,511; top eight = 1,582.
Source: Compiled from ATF (2010)
64 Small Arms Survey Working Paper 14 Brauer The US Firearms Industry: Production and Supply 65
Summary and conclusions
This working paper has considered some economic aspects of the US non-
military firearms industry, i.e. pistols, revolvers, rifles, and shotguns for the
civilian, private security, and law enforcement markets. Drawing mainly
on detailed data for the period 1986–2010 obtained from the ATF, it mostly
examines aspects of the supply side of the market, particularly the numbers
of firms, and their production and sales volumes. Industry-wide informa-
tion on prices, costs, investments, financials, and other relevant factors is not
readily available and currently hampers a fuller, more complete analysis of
the economics of the firearms market.
The paper identifies 2,288 distinct reporting entities (‘firms’), roughly
three-quarters of which produce in only one of the four product categories
(pistols, revolvers, rifles, or shotguns). Only 26 firms have produced in all
market segments, and only a further 67 in three of the four segments. About
two-thirds of the 2,288 firms reported small-scale production of fewer than
100 firearms per year. Overall, however, the paper traces the production of
more than 98 million firearms produced and retained in the United States
between 1986 and 2010, and identifies three firms that each have produced
ten million or more firearms since 1986 (category 7 firms; see Table 2), for a
total of about 41 per cent of all firearms produced. The paper also approxi-
mates the underreporting of firearms production in the order of 320,000
weapons since 2001.
The production of new, domestically produced weapons is highly cycli-
cal, oscillating between three million and 5.5 million firearms per year since
1980. Production cycles are especially pronounced in the pistol segment.
Analysing data for 1999–2010 from the FBI, the paper also estimates US fire-
arms demand. It suggests that demand for firearms held steady at between
seven and eight million weapons per year, albeit with a seemingly unusual
increase to about ten million firearms in 2009 and 2010. The paper further
reports on an import/export dataset and finds that imports of firearms have
64 Small Arms Survey Working Paper 14 Brauer The US Firearms Industry: Production and Supply 65
been rising continuously since the early 1980s, reaching well over three mil-
lion units in 2010. It is suggested that, of the overall volume of the firearms
trade (but excluding trade not requiring an FFL), on the order of 75 per cent is
serviced by new domestically produced and imported new and used weap-
ons. The other 25 per cent consists of sales of used firearms that re-enter
the supply chain, for instance via pawnshops and consignment sales. (These
numbers in particular are to be interpreted as no more than a first marker
against which future studies could orient themselves.)
While there is a fair degree of entry into and exit from the firearms
market, it is clear that market leaders have firmly established themselves in
every market segment, sometimes in long-lasting stable duopolies. The pistol
market in particular has been thoroughly penetrated by non-US brands. An
analysis of recent merger and acquisition activity reveals ownership con-
centration—especially in the rifle market—far beyond what an analysis of
ATF data suggests. In particular, it was found that in 2010 a single parent
company controlled five major rifle brands that in turn held more than one-
third of the rifle market and about three times the market share of its nearest
competitor. Finally, the paper paid thorough attention to a detailed under-
standing of the data on which its findings are based.
Many opportunities exist to enhance data collection in order to advance
the economic analysis of the industry. An effort could be made to obtain
detailed firearms production data from before 1986. One can also go back
further in time with regard to Customs or USCB firearms import and export
data. To confirm the supply-side numbers produced in this report from
another direction, an attempt might be made to obtain federal firearms and
ammunition excise tax records. From these one might be able to deduce the
dollar wholesale market value of the US firearms trade. (Tax records should
go back to fiscal year 1920, when the firearms and ammunition excise tax was
first collected.) The National Shooting Sports Foundation—a trade associa-
tion—has done some of this research, but this is proprietary and not in the
public domain. An initial check with the agency that currently collects this
data—the Alcohol and Tobacco Tax and Trade Bureau of the US Department
of the Treasury—suggests that considerable caution needs to be applied in
the use of this data.
66 Small Arms Survey Working Paper 14 Brauer The US Firearms Industry: Production and Supply 67
The importance of assembling data covering many years lies in its poten-
tial use in time-series econometrics, e.g. for business cycle analysis. In addi-
tion, the manufacturing establishment location information contained in the
FFL and ATF data can be used to conduct studies in spatial econometrics or
in GIS-based studies of how firms’ location decisions respond to changes in
federal, state, and local firearms laws and regulation, and other changes in
the economic environment (e.g. unionization, improved transportation infra-
structure, etc.). An initial exploration employing spatial data—not reported
here—suggests, for example, distinct geographic clustering of firearms man-
ufacturing activity both in the United States and abroad. This holds for both
contemporary and historical data going back to the late 1700s.
Financial data lodged with the SEC can be obtained for the very few fire-
arms manufacturers that are—or at one point in time were—publicly held
corporations (e.g. Ruger, Remington, and Smith & Wesson). For any given
financial year this might permit one to extract such economically important
data as production costs or levels of research and development expenditure,
and investments in plant, property, and equipment. This data might also per-
mit one to compute an average price per weapon sold (sales revenue divided
by quantities sold). Assuming competitive pricing, one then might combine
this with the ATF’s information on quantities produced across all firearms
manufacturers, estimate an overall firearms dollar market value, and com-
pare this number to the number derived from the excise tax records or with
the USCB’s NAICS reports (NAICS 332994: ‘Small Arms Manufacturing’) or
to estimates made by the industry itself. Additional industry information
is likely to be contained in court documents. For example, an initial search
of the LexisNexis database using the keywords ‘firearm’ and ‘manufacturer’
listed 55 cases. Finally, data on military firearms production and sales can
possibly be acquired via US Department of Defense procurement records.
This data could be important, as some companies may well cross-subsidize
their civilian market efforts with research and development coming off their
military contracts. Further, it may be useful to search company registration
records state by state in order to identify ownership and cross-ownership
holdings and patterns.
66 Small Arms Survey Working Paper 14 Brauer The US Firearms Industry: Production and Supply 67
Finally, in terms of industrial economics, it appears that the US ammuni-
tion industry—the single most important complement to the firearms indus-
try—is very differently organized. But there are at least cursory indications
of some degree of ownership overlap between firearms and ammunition
companies. As noted in the main text, the Cerberus/Freedom Group, for
example, owns several ammunition manufacturers, as does the Winchester
brand. Studying complementarities between these two industries should be
of interest.
In sum, it is likely that a great deal of information is in fact available that
may be used to enhance our understanding of the economics of the US fire-
arms industry.
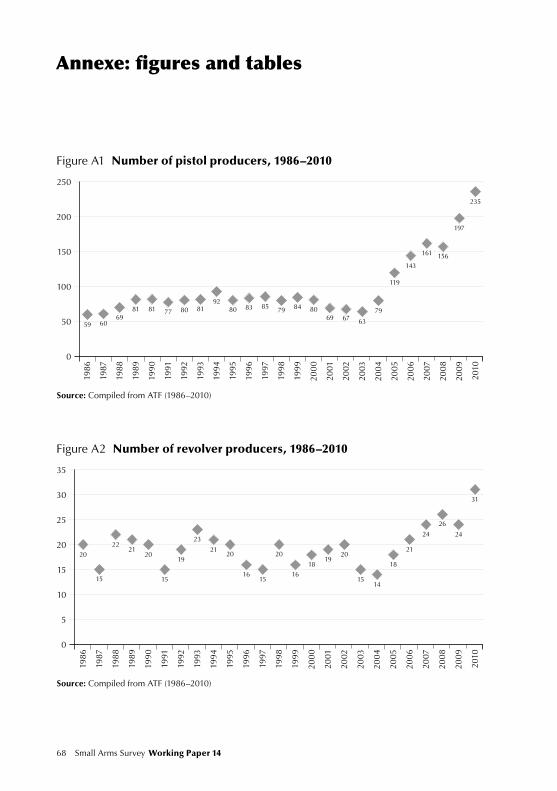
68 Small Arms Survey Working Paper 14 Brauer The US Firearms Industry: Production and Supply 69
Annexe: figures and tables
Figure A1 Number of pistol producers, 1986–2010
2010
200
150
250
100
50
0
1992
1986
1993
1987
1994
1988
1995
1989
1996
1990
1997
1991
1998
1999
2000
2001
2002
2003
2004
2005
2006
2007
2008
2009
59 6069
81 81 77 80 8192
80 83 85 79 84 8069 67 63
79
119
143
161 156
197
235
Source: Compiled from ATF (1986–2010)
Figure A2 Number of revolver producers, 1986–2010
2010
20
15
35
30
25
10
5
0
1992
1986
1993
1987
1994
1988
1995
1989
1996
1990
1997
1991
1998
1999
2000
2001
2002
2003
2004
2005
2006
2007
2008
2009
20
15
2221
20
15
19
23
2120
1615
16
1819
20
1514
18
21
24
26
24
31
20
Source: Compiled from ATF (1986–2010)
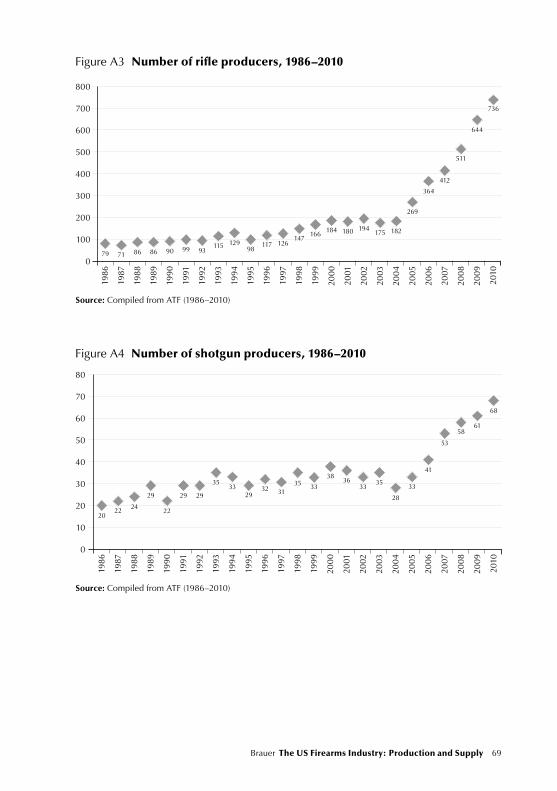
68 Small Arms Survey Working Paper 14 Brauer The US Firearms Industry: Production and Supply 69
Figure A3 Number of rifle producers, 1986–2010
2010
400
300
800
700
600
500
200
100
0
1992
1986
1993
1987
1994
1988
1995
1989
1996
1990
1997
1991
1998
1999
2000
2001
2002
2003
2004
2005
2006
2007
2008
2009
79 71 86 86 90 99 93115 129
98117 126
147166
184 180 194175 182
269
364
412
511
644
736
Source: Compiled from ATF (1986–2010)
Figure A4 Number of shotgun producers, 1986–2010
2010
40
30
80
70
60
50
20
10
0
1992
1986
1993
1987
1994
1988
1995
1989
1996
1990
1997
1991
1998
1999
2000
2001
2002
2003
2004
2005
2006
2007
2008
2009
2022 24
29
22
29 29
3533
2932 31
33
3836
3335
28
33
41
53
5861
68
35
Source: Compiled from ATF (1986–2010)
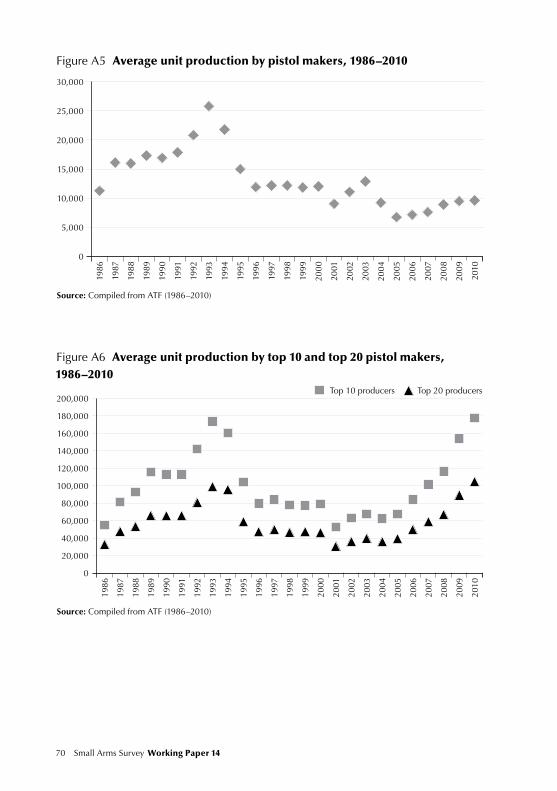
70 Small Arms Survey Working Paper 14 Brauer The US Firearms Industry: Production and Supply 71
Figure A5 Average unit production by pistol makers, 1986–2010
2010
20,000
15,000
30,000
25,000
10,000
5,000
0
1992
1986
1993
1987
1994
1988
1995
1989
1996
1990
1997
1991
1998
1999
2000
2001
2002
2003
2004
2005
2006
2007
2008
2009
Source: Compiled from ATF (1986–2010)
Figure A6 Average unit production by top 10 and top 20 pistol makers, 1986–2010
2010
80,000
60,000
200,000
180,000
160,000
140,000
120,000
100,000
40,000
20,000
0
1992
1986
1993
1987
1994
1988
1995
1989
1996
1990
1997
1991
1998
1999
2000
2001
2002
2003
2004
2005
2006
2007
2008
2009
Top 10 producers Top 20 producers
Source: Compiled from ATF (1986–2010)
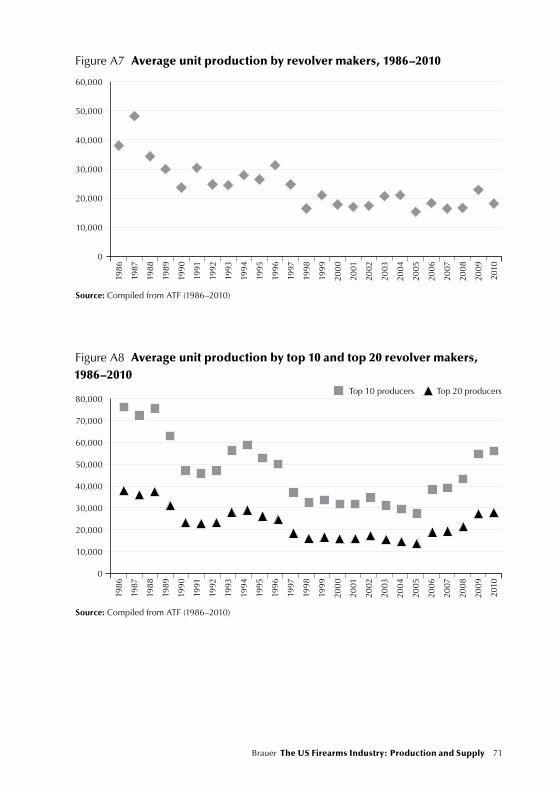
70 Small Arms Survey Working Paper 14 Brauer The US Firearms Industry: Production and Supply 71
Figure A7 Average unit production by revolver makers, 1986–2010
2010
40,000
30,000
60,000
50,000
20,000
10,000
0
1992
1986
1993
1987
1994
1988
1995
1989
1996
1990
1997
1991
1998
1999
2000
2001
2002
2003
2004
2005
2006
2007
2008
2009
Source: Compiled from ATF (1986–2010)
Figure A8 Average unit production by top 10 and top 20 revolver makers, 1986–2010
2010
40,000
30,000
80,000
70,000
60,000
50,000
20,000
10,000
0
1992
1986
1993
1987
1994
1988
1995
1989
1996
1990
1997
1991
1998
1999
2000
2001
2002
2003
2004
2005
2006
2007
2008
2009
Top 10 producers Top 20 producers
Source: Compiled from ATF (1986–2010)
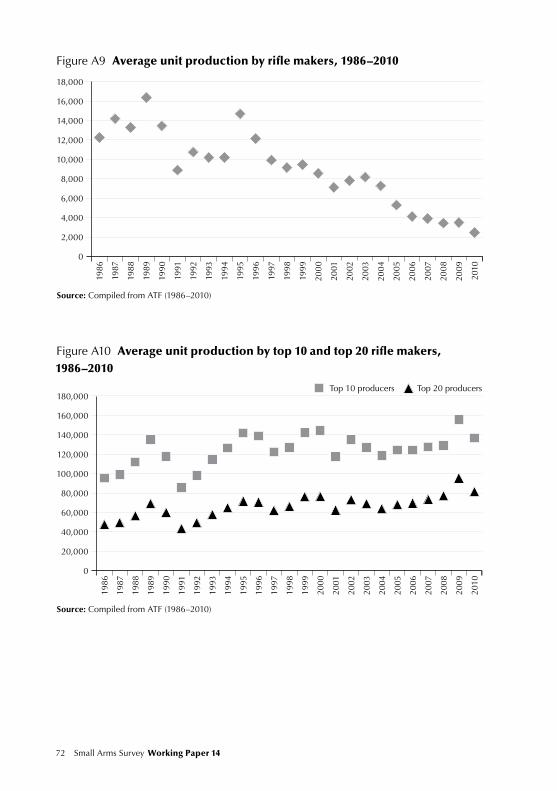
72 Small Arms Survey Working Paper 14 Brauer The US Firearms Industry: Production and Supply 73
Figure A9 Average unit production by rifle makers, 1986–2010
2010
8,000
6,000
18,000
16,000
14,000
12,000
10,000
4,000
2,000
0
1992
1986
1993
1987
1994
1988
1995
1989
1996
1990
1997
1991
1998
1999
2000
2001
2002
2003
2004
2005
2006
2007
2008
2009
Source: Compiled from ATF (1986–2010)
Figure A10 Average unit production by top 10 and top 20 rifle makers, 1986–2010
2010
80,000
60,000
180,000
160,000
140,000
120,000
100,000
40,000
20,000
0
1992
1986
1993
1987
1994
1988
1995
1989
1996
1990
1997
1991
1998
1999
2000
2001
2002
2003
2004
2005
2006
2007
2008
2009
Top 10 producers Top 20 producers
Source: Compiled from ATF (1986–2010)
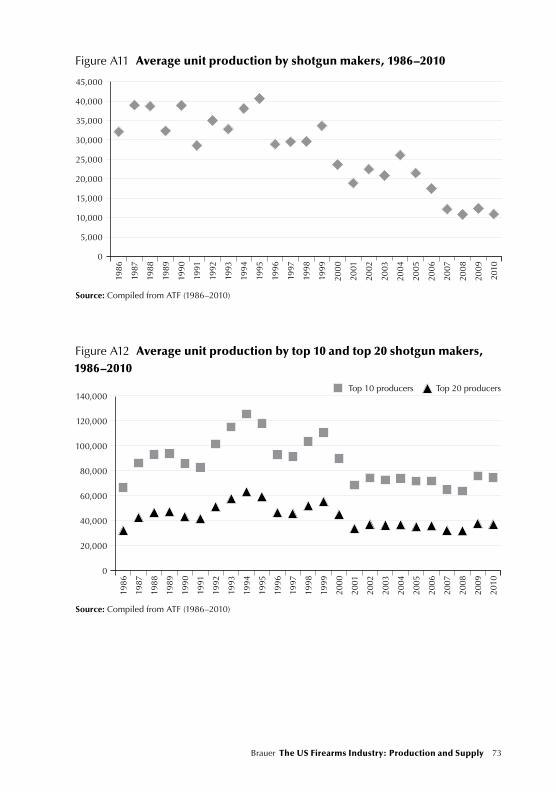
72 Small Arms Survey Working Paper 14 Brauer The US Firearms Industry: Production and Supply 73
Figure A11 Average unit production by shotgun makers, 1986–2010
2010
20,000
15,000
45,000
40,000
35,000
30,000
25,000
10,000
5,000
0
1992
1986
1993
1987
1994
1988
1995
1989
1996
1990
1997
1991
1998
1999
2000
2001
2002
2003
2004
2005
2006
2007
2008
2009
Source: Compiled from ATF (1986–2010)
Figure A12 Average unit production by top 10 and top 20 shotgun makers, 1986–2010
2010
80,000
60,000
140,000
120,000
100,000
40,000
20,000
0
1992
1986
1993
1987
1994
1988
1995
1989
1996
1990
1997
1991
1998
1999
2000
2001
2002
2003
2004
2005
2006
2007
2008
2009
Top 10 producers Top 20 producers
Source: Compiled from ATF (1986–2010)
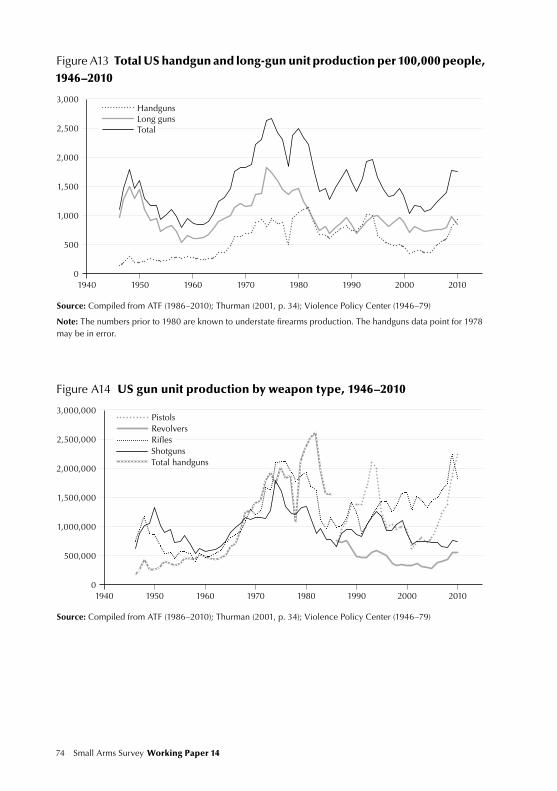
74 Small Arms Survey Working Paper 14 Brauer The US Firearms Industry: Production and Supply 75
Figure A13 Total US handgun and long-gun unit production per 100,000 people, 1946–2010
2,000
1,500
3,000
2,500
1,000
500
01940 1950 1960 1970 1980 1990 2000 2010
HandgunsLong gunsTotal
Source: Compiled from ATF (1986–2010); Thurman (2001, p. 34); Violence Policy Center (1946–79)
Note: The numbers prior to 1980 are known to understate firearms production. The handguns data point for 1978 may be in error.
Figure A14 US gun unit production by weapon type, 1946–2010
2,000,000
1,500,000
3,000,000
2,500,000
1,000,000
500,000
01940 1950 1960 1970 1980 1990 2000 2010
PistolsRevolversRiflesShotgunsTotal handguns
Source: Compiled from ATF (1986–2010); Thurman (2001, p. 34); Violence Policy Center (1946–79)
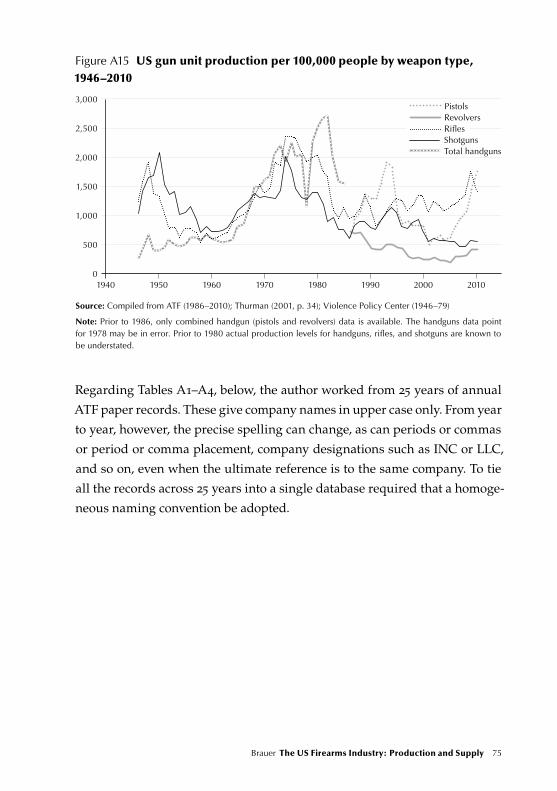
74 Small Arms Survey Working Paper 14 Brauer The US Firearms Industry: Production and Supply 75
Figure A15 US gun unit production per 100,000 people by weapon type, 1946–2010
2,000
1,500
3,000
2,500
1,000
500
01940 1950 1960 1970 1980 1990 2000 2010
PistolsRevolversRiflesShotgunsTotal handguns
Source: Compiled from ATF (1986–2010); Thurman (2001, p. 34); Violence Policy Center (1946–79)
Note: Prior to 1986, only combined handgun (pistols and revolvers) data is available. The handguns data point for 1978 may be in error. Prior to 1980 actual production levels for handguns, rifles, and shotguns are known to be understated.
Regarding Tables A1–A4, below, the author worked from 25 years of annual
ATF paper records. These give company names in upper case only. From year
to year, however, the precise spelling can change, as can periods or commas
or period or comma placement, company designations such as INC or LLC,
and so on, even when the ultimate reference is to the same company. To tie
all the records across 25 years into a single database required that a homoge-
neous naming convention be adopted.
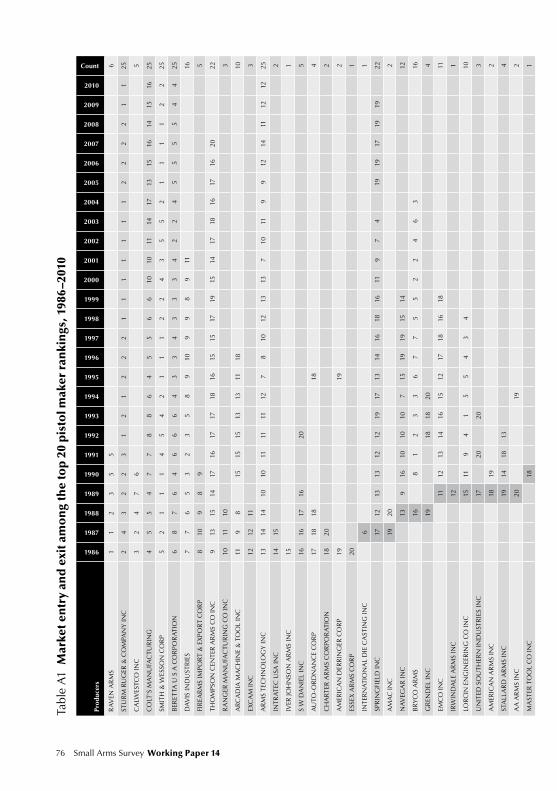
76 Small Arms Survey Working Paper 14 Brauer The US Firearms Industry: Production and Supply 77
Tabl
e A
1 M
arke
t en
try
and
exi
t am
on
g th
e to
p 2
0 p
isto
l mak
er r
anki
ngs
, 198
6–20
10
Prod
ucer
s
1986
1987
1988
1989
1990
1991
1992
1993
1994
1995
1996
1997
1998
1999
2000
2001
2002
2003
2004
2005
2006
2007
2008
2009
2010
Count
RA
VEN
AR
MS
11
23
55
6
STU
RM
RU
GER
& C
OM
PAN
Y IN
C2
43
22
31
21
22
21
11
11
11
22
22
11
25
CA
LWES
TCO
INC
32
47
65
CO
LT'S
MA
NU
FAC
TUR
ING
45
54
77
88
64
55
66
1010
1114
1713
1516
1415
1625
SMIT
H &
WES
SON
CO
RP
52
11
14
54
21
11
22
43
55
21
11
12
225
BER
ETTA
U S
A C
OR
POR
ATI
ON
68
76
46
66
43
34
33
34
22
45
55
54
425
DA
VIS
IND
UST
RIE
S7
76
53
23
58
910
99
89
1116
FIR
EAR
MS
IMPO
RT
& E
XPO
RT
CO
RP
810
98
95
THO
MPS
ON
CEN
TER
AR
MS
CO
INC
913
1514
1716
1717
1816
1515
1719
1514
1718
1617
1620
22
RA
NG
ER M
AN
UFA
CTU
RIN
G C
O IN
C10
1110
3
AR
CA
DIA
MA
CH
INE
& T
OO
L IN
C11
98
1515
1513
1311
1810
EXC
AM
INC
1212
113
AR
MS
TEC
HN
OLO
GY
INC
1314
1410
1011
1111
127
810
1213
137
1011
99
1214
1112
1225
INTR
ATE
C U
SA IN
C14
152
IVER
JOH
NSO
N A
RM
S IN
C15
1
S W
DA
NIE
L IN
C16
1617
1620
5
AU
TO-O
RD
NA
NC
E C
OR
P17
1818
184
CH
AR
TER
AR
MS
CO
RPO
RA
TIO
N18
202
AM
ERIC
AN
DER
RIN
GER
CO
RP
1919
2
ESSE
X A
RM
S C
OR
P20
1
INTE
RN
ATI
ON
AL
DIE
CA
STIN
G IN
C6
1
SPR
ING
FIEL
D IN
C17
1213
1312
1219
1713
1416
1816
119
74
1919
1719
1922
AM
AC
INC
1920
2
NA
VEG
AR
INC
139
1610
1010
715
1919
1514
12
BR
YCO
AR
MS
168
12
33
67
75
52
24
63
16
GR
END
EL IN
C19
1818
204
EMC
O IN
C11
1213
1416
1512
1718
1618
11
IRW
IND
ALE
AR
MS
INC
121
LOR
CIN
EN
GIN
EER
ING
CO
INC
1511
94
15
54
34
10
UN
ITED
SO
UTH
ERN
IND
UST
RIE
S IN
C17
2020
3
AM
ERIC
AN
AR
MS
INC
1819
2
STA
LLA
RD
AR
MS
INC
1914
1813
4
AA
AR
MS
INC
2019
2
MA
STER
TO
OL
CO
INC
181
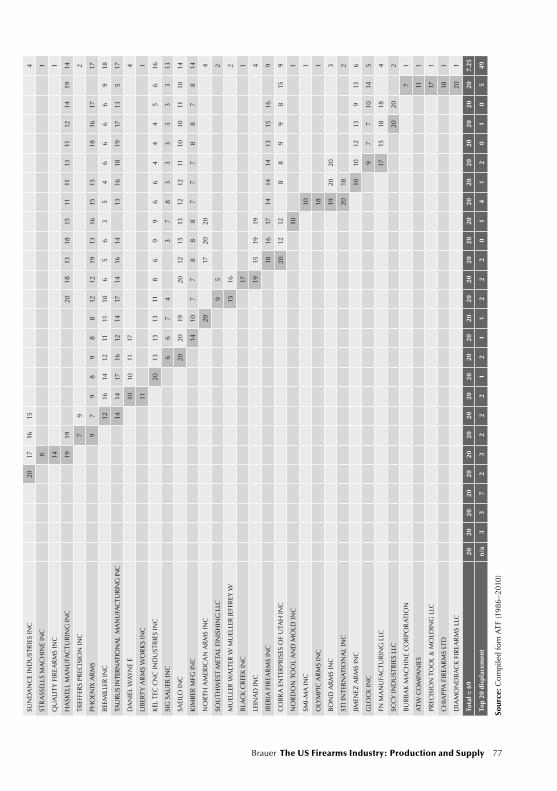
76 Small Arms Survey Working Paper 14 Brauer The US Firearms Industry: Production and Supply 77
SUN
DA
NC
E IN
DU
STR
IES
INC
2017
1615
4
STR
ASS
ELLS
MA
CH
INE
INC
81
QU
ALI
TY
FIR
EAR
MS
INC
141
HA
SKEL
L M
AN
UFA
CTU
RIN
G IN
C19
1920
1813
1815
1111
1311
1214
1914
TREF
FER
S PR
ECIS
ION
INC
79
2
PHO
ENIX
AR
MS
97
98
98
812
1219
1316
1515
1816
1717
BEE
MIL
LER
INC
1216
1412
1111
106
56
35
46
66
69
18
TAU
RUS
INTE
RNAT
ION
AL
MA
NU
FAC
TURI
NG
INC
14
1417
1612
1417
1416
1413
1618
1917
135
17
DA
NIE
L W
AY
NE
E10
1011
174
LIB
ERT
Y A
RM
S W
OR
KS
INC
111
KEL
TEC
CN
C IN
DU
STR
IES
INC
2013
1313
118
69
96
64
44
56
16
SIG
SA
UER
INC
66
74
37
83
33
33
313
SAEI
LO IN
C20
2019
2012
1513
1212
1110
1011
1014
KIM
BER
MFG
INC
1410
77
88
87
77
88
78
14
NO
RTH
AM
ERIC
AN
AR
MS
INC
2017
2020
4
SOU
THW
EST
MET
AL
FIN
ISH
ING
LLC
95
2
MU
ELLE
R W
ALT
ER W
MU
ELLE
R JE
FFR
EY W
1516
2
BLA
CK
CR
EEK
INC
171
LEIN
AD
INC
1915
1919
4
IBER
IA F
IREA
RM
S IN
C18
1617
1414
1413
1516
9
CO
BR
A E
NTE
RPR
ISES
OF
UTA
H IN
C20
1212
88
99
815
9
NO
RD
ON
TO
OL
AN
D M
OLD
INC
101
SMI-
MA
INC
101
OLY
MPI
C A
RM
S IN
C18
1
BO
ND
AR
MS
INC
1920
203
STI I
NTE
RN
ATI
ON
AL
INC
2018
2
JIMEN
EZ A
RM
S IN
C10
1012
139
136
GLO
CK
INC
97
710
145
FN M
AN
UFA
CTU
RIN
G L
LC17
1518
184
SCC
Y IN
DU
STR
IES
LLC
2020
2
BU
RB
AK
MA
CH
INE
CO
RPO
RA
TIO
N7
1
AT
W C
OM
PAN
IES
111
PREC
ISIO
N T
OO
L &
MO
LDIN
G L
LC17
1
CH
IAPP
A F
IREA
RM
S LT
D18
1
DIA
MO
ND
BA
CK
FIR
EAR
MS
LLC
201
Tota
l = 6
920
2020
2020
2020
2020
2020
2020
2020
2020
2020
2020
2020
2020
7.25
Top
20 d
ispl
acem
ent
n/a
33
72
32
22
12
11
22
20
14
12
01
05
49
Sour
ce: C
ompi
led
fom
ATF
(198
6–2
010)
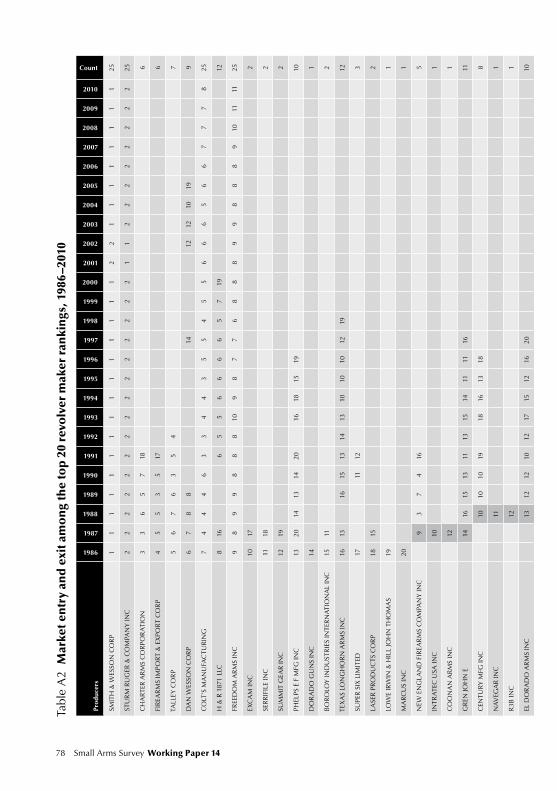
78 Small Arms Survey Working Paper 14 Brauer The US Firearms Industry: Production and Supply 79
Tabl
e A
2 M
arke
t en
try
and
exi
t am
on
g th
e to
p 2
0 re
volv
er m
aker
ran
kin
gs, 1
986–
2010
Prod
ucer
s
1986
1987
1988
1989
1990
1991
1992
1993
1994
1995
1996
1997
1998
1999
2000
2001
2002
2003
2004
2005
2006
2007
2008
2009
2010
Count
SMIT
H &
WES
SON
CO
RP
11
11
11
11
11
11
11
12
21
11
11
11
125
STU
RM
RU
GER
& C
OM
PAN
Y IN
C2
22
22
22
22
22
22
22
11
22
22
22
22
25
CH
AR
TER
AR
MS
CO
RPO
RA
TIO
N3
36
57
186
FIR
EAR
MS
IMPO
RT
& E
XPO
RT
CO
RP
45
53
517
6
TALL
EY C
OR
P5
67
63
54
7
DA
N W
ESSO
N C
OR
P6
78
814
1212
1019
9
CO
LT’S
MA
NU
FAC
TUR
ING
74
44
63
34
43
55
45
56
66
56
67
77
825
H &
R 1
871
LLC
816
65
56
66
65
719
12
FREE
DO
M A
RM
S IN
C9
89
98
88
109
87
76
88
89
98
88
910
1111
25
EXC
AM
INC
1017
2
SER
RIF
ILE
INC
1118
2
SUM
MIT
GEA
R IN
C12
192
PHEL
PS E
F M
FG IN
C13
2014
1314
2016
1815
1910
DO
RA
DO
GU
NS
INC
141
BO
RO
LOY
IND
UST
RIE
S IN
TER
NA
TIO
NA
L IN
C15
112
TEX
AS
LON
GH
OR
N A
RM
S IN
C16
1316
1513
1413
1010
1012
1912
SUPE
R S
IX L
IMIT
ED17
1112
3
LASE
R P
RO
DU
CTS
CO
RP
1815
2
LOW
E IR
WIN
& H
ILL
JOH
N T
HO
MA
S19
1
MA
RC
US
INC
201
NEW
EN
GLA
ND
FIR
EAR
MS
CO
MPA
NY
INC
93
74
165
INTR
ATE
C U
SA IN
C10
1
CO
ON
AN
AR
MS
INC
121
GR
EN JO
HN
E14
1615
1311
1315
1411
1116
11
CEN
TUR
Y M
FG IN
C10
1010
1918
1613
188
NA
VEG
AR
INC
111
R3B
INC
121
EL D
OR
AD
O A
RM
S IN
C13
1212
1012
1715
1216
2010
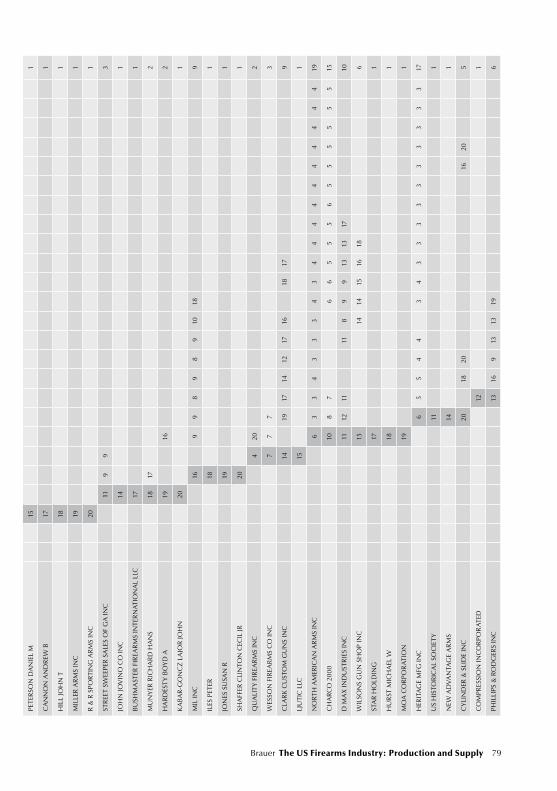
78 Small Arms Survey Working Paper 14 Brauer The US Firearms Industry: Production and Supply 79
PETE
RSO
N D
AN
IEL
M15
1
CA
NN
ON
AN
DR
EW B
171
HIL
L JO
HN
T18
1
MIL
LER
AR
MS
INC
191
R &
R S
POR
TIN
G A
RM
S IN
C20
1
STR
EET
SWEE
PER
SA
LES
OF
GA
INC
119
93
JOH
N JO
VIN
O C
O IN
C14
1
BU
SHM
AST
ER F
IREA
RM
S IN
TER
NA
TIO
NA
L LL
C17
1
MU
NY
ER R
ICH
AR
D H
AN
S18
172
HA
RD
EST
Y B
OY
D A
1916
2
KA
BA
R-G
ON
CZ
LA
JOR
JOH
N20
1
MIL
INC
169
98
98
910
189
ILES
PET
ER18
1
JON
ES S
USA
N R
191
SHA
FFER
CLI
NTO
N C
ECIL
JR20
1
QU
ALI
TY
FIR
EAR
MS
INC
420
2
WES
SON
FIR
EAR
MS
CO
INC
77
73
CLA
RK
CU
STO
M G
UN
S IN
C14
1917
1412
1716
1817
9
LJU
TIC
LLC
151
NO
RTH
AM
ERIC
AN
AR
MS
INC
63
34
33
34
34
44
44
44
44
419
CH
AR
CO
200
010
87
66
55
56
55
55
55
15
D M
AX
IND
UST
RIE
S IN
C11
1211
118
99
1313
1710
WIL
SON
S G
UN
SH
OP
INC
1514
1415
1618
6
STA
R H
OLD
ING
171
HU
RST
MIC
HA
EL W
181
MO
A C
OR
POR
ATI
ON
191
HER
ITA
GE
MFG
INC
65
54
43
43
33
33
33
33
317
US
HIS
TOR
ICA
L SO
CIE
TY
111
NEW
AD
VA
NTA
GE
AR
MS
141
CY
LIN
DER
& S
LID
E IN
C20
1820
1620
5
CO
MPR
ESSI
ON
INC
OR
POR
ATE
D12
1
PHIL
LIPS
& R
OD
GER
S IN
C13
169
1313
196
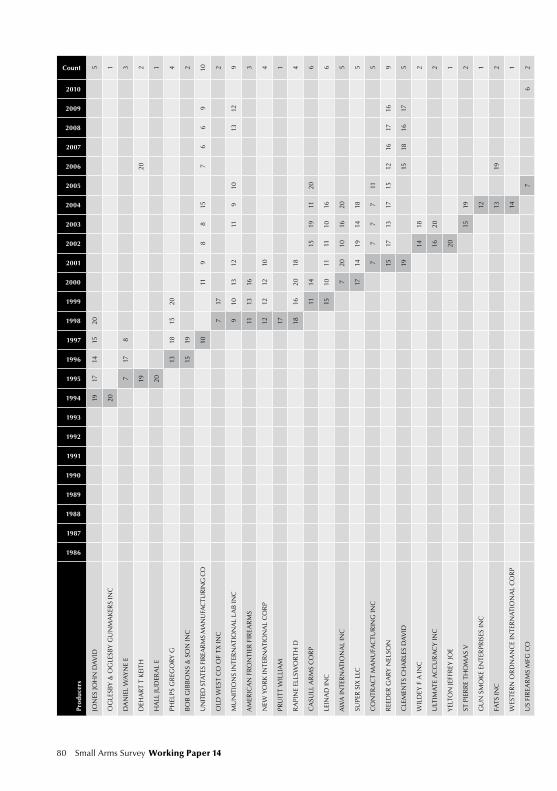
80 Small Arms Survey Working Paper 14 Brauer The US Firearms Industry: Production and Supply 81
Prod
ucer
s
1986
1987
1988
1989
1990
1991
1992
1993
1994
1995
1996
1997
1998
1999
2000
2001
2002
2003
2004
2005
2006
2007
2008
2009
2010
Count
JON
ES JO
HN
DA
VID
1917
1415
205
OG
LESB
Y &
OG
LESB
Y G
UN
MA
KER
S IN
C20
1
DA
NIE
L W
AY
NE
E7
178
3
DEH
AR
T T
KEI
TH19
202
HA
LL JU
DER
AL
E20
1
PHEL
PS G
REG
OR
Y G
1318
1520
4
BO
B G
IBB
ON
S &
SO
N IN
C15
192
UN
ITED
STA
TES
FIRE
AR
MS
MA
NU
FAC
TURI
NG
CO
1011
98
815
76
69
10
OLD
WES
T C
O O
F TX
INC
717
2
MU
NIT
ION
S IN
TER
NA
TIO
NA
L LA
B IN
C9
1013
1211
910
1312
9
AM
ERIC
AN
FR
ON
TIER
FIR
EAR
MS
1113
163
NEW
YO
RK
INTE
RN
ATI
ON
AL
CO
RP
1212
1210
4
PRU
ITT
WIL
LIA
M17
1
RA
PIN
E EL
LSW
OR
TH D
1816
2018
4
CA
SULL
AR
MS
CO
RP
1114
1519
1120
6
LEIN
AD
INC
1510
1111
1016
6
AW
A IN
TER
NA
TIO
NA
L IN
C7
2010
1620
5
SUPE
R S
IX L
LC17
1419
1418
5
CO
NTR
AC
T M
AN
UFA
CTU
RIN
G IN
C7
77
711
5
REE
DER
GA
RY
NEL
SON
1517
1317
1512
1617
169
CLE
MEN
TS C
HA
RLE
S D
AV
ID19
1518
1617
5
WIL
DEY
F A
INC
1418
2
ULT
IMA
TE A
CC
UR
AC
Y IN
C16
202
YEL
TON
JEFF
REY
JOE
201
ST P
IER
RE
THO
MA
S V
1519
2
GU
N S
MO
KE
ENTE
RPR
ISES
INC
121
FATS
INC
1319
2
WES
TER
N O
RD
NA
NC
E IN
TER
NA
TIO
NA
L C
OR
P14
1
US
FIR
EAR
MS
MFG
CO
76
2
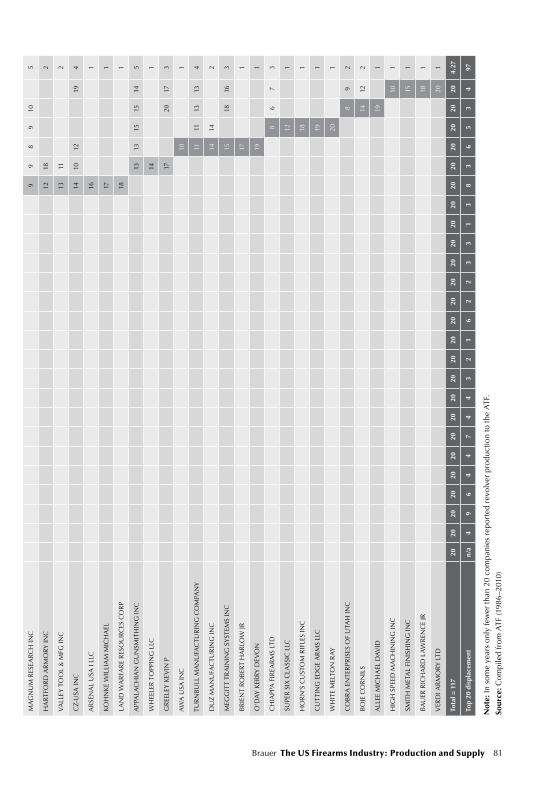
80 Small Arms Survey Working Paper 14 Brauer The US Firearms Industry: Production and Supply 81
MA
GN
UM
RES
EAR
CH
INC
99
89
105
HA
RTF
OR
D A
RM
OR
Y IN
C12
182
VA
LLEY
TO
OL
& M
FG IN
C13
112
CZ-
USA
INC
1410
1219
4
AR
SEN
AL
USA
I LL
C16
1
KOH
NK
E W
ILLI
AM
MIC
HA
EL17
1
LAN
D W
AR
FAR
E R
ESO
UR
CES
CO
RP
181
APP
ALA
CH
IAN
GU
NSM
ITH
ING
INC
1313
1515
145
WH
EELE
R T
OPP
ING
LLC
141
GR
EELE
Y K
EVIN
P17
2017
3
AW
A U
SA IN
C10
1
TUR
NB
ULL
MA
NU
FAC
TUR
ING
CO
MPA
NY
1111
1313
4
DU
Z M
AN
UFA
CTU
RIN
G IN
C14
142
MEG
GIT
T TR
AIN
ING
SY
STEM
S IN
C15
1816
3
BR
IEN
T R
OB
ERT
HA
RLO
W JR
171
O’D
AY
KER
RY
DEV
ON
191
CH
IAPP
A F
IREA
RM
S LT
D8
67
3
SUPE
R S
IX C
LASS
IC L
LC12
1
HO
RN
’S C
UST
OM
RIF
LES
INC
181
CU
TTI
NG
ED
GE
AR
MS
LLC
191
WH
ITE
MEL
TON
RA
Y20
1
CO
BR
A E
NTE
RPR
ISES
OF
UTA
H IN
C8
92
BO
JE C
OR
NIL
S14
122
ALL
EE M
ICH
AEL
DA
VID
191
HIG
H S
PEED
MA
CH
ININ
G IN
C10
1
SMIT
H M
ETA
L FI
NIS
HIN
G IN
C15
1
BA
UER
RIC
HA
RD
LA
WR
ENC
E JR
181
VER
DI A
RM
OR
Y L
TD
20
1
Tota
l = 1
1720
2020
2020
2020
2020
2020
2020
2020
2020
2020
2020
2020
2020
4.27
Top
20 d
ispl
acem
ent
n/a
49
64
47
44
32
16
22
33
13
83
65
34
97
Not
e: In
som
e ye
ars
only
few
er th
an 2
0 co
mpa
nies
rep
orte
d re
volv
er p
rodu
ctio
n to
the
ATF
.
Sour
ce: C
ompi
led
from
ATF
(198
6–2
010)
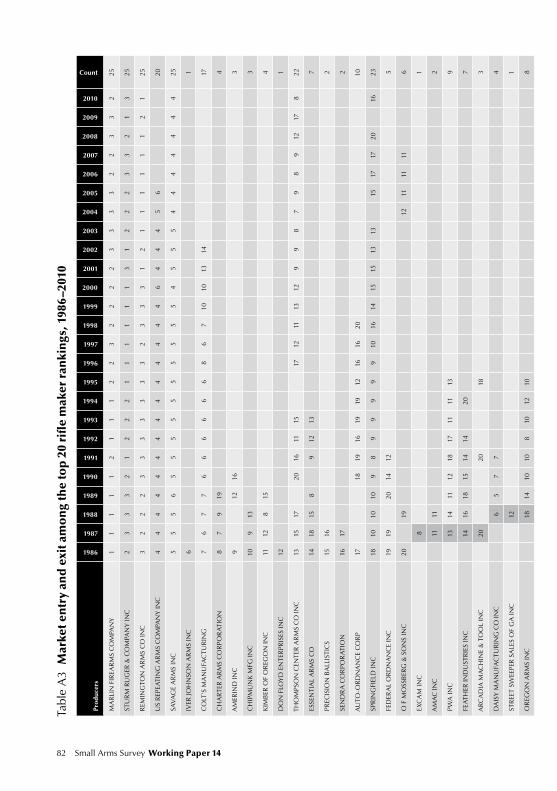
82 Small Arms Survey Working Paper 14 Brauer The US Firearms Industry: Production and Supply 83
Tabl
e A
3 M
arke
t en
try
and
exi
t am
on
g th
e to
p 2
0 ri
fle
mak
er r
anki
ngs
, 198
6–20
10
Prod
ucer
s
1986
1987
1988
1989
1990
1991
1992
1993
1994
1995
1996
1997
1998
1999
2000
2001
2002
2003
2004
2005
2006
2007
2008
2009
2010
Count
MA
RLI
N F
IREA
RM
S C
OM
PAN
Y1
11
11
21
11
22
32
22
23
33
32
23
32
25
STU
RM
RU
GER
& C
OM
PAN
Y IN
C2
33
32
12
22
11
11
11
31
22
23
32
13
25
REM
ING
TON
AR
MS
CO
INC
32
22
33
33
33
32
33
31
21
11
11
12
125
US
REP
EATI
NG
AR
MS
CO
MPA
NY
INC
44
44
44
44
44
44
44
64
44
56
20
SAV
AG
E A
RM
S IN
C5
55
65
55
55
55
55
54
55
54
44
44
44
25
IVER
JOH
NSO
N A
RM
S IN
C6
1
CO
LT’S
MA
NU
FAC
TUR
ING
76
77
66
66
66
86
710
1013
1417
CH
AR
TER
AR
MS
CO
RPO
RA
TIO
N8
79
194
AM
ERIN
D IN
C9
1216
3
CH
IPM
UN
K M
FG IN
C10
913
3
KIM
BER
OF
OR
EGO
N IN
C11
128
154
DO
N F
LOY
D E
NTE
RPR
ISES
INC
121
THO
MPS
ON
CEN
TER
AR
MS
CO
INC
1315
1720
1611
1517
1211
1312
99
87
98
912
178
22
ESSE
NTI
AL
AR
MS
CO
1418
158
912
137
PREC
ISIO
N B
ALL
ISTI
CS
1516
2
SEN
DR
A C
OR
POR
ATI
ON
1617
2
AU
TO-O
RD
NA
NC
E C
OR
P17
1819
1619
1912
1616
2010
SPR
ING
FIEL
D IN
C18
1010
109
89
99
99
1016
1415
1513
1315
1717
2016
23
FED
ERA
L O
RD
NA
NC
E IN
C19
1920
1412
5
O F
MO
SSB
ERG
& S
ON
S IN
C20
1912
1111
116
EXC
AM
INC
81
AM
AC
INC
1111
2
PWA
INC
1314
1112
1817
1111
139
FEA
THER
IND
UST
RIE
S IN
C14
1618
1514
1420
7
AR
CA
DIA
MA
CH
INE
& T
OO
L IN
C20
2018
3
DA
ISY
MA
NU
FAC
TUR
ING
CO
INC
65
77
4
STR
EET
SWEE
PER
SA
LES
OF
GA
INC
121
OR
EGO
N A
RM
S IN
C18
1410
108
1012
108
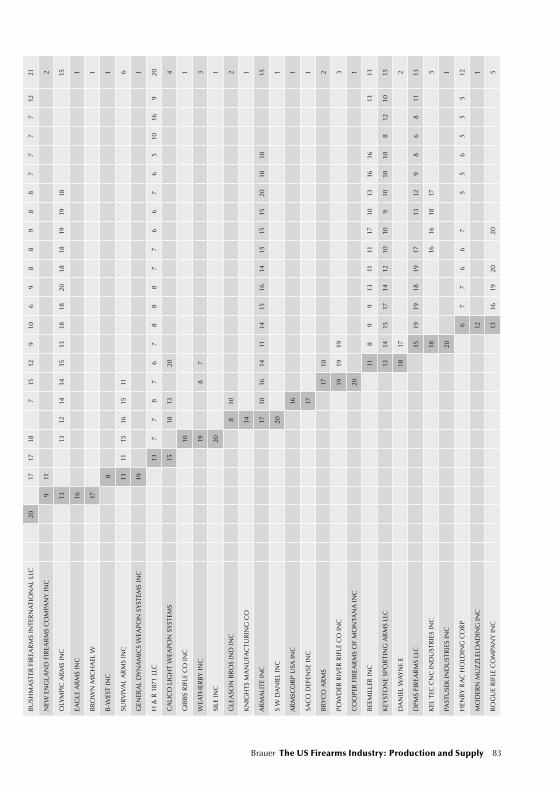
82 Small Arms Survey Working Paper 14 Brauer The US Firearms Industry: Production and Supply 83
BU
SHM
AST
ER F
IREA
RM
S IN
TER
NA
TIO
NA
L LL
C20
1717
187
1512
910
69
88
98
87
77
712
21
NEW
EN
GLA
ND
FIR
EAR
MS
CO
MPA
NY
INC
911
2
OLY
MPI
C A
RM
S IN
C13
1312
1414
1513
1818
2018
1819
1918
15
EAG
LE A
RM
S IN
C16
1
BR
OW
N M
ICH
AEL
W17
1
B-W
EST
INC
81
SUR
VIV
AL
AR
MS
INC
1311
1516
1511
6
GEN
ERA
L D
YN
AM
ICS
WEA
PON
SY
STEM
S IN
C19
1
H &
R 1
871
LLC
137
78
76
78
88
77
66
76
510
169
20
CA
LIC
O L
IGH
T W
EAPO
N S
YST
EMS
1518
1320
4
GIB
BS
RIF
LE C
O IN
C10
1
WEA
THER
BY
INC
198
73
SILE
INC
201
GLE
ASO
N B
RO
S IN
D IN
C8
102
KN
IGH
TS M
AN
UFA
CTU
RIN
G C
O14
1
AR
MA
LITE
INC
1718
1614
1114
1516
1415
1515
2018
1815
S W
DA
NIE
L IN
C20
1
AR
MSC
OR
P U
SA IN
C16
1
SAC
O D
EFEN
SE IN
C17
1
BR
YCO
AR
MS
1710
2
POW
DER
RIV
ER R
IFLE
CO
INC
1919
193
CO
OPE
R F
IREA
RM
S O
F M
ON
TAN
A IN
C20
1
BEE
MIL
LER
INC
118
99
1311
1117
1013
1616
1313
KEY
STO
NE
SPO
RTI
NG
AR
MS
LLC
1314
1517
1412
1010
910
1010
812
1015
DA
NIE
L W
AY
NE
E18
172
DPM
S FI
REA
RM
S LL
C15
1919
1819
1713
129
86
811
13
KEL
TEC
CN
C IN
DU
STR
IES
INC
1816
1618
175
PAST
USE
K IN
DU
STR
IES
INC
201
HEN
RY
RA
C H
OLD
ING
CO
RP
67
76
67
55
65
55
12
MO
DER
N M
UZ
ZLE
LOA
DIN
G IN
C12
1
RO
GU
E R
IFLE
CO
MPA
NY
INC
1316
1920
205
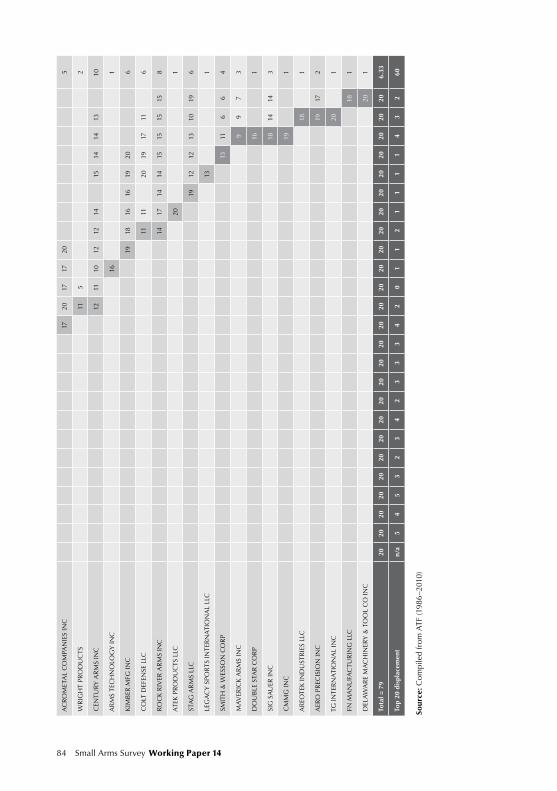
84 Small Arms Survey Working Paper 14 Brauer The US Firearms Industry: Production and Supply 85
AC
RO
MET
AL
CO
MPA
NIE
S IN
C17
2017
1720
5
WR
IGH
T PR
OD
UC
TS11
52
CEN
TUR
Y A
RM
S IN
C12
1110
1212
1415
1414
1310
AR
MS
TEC
HN
OLO
GY
INC
161
KIM
BER
MFG
INC
1918
1616
1920
6
CO
LT D
EFEN
SE L
LC11
1120
1917
116
RO
CK
RIV
ER A
RM
S IN
C14
1714
1415
1515
158
ATE
K P
RO
DU
CTS
LLC
201
STA
G A
RM
S LL
C19
1212
1310
196
LEG
AC
Y S
POR
TS IN
TER
NA
TIO
NA
L LL
C13
1
SMIT
H &
WES
SON
CO
RP
1311
66
4
MA
VER
ICK
AR
MS
INC
99
73
DO
UB
LE S
TAR
CO
RP
161
SIG
SA
UER
INC
1814
143
CM
MG
INC
191
AR
EOTE
K IN
DU
STR
IES
LLC
181
AER
O P
REC
ISIO
N IN
C19
172
TG IN
TER
NA
TIO
NA
L IN
C20
1
FN M
AN
UFA
CTU
RIN
G L
LC18
1
DEL
AW
AR
E M
AC
HIN
ERY
& T
OO
L C
O IN
C
20
1
Tota
l = 7
920
2020
2020
2020
2020
2020
2020
2020
2020
2020
2020
2020
2020
6.33
Top
20 d
ispl
acem
ent
n/a
54
53
23
42
33
34
20
11
21
11
14
32
60
Sour
ce: C
ompi
led
from
ATF
(198
6–2
010)
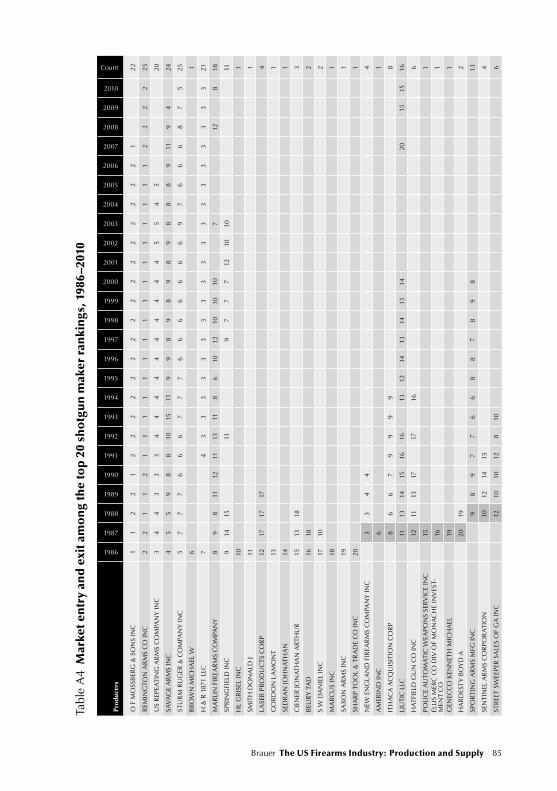
84 Small Arms Survey Working Paper 14 Brauer The US Firearms Industry: Production and Supply 85
Tabl
e A
4 M
arke
t en
try
and
exi
t am
on
g th
e to
p 2
0 sh
otg
un
mak
er r
anki
ngs
, 198
6–20
10
Prod
ucer
s
1986
1987
1988
1989
1990
1991
1992
1993
1994
1995
1996
1997
1998
1999
2000
2001
2002
2003
2004
2005
2006
2007
2008
2009
2010
Count
O F
MO
SSB
ERG
& S
ON
S IN
C1
12
21
22
22
22
22
22
22
22
22
122
REM
ING
TON
AR
MS
CO
INC
22
11
21
11
11
11
11
11
11
11
12
22
225
US
REP
EATI
NG
AR
MS
CO
MPA
NY
INC
34
43
33
44
44
44
44
44
55
45
20
SAV
AG
E A
RM
S IN
C4
55
98
810
1511
99
89
89
89
88
89
119
424
STU
RM
RU
GER
& C
OM
PAN
Y IN
C5
77
76
66
77
76
66
66
66
97
66
68
75
25
BR
OW
N M
ICH
AEL
W6
1
H &
R 1
871
LLC
74
33
33
33
33
33
33
33
33
33
321
MA
RLI
N F
IREA
RM
S C
OM
PAN
Y8
98
1112
1113
118
610
1210
1010
712
818
SPR
ING
FIEL
D IN
C9
1415
119
77
712
1010
11
HL
GR
ISEL
INC
101
SMIT
H D
ON
ALD
J11
1
LASE
R P
RO
DU
CTS
CO
RP
1217
1717
4
GO
RD
ON
LA
MO
NT
131
SED
RA
N JO
HN
ATH
AN
141
CIE
NER
JON
ATH
AN
AR
THU
R15
1318
3
BEU
RY
TA
D16
182
S W
DA
NIE
L IN
C17
102
MA
RC
US
INC
181
SAX
ON
AR
MS
INC
191
SHA
RP
TOO
L &
TR
AD
E C
O IN
C20
1
NEW
EN
GLA
ND
FIR
EAR
MS
CO
MPA
NY
INC
33
44
4
AM
ERIN
D IN
C6
1
ITH
AC
A A
CQ
UIS
ITIO
N C
OR
P8
66
79
99
98
LJU
TIC
LLC
1113
1415
1616
1312
1413
1413
1420
1515
16
HA
TFIE
LD G
UN
CO
INC
1211
1317
1716
6
POLI
CE
AU
TOM
ATI
C W
EAPO
NS
SER
VIC
E IN
C15
1EL
LIS
MER
C C
O D
IV O
F M
ON
AC
HE
INV
EST-
MEN
T C
O16
1
GEN
ECC
O K
ENN
ETH
MIC
HA
EL19
1
HA
RD
EST
Y B
OY
D A
2019
2
SPO
RTI
NG
AR
MS
MFG
INC
98
97
76
68
87
89
813
SEN
TIN
EL A
RM
S C
OR
POR
ATI
ON
1012
1415
4
STR
EET
SWEE
PER
SA
LES
OF
GA
INC
1210
1012
810
6
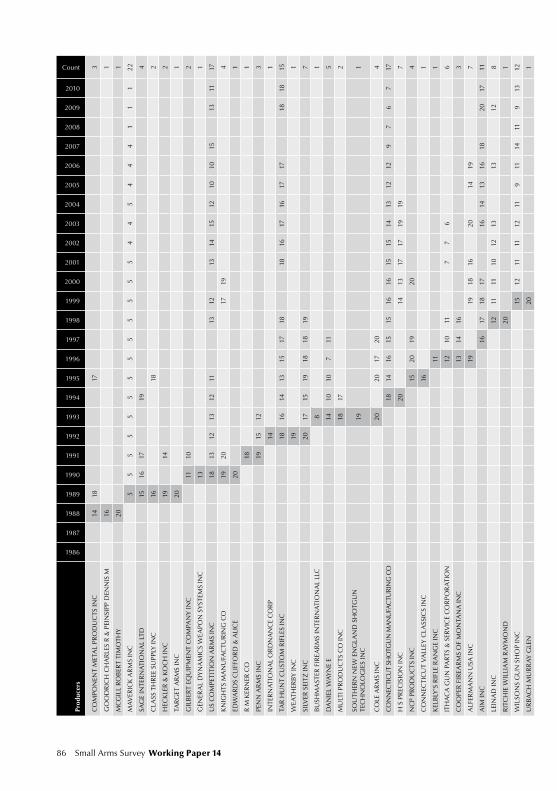
86 Small Arms Survey Working Paper 14 Brauer The US Firearms Industry: Production and Supply 87
Prod
ucer
s
1986
1987
1988
1989
1990
1991
1992
1993
1994
1995
1996
1997
1998
1999
2000
2001
2002
2003
2004
2005
2006
2007
2008
2009
2010
Count
CO
MPO
NEN
T M
ETA
L PR
OD
UC
TS IN
C14
1817
3
GO
OD
RIC
H C
HA
RLE
S R
& P
EIN
SIPP
DEN
NIS
M16
1
MC
GIL
L R
OB
ERT
TIM
OTH
Y20
1
MA
VER
ICK
AR
MS
INC
55
55
55
55
55
55
54
45
44
41
11
22
SAG
E IN
TER
NA
TIO
NA
L LT
D15
1617
194
CLA
SS T
HR
EE S
UPP
LY IN
C16
182
HEC
KLE
R &
KO
CH
INC
1914
2
TAR
GET
AR
MS
INC
201
GIL
BER
T EQ
UIP
MEN
T C
OM
PAN
Y IN
C11
102
GEN
ERA
L D
YN
AM
ICS
WEA
PON
SY
STEM
S IN
C13
1
US
CO
MPE
TITI
ON
AR
MS
INC
1813
1213
1211
1312
1314
1512
1010
1513
1117
KN
IGH
TS M
AN
UFA
CTU
RIN
G C
O19
2017
194
EDW
AR
DS
CLI
FFO
RD
& A
LIC
E20
1
R M
KER
NER
CO
181
PEN
N A
RM
S IN
C19
1512
3
INTE
RN
ATI
ON
AL
OR
DN
AN
CE
CO
RP
141
TAR
HU
NT
CU
STO
M R
IFLE
S IN
C18
1614
1315
1718
1816
1716
1717
1818
15
WEA
THER
BY
INC
191
SILV
ER S
EITZ
INC
2017
1519
1818
197
BU
SHM
AST
ER F
IREA
RM
S IN
TER
NA
TIO
NA
L LL
C8
1
DA
NIE
L W
AY
NE
E14
1010
711
5
MU
LTI P
RO
DU
CTS
CO
INC
1817
2
SOU
THER
N N
EW E
NG
LAN
D S
HO
TGU
N
TEC
HN
OLO
GIE
S IN
C19
1
CO
LE A
RM
S IN
C20
2017
204
CO
NN
ECTI
CU
T SH
OTG
UN
MA
NU
FAC
TURI
NG
CO
1814
1615
1516
1615
1514
1312
129
76
717
H S
PR
ECIS
ION
INC
2014
1317
1719
197
NC
P PR
OD
UC
TS IN
C15
2019
204
CO
NN
ECTI
CU
T V
ALL
EY C
LASS
ICS
INC
161
KEL
BLY
’S R
IFLE
RA
NG
E IN
C11
1
ITH
AC
A G
UN
PA
RTS
& S
ERV
ICE
CO
RPO
RA
TIO
N12
1011
77
66
CO
OPE
R F
IREA
RM
S O
F M
ON
TAN
A IN
C13
1416
3
ALF
ERM
AN
N U
SA IN
C19
1918
1620
1419
7
AIM
INC
1617
1817
1614
1316
1820
1711
LEIN
AD
INC
1211
1110
1213
1312
8
RIT
CH
IE W
ILLI
AM
RA
YM
ON
D20
1
WIL
SON
S G
UN
SH
OP
INC
1512
1111
1211
911
1411
913
12
UR
BA
CH
MU
RR
AY
GLE
N20
1
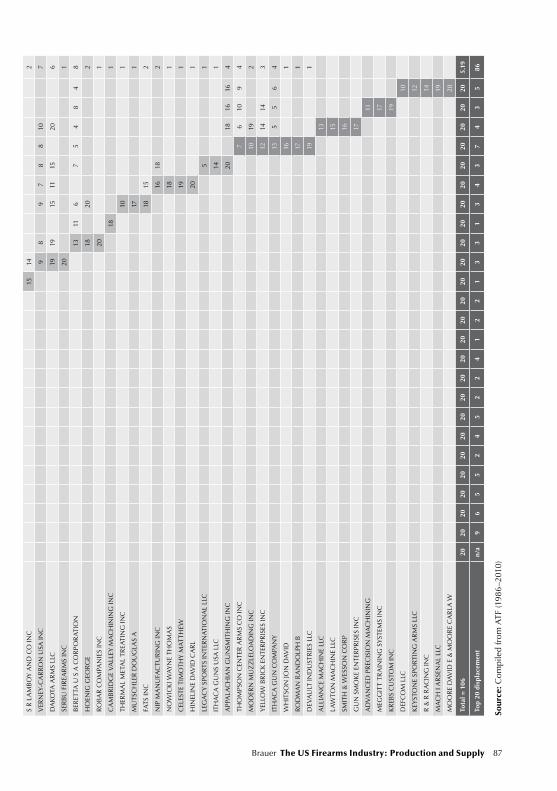
86 Small Arms Survey Working Paper 14 Brauer The US Firearms Industry: Production and Supply 87
S R
LA
MB
OY
AN
D C
O IN
C15
142
VER
NEY
-CA
RR
ON
USA
INC
98
97
88
107
DA
KOTA
AR
MS
LLC
1919
1511
1520
6
SER
BU
FIR
EAR
MS
INC
201
BER
ETTA
U S
A C
OR
POR
ATI
ON
1311
67
54
84
8
HO
ENIG
GEO
RG
E18
202
RO
BA
R C
OM
PAN
IES
INC
201
CA
MB
RID
GE
VA
LLEY
MA
CH
ININ
G IN
C18
1
THER
MA
L M
ETA
L TR
EATI
NG
INC
101
MU
TSC
HLE
R D
OU
GLA
S A
171
FATS
INC
1815
2
NIP
MA
NU
FAC
TUR
ING
INC
1618
2
NO
WIC
KI W
AY
NE
THO
MA
S18
1
CEL
ESTE
TIM
OTH
Y M
AT
THEW
191
HIN
ELIN
E D
AV
ID C
AR
L20
1
LEG
AC
Y S
POR
TS IN
TER
NA
TIO
NA
L LL
C5
1
ITH
AC
A G
UN
S U
SA L
LC14
1
APP
ALA
CH
IAN
GU
NSM
ITH
ING
INC
2018
1616
4
THO
MPS
ON
CEN
TER
AR
MS
CO
INC
76
109
4
MO
DER
N M
UZ
ZLE
LOA
DIN
G IN
C10
192
YEL
LOW
BR
ICK
EN
TER
PRIS
ES IN
C12
1414
3
ITH
AC
A G
UN
CO
MPA
NY
135
56
4
WH
ITSO
N JO
N D
AV
ID16
1
RO
DM
AN
RA
ND
OLP
H B
171
DEV
AU
LT IN
DU
STR
IES
LLC
191
ALL
IAN
CE
MA
CH
INE
LLC
13
LAW
TON
MA
CH
INE
LLC
15
SMIT
H &
WES
SON
CO
RP
16
GU
N S
MO
KE
ENTE
RPR
ISES
INC
17
AD
VA
NC
ED P
REC
ISIO
N M
AC
HIN
ING
11
MEG
GIT
T TR
AIN
ING
SY
STEM
S IN
C17
KR
EBS
CU
STO
M IN
C19
DEF
CO
M L
LC10
KEY
STO
NE
SPO
RTI
NG
AR
MS
LLC
12
R &
R R
AC
ING
INC
14
MA
CH
I A
RSE
NA
L LL
C19
MO
OR
E D
AV
ID E
& M
OO
RE
CA
RLA
W
20
Tota
l = 1
0620
2020
2020
2020
2020
2020
2020
2020
2020
2020
2020
2020
2020
5.19
Top
20 d
ispl
acem
ent
n/a
96
55
24
52
24
12
21
33
13
43
74
35
86
Sour
ce: C
ompi
led
from
ATF
(198
6–2
010)
88 Small Arms Survey Working Paper 14 Brauer The US Firearms Industry: Production and Supply 89
Endnotes
1 A further 378 companies reported production of ‘miscellaneous firearms’ or producing
only for export. This brings the total number of identified companies to 2,666 for the years
1986–2010. For comparison, the Small Arms Survey (2005, p. 43) refers to ‘511 known US
producers and repairers of small arms and light weapons’, with data mostly pointing to
around the year 2004. The Small Arms Survey (2004, p. 7) refers to 1,249 firms in 90 coun-
tries ‘involved in some aspect of small arms and light weapons production’.
2 The Small Arms Survey 2009 chapter on transfers noted an increase in the global small arms
trade, which was partially explained by imports by the United States (Small Arms Survey,
2009, ch. 1). At the time it was not known whether this was due to an increase in the size of
the US market or simply an increase in the market share of foreign producers. This paper
provides an answer: there is an overall increase in US supply even as there is an increase
in US market share by non-US firms.
3 The estimate pertains to federally licensed firearms dealers only and does not refer to re-
sales via non-licensed channels, such as gun show-related sales or through newspaper
advertisements, garage sales, friend-to-friend transfers, and the like.
4 Legally, even very small-scale producers are firearms manufacturers. Very many of these
appear to be hobbyists, gunsmiths, and craft-type producers. At least one is a technical
college that teaches gunsmithing, and its small production requires reporting. Others,
however, are larger establishments ordinarily producing military firearms or other items
that do not fall under the reporting requirements for commercial firearms on which this
paper concentrates.
5 The last such study, restricted to manufacturers in the Connecticut Valley, dates to 1948
(Deyrup, 1948).
6 For example, extensive financial data is available for only a single major US maker of civil-
ian market firearms, i.e. Sturm, Ruger & Co. Inc., whose shares are publicly traded on the
New York Stock Exchange. Sporadic financial records are also available for Smith &
Wesson, Remington, and Colt Defense. Financial records for a few non-US companies may
be available as well, e.g. for FN Herstal of Belgium.
7 Small arms manufacturing is not restricted to firearms, but excludes both ammunition
and the wholesaling and retailing of firearms. NAICS 332994 covers the following: am-
munition carts (i.e. 30 mm or less, 1.18 inch or less) manufacturing; barrels, gun (i.e. 30 mm
or less, 1.18 inch or less), manufacturing; BB guns manufacturing; belts, machine gun (i.e.
30 mm or less, 1.18 inch or less), manufacturing; carbines manufacturing; clips, gun (i.e. 30
mm or less, 1.18 inch or less), manufacturing; cylinders and clips, gun (i.e. 30 mm. or less,
1.18 inch or less), manufacturing; dart guns manufacturing; firearms, small, manufactur-
ing; grenade launchers manufacturing; gun barrels (i.e. 30 mm or less, 1.18 inch or less)
manufacturing; gun magazines (i.e. 30 mm. or less, 1.18 inch or less) manufacturing; guns
88 Small Arms Survey Working Paper 14 Brauer The US Firearms Industry: Production and Supply 89
(i.e. 30 mm or less, 1.18 inch or less) manufacturing; guns, BB and pellet, manufacturing;
links, ammunition (i.e. 30 mm or less, 1.18 inch or less), manufacturing; machine gun belts
(i.e. 30 mm or less, 1.18 inch or less) manufacturing; machine guns (i.e. 30 mm or less, 1.18
inch or less) manufacturing; pellet guns manufacturing; pistols manufacturing; pyrotech-
nic pistols and projectors manufacturing; recoil mechanisms (i.e. 30 mm or less, 1.18 inch
or less), gun, manufacturing; revolvers manufacturing; rifles (except recoilless, toy) manu-
facturing; rifles, BB and pellet, manufacturing; rifles, pneumatic, manufacturing; shot-
guns manufacturing; sub-machine guns manufacturing; tranquilizer guns, manufactur-
ing. For the definition, see USCB (2010c).
8 This is strange because the cost of materials plus value added cannot exceed sales revenue.
9 According to the USCB (2010d), small arms ammunition manufacturing adds another
USD 2,339 million in sales revenue to these figures.
10 Handguns are pistols and revolvers; long guns are rifles and shotguns. ‘Civilian use’ re-
fers to weapons purposed for non-military use, i.e. use by law enforcement agencies, pri-
vate sector businesses, and citizens. For convenience, this is abbreviated as the US ‘fire-
arms’ or ‘civilian firearms’ or ‘non-military firearms’ industry. Even as important spillover
effects may exist from the military segment of the market to the civilian, private security,
and law enforcement segments, military firearms are excluded because of lack of data.
11 FFLs must be renewed every three years, while FFL holders who discontinue operations
must turn their records over to the FBI so that firearms tracing remains possible.
12 See ATF (n.d.d). Question 12 reads as follows: ‘Q: If I manufacture a weapon in one calen-
dar year, but do not sell it, do I still need to report it? No. The AFMER report is used to
report the number of firearms that are produced and have entered commerce. Example: If
you produce 100 firearms in a calendar year but only 30 have entered commerce within
that same calendar year, then you would only report 30. The other 70 firearms are still in
your possession (and on your books) and would not be reported until the calendar year
that they enter commerce.’
13 Sometimes, but not always, a column-based copy/paste action from the PDF to a spread-
sheet program was possible. Even then, all data had to be hand checked.
14 Customs data is also problematic with regard to its reported monetary values (Small Arms
Survey, 2009, p. 27, Box 1.2). However, the research reported here relies only on quantity of
units traded information, not on trade dollar values. All this is discussed in more detail
below.
15 ‘Returns to scale’ refers to the relation between inputs required and outputs produced. If
one unit of input produces one unit of output and two units of input produce two units of
output, and so on, then one speaks of ‘constant’ returns, and the up-and-down movement
in the business cycle may allow firms to hire or fire the necessary inputs smoothly without
necessarily increasing or decreasing their average costs. Total profits would increase or
decrease with the market, but profit per unit sold would not necessarily be affected.
16 On the confusing US data sources with regard to the small firearms trade, see, for example,
Small Arms Survey (2009, p. 27).
17 For data purchase, contact Mary E. May, Trade Data Services, USCB (tel.: +1-301-763-
2227/2237; email: [email protected]). Data for 1980–88 and 1989–2007 was pur-
90 Small Arms Survey Working Paper 14 Brauer The US Firearms Industry: Production and Supply 91
chased on 2 December 2008, and data for 2008–09 on 8 February 2011. This data comes with
the following notes. Regarding exports: ‘Data on U.S. exports of merchandise from the U.S.
to all countries, except Canada, is compiled from the Electronic Export Information (EEI)
filed by the USPPI or their agents through the Automated Export System (AES). The EEI is
unique among Census Bureau data collection methods since it is not sent to respondents
soliciting responses as in the case of surveys. Each EEI represents a shipment of one or
more kinds of merchandise from one exporter to one foreign importer on a single carrier.
Filing the EEI is mandatory under Chapter 9, Title 13, United States Code. Qualified ex-
porters or their agents submit EEI data by automated means directly to the U.S. Census
Bureau. The United States is substituting Canadian import statistics for U.S. exports to
Canada in accordance with a 1987 Memorandum of Understanding signed by the Census
Bureau, U.S. Customs and Border Protection, Canadian Customs, and Statistics Canada.
Similarly, under this Memorandum of Understanding, Canada is substituting U.S. import
statistics for Canadian exports to the United States. This data exchange includes only U.S.
exports destined for Canada and does not include shipments destined for third countries
by routes passing through Canada or shipments of certain grains and oilseeds to Canada
for storage prior to exportation to a third country. These shipments are reported on and
compiled from EEIs. Department of Defense Military Assistance Program Grant-Aid ship-
ments being transported as Department of Defense cargo are reported directly to the U.S.
Census Bureau by the Department of Defense.’ Regarding imports: ‘Published data on U.S.
imports of merchandise is compiled primarily from automated data submitted through
the U.S. Customs’ Automated Commercial System. Data are also compiled from import
entry summary forms, warehouse withdrawal forms and Foreign Trade Zone documents
as required by law to be filed with the U.S. Customs and Border Protection. Data on im-
ports of electricity and natural gas from Canada are obtained from Canadian sources.’ See
USCB (2012).
18 This description of the NICS checking process is based on an author interview on 22 Sep-
tember 2011 with Sammy J. DeMarco, FBI supervisory management and programme ana-
lyst, programme manager, Major Case Contact Center.
19 Interestingly enough, when a small—and wholly unscientific—sample of firearms retail-
ers in Georgia and Ohio were asked in late 2010 and early 2011 about the split between
‘new’ and ‘used’ firearms sales, all five respondents said 70/30, a split not wholly out of line
with the estimate provided in this paper.
20 For an advanced overview of the relevant measures, economic theory, and econometrics,
see Perloff, Karp, and Golan (2007).
21 Also see the division’s merger guidelines, US DoJ (n.d.c).
22 FN Manufacturing already produced military rifles, but these are not reported to the ATF.
FN thus reports non-military rifle production only as from 2008 (and pistol production for
many years before that).
23 Remington’s history goes back to 1816, Marlin’s to 1870. Marlin produced the Marlin, H&R
1871 (Harrington & Richardson), New England Firearms, and L. C. Smith brands of long
guns, all of which it had acquired over the years. (Remington already owned the rights to
another famous gun, the Charles Parker shotgun.)

90 Small Arms Survey Working Paper 14 Brauer The US Firearms Industry: Production and Supply 91
24 There is also a Rogue Riv Rifleworks Inc./John Rigby & Co. in the January 2010 FFL list.
ATF-reported production is very small. This is a separate legal entity from Rogue Rifle.
25 To participate in the Canadian military and law enforcement markets and international
markets, Colt Defense acquired Diemaco in 2005 and renamed it Colt Canada Corpora-
tion. (Technically there are two companies: Colt Defense LLC and Colt Defense Inc.) Colt
Defense also owns Colt Rapid Mat LLC, a maker of heliopad and landing-strip materials.
92 Small Arms Survey Working Paper 14 Brauer The US Firearms Industry: Production and Supply 93
Bibliography
ATF (Bureau of Alcohol, Tobacco, Firearms, and Explosives). 1986–2009. Annual Firearms Manu-
facturing and Export Report. Department of Justice. Washington, DC: ATF.—— . 2005. Federal Firearms Regulations Reference Guide 2005. ATF Publication 5300.4. Rev. Sep-
tember 2005. Washington, DC: ATF. <http://www.atf.gov/publications/firearms/>—— . 2008. ATF Fact Sheet, June 2008.
<http://www.atf.gov/publications/factsheets/factsheet-ffl-compliance.html>—— . n.d.a. Website. Accessed March 2012. <http://www.atf.gov/about/history/>—— . n.d.b. Federal Firearms License (FFL) Types and Downloadable Lists of Federal Firearms Licen-
sees (FFLs). Accessed March 2012. <http://www.atf.gov/about/foia/ffl-list.html>—— . n.d.c. ‘F 5300.11: Annual Firearms Manufacturing and Exportation Report Under 18
U.S.C. Chapter 44, Firearms.’ <http://www.atf.gov/forms/firearms/>—— . n.d.d. ‘ATF Form 5300.11 Questions.’
<http://www.atf.gov/firearms/faq/atf-f-5300-11.html#information-usage>Brauer, Jurgen. 1991. ‘Arms Production in Developing Nations: The Relation to Industrial Struc-
ture, Industrial Diversification, and Human Capital Formation.’ Defence Economics. Vol. 2, No. 2, pp. 165–75.
—— . 2000. ‘Potential and Actual Arms Production: Implications for the Arms Trade Debate.’ Defence and Peace Economics, Vol. 11, No. 3, pp. 461–80.
—— . 2007. ‘Arms Industries, Arms Trade, and Developing Countries.’ In Todd Sandler and Keith Hartley, eds. Handbook of Defense Economics, Vol. 2. Amsterdam: Elsevier, pp. 973–1015.
—— and J. Paul Dunne. 2010. ‘Macroeconomía y violencia.’ Revista de Económica del Rosario, Vol. 13, No. 1, pp. 1–39.
—— and ——. 2011. ‘Macroeconomics and Violence.’ In Derek L. Braddon and Keith Hartley, eds. Handbook on the Economics of Conflict. Cheltenham: Elgar, pp. 311–37.
—— and Robert Muggah. 2006. ‘Completing the Circle: Building a Theory of Small Arms De-mand.’ Contemporary Security Policy, Vol. 27, No. 1, pp. 138–54.
Briley Manufacturing Inc. n.d. Website. Accessed October 2012. <http://www.briley.com>Butterfield, Fox. 2004. ‘Fraud Alleged in Winning Bid for Gun Manufacturer.’ The New York
Times. 22 October. <http://www.nytimes.com/2004/10/22/national/22guns.html?_r=1>CoM (Commonwealth of Massachusetts). n.d.
<http://www.nssf.org/share/legal/litigation/pdf/private/hernandezvkahr/complaint.pdf>Cook, Philip J. and Jens Ludwig. 2000. Gun Violence: The Real Costs. Oxford: Oxford University
Press.Deyrup, Felicia Johnson. 1948. Arms Makers of the Connecticut Valley: A Regional Study of the Eco-
nomic Development of the Small Arms Industry, 1798–1870. Smith College Studies in History, Vol. 33. Northampton, Massachusetts.
FBI (Federal Bureau of Investigation). n.d. ‘National Instant Criminal Background Check System.’ <http://www.fbi.gov/about-us/cjis/nics>
92 Small Arms Survey Working Paper 14 Brauer The US Firearms Industry: Production and Supply 93
Freedom Group. 2010. Freedom Group Annual Report. Follow link to ‘Investor Information’. <http://www.freedom-group.com/>
—— . n.d. Website. Accessed 15 March 2012. <http://www.freedom-group.com/>Gabelnick, Tamar, Maria Haug, and Lora Lumpe. 2006. A Guide to the US Small Arms Market,
Indus try and Exports, 1998–2004. Occasional Paper No. 19. Geneva: Small Arms Survey.Geneva Declaration on Armed Violence and Development. 2008. Global Burden of Armed Violence.
Geneva: Geneva Declaration Secretariat.Hall, Peter, Stefan Markowski, and Jurgen Brauer. 2008. ‘The US Small Arms Industry: Profit,
Proliferation, Performance.’ Asteriskos: Journal of International and Peace Studies, Nos. 5/6, pp. 41–62.
—— . 2011. ‘Policies for Reducing Firearm-related Violence in Developing Countries.’ Interna-tional Journal of Development and Conflict, Vol. 1, No. 1, pp. 41–59.
Hemenway, David. 2004. Private Guns, Public Health. Ann Arbor: University of Michigan Press.Hepburn, L., M. Miller, D. Azrael, and D. Hemenway. 2007. ‘The US Gun Stock: Results from the
2004 National Firearms Survey.’ Injury Prevention, Vol. 13, No. 1, pp. 15–19.Hounshell, David A. 1984. From the American System to Mass Production, 1800–1932. Baltimore
and London: Johns Hopkins University Press.Jackson, Edward. n.d. ‘Edward Jackson, CMfgE: Manufacturing Engineer at Remington Arms.’
Accessed 6 October 2011. <http://www.linkedin.com/pub/edward-jackson-cm-fge/25/411/163>
Kahr Arms. 2010. ‘Kahr Arms Purchases Magnum Research.’ Kahr News 2010. <http://www.kahr.com/kahr-news2010.asp>
Karch, Debra L., Joseph Logan, and Nimesh Patel. 2011. ‘Surveillance for Violent Deaths— National Violent Death Reporting System, 16 States, 2008.’ Morbidity and Mortality Weekly Report. Atlanta: Centers for Disease Control and Prevention. 26 August.
Killicoat, Phillip. 2006. ‘Cheap Guns, More War? The Economics of Small Arms.’ Master’s disser-tation, Oxford University.
Kleck, Gary. 1979. ‘Capital Punishment, Gun Ownership, and Homicide.’ American Journal of Sociology, Vol. 84, No. 4, pp. 882–910.
Lizotte, Alan J. and David J. Bordua. 1980. ‘Firearms Ownership for Sport and Protection: Two Divergent Models.’ American Sociological Review, Vol. 45, No. 2, pp. 229–44.
Markowski, Stefan, Stephanie Koorey, Peter Hall, and Jurgen Brauer. 2008. ‘Channels of Small-arms Proliferation: Policy Implications for Asia-Pacific.’ Economics of Peace and Security Journal, Vol. 3, No. 1, pp. 79–85.
—— . 2009. ‘Multi-channel Supply Chain for Illicit Small Arms.’ Defence and Peace Economics, Vol. 20, No. 3. June, pp. 171–91.
McDowall, David. 1991. ‘Firearm Availability and Homicide Rates in Detroit, 1951–1986.’ Social Forces, Vol. 69, No. 4, pp. 1085–1101.
—— and Colin Loftin. 1983. ‘Collective Security and the Demand for Legal Handguns.’ Ameri-can Journal of Sociology, Vol. 88, No. 6, pp. 1146–61.
Muggah, Robert and Jurgen Brauer. 2004. Diagnosing Small Arms Demand: A Multi-disciplinary Approach. Discussion Paper No. 50. School of Economics and Management, University of KwaZulu-Natal.
——, ——, David Atwood, and Sarah Meek. 2005. ‘Means and Motivation: Rethinking Small Arms Demand.’ Harry F. Guggenheim Foundation Review, pp. 31–38.
94 Small Arms Survey Working Paper 14 Brauer The US Firearms Industry: Production and Supply 95
Perloff, Jeffrey M., Larry S. Karp, and Amos Golan. 2007. Estimating Market Power and Strategies. New York: Cambridge University Press.
Shooting Industry. 2012. March. <http://www.shootingindustry.com/digital-editions/>Small Arms Survey. 2004. Small Arms Survey 2004: Rights at Risk. Oxford: Oxford University
Press.—— . 2005. Small Arms Survey 2005: Weapons at War. Oxford: Oxford University Press.—— . 2009. Small Arms Survey 2009: Shadows of War. Cambridge University Press.Smith, Douglas A. and Craig D. Uchida. 1988. ‘The Social Organization of Self-help: A Study of
Defensive Weapon Ownership.’ American Sociological Review, Vol. 53, No. 1, pp. 94–102.Smith & Wesson. 2007. Annual Report 2007. Scanned copy available at <http://www.sec.gov/Ar-
chives/edgar/vprr/07/9999999997-07-041052>Thurman, Russ. 2001. ‘Special Report to the Industry: Firearm Production.’ Shooting Industry,
Vol. 46, No. 7, pp. 32–47.
USCB (US Census Bureau). 2010a. ‘Industry Statistics Sampler: NAICS 332994 Small Arms Man-ufacturing.’ <http://www.census.gov/econ/industry/hierarchy/i332994.htm>
—— . 2010b. ‘2007 Economic Census Release Date: 11/16/2010.’ <http://factfinder2.census.gov/faces/tableservices/jsf/pages/productview.xhtml?pid= ECN_2007_US_31I1&prodType=table but>
—— . 2010c. ‘Industry Statistics Sampler: NAICS 332994 Small Arms Manufacturing.’ 2007 NAICS Definition.’ <http://www.census.gov/econ/industry/def/d332994.htm>
—— . 2010d. ‘2007 Economic Census Release Date: 11/16/2010.’ <http://www.census.gov/econ/industry/hierarchy/i332992.htm>
—— . 2012. Guide to Foreign Trade Statistics: Description of the Foreign Trade Statistical Program. <http://www.census.gov/foreign-trade/guide/sec2.html#source>
US DoJ (US Department of Justice). n.d.a. ‘Antitrust Division.’ <http://www.justice.gov/atr>—— . n.d.b. ‘The Herfindahl-Hirschman Index.’ <http://www.justice.gov/atr/public/testimony/
hhi.htm>—— . n.d.c. ‘Horizontal Merger Guidelines.’ <http://www.justice.gov/atr/public/guidelines/
hmg.htm#15>USITC (US International Trade Commission). n.d. ‘HTSA Archive.’ <http://www.usitc.gov/
tata/hts/archive/index.htm> US SEC (US Securities and Exchange Commission). n.d. Accessed 15 March 2011.
<http://www.sec.gov/cgi-bin/browse-edgar?action=getcompany&CIK=0001471597&owner=exclude&count=40>
Violence Policy Center. 1946–79. <http://www.vpc.org/studyndx.htm>—— . 2003. Firearms Production in America, 2002 Edition. Washington, DC: Violence Policy Center. World Health Organization. 2008. Preventing Violence and Reducing Its Impact: How Development
Agencies Can Help. Geneva: WHO.Young, Robert L. 1985. ‘Perceptions of Crime, Racial Attitudes, and Firearms Ownership.’ Social
Forces, Vol. 64, No. 2, pp. 473–86.
94 Small Arms Survey Working Paper 14 Brauer The US Firearms Industry: Production and Supply 95
Publications list
Occasional Papers1 Re-Armament in Sierra Leone: One Year After the Lomé Peace Agreement, by Eric Berman,
December 2000
2 Removing Small Arms from Society: A Review of Weapons Collection and Destruction Pro-
grammes, by Sami Faltas, Glenn McDonald, and Camilla Waszink, July 2001
3 Legal Controls on Small Arms and Light Weapons in Southeast Asia, by Katherine Kramer (with
Nonviolence International Southeast Asia), July 2001
4 Shining a Light on Small Arms Exports: The Record of State Transparency, by Maria Haug, Martin
Langvandslien, Lora Lumpe, and Nic Marsh (with NISAT), January 2002
5 Stray Bullets: The Impact of Small Arms Misuse in Central America, by William Godnick, with
Robert Muggah and Camilla Waszink, November 2002
6 Politics from the Barrel of a Gun: Small Arms Proliferation and Conflict in the Republic of Georgia,
by Spyros Demetriou, November 2002
7 Making Global Public Policy: The Case of Small Arms and Light Weapons, by Edward Laurance
and Rachel Stohl, December 2002
8 Small Arms in the Pacific, by Philip Alpers and Conor Twyford, March 2003
9 Demand, Stockpiles, and Social Controls: Small Arms in Yemen, by Derek B. Miller, May 2003
10 Beyond the Kalashnikov: Small Arms Production, Exports, and Stockpiles in the Russian Federation,
by Maxim Pyadushkin, with Maria Haug and Anna Matveeva, August 2003
11 In the Shadow of a Cease-fire: The Impacts of Small Arms Availability and Misuse in Sri Lanka, by
Chris Smith, October 2003
12 Small Arms in Kyrgyzstan: Post-revolutionary Proliferation, by S. Neil MacFarlane and Stina
Torjesen, March 2007, ISBN 2-8288-0076-8, also in Kyrgyz and Russian (first printed as Kyr-
gyzstan: A Small Arms Anomaly in Central Asia?, by S. Neil MacFarlane and Stina Torjesen,
February 2004)
13 Small Arms and Light Weapons Production in Eastern, Central, and Southeast Europe, by Yudit
Kiss, October 2004, ISBN 2-8288-0057-1
14 Securing Haiti’s Transition: Reviewing Human Insecurity and the Prospects for Disarmament, Demo-
bilization, and Reintegration, by Robert Muggah, October 2005, updated, ISBN 2-8288-0066-0
15 Silencing Guns: Local Perspectives on Small Arms and Armed Violence in Rural South Pacific Islands
Communities, edited by Emile LeBrun and Robert Muggah, June 2005, ISBN 2-8288-0064-4
16 Behind a Veil of Secrecy: Military Small Arms and Light Weapons Production in Western Europe,
by Reinhilde Weidacher, November 2005, ISBN 2-8288-0065-2
17 Tajikistan’s Road to Stability: Reduction in Small Arms Proliferation and Remaining Challenges, by
Stina Torjesen, Christina Wille, and S. Neil MacFarlane, November 2005, ISBN 2-8288-0067-9
18 Demanding Attention: Addressing the Dynamics of Small Arms Demand, by David Atwood, Anne-
Kathrin Glatz, and Robert Muggah, January 2006, ISBN 2-8288-0069-5
96 Small Arms Survey Working Paper 14 Brauer The US Firearms Industry: Production and Supply 97
19 A Guide to the US Small Arms Market, Industry, and Exports, 1998–2004, by Tamar Gabelnick,
Maria Haug, and Lora Lumpe, September 2006, ISBN 2-8288-0071-7
20 Small Arms, Armed Violence, and Insecurity in Nigeria: The Niger Delta in Perspective, by Jennifer
M. Hazen with Jonas Horner, December 2007, 2-8288-0090-3
21 Crisis in Karamoja: Armed Violence and the Failure of Disarmament in Uganda’s Most Deprived
Region, by James Bevan, June 2008, ISBN 2-8288-0094-6
22 Blowback: Kenya’s Illicit Ammunition Problem in Turkana North District, by James Bevan, June
2008, ISBN 2-8288-0098-9
23 Gangs of Central America: Causes, Costs, and Interventions, by Dennis Rodgers, Robert Muggah,
and Chris Stevenson, May 2009, ISBN 978-2-940415-13-7
24 Arms in and around Mauritania: National and Regional Security Implications, by Stéphanie Pézard
with Anne-Kathrin Glatz, June 2010, ISBN 978-2-940415-35-9 (also available in French)
25 Transparency Counts: Assessing State Reporting on Small Arms Transfers, 2001–08, by Jasna
Lazarevic, June 2010, ISBN 978-2-940415-34-2
26 Confronting the Don: The Political Economy of Gang Violence in Jamaica, by Glaister Leslie,
November 2010, ISBN 978-2-940415-38-0
27 Safer Stockpiles: Practitioners’ Experiences with Physical Security and Stockpile Management (PSSM)
Assistance Programmes, edited by Benjamin King, April 2011, ISBN 978-2-940415-54-0
28 Analysis of National Reports: Implementation of the UN Programme of Action on Small Arms and the
International Tracing Instrument in 2009–10, by Sarah Parker, May 2011, ISBN 978-2-940415-55-7
29 Blue Skies and Dark Clouds: Kazakhstan and Small Arms, edited by Nicolas Florquin, Dauren
Aben, and Takhmina Karimova, April 2012, ISBN 978-2-9700771-2-1
30 The Programme of Action Implementation Monitor (Phase 1): Assessing Reported Progress, by
Sarah Parker with Katherine Green, August 2012, ISBN 978-2-9700816-2-3
31 Internal Control: Codes of Conducts within Insurgent Armed Groups, by Olivier Bangerter,
Novem ber 2012, ISBN 978-2-9700816-8-5
Special Reports1 Humanitarianism Under Threat: The Humanitarian Impact of Small Arms and Light Weapons, by
Robert Muggah and Eric Berman, commissioned by the Reference Group on Small Arms of
the UN Inter-Agency Standing Committee, July 2001
2 Small Arms Availability, Trade, and Impacts in the Republic of Congo, by Spyros Demetriou, Robert
Muggah, and Ian Biddle, commissioned by the International Organization for Migration
and the UN Development Programme, April 2002
3 Kosovo and the Gun: A Baseline Assessment of Small Arms and Light Weapons in Kosovo, by Anna
Khakee and Nicolas Florquin, commissioned by the United Nations Development Programme,
June 2003
4 A Fragile Peace: Guns and Security in Post-conflict Macedonia, by Suzette R. Grillot, Wolf-Christian
Paes, Hans Risser, and Shelly O. Stoneman, commissioned by United Nations Development
Programme, and co-published by the Bonn International Center for Conversion, SEESAC
in Belgrade, and the Small Arms Survey, June 2004, ISBN 2-8288-0056-3

96 Small Arms Survey Working Paper 14 Brauer The US Firearms Industry: Production and Supply 97
5 Gun-running in Papua New Guinea: From Arrows to Assault Weapons in the Southern Highlands,
by Philip Alpers, June 2005, ISBN 2-8288-0062-8
6 La République Centrafricaine: Une étude de cas sur les armes légères et les conflits, by Eric G. Berman,
published with financial support from UNDP, July 2006, ISBN 2-8288-0073-3
7 Small Arms in Burundi: Disarming the Civilian Population in Peacetime (Les armes légères au
Burundi : après la paix, le défi du désarmement civil), by Stéphanie Pézard and Nicolas Florquin,
co-published with Ligue Iteka with support from UNDP–Burundi and Oxfam–NOVIB, in
English and French, August 2007, ISBN 2-8288-0080-6 ISSN 1661-4453
8 Quoi de neuf sur le front congolais ? Evaluation de base sur la circulation des armes légères et de
petit calibre en République du Congo, par Robert Muggah et Ryan Nichols, publié avec le
Programme des Nations Unies pour le Développement (PNUD)–République du Congo,
décembre 2007, 2-8288-0089-X
9 Small Arms in Rio de Janeiro: The Guns, the Buyback, and the Victims, by Pablo Dreyfus, Luis
Eduardo Guedes, Ben Lessing, Antônio Rangel Bandeira, Marcelo de Sousa Nascimento,
and Patricia Silveira Rivero, a study by the Small Arms Survey, Viva Rio, and ISER, December
2008, ISBN 2-8288-0102-0
10 Firearms-related Violence in Mozambique, a joint publication of the Ministry of the Interior of
Mozambique, the World Health Organization–Mozambique, and the Small Arms Survey,
June 2009, ISBN 978-2-940415-14-4
11 Small Arms Production in Brazil: Production, Trade, and Holdings, by Pablo Dreyfus, Benjamin
Lessing, Marcelo de Sousa Nascimento, and Júlio Cesar Purcena, a joint publication with
Viva Rio and ISER, September 2010, ISBN 978-2-940415-40-3
12 Timor-Leste Armed Violence Assessment Final Report, edited by Robert Muggah and Emile
LeBrun, a joint publication of ActionAid, AusAID, and the Small Arms Survey, October
2010, ISBN 978-2-940415-43-4
13 Significant Surpluses: Weapons and Ammunition Stockpiles in South-east Europe, by Pierre
Gobinet, a study of the RASR Initiative, December 2011, ISBN 978-2-9700771-2-1
14 Enquête national sur les armes légères et de petit calibre en Côte d’Ivoire: Les défis du contrôle des
armes et de la lutte contre la violence armée avant la crise post-électorale, by Savannah de Tes-
sières, March 2012, ISBN 978-2-9700771-6-9
15 Capabilities and Capacities: A Survey of South-east Europe’s Demilitarization Infrastructure, by
Pierre Gobinet, a study of the RASR Initiative, April 2012, ISBN 978-2-9700771-7-6
16 Availability of Small Arms and Perceptions of Security in Kenya: An Assessment, by Manasseh
Wepundi, Eliud Nthiga, Eliud Kabuu, Ryan Murray, and Anna Alvazzi del Frate, a joint
publication of Kenya National Focus Point on Small Arms and Light Weapons, and the
Small Arms Survey, with support from the Ministry of Foreign Affairs of Denmark, June
2012, ISBN 978-2-9700771-8-3
17 Security Provision and Small Arms in Karamoja: A Survey of Perceptions, by Kees Kingma,
Frank Muhereza, Ryan Murray, Matthias Nowak, and Lilu Thapa, a joint publication of the
Danish Demining Group and the Small Arms Survey, September 2012, ISBN 978-2-9700816-3-0
18 Costs and Consequences: Unplanned Explosions and Demilitarization in South-east Europe, by
Jasna Lazarević, a joint publication of the Regional Approach for Stockpile Reduction, the
US Department of State’s Office of Weapons Removal and Abatement, and the Small Arms
Survey, November 2012, ISBN 978-2-9700816-7-8
98 Small Arms Survey Working Paper 14
Book SeriesArmed and Aimless: Armed Groups, Guns, and Human Security in the ECOWAS Region, edited by
Nicolas Florquin and Eric G. Berman, May 2005, ISBN 2-8288-0063-6
Armés mais désoeuvrés: Groupes armés, armes légères et sécurité humaine dans la région de la CEDEAO,
edited by Nicolas Florquin and Eric Berman, co-published with GRIP, March 2006, ISBN
2-87291-023-9
Targeting Ammunition: A Primer, edited by Stéphanie Pézard and Holger Anders, co-published with
CICS, GRIP, SEESAC, and Viva Rio, June 2006, ISBN 2-8288-0072-5
No Refuge: The Crisis of Refugee Militarization in Africa, edited by Robert Muggah, co-published
with BICC, published by Zed Books, July 2006, ISBN 1-84277-789-0
Conventional Ammunition in Surplus: A Reference Guide, edited by James Bevan, published in co-
operation with BICC, FAS, GRIP, and SEESAC, January 2008, ISBN 2-8288-0092-X
Afghanistan, Arms and Conflict: Armed groups, disarmament and security in a post-war society, by
Michael Bhatia and Mark Sedra, April 2008, published by Routledge, ISBN 978-0-415-45308-0
Ammunition Tracing Kit: Protocols and Procedures for Recording Small-calibre Ammunition, developed
by James Bevan, June 2008, ISBN 2-8288-0097-0
Kit de Traçage des Munitions: Protocoles et Procédures de Signalement des Munitions de Petit Calibre,
developed by James Bevan, co-published with GRIP, June 2008, ISBN 2-8288-0097-0
The Central African Republic and Small Arms: A Regional Tinderbox, by Eric G. Berman with Louisa
N. Lombard, December 2008, ISBN 2-8288-0103-9
La République Centrafricaine et les Armes Légères: Une Poudrière Régionale, by Eric G. Berman with
Louisa N. Lombard, co-published with GRIP, May 2009, ISBN 978-2-87291-027-4
Security and Post-Conflict Reconstruction: Dealing with fighters in the aftermath of war, edited by
Robert Muggah, January 2009, published by Routledge, ISBN 978-0-415-46054-5
The Politics of Destroying Surplus Small Arms - Inconspicuous Disarmament, edited by Aaron Karp,
July 2009, published by Routledge, ISBN 978-0-415-49461-8
Primed and Purposeful: Armed Groups and Human Security Efforts in the Philippines, by Soliman M.
Santos, Jr. and Paz Verdades M. Santos, with Octavio A. Dinampo, Herman Joseph S. Kraft,
Artha Kira R. Paredes, and Raymond Jose G. Quilop, a joint publication of the South–South
Network for Non-State Armed Group Engagement and the Small Arms Survey, April 2010,
ISBN 978-2-940415-29-8