Embed Size (px)
Citation preview

SPECIALREPORT
• The marginal effective tax rate (METR) on corporate investment (i.e., the tax impact on capital investment as a portion of the cost of capital) is 35.3 percent in the U.S.—higher than in any other developed country.
• The U.S. has maintained the highest METR in the OECD since 2007, when Canada’s multiyear program of corporate tax reform brought its METR below the G-7 average.
• Nonetheless, the White House and Treasury Department continue to assert that the U.S. has a lower METR than Canada by failing to properly account for sales and property taxes.
• The U.S. METR varies by industry, from 26.7 percent for transportation to 39.3 percent for communications.
• The U.S. average effective tax rate on corporations (AETR) is irregular from year to year due to the complexity and instability of the corporate tax code.
• Excessively high U.S. corporate tax rates have shrunk the U.S. corporate sector and reduced corporate tax revenues.
Key Findings
The U.S. Corporate Effective Tax Rate: Myth and the Fact
& Duanjie Chen
Feb. 2014No. 214
By Jack MintzDirector and Palmer Chair in School of Public Policy, University of Calgary
Research Fellow, School of Public Policy, University of Calgary

2The statutory corporate income tax rate of the United States is infamously one of the highest in the world, while effective tax rates on capital investments appear to be high and dispersed.
For businesses, it is not unusual to see their effective tax rates, regardless of how these are defined, being lower than their statutory tax rates. This results from tax preferences (“loopholes,” if using a pejorative term) that are more generous than the economic costs of generating taxable income.
For economists, it is also commonly understood that effective tax rates follow the trend of statutory tax rates in the long run. The long-run divergence between these two rates is not caused by the economic cycle but by irregular provisions of various conditional tax preferences. These irregular conditional tax allowances or credits narrow the tax base, which often goes hand in hand with rather high statutory tax rates.
The combination of a narrow tax base and an otherwise unnecessarily high tax rate hurts business investment in general by benefiting only those investors who can use available tax preferences. This creates an uneven playing field, resulting in a misallocation of capital toward tax-favored activities as well as making the tax system more complex to comply with and administer. The U.S. government, moreover, puts itself at a disadvantage with high statutory corporate tax rates, since businesses are encouraged to shift profits out of the U.S. with transfer pricing and tax-efficient financing structures to low tax rate jurisdictions, thereby reducing revenues that could be used to finance federal government services.
This paper evaluates the U.S. corporate effective tax rate by two general methods: one is the marginal effective tax rate (METR) on new investments and the other is the average effective tax rate (AETR). We conclude that the problem with the U.S. corporate income tax system is much broader than the high federal-state combined statutory tax rate of over 39 percent. The corporate tax system also undermines economic growth with a non-neutral treatment of business activities.
The Corporate Marginal Effective Tax Rate
Marginal effective tax rate (METR) analysis has been a well-documented and extensively applied analytical tool for measuring tax impacts on investment and capital allocation distortions since the 1980s.1 We have applied this analysis systematically since 2005 for the purpose of ranking Canadian business
1 For the classic introduction to the METR concept and methodology, see R. Boadway, N. Bruce, & J. M. Mintz, Taxation, Inflation, and the Effective Marginal Tax Rate in Canada, 17 Canadian Journal of Economics 62-79 (1984). See also M. A. King & D. Fullerton, The Taxation of Income from Capital: A Comparative Study of U.S., U.K., Sweden And West Germany (U. of Chicago Press 1984).

3tax competitiveness among the G-7, the OECD member countries, and an expanding list of other countries.2
Tax competitiveness is relevant due to the increased capital mobility across borders associated with globalization. Taxes that impinge on investment reduce the economy’s capacity to produce goods and services in the future, which can be referred to as the “inter-temporal” distortion arising from capital taxation. Taxes that vary by business activity also cause inter-sectoral, inter-asset, financial, and organizational distortions that result in a less than optimal use of capital resources in the economy. A more level playing field among business activities shifts resources from investments earning low pre-tax rates of return on capital to those earning higher pre-tax returns, thereby improving the allocation of capital in the economy.
Therefore, a country’s competitiveness is hurt by taxation that undermines productivity through investment. There is no doubt that the free-market system of the U.S. has been a beacon for entrepreneurs and capital investors. But it can do better with multinational companies if its corporate tax system can be reformed to combine a lower tax rate with a broader tax base that facilitates capital investment in general rather than benefiting only a few who are able to navigate through a complex tax structure.
Marginal Effective Rate Calculation
The marginal effective tax rate measures the tax impact on capital investment as a portion of the cost of capital. In considering a new investment, a firm will, like any rational investor, allocate capital to maximize profit. The assumption that firms are profit maximizers provides a starting point for calculating the METR. Firms increase investment when marginal returns cover marginal costs and reduce scale when marginal returns are less than marginal costs. Since it is only the marginal cost of investment, rather than the marginal return, that is directly observable, the METR uses marginal cost to calculate the measure. The METR is evaluated as the effective tax cost as a share of marginal investment costs net of economic depreciation and risk,3 which is also the pre-tax rate of return on capital. For example, if the pre-tax rate of return on capital (i.e., the tax-inclusive cost of capital) is 20 percent at the profit-maximizing point and the post-tax rate of return on capital (i.e., the tax-exclusive cost of capital) is 10 percent, the METR is 50 percent.
2 To update our cross-border tax comparison annually, we not only incorporate the legislated tax changes on an annual basis but also update the key non-tax parameters by country, such as the country-specific inflation rate and GDP share by sector—based on the latest statistics available. Updating the non-tax parameters is intended to keep our latest estimate of METR—a forward-looking tax indicator—as useful as possible for future investment and policy decisions. Applying these updated non-tax parameters to all the years contained in our latest model (2005–2013) helps keep intact our tracking of annual tax changes by country. Doing so, however, may result in variation in country-specific METRs for previous years, as between our current and earlier publications. For more technical discussion on the METR impact of various non-tax parameters, see Duanjie Chen & Jack Mintz, 2013 Annual Global Tax Competitiveness Ranking: Corporate Tax Policy at a Crossroads, University of Calgary School of Public Policy SPP Research Papers, vol. 6, iss. 5 (Nov. 2013), http://www.policyschool.ucalgary.ca/sites/default/files/research/mintz-2013-globtax.pdf.
3 Through loss provisions, governments share returns risk—we assume that most risk is shared although that need not be the case. For a discussion, see J. Mintz, The Corporation Tax: A Survey, 16 Fiscal Studies 23-68 (1995).

4
U.S. among Least Competitive on Marginal Effective Tax Rate
In our annual business tax competitiveness ranking,4 which is based on our calculation of marginal effective tax rates by country, the U.S. has been among the least tax-competitive countries for capital investment over the past nine years (see Table 1). The Canadian METR has been lower than that in the U.S. since 2007 thanks to the steady reduction in corporate income tax rates, elimination of the capital tax on non-financial corporations, and provincial sales tax harmonization that eliminated sales taxes on purchase of capital goods, all of which were a concerted effort made by both the federal and most provincial governments under different political parties over the past decade.
The U.S. Model is Out of Line with other METR Computations
Noting that our METR calculation has been in line with other METR computations such as those by Finance Canada and the Oxford University Center for Business Taxation,5 it was a surprise to see that a recent METR ranking presented by the White House and the U.S. Treasury (hereafter the “U.S. model”) showed Canada having a higher METR (33 percent) than that for the U.S. (29 percent) for 2011.6
How can that be given Canada’s much lower statutory corporate income tax rate (27.6 percent for 2011 and 26.1 percent for 2013) compared to that in the
4 Not to be confused with the Tax Foundation’s State Business Tax Climate Index, with which we have no involvement.
5 For the latest METR presentations by these two sources, see Finance Canada, Economic Action Plan 2012, Chapter 3.2 and Chart 3.2.1, http://www.budget.gc.ca/2012/plan/chap3-2-eng.html. See also Oxford University Centre for Business Taxation, K. Bilicka & M. Devereux, CBT Corporate Tax Ranking 2012 (June 2012).
6 See The White House & the Department of the Treasury, The President’s Framework for Business Tax Reform (Feb. 2012) at Table 1, http://www.treasury.gov/resource-center/tax-policy/Documents/The-Presidents-Framework-for-Business-Tax-Reform-02-22-2012.pdf.
Table 1. Corporate Tax Rates (%) on Capital Investment, Various Country Groups, 2005-2013 Marginal Effective Tax Rate Statutory Corporate Income Tax (CIT) Rate
2013 2012 2011 2010 2009 2008 2007 2006 2005 2013 2005 Change in %
points 2005-13
# of countries that have cut
the general CIT rate
U.S. 35.3 35.3 35.3 35.3 35.6 35.6 35.6 35.9 35.9 39.13 39.3 -0.21 n/a Canada 18.6 17.3 18.7 19.8 27.3 28.0 30.5 36.2 38.8 26.1 34.2 -7.9 n/a G-7 27.6 27.9 28.6 28.9 30.1 30.2 32.9 33.7 34.2 31.1 35.7 -4.6 5 G-20 24.5 24.5 28.0 28.0 28.0 28.1 33.5 33.5 33.5 31.1 35.7 -4.6 12 OECD (34)
19.6 19.5 19.7 19.6 19.8 20.1 21.0 21.6 22.4 25.5 28.2 -2.7 22
U.S. ranking by METR (highest to lowest) within various groups of countries G-7 1 1 1 1 1 1 1 2 2 G-20 2 2 2 2 2 3 3 4 6 OECD 1 1 1 1 1 1 1 2 2

5U.S. (39.1 percent)?7 The answer lies in the difference between our coverage of taxes and that of the U.S. model.
In theory, all the taxes affecting corporate income and payable by corporations should be included in calculating METR. These taxes include direct taxes, ranging from income taxes to asset-based taxes such as capital taxes and property taxes, to indirect taxes on purchase of capital goods, such as asset transaction taxes and sales taxes that are not based on value added. In practice, however, some taxes are not consistently measurable across all the tax regimes under study.
For example, for many of the OECD countries, including Canada and the U.S., the property tax is a sub-national tax that varies widely across localities and uses of property (e.g., commercial or industrial) in both the tax base and rate. It is extremely difficult, if not impossible, to come up with a national average property tax rate that is applicable to each industry in a consistent manner. Further, since many municipal property taxes are charges for services provided to residents and businesses such as water, sewage, and roads, one would typically need to net out related benefits from taxes for measurement purposes. For these reasons, we exclude property taxes in our model to ensure that all tax regimes are treated consistently.
The U.S. Model Inaccurately Depicts U.S. Property Tax Rate Parameters
In contrast, the U.S. model casually, and inconsistently, includes such a parameter across borders. For Canada, the U.S. model applied Toronto’s 4 percent property tax rate for industrial buildings in 2009 as the Canadian “effective real estate tax rate” while using a 1 percent “net wealth tax rate” as the U.S. counterpart.8 This simplified assumption overstates Canadian property tax rates while understating property taxes in the U.S. In fact, Toronto has one of the highest property tax rates in Canada and its current comparable rate is only 3 percent9 while the average urban commercial and industrial property taxes in the U.S. is close to 2 percent. Note also that, unlike in Canada, business property taxes in the U.S. are also applicable to machinery and equipment and in some states to inventory.10 This means that if the same national average property tax rate was 2 percent—or any rate—in both countries, the METR
7 All the statutory corporate tax rates quoted in this paper, except for the ten emerging economies within the G20, are adopted from the OECD Tax Database, Section C: Corporate and Capital Income Taxes, available at http://www.oecd.org/ctp/tax-policy/tax-database.htm. For the ten emerging economies within the G20, the statutory tax rates are adopted from Ernst & Young’s annual publication, Worldwide Corporate Tax Guide, for the period of 2005-2012.
8 This dataset can be found in M. P. Devereux et al., Effective Tax Levels Using the Devereux/Griffith Methodology, Project for the European Commission TAXUD/2008/CC/099 (Oct. 2009), at A-8, A-11, http://ec.europa.eu/taxation_customs/resources/documents/common/publications/studies/etr_company_tax.pdf.
9 See City of Toronto Revenue Services, Property Tax, http://www.toronto.ca/taxes/property_tax/tax_rates.htm.10 See Minnesota Taxpayers Association & Lincoln Institute of Land Policy, 50-State Property Tax Comparison
Study (Apr. 2011), http://www.lincolninst.edu/subcenters/significant-features-property-tax/upload/sources/ContentPages/documents/MTAdoc_NewCover.pdf.
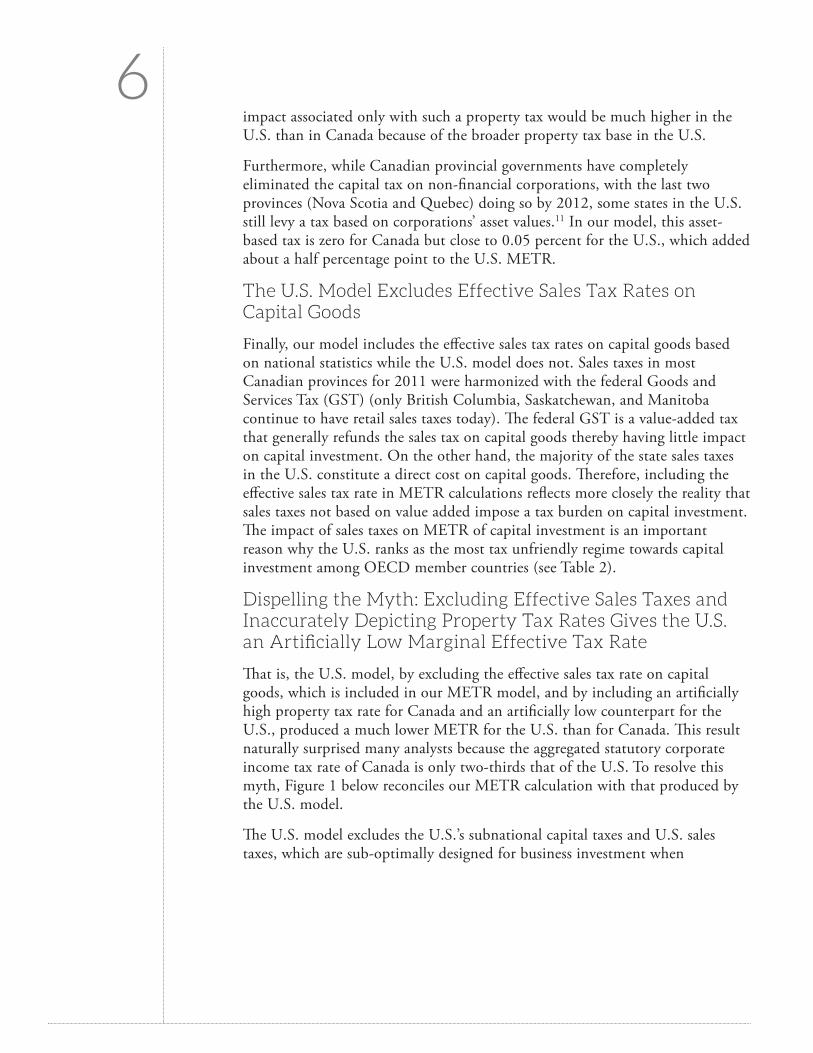
6impact associated only with such a property tax would be much higher in the U.S. than in Canada because of the broader property tax base in the U.S.
Furthermore, while Canadian provincial governments have completely eliminated the capital tax on non-financial corporations, with the last two provinces (Nova Scotia and Quebec) doing so by 2012, some states in the U.S. still levy a tax based on corporations’ asset values.11 In our model, this asset-based tax is zero for Canada but close to 0.05 percent for the U.S., which added about a half percentage point to the U.S. METR.
The U.S. Model Excludes Effective Sales Tax Rates on Capital Goods
Finally, our model includes the effective sales tax rates on capital goods based on national statistics while the U.S. model does not. Sales taxes in most Canadian provinces for 2011 were harmonized with the federal Goods and Services Tax (GST) (only British Columbia, Saskatchewan, and Manitoba continue to have retail sales taxes today). The federal GST is a value-added tax that generally refunds the sales tax on capital goods thereby having little impact on capital investment. On the other hand, the majority of the state sales taxes in the U.S. constitute a direct cost on capital goods. Therefore, including the effective sales tax rate in METR calculations reflects more closely the reality that sales taxes not based on value added impose a tax burden on capital investment. The impact of sales taxes on METR of capital investment is an important reason why the U.S. ranks as the most tax unfriendly regime towards capital investment among OECD member countries (see Table 2).
Dispelling the Myth: Excluding Effective Sales Taxes and Inaccurately Depicting Property Tax Rates Gives the U.S. an Artificially Low Marginal Effective Tax Rate
That is, the U.S. model, by excluding the effective sales tax rate on capital goods, which is included in our METR model, and by including an artificially high property tax rate for Canada and an artificially low counterpart for the U.S., produced a much lower METR for the U.S. than for Canada. This result naturally surprised many analysts because the aggregated statutory corporate income tax rate of Canada is only two-thirds that of the U.S. To resolve this myth, Figure 1 below reconciles our METR calculation with that produced by the U.S. model.
The U.S. model excludes the U.S.’s subnational capital taxes and U.S. sales taxes, which are sub-optimally designed for business investment when

7Table 2. Marginal Effective Tax Rate on Capital Investment, OECD Countries, 2005 – 2013 Marginal Effective Tax Rate Reference: Statutory
Company Income Tax Rate*
2013 2012 2011 2010 2009 2008 2007 2006 2005 2013 2005 Change in %
points U.S. 35.3 35.3 35.3 35.3 35.6 35.6 35.6 35.9 35.9 39.1 39.3 -0.1 France 35.2 35.2 35.2 34.0 35.1 35.1 35.1 35.1 35.4 34.4 35.0 -0.5 Korea 30.1 30.1 30.1 30.1 30.1 32.8 32.8 32.8 32.8 24.2 27.5 -3.3 Japan 29.3 31.5 31.5 31.5 31.5 31.5 31.5 31.5 31.5 37.0 39.5 -2.6 Austria 26.2 26.2 26.2 26.2 26.2 26.2 26.2 26.2 26.2 25.0 25.0 0.0 Spain 26.0 26.0 26.0 26.0 26.0 26.0 28.2 30.3 30.3 30.0 35.0 -5.0 Australia 25.9 25.9 25.9 25.9 25.9 25.9 25.9 25.9 25.9 30.0 30.0 0.0 UK 25.9 26.9 27.1 29.1 29.0 28.8 30.0 30.0 30.0 23.0 30.0 -7.0 Italy 24.5 24.5 28.0 28.0 28.0 28.1 33.5 33.5 33.5 27.5 33.0 -5.5 Germany 24.4 24.4 24.4 24.4 24.4 24.4 34.0 34.0 34.0 30.2 38.9 -8.7 Norway 24.4 24.4 24.4 24.4 24.4 24.4 24.4 24.4 24.4 28.0 28.0 0.0 Portugal 22.9 22.9 20.8 20.8 18.8 18.8 18.8 19.6 19.6 31.5 27.5 4.0 New Zealand 21.6 21.6 21.6 18.2 18.2 18.2 20.5 20.5 20.5 28.0 33.0 -5.0 Denmark 19.1 19.1 19.1 19.1 19.1 19.1 19.1 21.7 21.7 25.0 28.0 -3.0 Canada 18.6 17.4 18.7 19.8 27.3 28.0 30.9 36.2 38.8 26.3 34.2 -7.9 Belgium 18.5 18.5 18.5 18.5 18.5 18.5 18.0 18.0 23.5 34.0 34.0 0.0 Greece 18.1 11.3 11.3 13.2 13.7 13.7 13.7 15.8 17.5 26.0 32.0 -6.0 Finland 17.5 17.5 18.7 18.7 18.7 18.7 18.7 18.7 18.7 24.5 26.0 -1.5 Switzerland 17.5 17.5 17.5 17.5 17.5 17.5 18.0 18.0 18.0 21.1 21.3 -0.2 Netherlands 17.5 17.5 17.5 17.5 17.5 17.5 17.5 20.7 22.3 25.0 31.5 -6.5 Mexico 17.4 17.4 17.4 17.4 16.0 16.0 16.0 16.7 17.4 30.0 30.0 0.0 Luxembourg 17.3 17.0 17.0 16.8 16.8 18.5 19.4 19.4 19.9 29.2 30.4 -1.2 Estonia 17.1 17.1 17.1 17.1 17.1 17.1 18.1 19.1 20.2 21.0 24.0 -3.0 Hungary 16.1 16.1 16.1 16.1 16.6 16.6 16.6 15.3 14.7 19.0 16.0 3.0 Sweden 16.1 19.5 19.5 19.5 19.5 20.9 20.9 20.9 20.9 22.0 28.0 -6.0 Slovak Rep. 15.7 12.7 12.7 12.7 12.7 12.7 12.7 12.7 12.7 23.0 19.0 4.0 Israel 15.0 15.0 14.3 15.0 15.8 16.5 18.0 19.5 19.5 25.0 34.0 -9.0 Poland 14.6 14.6 14.6 14.6 14.6 14.6 14.6 14.6 14.6 19.0 19.0 0.0 Iceland 14.2 14.2 14.2 12.6 10.4 10.4 12.6 12.6 18.0 20.0 18.0 2.0 Czech Rep 12.7 12.7 12.7 12.7 13.5 14.2 16.5 16.5 18.0 19.0 26.0 -7.0 Ireland 10.1 10.1 10.1 10.1 10.1 10.1 10.1 10.1 10.1 12.5 12.5 0.0 Slovenia 9.8 10.5 11.8 11.8 12.4 13.1 13.8 14.5 15.2 17.0 25.0 -8.0 Chile 7.7 7.7 7.7 6.7 6.7 6.9 7.1 7.3 7.3 20.0 17.0 3.0 Turkey 5.7 5.7 5.7 5.7 5.7 5.7 5.7 5.7 10.9 20.0 30.0 -10.0 OECD Average: Weighted* 28.5 28.8 29.0 29.1 29.5 29.6 30.8 31.2 31.5 32.9 35.5 -2.6 Unweighted 19.6 19.5 19.7 19.6 19.8 20.1 21.0 21.6 22.4 25.5 28.2 -2.7 Note: G-7 countries are in bold. * Weighted by the average GDP for 2005-2011 in 2005 constant U.S. dollars.

8
11 For example, the corporate excise tax in Massachusetts consists of two parts: a tax on net income (9.5 percent), and a tax on either tangible property that is not subject to local taxation or net worth (0.26 percent). Other states that impose such a net worth-based tax, in addition to the corporate income tax, include New Hampshire (0.75 percent), New York (0.09 percent), and Ohio (0.4 percent).
compared to the predominately VAT-based sales taxes in Canada. As Figure 1 shows, starting from our METR calculation for 2013 that includes effective subnational capital taxes (0.05 percent in the U.S. and zero in Canada) and effective sales taxes that are not on a valued-added base (2.3 percent in the U.S. and 0.6 in Canada), the Canadian METR is 18.6 percent and the U.S. 35.3 percent. By excluding the effective subnational sales taxes and capital taxes, the METR dropped to 15.7 and 27.2 percent for Canada and the U.S. respectively. This METR gap of 11.5 percentage points is very close to the gap (13 percentage points) in statutory corporate tax rates between the two countries (26.1 percent in Canada versus 39.1 percent in the U.S.).
This gap may shrink to 10.7 percentage points if we further exclude the non-temporary investment tax credits (ITC), which in aggregate are more generous in Canada than in the U.S., making the METR 17.4 percent for Canada and 28.1 percent for the U.S. The remaining difference between this 10.7 percentage point METR gap and the 13 percentage point gap in statutory corporate tax rates is due to Canada’s depreciation regime that more accurately reflects true cost of investment.12
18.6 15.7
17.4
32.7 35.3
27.9 27.2 28.1 31.2
0
5
10
15
20
25
30
35
40
2013* Excl. provincial sales tax
CIT only/excl. ITC
Incl. a 4% real estate
tax**
2011-2013* Excl. state sales tax
Excl. state capital tax
CIT only/excl. ITC
Incl. a 1% net-wealth
tax**
Figure 1. Marginal Effective Tax and Royalty Rate (in percent) 2013 Canada vs. USA
The US Canada
*Authors’ original calculation.**Parameters that are used by the White House and U.S. Treasury but do not reflect national realities consistently.

9From this baseline, if we add the 4 percent real estate tax and the 1 percent net wealth tax to our METR model for Canada and the U.S. respectively and apply them only to real estate (i.e., buildings and land), we arrive at METRs of 32.7 percent for Canada and 31.2 percent for the U.S., which are close to those presented by the White House and the U.S. Treasury for their 2011 METR ranking.
Note that, like any asset-based taxes, the real estate tax has a much higher METR impact compared to the income tax when it is a significant share of pretax rates of return. For example, if the pre-tax return on structures and land, net of risk, is 6 percent, a 4 percent real estate tax is equivalent to a 66.7 percent effective tax rate. Given the significant share of structures of total investment, this explains why the 4 percent real estate tax rate raised the Canadian METR by over 15 percentage points while the 1 percent real estate tax raised the U.S. METR by 3 percentage points.
We have thus solved the myth in METR ranking for Canada versus U.S. produced by the official U.S. model.13 That is, the myth was a combined result of excluding the retail sales taxes on capital inputs and a rushed application of inconsistent assumptions of “national” property tax rates.
Dispersion in Marginal Effective Tax Rates in the United States
The U.S. corporate tax system is not only uncompetitive with high statutory and effective rates but it is also non-neutral with effective rates varying by asset and industry. With unequal tax burdens on business activities, the tax system distorts the allocation of capital in the U.S. economy with some businesses bearing more tax than others on capital investment. A more level playing field would result in capital flowing from preferentially treated business activities with low marginal returns to those earning higher marginal returns to cover tax costs.
Differing Tax Treatment across Industries Creates Economic Distortions
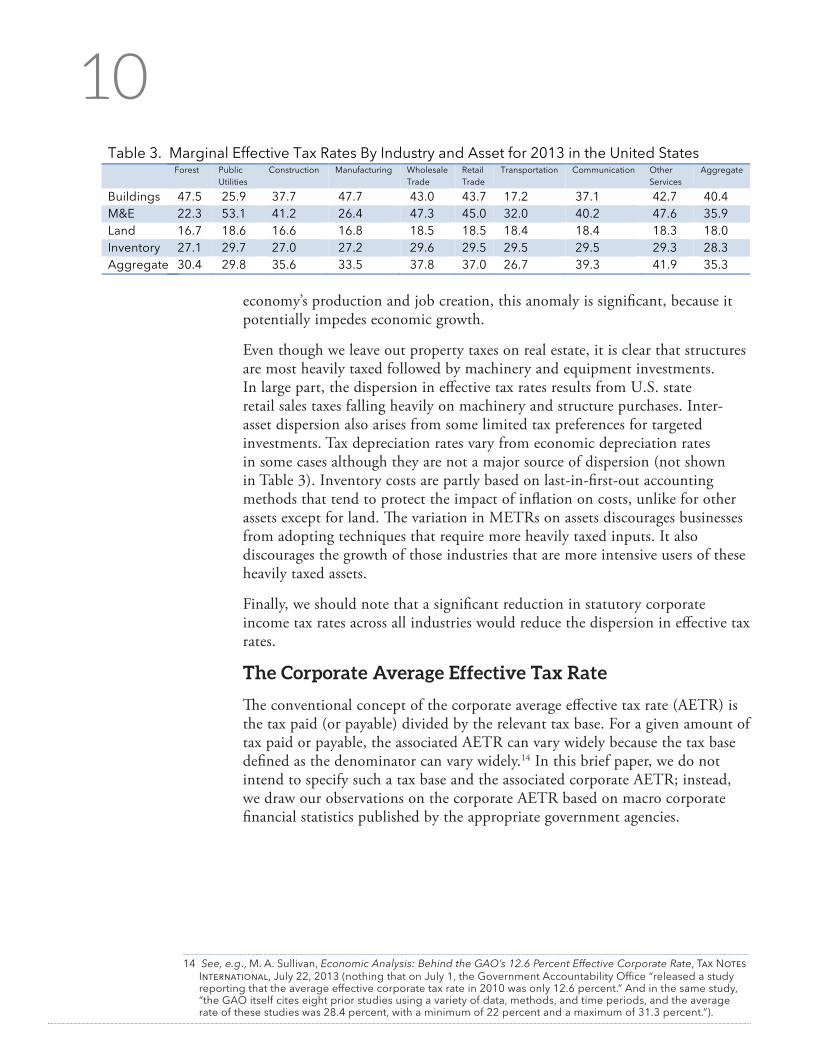
Table 3 provides a breakdown of our estimated marginal effective tax rate by major asset and industry for the U.S. economy. The U.S. corporate tax system imposes a heavier tax burden on most services compared to forestry, utilities, and transportation and storage. This inter-industry dispersion is in part due to the preferential corporate income tax rate applied to manufacturing and other profits. Given the importance of the services sector in terms of its share of the
12 The Canadian corporate tax system, compared to that of the United States, provides somewhat more generous depreciation allowances with shorter asset lives but is more restrictive in inventory accounting.
13 A technically more serious reconciliation requires checking through the non-tax data applied to the METR models involved. Therefore, our reconciliation between the two METR models here provides only a preliminary investigation into the tax parameters.
10
economy’s production and job creation, this anomaly is significant, because it potentially impedes economic growth.
Even though we leave out property taxes on real estate, it is clear that structures are most heavily taxed followed by machinery and equipment investments. In large part, the dispersion in effective tax rates results from U.S. state retail sales taxes falling heavily on machinery and structure purchases. Inter-asset dispersion also arises from some limited tax preferences for targeted investments. Tax depreciation rates vary from economic depreciation rates in some cases although they are not a major source of dispersion (not shown in Table 3). Inventory costs are partly based on last-in-first-out accounting methods that tend to protect the impact of inflation on costs, unlike for other assets except for land. The variation in METRs on assets discourages businesses from adopting techniques that require more heavily taxed inputs. It also discourages the growth of those industries that are more intensive users of these heavily taxed assets.
Finally, we should note that a significant reduction in statutory corporate income tax rates across all industries would reduce the dispersion in effective tax rates.
The Corporate Average Effective Tax Rate
The conventional concept of the corporate average effective tax rate (AETR) is the tax paid (or payable) divided by the relevant tax base. For a given amount of tax paid or payable, the associated AETR can vary widely because the tax base defined as the denominator can vary widely.14 In this brief paper, we do not intend to specify such a tax base and the associated corporate AETR; instead, we draw our observations on the corporate AETR based on macro corporate financial statistics published by the appropriate government agencies.
Table 3. Marginal Effective Tax Rates By Industry and Asset for 2013 in the United States Forest Public
Utilities Construction Manufacturing Wholesale
Trade Retail Trade
Transportation Communication Other Services
Aggregate
Buildings 47.5 25.9 37.7 47.7 43.0 43.7 17.2 37.1 42.7 40.4 M&E 22.3 53.1 41.2 26.4 47.3 45.0 32.0 40.2 47.6 35.9 Land 16.7 18.6 16.6 16.8 18.5 18.5 18.4 18.4 18.3 18.0 Inventory 27.1 29.7 27.0 27.2 29.6 29.5 29.5 29.5 29.3 28.3 Aggregate 30.4 29.8 35.6 33.5 37.8 37.0 26.7 39.3 41.9 35.3
14 See, e.g., M. A. Sullivan, Economic Analysis: Behind the GAO’s 12.6 Percent Effective Corporate Rate, Tax Notes International, July 22, 2013 (nothing that on July 1, the Government Accountability Office “released a study reporting that the average effective corporate tax rate in 2010 was only 12.6 percent.” And in the same study, “the GAO itself cites eight prior studies using a variety of data, methods, and time periods, and the average rate of these studies was 28.4 percent, with a minimum of 22 percent and a maximum of 31.3 percent.”).

11Figure 2. The U.S. Corporate Income Tax: Rate vs. Revenue (as % of GDP)
Based on Bureau of Economic Analysis, Tables 1.14 and 7.16
0
5
10
15
20
25
30
35
40
2000 2001 2002 2003 2004 2005 2006 2007 2008 2009 2010
Taxable income as % of GDP
CIT as % of GDP
Profit as % of GDP
Statutory CIT rate
Average Effective CIT rate*
*Estimated as the ratio of “taxes on corporate income” net of “payments by the federal reserve banks” to “corporate profits” net of “income organizations (including federal reserve banks) not filing corporate tax returns.”
0
5
10
15
20
25
30
35
40
2000 2001 2002 2003 2004 2005 2006 2007 2008 2009 2010
CIT revenue as % of GDP
Taxable income as % of GDP
Average Effective CIT rate*
Net profit as % of GDP
Statutory CIT rate
* Obtained from Cansim Database, v21584924-Income taxes to taxable income; Total all industries.
Figure 3. Canadian Corporate Income Tax: Rate vs. Revenue (as % of GDP) Based on Statistics Canada, Financial and Taxation Statistics for Enterprises

12Figure 2 provides statutory corporate income tax rates along with an effective corporate income tax rate and corporate profits, taxable income and corporate income tax revenue as a share of GDP.15 As a comparison, Figure 3 provides Canadian counterparts of the U.S. indicators shown in Figure 2.
Note that while the Canadian effective corporate income tax rate is an official estimate published by Statistics Canada, the U.S. effective corporate income tax rate is our estimate of the ratio of “taxes on corporate income” (net of the payment made by the Federal Reserve banks) to “corporate profits without inventory adjustment,” which is net of income of organizations, including Federal Reserve banks, that do not file corporate income tax returns. It is important to remember that this simplified calculation of AETR underestimates the effective corporate income tax rate in the U.S. since the tax base (i.e., corporate profits without inventory adjustment) used in our calculation is a mixture of profits made by both C and S corporations, which are not subject to corporate income taxes.16
The three following observations can be drawn from a comparison between the U.S. (Figure 2) and Canada (Figure 3) with respect to their corporate income tax structures, as indicated by the relationship between the effective and statutory corporate income tax rates and other tax indicators.
High Corporate Tax Rates Do Not Necessarily Bring in High Corporate Tax Revenues
First, if revenue collection is the main purpose of taxation, then an excessively high corporate income tax rate does not necessarily bring in high corporate tax revenue; an excessively high tax rate can even be accompanied by large fluctuations in tax revenue. For example, despite the fact that the statutory corporate income tax rate barely changed over the past ten years (from 39.3 to 39.1 percent) in the U.S., the corresponding corporate income tax revenue as a share of GDP fluctuated significantly between 1.8 percent (2002) and 3.4 percent (2006).
In contrast, the Canadian statutory corporate income tax rate has dropped from 42.4 percent (2000) to 29.4 percent (2010), and the corresponding tax revenue as a share of GDP was rather stable, swinging only between 3.1 percent (2002) and 3.8 percent (2006). It is also interesting to note that the low and high years (2000 and 2006) for corporate tax collection are the same in both countries, which indicates that, aside from the tax structure, the economic cycle, and thus the profit cycle, is the main determinant of corporate tax revenue.
15 Our calculation of the average effective corporate income tax rate (as shown in Figure 2) is based on the NIPA tables published by the Bureau of Economic Analysis, specifically Table 1.14 and Table 7.16.
16 Thanks to William McBride at the Tax Foundation for the note on the inclusion of both S corps and C corps in the BEA data.

13Low Rates and Broad Bases Lead the Statutory and Effective Tax Rates to Converge
Second, a tax structure featuring a low rate and a broad base can lead to convergence between the statutory and the effective tax rates and vice versa. For example, as its statutory corporate income tax rate has dropped steadily, the Canadian average effective corporate income tax rate appears to converge with its statutory tax rate over time, partly reflecting base changes and the using up of the carry forward of past losses. In contrast, the U.S. effective corporate income tax rate, regardless of how it is defined, does not show any correlation with its statutory corporate tax rate.
Note that the statutory corporate income tax rate shown in Figures 2 and 3 is the top corporate tax rate, and both Canada and the U.S. provide reduced tax rates for small corporations. Therefore, it is reasonable to see an overall effective corporate income tax rate as being below the top statutory corporate income tax rate. However, when the effective tax rate does not follow the pattern of the top statutory tax rate but diverges from it considerably, it indicates a swing related to irregular policy changes (e.g., temporary, discretionary, or both types of income tax credits on a large scale), new tax planning that succeeds in reducing tax liabilities on a given taxable income, or both.
Excessively High U.S. Corporate Tax Rates Have Led to a Smaller U.S. Corporate Sector
Finally, the excessively high corporate income tax rate in the U.S. appears to have led to a smaller corporate sector in relation to the overall economy. Canadian corporate net profit has been well above 10 percent of GDP since 2003 when the corporate tax rate dropped to below 36 percent, and Canadian corporate taxable income also moved steadily to above 10 percent of GDP even during the recent period of financial crisis. This possibly reflects a reduced incentive to shift profits out of Canada. It could also reflect more use of the corporate form by small businesses, because Canada avoids double taxation of corporate income passed on to shareholders with its dividend tax credit and partial exclusion of capital gains from taxation (in other words, an integrated corporate and personal income tax system).
In contrast, there were only three years during period of 2000 to 2010 when corporate net profits in the U.S. reached above 10 percent of GDP and there was only one year (2006) when U.S. corporate taxable income reached 10

14
SPECIAL REPORT(ISSN 1068-0306) is published at least 6 times yearly by the Tax Foundation, an independent 501(c)(3) organization chartered in the District of Columbia.
The Tax Foundation is a 501(c)(3) non-partisan, non-profit research institution founded in 1937 to educate the public on tax policy. Based in Washington, D.C., our economic and policy analysis is guided by the principles of sound tax policy: simplicity, neutrality, transparency, and stability.
©2014 Tax Foundation
Editor, Donnie Johnson
Tax FoundationNational Press Building529 14th Street, NW, Suite 420Washington, DC 20045-1000
202.464.6200
taxfoundation.org
percent of GDP. It is no wonder that U.S. corporate tax revenue as a share of GDP has been below that of Canada. It seems reasonable to suggest that the high statutory corporate income tax rate encouraged corporations to shift profits to other jurisdictions, including Canada. It also reflects the actions of discouraged U.S. entrepreneurs from incorporating their business activities by choosing instead limited liability partnerships and other organizational forms that avoid double taxation at the corporate and personal levels; such actions have been dubbed “distorporation” in a recent issue of The Economist.17
Conclusion
Unlike in Canada where income earned and taxes paid by corporations appear to correlate with each other along with explainable economic interruptions, U.S. business taxation is distorting. The excessively high corporate income tax rate has become a cause of tax inefficiency and ineffectiveness by leading businesses to excessive tax planning and tax-induced avoidance of incorporation. We are aware that both the government and the business sector in the U.S. are interested in reforming their corporate tax system. We want to point out, however, that the messy picture of U.S. effective corporate tax rates only reflects the inefficiency and complexity of the U.S. corporate tax system; it should not be used as an excuse for delaying its reform.
17 The New American Capitalism: Rise of the Distorporation, The Economist, Oct. 26, 2013, http://www.economist.com/news/briefing/21588379-mutation-way-companies-are-financed-and-managed-will-change-distribution.