Embed Size (px)
Citation preview

The U.S. Cattle and Beef Industryand the Environment©
J. Richard ConnerRaymond A. DietrichGary W. Williams*
TAMRC Commodity MarketResearch Report No. CM-1-00
March 2000
© World Wildlife Fund, 2000. All rights reserved.
* The authors are Professors, Department of Agricultural Economics, Texas A&M University,College Station, Texas. In addition, Dr. Williams is Director, Texas Agricultural MarketResearch Center.
The U.S. Cattle and Beef Industry and the Environment©
A Texas Agricultural Market Research Center (TAMRC) report, number CM-1-00, by J. RichardConner, Raymond A. Dietrich, and Gary W. Williams, Department of Agricultural Economics,Texas A&M University, College Station, Texas, March 2000. © World Wildlife Fund, 2000. Allrights reserved. This report was conceived and commissioned by the World Wildlife Fund (WWF)as part of its Conservation and Commodities Initiative. A version of this report will be part of afuture series of reports to be published by WWF.
Abstract: The relationship of the U.S. cattle and beef industry to the environment is strongly rootedin its historical development, structure, and characteristics. Drawing on a detailed, segment bysegment discussion of the industry, this report analyzes the important interactions of the cattle andbeef industry with the environment. Trends in technology, policy, competitive forces and otherfactors that may force changes in the future relationship of the industry with the environment arealso examined. Finally, the environmental challenges of the industry are summarized with emphasison the status of efforts to solve those challenges and potential alternative solutions and resourceconstraints to dealing with them.
Acknowledgments: The study reported here was commissioned by the World Wildlife Fund(WWF) with funding provided by the Joyce Foundation. The authors are grateful for helpfulcomments and suggestions from David Schorr, Jason Clay, Ford Runge, and Cornelia Flora. Anyremaining errors or omissions, however, are the sole responsibility of the authors. The resultsprovided and conclusions drawn in this report do not necessarily reflect those of WWF or the JoyceFoundation.
The Texas Agricultural Market Research Center (TAMRC) has been providing timely, unique,and professional research on a wide range of issues relating to agricultural markets andcommodities of importance to Texas and the nation for thirty years. TAMRC is a market researchservice of the Texas Agricultural Experiment Station and the Texas Agricultural Extension Service.The main TAMRC objective is to conduct research leading to expanded and more efficient marketsfor Texas and U.S. agricultural products. Major TAMRC research divisions include International

ii
Market Research, Consumer and Product Market Research, Commodity Market Research,Information Systems Research, and Contemporary Market Issues Research.
The U.S. Cattle and Beef Industry and the Environment
Executive Summary
The particular way in which the U.S. cattle and beef industry has developed over time and theresulting structure and characteristics of the industry have contributed importantly to the type andextent of the impact of the industry on the environment. Because an understanding of how the U.S.cattle and beef industry impacts the environment requires an understanding of the industry itself andthe forces that drive or create obstacles to change within the industry, this report first provides adetailed overview of the history, structure, and characteristics of the various segments of the industryfrom cattle production, feeding, and slaughtering to beef wholesaling and retailing and how thosesegments work togther as an integrated commodity system. Based on that overview, the particularinteractions of the U.S. cattle and beef industry with the environment are identified and analyzed,including a consideration of the potential for environmental improvements and impediments tochange. Future trends in technology, policy, competitive forces and other factors that may forcechanges in the way in which the cattle and beef industry impacts the environment in the future arethe explored. Finally, the environmental challenges of the U.S. cattle and beef industry and theobstacles to change are summarized with emphasis on the status of current efforts to solve theenvironmental problems posed by cattle and beef production, the challenges that remain, andpotential alternative solutions and resource constraints to dealing with the remaining challenges.
Domestic meat and draft animals are not native to America. Rather, they were introduced by earlySpanish explorers in the early 1500s. Cattle were raised on a range system, primarily for milk anddraft purposes. Prior to the Civil War, cattle had begun to move in large numbers into Texas andstates west of the Mississippi, including California. The center of the U.S. cattle and beef industrymigrated westward from western Kentucky in 1860 to Kansas by the late 1890s. With the westernmigration of the cattle industry in the 1800s, the number of total U.S. cattle and calves more thandoubled by 1900 and then doubled again by 1970.
Commercial cattle feeding and beef packing operations both experienced major growth in the 1800sand followed cattle production westward. By the late 1800s, the Corn Belt was the primary U.S.cattle feeding region. In the 1950s, a concentration of large-scale commercial feedlot operationsfirst appeared in California. A proliferation of large-scale commercial cattle feeding soon followedin other areas. After 1970, cattle feeding began shifting away from the Corn Belt due primarily tothe lack of economy of size for most feedlot operations and the absence of continuous specializedmanagement in cattle feeding. Currently, the predominant cattle feeding regions are the NorthernPlains, the Southern Plains, and the Mountain states.

iii
Chicago became the dominant U.S. meat packing center by the late 1800s. Between the 1920s andthe 1960s, federal regulations, technological advances in truck transportation, a developing nationalhighway system and construction of farm to market roads, and an emerging cattle feeding industryencouraged decentralization of concentrated slaughter from close to consumption or populationcenters like Chicago toward areas of production in the Midwest and Texas. In recent years,commercial cattle slaughter and the increasingly sophisticated beef processing and boxed beefoperations have became increasingly concentrated once again in a relatively few large, specialized,and highly efficient cattle slaughter and beef processing operations. The share of total boxed beefprocessed by the top four firms increased from 53% in 1980 to 90% by 1997.
Although generally trending upward between 1867 and 1970, the growth of the U.S. cattle industrywas broken by at least 7 major peaks and troughs (cattle cycles). Since 1970, however, the totalnumber of cattle and calves produced, fed, and slaughtered has declined substantially. Nevertheless,commercial beef production has continued to increase reflecting both changes in U.S. beefproduction practices and changes in the proportion of slaughter cattle finished in U.S. feedlots tosatisfy the demand for beef by U.S. consumers.
In the U.S. meat retailing sector, the number of grocery stores began a dramatic decline in the 1930sdue primarily to the demise of small grocery stores which were unable to compete with the largergrocery retailers such as the supermarkets. By 1965, supermarkets were the dominant form ofgrocery business, accounting for 70% of total grocery sales. The U.S. grocery store industry of the1990s is characterized by large supermarkets representing less than 25% of the grocery stores butaccounting for more than 75% of grocery sales.
The major forces currently impacting the cattle and beef industry and its future will likely focus onsuch questions as (1) how to compete more effectively with the poultry and pork industries in aconsumer-driven domestic market, (2) how to remain competitive and expand the market for beefin the international market, (3) how to produce a product which more nearly meets the concerns ofhealth-conscious consumers while also maintaining product quality and consistency attributes, (4)how to develop industry technological and structural changes which reduce cost of production, and(5) how to collaborate more effectively with regulatory agencies to assure food safety, animaldisease control, and provide for the long-term integrity of the environment consistent with commongoals of society and industry survival.
Both direct and indirect impacts on the environment are by-products of the production of cattle andbeef. The most significant direct impact of the U.S. cattle industry is the alteration of thecomposition of native plant communities and the associated impacts on wildlife (through habitatdisruption) and biodiversity. Plant communities have been altered over much of the U.S. due todirect intervention such as plowing up native vegetation and establishing monocultural swards ofderived pasture forages or by continuous overstocking of native rangelands with livestock andeliminating periodic burning from the use of fossil-based energy.
Cattle feeding presents perhaps the greatest potential of the U.S. cattle and beef industry fornegatively impacting the environment. Among potential direct impacts of cattle feeding are the

iv
contributions to air pollution through odors and dust and to surface and ground water pollutionthrough nutrient loading from improper handling of manure given the concentrations of largenumbers of animals in relatively small areas.
The major impact of the cattle and beef industry on the environment, however, is the likely indirectimpact through the demand for feedgrains by cattle feeders on the production of feedgrains which,in turn, generates significant soil, air, water, and other resource impacts. The U.S. beef cattleindustry, however, utilizes only a small portion of the total annual supply of feed grains (e.g., onlyabout 10% of the U.S. corn supply) which limits its environmental impact.
Despite current and past efforts to ameliorate the environmental impacts of the cattle and beefindustry, a number of obstacles and challenges remain. The primary obstacles are rooted in thebiological makeup of the bovine animal. The unique ability of cattle to utilize grazed forages hasled to a cow-calf and stocker industry characterized by many relatively small producers who arewidely dispersed geographically. In addition, many of the small operators, and some of the largerones, are motivated to produce cattle by goals other than financial gain and efficiency; e.g., lifestyle.The more concentrated and financially motivated segments of the industry (feedlot, slaughter,processing and retail companies) are forced to utilize the highly variable quantity (seasonally) andquality of animals provided by the cow-calf and stocker producers. This highly atomistic, widelydispersed and economically insensitive portion of the industry limits the ability of the entire beefindustry to make adjustments of any kind whether market (price) or socio-culturally induced.
An entrenched institutional obstacle to changes in the environmental interface of the cattle and beefindustry is the highly competitive, consumer-driven market within which the industry operates andwhich provides strong economic incentives for cattle feeding. Over the past several decades, beefhas lost significant market share to poultry, primarily because consumers have increasingly viewedpoultry as a less expensive, more convenient, and healthier source of protein which is consistentlytasty and tender. In competing with poultry and pork, the beef industry has tried to improve thereputation of its product by emphasizing the more consistent good taste, tenderness and availabilityachieved through grain-finished beef. Price competition with poultry and pork has also supportedthe trend toward larger portions of total beef slaughtered being finished in feedlots.
Social and cultural forces also create obstacles to environmentally appropriate changes in the cattleand beef industry. The U.S. and many other developed countries are no longer agrarian societies.Most of the population of the U.S. and many other countries live in an urban, industrialized society,largely dependent on energy from fossil fuels for their existence. Along with the trend towardsurbanization, consumerism and related socio-cultural trends have become the defining characteristicsof our culture. Consequently, few members of our society are well attuned to the relationshipbetween their well being and the natural environment. Such socio-cultural changes along with theunprecedented world population explosion and other economic and political forces have focusedsociety on the pursuit of personal satisfaction through the accumulation of wealth and materialpossessions, the demand for convenience, and the utilization of growing leisure time satisfyingpersonal curiosities while at the same time using up our natural resources and our ecology’s abilityto assimilate our wastes at clearly unsustainable rates.

v
Despite the obstacles, some progress has been made in improving the impact of the cattle-beefindustry on the environment. Most notably, cattle producers and land managers have, throughreduced grazing pressure and other management practices, succeeded in improving the ecologicalcondition of much of the nation’s rangelands over the conditions which existed in the early decadesof this century. There is also increasing evidence that cattle producers and land managers arerecognizing the importance of wildlife and biodiversity and are managing for improved wildlifehabitat along with or, in some cases, instead of enhanced livestock grazing.
Environment improvements in the cattle feeding sector have largely been forced by governmentregulation. Over the years, the EPA and its state agencies have increasingly focused on feedlots aspoint sources of pollution and have become increasingly stringent and vigilant in their regulationsof potential pollutants from feedlots. Because regulatory pressure is expected to continue and evenincrease, the cattle feeding industry will not likely contribute to significant additional environmentaldamage in the future.
Improvements have also come through educational programs. In recent decades, a great deal ofattention and public information effort has been devoted to educating the public about the potentialenvironmental dangers of technology and the rates of resource use. While much has been done toinsure the maintenance of clean air and water and preserve biodiversity through protection ofendangered species, notably less has been done in other areas, including, for example, reducing therate of fossil energy consumption and its resultant increased levels of atmospheric CO2.
Despite some successes in reducing the negative impacts of the cattle and beef industry on theenvironment, many challenges remain. Many plant communities in the U.S. have been so severelyaltered by extensive cattle production that, even if livestock grazing were eliminated completely,they would never recover to their original ecological state without the use of expensive restorationpractices. Due to the vast number of acres involved and the fact that many of these degraded plantcommunities are now in relatively stable, although altered, ecological states, most of this land willlikely remain in an altered ecological state indefinitely.
The economic conditions favoring grain finishing over forage finishing of cattle will continue to bethe major environmental challenge of the U.S. cattle and beef industry. The U.S. beef consumer isconditioned to and demands the consistency in taste, tenderness, and availability in beef that is mucheasier to produce with grain finishing compared to forage finishing of cattle. In most cattleproducing areas of the U.S., forage-based fattening systems are seasonal and subject to a high degreeof variation in the volume and quality of the resulting beef product due to fluctuating forage growingconditions (e.g. drought). Given these conditions relative to forage-based finishing, the competitionfrom pork and poultry, and the current and projected prices of fossil fuels and feed grains, the U.S.cattle feeding industry faces a severe challenge in reducing its direct and indirect contributions toresource degradation through reductions in use of feedlots for grain finishing of beef cattle for theforeseeable future.
Given our current culture and fossil energy-based economy, the challenge of achieving furtherprogress in reducing the rate of consumption of natural resources and the assimilative capacity of

vi
our environment is formidable. Our representative form of government and the consumer-mindedelectorate make the political task of implementing environmentally friendly regulations with thepresumed negative economic impacts extremely difficult, particularly in major livestock and beefproducing states. Additionally, the challenge is made more difficult in that some of the majorenvironmental problems are truly global in scale, such as increased levels of atmospheric CO2 ,methane, etc. The solutions to these problems require multi-national concessions, agreements, andprograms. The difficulty in achieving progress on this scale is exemplified by the slow rate ofprogress to date resulting from “The United Nations Conference on Environment and Development”held in Rio de Janeiro in June 1992 and similar efforts.
Alternative solutions to deal with the existing environmental challenges posed by the cattle and beefindustry are few and the resource constraints onerous. While further degradation of wildlife habitatand biodiversity as a result of cattle production seems unlikely given the current trends, efforts toeducate cattle producers and land managers regarding the potential benefits of enhanced wildlifehabitat and biodiversity should be continued or even expanded. Also, given the opportunity to usewildlife profitably, most livestock ranchers will actively preserve wildlife habitat.
One alternative to encourage increased forage-finishing over grain-finishing of cattle is to educateconsumers that forage-finished beef is both a healthier (reduced fat) and an environmentallyfriendlier product. This strategy is, in fact, being used by some up-scale restaurants featuring“speciality” meats and in some grocery meat markets specializing in “organic” or “natural” foods.One problem with this approach, in addition to variability in quality and availability, is that muchof the forage grazed by cattle is fertilized with non-organic chemicals and in some cases is subjectedto use of chemical pesticides. Also, many of the cattle in the forage-finishing production systemsare treated with anabolic steroids and/or other pharmaceuticals and/or pesticides.
An often mentioned general solution to environmental pollution is to force consumers to pay the fullcost of the use of fossil-based energy, including the disposal cost of resultant wastes, through acarbon tax. Research suggests that success in achieving a reduction in fossil fuel use through acarbon tax would make grain and other foods directly derived from plant products less expensiverelative to animal-based food products derived from the feeding of grain to cattle, reducing meatconsumption, and cattle and beef production. Measures like a carbon tax, however, are going to bedifficult to implement through a process that is anything more than slow and incremental. Inaddition to these direct economic effects, international trade and global equity issues will insure thatchanges will be neither fast nor dramatic. For these reasons, and others discussed in more detailthroughout this report, we believe that there is unlikely to be much change in the rate of grain-basedfinishing in the beef industry for the foreseeable future.

vii
Table of Contents
Executive Summary . . . . . . . . . . . . . . . . . . . . . . . . . . . . . . . . . . . . . . . . . . . . . . . . . . . . . . . . . . . ii
History, Structure, Characteristics, and Future of the U.S. Cattle and Beef Industry . . . . . . . . . . 3Descriptive History of the U.S. Cattle and Beef Industry . . . . . . . . . . . . . . . . . . . . . . . . . 3
History of the Cattle Raising Industry . . . . . . . . . . . . . . . . . . . . . . . . . . . . . . . . . . 4History of the U.S. Cattle Feeding Industry . . . . . . . . . . . . . . . . . . . . . . . . . . . . . 5History of the U.S. Cattle Slaughtering, Beef Wholesaling, and Retailing
Industries . . . . . . . . . . . . . . . . . . . . . . . . . . . . . . . . . . . . . . . . . . . . . . . . . . 6Current Structure of the U.S. Cattle and Beef Industries . . . . . . . . . . . . . . . . . . . . . . . . . . 9
Cow-Calf and Stocker Cattle Production Systems . . . . . . . . . . . . . . . . . . . . . . . 10Cattle Feedlot Finishing Operations . . . . . . . . . . . . . . . . . . . . . . . . . . . . . . . . . . 14Cattle Slaughtering, Processing, and Beef Wholesaling . . . . . . . . . . . . . . . . . . . 21Beef Retailing . . . . . . . . . . . . . . . . . . . . . . . . . . . . . . . . . . . . . . . . . . . . . . . . . . . 25
Cattle and Beef Marketing System . . . . . . . . . . . . . . . . . . . . . . . . . . . . . . . . . . . . . . . . . 28Overview of the Cattle and Beef Marketing System . . . . . . . . . . . . . . . . . . . . . . 28Functioning of the Pricing System . . . . . . . . . . . . . . . . . . . . . . . . . . . . . . . . . . . . 29Per Capita Consumption of Beef and Consumer Related Factors . . . . . . . . . . . . 31Changes In Quality of Beef Produced . . . . . . . . . . . . . . . . . . . . . . . . . . . . . . . . . 31U.S. Cattle and Beef Trade . . . . . . . . . . . . . . . . . . . . . . . . . . . . . . . . . . . . . . . . . 32
Future Trends in the Cattle and Beef Industry . . . . . . . . . . . . . . . . . . . . . . . . . . . . . . . . . 33
Interactions of the Cattle and Beef Industry with the Environment . . . . . . . . . . . . . . . . . . . . . . 37Cow-Calf and Stocker Production and the Environment . . . . . . . . . . . . . . . . . . . . . . . . . 37
Cow-Calf/Stocker Production and Land . . . . . . . . . . . . . . . . . . . . . . . . . . . . . . . 38Cow-Calf/Stocker Production and Water Quality . . . . . . . . . . . . . . . . . . . . . . . . 44Cow-Calf/Stocker Production and Air Quality . . . . . . . . . . . . . . . . . . . . . . . . . . 47
Cattle Feeding and Finishing and the Environment . . . . . . . . . . . . . . . . . . . . . . . . . . . . . 48Cattle Feeding and Water Quality . . . . . . . . . . . . . . . . . . . . . . . . . . . . . . . . . . . . 48Cattle Feeding and Air Quality . . . . . . . . . . . . . . . . . . . . . . . . . . . . . . . . . . . . . . 50
Cattle Slaughter, Beef Retailing and the Environment . . . . . . . . . . . . . . . . . . . . . . . . . . 51Slaughter, Retailing and Water Quality . . . . . . . . . . . . . . . . . . . . . . . . . . . . . . . . 51
Trends in the Cattle and Beef Industry and Potential Changes in Environmental Impact . . . . . 52Trends in Cattle and Beef Production and Management Practices . . . . . . . . . . . . . . . . . 53
Land and Forage Management . . . . . . . . . . . . . . . . . . . . . . . . . . . . . . . . . . . . . . . 53Public Land Use and Management . . . . . . . . . . . . . . . . . . . . . . . . . . . . . . . . . . . 54Herd Health, Nutrition, Reproductive Efficiency . . . . . . . . . . . . . . . . . . . . . . . . 55Land Use, Demographics, and Cultural Values . . . . . . . . . . . . . . . . . . . . . . . . . . 57
Trends in Feedgrains vs. Forage in the Production of Beef . . . . . . . . . . . . . . . . . . . . . . . 59Trends in Beef Demand, Competition, Vertical Coordination, and Other Factors . . . . . 60

viii
Summary: The Environmental Challenges of the U.S. Cattle and Beef Industryand Obstacles to Change . . . . . . . . . . . . . . . . . . . . . . . . . . . . . . . . . . . . . . . . . . . . . . . . . 61Principal Obstacles to Change in Cattle Producer Behavior . . . . . . . . . . . . . . . . . . . . . . 61
Status of Current Efforts to Solve Environmental Problems . . . . . . . . . . . . . . . . 61Challenges Remaining . . . . . . . . . . . . . . . . . . . . . . . . . . . . . . . . . . . . . . . . . . . . . 62Alternative Solutions and Resource Constraints . . . . . . . . . . . . . . . . . . . . . . . . . 62
Role of the Market Structure and Current Regulatory Environment . . . . . . . . . . . . . . . . 62Status of Current Efforts to Solve Environmental Problems . . . . . . . . . . . . . . . . 63Challenges Remaining . . . . . . . . . . . . . . . . . . . . . . . . . . . . . . . . . . . . . . . . . . . . 63Alternative Solutions and Resource Constraints . . . . . . . . . . . . . . . . . . . . . . . . . 63
Principal Economic, Social, and Political Challenges . . . . . . . . . . . . . . . . . . . . . . . . . . . 64Status of Current Efforts to Solve Environmental Problems . . . . . . . . . . . . . . . . 64Challenges Remaining . . . . . . . . . . . . . . . . . . . . . . . . . . . . . . . . . . . . . . . . . . . . . 64Alternative Solutions and Resource Constraints . . . . . . . . . . . . . . . . . . . . . . . . . 65
References . . . . . . . . . . . . . . . . . . . . . . . . . . . . . . . . . . . . . . . . . . . . . . . . . . . . . . . . . . . . . . . . . . 66

The U.S. Cattle and Beef Industry and the Environment
Without question, animal agriculture alters the environment and environmental processes. Suchimpacts are not new, however. Many of the same environmental problems intrinsic to raising andutilizing domesticated animals like cattle have plagued mankind throughout the ages - odors,overgrazing of pasturelands, etc. Though the U.S. cattle industry is as old as the country itself, thepotential environmental impacts of the industry have been of particular concern only since about thebeginning of the 20th century. Modernization and technological advances and related structuralchanges in the production, feeding, processing, and retailing of cattle and beef have created growingpressure on the soil, water, air, energy, and other resources in the United States. In large part, theresulting pattern and rate of growth and development of the U.S. cattle industry is a direct responseto rapid economic growth and development, growing per capita incomes, and a consequent shift inconsumer diets from grains to meat. The particular way in which the U.S. cattle and beef industryhas developed has contributed importantly to the type and extent of the impact of the industry onthe environment.
The biological characteristics of cattle production also helps define the interface of the cattleindustry on the environment. For example, the production of beef is unique compared to that ofother meats like pork and poultry in that significant amounts of grazed forages are utilized relativeto feedgrains. Because cows can reproduce and young animals can grow efficiently on grazedforages, the cow-calf and stocker portions of the industry are characterized by a large number ofrelatively small producers who are widely dispersed geographically, many of whom are motivatedto produce cattle by goals other than financial gain and efficiency. In contrast, the slaughter-processing-wholesaling segments of the industry are characterized by a very few, very large, profitdriven companies which are responsible for the slaughter, processing and distribution of the vastmajority of the beef consumed in the U.S.
The production of cattle and beef and, therefore, the environmental interface of the industry, isdriven in large part by consumer demand and preferences. The cattle and beef industry exists in ahighly competitive, consumer driven market for meat. Over the past several decades, beef has lostsignificant market share to poultry primarily because consumers have increasingly demanded a lessexpensive, more convenient, and healthier source of protein that is consistently tasty and tender. Incompeting with poultry and pork, the beef industry has attempted to improve the image of beef byemphasizing the more consistent good taste, tenderness and availability achieved through grain-finished beef. Price competition with poultry and pork has also supported the trend toward a largershare of total beef slaughtered being finished in feedlots.
Both direct and indirect impacts on the environment are by-products of the production of cattle andbeef. The production and release of methane into the environment is one important direct impactof the cattle industry on the environment. Since cattle are ruminants and utilize forage, theygenerate relatively large amounts of methane. Over the past 200 years, however, livestock methane

2
emissions have largely only replaced wild animal emissions. Additionally, since cattle numbers inthe U.S. have declined recently and are not expected to increase in the future, the beef industry isnot seen as a significant source of expanded methane emissions in the future.
The most significant direct environmental impact of the U.S. cattle industry, particularly the cow-calf and stocker segments, is the alteration of the composition of native plant communities and theassociated impacts on wildlife (through habitat disruption) and biodiversity. Plant communities havebeen altered over much of the U.S. due to direct intervention such as plowing up native vegetationand establishing monocultural swards of derived pasture forages or by continuous overstocking ofnative rangelands with livestock and eliminating periodic burning from the ecosystems.
In recent decades, cattle ranchers and public land management agencies have recognized the errorof the earlier overstocking. Consequently, much of the nation’s rangeland has actually exhibitedimprovement in ecological condition over the past sixty years. However, many of the plantcommunities have been so severely altered that even if livestock grazing were eliminated they wouldnever recover to their original ecological state without the use of expensive restoration practices.Given the vast number of acres involved, most of this land will remain in an altered ecological stateindefinitely.
In recent years, ranchers and land managers have also become much more cognizant of the potentialimportance of wildlife and biodiversity. In many areas, land managers are now managing primarilyfor wildlife habitat and secondarily for cattle production. This trend toward more emphasis onwildlife and biodiversity is expected to continue into the foreseeable future. The cattle and beef industry’s potential for negatively impacting the environment both directly andindirectly is greatest in the feedlot segment. Among potential direct impacts are the contributionsto air pollution through odors and dust and to surface and ground water pollution through nutrientloading from improper handling of manure given the concentrations of large numbers of animals inrelatively small areas. In both cases, however, because the animals are so concentrated, feedlots areconsidered point sources of pollution by EPA and, therefore, are stringently regulated. For thisreason, the beef cattle industry will not likely contribute to significant additional directenvironmental damage in the future through feedlots.
The major impact of the cattle and beef industry on the environment, however, is the likely indirectimpact through the demand for feedgrains by cattle feeders on the production of feedgrains which,in turn, generates significant soil, air, water, and other resource impacts as discussed in some detailin recent reports by Runge (1998) and Schnittker (1997). The U.S. beef cattle industry, however,utilizes only a small portion of the total annual supply of feed grains (e.g., only about 11% of the1992/93 corn supply) which limits its environmental impact. Given the competition from pork andpoultry, the particular biological characteristics of cattle production, consumer preferences for grain-fed beef, and other factors, the US cattle industry will continue to use feedlots for grain finishingof beef cattle for the foreseeable future.

3
To understand the ways in which the U.S. cattle and beef industry impacts the environment and theenvironmental challenges that the industry presents first requires an understanding of the industryitself and the forces that drive or create obstacles to change within the industry. Consequently, thisreport first provides a detailed overview of the history, structure, and characteristics of the varioussegments of the industry from cattle production, feeding, and slaughtering to beef wholesaling andretailing and how those segments work togther as an integrated commodity system. That overviewthen provides the background for a detailed discussion of the interactions of the U.S. cattle and beefindustry with the environment, including a consideration of the potential for environmentalimprovements and impediments to change. The report then explores trends in technology, policy,competitive forces and other factors that may force changes in the way in which the cattle and beefindustry impacts the environment in the future. Finally, the report summarizes the environmentalchallenges of the U.S. cattle and beef industry and the obstacles to change with emphasis on thestatus of current efforts to solve environmental problems posed by cattle and beef production, thechallenges that remain, and potential alternative solutions and resource constraints to dealing withthe remaining challenges.
History, Structure, Characteristics, and Future of the U.S. Cattle and Beef Industry
U.S. cattle and beef production, processing, and marketing have undergone substantial change overthe last two centuries. The operational characteristics and the number, size, and location of U.S.cattle and beef producers and slaughtering, processing, and marketing firms have developed andmade operational adjustments in response to available resources, technological advances, regionalchanges in population and economic conditions, governmental policies and regulations, andcompetition to meet the demand for beef by consumers. This section first provides a briefdescriptive history of the U.S. cattle and beef industry from inception to 1970. Then the structureand operational characteristics of the industry from 1970 to 1998 are examined in more detailfollowed by an analysis of the current cattle and beef marketing system in a changing domestic andworld economy.
Descriptive History of the U.S. Cattle and Beef Industry
The historical forces generating growth and change in the U.S. cattle and beef industry are many andvaried. Although closely related in many ways, the history of the growth and development of theU.S. cattle industry, the U.S. cattle feeding industry, and the U.S. cattle slaughtering and beefwholesaling and retail industries and the major events which have shaped them are also quite uniquein numerous other ways.
History of the Cattle Raising Industry
Domestic meat and draft animals are not native to America. Rather, they were introduced by earlySpanish explorers, including Columbus, Cortez, and Coronado in the early 1500s (Williams and

4
Stout 1964). The first permanent introduction of livestock and cattle on the East Coast was atJamestown in 1611. Cattle were raised on a range system, primarily for milk and draft purposes.When slaughtered, the most valuable product often was the hide.
Cattle production increased rapidly in the New England colonies. The common pasture for growingsettlements quickly became inadequate for cattle grazing, launching the westward movement for thecattle industry (Anderson 1951). Large cattle herds appeared in the Carolinas in the 1600s and werewell established in Ohio and Kentucky by 1800 and later in Illinois and Missouri by 1860.
A major problem facing livestock producers in the early 1800s was transportation. Cattle weremoved on foot from the western Corn Belt to the eastern markets. Railroads, however, wereestablished in many areas prior to the Civil War. Major factors which affected the growth, location,and nature of the cattle and beef industry after the Civil War, included: (1) the rapid developmentof railroads, (2) the Homestead Act of 1862 which encouraged westward migration, (3) thedevelopment of the McCormick reapers which facilitated grain harvesting, and (4) the advent of therefrigerated railroad car which allowed western packers (Chicago, Cincinnati, etc.) to ship freshmeat to Eastern markets. The development of a livestock terminal market in Chicago (the UnionStock Yard and Transit Company) in the 1860s adjacent to railroad facilities in response to demandsfrom the Chicago packing industry was soon followed by the establishment of other publicstockyards adjacent to railroad facilities. The construction of nearby major slaughter plants with railsidings throughout the southwest and midwest at Omaha, Sioux City, Kansas City, Denver,Oklahoma City, Forth Worth, etc. soon followed.
Prior to the Civil War, cattle had begun to move in large numbers into Texas and states west of theMississippi, including California (Voorhies and Koughan 1928). By 1880, the Dakotas and themountain and inter-mountain states were sparsely stocked with cattle. By 1894, however, nearlyall of the western territory was stocked close to capacity. The center of U.S. beef productionmigrated westward from western Kentucky in 1860 to Kansas by the late 1890s.
With the western migration of the cattle industry in the 1800s, the number of total U.S. cattle andcalves more than doubled from 29 million head in 1867 to 60 million head by 1890 (Figure 1). Thatnumber doubled again to 112 million head by 1970. Although generally an upward trend between1867 and 1970, the growth pattern for U.S. cattle numbers has been broken by at least 7 major peaksand troughs, often referred to as cattle cycles (Figure 1).
A fundamental change in the composition of the U.S. cow herd since the 1920s has had an importantimpact on the growth of the U.S. beef cattle industry. Prior to 1954, cow herds on U.S. farms andranches consisted of more milk cows than beef cows. For example, U.S. milk cows totaled 21million head in 1920 compared to13 million beef cows. In 1954, however, beef cows (25 millionhead) outnumbered milk cows (24 million head) for the first time. Cows kept for milk declinedcontinually in the U.S. between 1954 and 1970 such that by 1970 milk cows totaled only13 millionhead compared to 38 million beef cows.

5
Many factors encouraged the steady growth in beef cow numbers, including a rapidly growingpopulation with rising per capita income, increasing urbanization of the U.S. population, and theincreasing percentage of women entering the work force after World War II which contributed toa more rapid growth in consumer income. These trends have continued well into the 1990s.
History of the U.S. Cattle Feeding Industry
Cattle feeding in the United States dates back to early colonial times. Southeastern Pennsylvaniawas an important feeding area at the time of the American Revolution (Ball 1992). Cattle purchasedfrom cow herds in the Carolina Piedmont and the Shenandoah Valley were fattened on Pennsylvaniacorn and then driven to markets in such cities as Charleston, Baltimore, and Philadelphia. Cattleraisers in the Hartford, Connecticut area finished several thousand head of steers a year on brewersmash, root crops, and apples around 1800 (Ball 1992). Farmers in the Bluegrass Region of Ohio andKentucky were also feeding cattle by the early 1800s. Farmers typically bought three to five-year-old steers and hauled shucked corn on wagons to cattle in feeding fields (Ball 1992). These oldersteers were preferred because they could better survive the long drives to market.
The primary cattle feeding region in the U.S. during the late 1800s and early 1900s was the CornBelt with Iowa and Illinois as the major cattle feeding states. Both states had large and growingsupplies of corn which farmers marketed to cattle feeding operations. Texas also began feedingcattle in the late 1890s and early 1900s with the establishment of feeding facilities near or adjacentto the numerous cottonseed oil mills throughout the state (Ball 1992).
According to U.S. Department of Agriculture (USDA) statistics, the Corn Belt (Iowa, Illinois,Indiana, Ohio and Missouri) was the leading U.S. cattle feeding region by 1930 with 43% of the allcattle on feed. During that period, the four major cattle feeding states were Iowa with almost 20%of the total, followed by Nebraska with 13%, and Kansas and Illinois each with another 10%. Thesecond leading U.S. cattle feeding region in 1930 was the Northern Plains area (Nebraska, Kansas,South Dakota, and North Dakota) with almost 30% of the U.S. cattle placed on feed that year.
The two primary cattle feeding regions in the U.S. between 1930 to 1970 were the Corn Belt andNorthern Plains. Nevertheless, placements (cattle placed on feed) in those two regions declinedfrom almost 75% of the total in 1930 to about 57% in 1970. During this period, Iowa remained theleading cattle feeding states with placements ranging from 17% to 22% of total U.S. placements.The second and third leading cattle feeding states during this period continued to be Illinois andNebraska, respectively, with Nebraska taking over second place after 1962. Common to all threestates (Iowa, Nebraska, and Illinois) were large supplies of grain and numerous farmer-feedersand/or lots with less than 1,000 head, one-time capacity. For example, in 1964 these three statesreported 101,993 farm feedlots, about half the number of farmer-feeders reported by the USDA forthat year (USDA 1965). Farmer-feeders accounted for 60% of the fed cattle marketings in 1964compared to 55% by 1970. Farmer-feeders, however, represented approximately 99% of the totalcattle feeding operation during the 1964 to 1970 period.
6
While commercial cattle feedlots are generally defined as feeding operations with 1,000 or morehead, one-time capacity, a concentration of large-scale commercial feedlot operations with 10,000or more, one-time feeding capacity first appeared in California in the 1950s. A proliferation oflarge- scale commercial cattle feeding soon followed in such feeding areas as Arizona, Texas,Colorado, Kansas, Oklahoma, and Nebraska. By 1970, large-scale commercial cattle feedingoperations were well established in many cattle feeding areas. Commercial cattle feedlots accountedfor more than 99% of the cattle fed in California and Arizona, 97% of the cattle fed in Texas, 91%of the cattle fed in Oklahoma, 85% of the cattle fed in Colorado, almost 74% of the cattle fed inKansas, and 55% of the cattle fed in Nebraska. Corn Belt cattle feeders, in contrast, were stillrelying predominately on farmer-feeders. Feedlots with less than 1,000 head capacity accounted formore than 90% of the fed cattle marketed in that region in 1970.
History of the U.S. Cattle Slaughtering, Beef Wholesaling, and Retailing Industries
The first commercial meat packer in America was William Pynchon who established a slaughterplant near Boston in 1662 (Williams and Stout 1964). Livestock slaughter plants during colonialtimes were crude and inefficient, meat packing was a seasonal industry, and slaughter was performedmostly during the winter months (Anderson 1951). The first major packing center was establishedat Cincinnati in 1818 primarily because Ohio had become a major hog producing state (Williamsand Stout 1964). Packing plants were soon established at Chicago and Milwaukee (Anderson 1951).Cities on the Missouri and Mississippi Rivers, including South St. Paul, East St. Louis, Sioux City,Omaha, St. Joseph, and Kansas City, developed into meat packing centers.
The advent of the refrigerated rail car in the 1870s and the earlier development of railroadtransportation systems led to the establishment of large livestock terminal markets in Chicago. Bythe 1880s, Chicago had become the dominant meat packing center in the United States. Railroadsallowed large numbers of beef cattle to be shipped from western production areas to Chicago forslaughter. Refrigerated rail cars facilitated year around beef slaughter and shipment of beef fromChicago to deficit beef markets in the East. The continued growth of the rail system allowed thedevelopment of other terminal markets and the establishment of slaughter plants near those marketsthrough the end of the century.
The structure of the infant slaughter industry of the late 1800s was also shaped by the use ofmechanical power to develop large-scale slaughter operations and the growth of the corporate formof business which led to capital formation and expansion of the slaughter industry. National packers(packers with national systems of distribution) began to appear in the 1860s with the establishmentof multi-species slaughterhouses by Armour & Company and Swift & Company at Chicago. Thesewere soon followed by Wilson & Company and Cudahy Packing Company with the constructionof plants at nearby locations. These packers obtained the majority of their slaughter cattle andcalves at nearby terminal markets. All of the major packers operated under a federal meat inspectionsystem established by the Meat Inspection Act of 1906, enacted by Congress after the public fearwas aroused by packing house conditions in The Jungle, a book by Upton Sinclair. The 1906 Actis the historical backbone of the current meat inspection system. This system provided for ante-and

7
post-mortem inspection, strengthening the effectiveness of meat inspection by providing morestringent requirement than in prior legislation (the 1891 and 1895 Meat Acts).
The cattle slaughter industry became increasingly concentrated in the early 1900s. The “Big Five”packers (Swift, Wilson, Cudahy, Morris, and Armour) had a dominant position in the industry,accounting for three-fourths of the cattle slaughtered in federally inspected (FIS) plants. In 1917,the Federal Trade Commission (FTC) initiated a study of the slaughter industry which concludedthat the top 5 firms had engaged in such practices as (1) dividing markets and sales territories, (2)collaborating on purchase prices and volumes purchased, (3) engaging in retailing to drive outcompetitors, and (4) using unscrupulous tactics to gain market power and control. The FTC studyled to the Packers Consent Decree of 1920 in which packers agreed to settle out of court byagreeing, among other things, to: (1) divest themselves of physical facilities in public stockyards,stockyard railroads, market newspapers, and public cold storage facilities; (2) not engage in retailingof meat and wholesaling of groceries; and (3) submit perpetually to the jurisdiction of the U.S.District Court under an injunction which forbids conspiracy and monopoly (Packer Consent Decree1925). The Big Five, however, did not live up to their agreement and Congress enacted the Packersand Stockyards Act in 1921, which gave the Secretary of Agriculture supervision over packers,stockyards and trading activities on stockyards.
Other major factors shaping the meat industry in the early 1900s, given the perpetual concern ofmonopolistic pricing practices by large packers, was the involvement of the USDA in developinga market news system in 1916 which could enhance communication through the use of commonterminology such as grade standards. Although large, national packers objected since they had avested interest in their own private labels or grades, official USDA grade standards for live slaughtercattle, calves and veal, including carcass standards for beef, veal, calf, lamb, and mutton weredeveloped in the 1928-31 period.
During the late 1940s through the 1960s, major changes occurred in the structure of the livestockslaughter industry. Technological advances in motor truck transportation, a developing nationalhighway system and construction of farm to market roads, and an emerging cattle feeding industryencouraged decentralization of concentrated slaughter from close to consumption or populationcenters toward areas of production. These factors, plus the rapid growth of livestock auctionmarkets in the late 1940s and early 1950s, brought about the demise of the terminal marketingsystem which had been supported largely by nearby national packers with obsolete multi-speciesplants. Major innovations in cattle slaughtering in the 1960s included the construction of large,efficient, independent slaughter plants which were highly specialized as to species slaughtered.These plants located near areas of concentrated cattle production and were the forerunners of themodern, highly specialized fabrication and boxed fresh meat facilities of the 1980s. Decentralizationof commercial cattle slaughter became evident in 1969 when Nebraska was ranked first incommercial cattle slaughter, followed by Iowa and Texas after Illinois had been ranked first in the1930s and 1940s.
The advent of highly efficient single species slaughter plants with accompanying fabricationfacilities and the passage of the Wholesome Meat Act in 1967 brought about monumental changes

8
in the structure of the U.S. slaughter industry. Even though 85% of the commercial cattle slaughterwas under federal inspection in 1967, the Wholesome Meat Act was passed after a study by Havel(1966) revealed that only 38% of almost 15,000 meat facilities operating on an intrastate basis weresubject to state or local inspection (McCoy and Sarhan 1988). The Wholesome Meat Act requiredeach state to establish inspection standards and procedures for red meat at least equal to those of thefederal government. States which did not comply were to submit all non-FIS plants which sold meatto federal inspection. The net results were that many of the smaller and older slaughter plants andwholesale distributors went out of business rather than renovate existing facilities to meet FISrequirements. The total number of slaughter plants declined from 9,214 in 1968 to 5,877 in 1974(USDA 1970 and 1975).
In addition to slaughter plants, other types of meat firms that were instrumental to the developmentof the beef industry included packer branch houses, wholesale meat distributors, and meat retailingfirms such as independent meat markets and grocery stores which later developed into the modernsupermarkets. Packer branch houses (non-slaughter firms owned by national packers) served as adistribution artery for national packers and were generally located in or near large metropolitanareas. These firms contained storage facilities for fresh and cured meats, fabricated fresh meatitems, and manufactured sausage items and smoked and cured products. Packer branch houses werea product of the rail system and first appeared in the late 1800s after refrigerated rail cars becameprominent in the meat industry (Williams and Stout 1964). By 1929, the number of packer branchhouses had peaked at 1,157, accounting for one-half of the total meat sales at wholesale. By 1958,packer branch houses had declined by more than 50% as truck transportation became moreprominent in the meat industry.
The development of the U.S. highway system in the 1940-50 period, the advent of increasing directsales by national packers to retailers, and the increasing wholesaling and fabrication functionsperformed by wholesale distributors contributed to the decline of packer branch houses. Merchantwholesalers (independent non-slaughtering firms) were performing a variety of functions includingfabrication of meat products to specifications as required, processing of meat products, packaging,and back-door or store delivery of products to customers. Wholesale distributors included merchantwholesalers who merchandised mostly primal and sub-primal cuts, specialty wholesalers whocatered to the hotel, restaurant and institution (HRI) trade, and jobbers who delivered meat productsor sold directly out of their trucks. The rise of wholesale distributors was due primarily to thedemand for specialty wholesaling and fabrication services provided by these firms which were notprovided by slaughtering firms. The number of merchant wholesalers grew rapidly in the early1900s to 2,225 in 1929. Although reaching a peak of 5,041 in 1967, their numbers declined to 4,800by 1972 as a result of both the passage of the Wholesale Meat Act in 1967 and the efforts of somepackers to duplicate some of the services provided by merchant wholesalers (McCoy and Sarhan).
The U.S. meat retailing sector (retail grocery stores, independent meat markets, and the food serviceindustry) has undergone dramatic change in structure, method of operations, size, purchasing, andselling since the 1930s. The number of grocery stores have declined sharply since that time froma peak of almost 387,000 stores in 1939 to about 208,000 by 1970. Sales per store have increaseddramatically, however, from almost $20,000 per store in 1939 to about $425,000 per store in 1970

9
(National Commission on Food Marketing 1966; McCoy and Sarhan 1988). The decline in storenumbers was due primarily to the demise of small grocery stores which were unable to compete withthe larger grocery retailers such as the supermarkets. Combination food stores, which combinedgrocery and meat departments in the same facility or supermarkets, first appeared in the Southwestand California in the 1920s and were called “cheapies” because of their low prices (McCoy andSarhan 1988). Supermarket designation in the grocery industry is based on annual sales per store.Annual sales volume needed to qualify as a supermarket in the 1930s was $250,000 and $1,000,000per store in the 1960s. In the late 1930s, supermarkets numbered less than 1,000 and accounted forabout 5% of the total grocery sales. By 1965, supermarkets were the dominant form of grocerybusiness, accounting for 70% of total grocery sales.
The retail food chain concept gained recognition much earlier than did the supermarket concept.A retail food chain is defined as a firm which owns and operate 11 or more stores. Chain storesstarted in 1859 with the Great Atlantic and Pacific Tea Company (McCoy and Sarhan). The chainconcept started slowly but became an important part of the grocery business by 1930. The majorimpact of the chain store movement was upon wholesale operations (National Commission on FoodMarketing 1966). The chains combined wholesaling and retailing and were able to operate at lowercosts. They cut prices aggressively which attracted consumers in growing numbers.
Most firms classified as retail food chains are corporations which operate many stores under oneownership and management (Williams and Stout 1964). Procurement and sales facilities generallyare closely controlled by top management. Other types of chains, such as voluntary group retailersand cooperative retailers, generally involve much less control from the top. In a voluntary groupchain, retailers are affiliated members of a group that usually is sponsored by a grocery wholesaler.Cooperative retailers are owned by the retailers themselves, who own the stock of the wholesaleorganization. Grocery chains comprised less than 10% of the grocery stores in 1940 compared toabout 16% by 1970 (McCoy and Sarhan 1988). Grocery sales by chains, on the other hand,increased from 35% of the total grocery sales in 1940 to 48% of the grocery sales by 1970.
Current Structure of the U.S. Cattle and Beef Industries
The structure, operational characteristics, and pattern of development of the U.S. cow-calf andstocker cattle production systems, cattle feedlot finishing operations, cattle slaughtering/processingand wholesaling, and beef retailing since 1970 reflect their historical underpinnings as influencedby modern political, social, and economic forces.
Cow-Calf and Stocker Cattle Production Systems
The U.S. cow-calf and stocker cattle production system utilizes available resources, such asrangeland and pasture grasses, forages, hay and other feeds, to maintain and raise cattle and calvesfor further reproduction, feedlot finishing, and /or slaughter to satisfy the ultimate demand for thekind and type of beef desired by consumers.

10
Current Inventory and Changes in Inventory by Region
The total number of cattle and calves on U.S. farms, ranches, and feedlots on January 1, 1998amounted to only 99.5 million head compared to 112.4 million head in 1970 (Table 1). However,commercial beef production as reported by the USDA totaled 25.7 billion pounds in 1998 comparedto 22.1 billion pounds in 1970, reflecting both changes in U.S. beef production practices and changesin the proportion of slaughter cattle finished in U.S. feedlots to satisfy the demand for beef by U.S.consumers.
The composition of the U.S. cattle inventory has changed substantially as reflected by the higherproportions of beef cows in U.S. herd in 1998 compared to 1970, although the percentage of totalcows in U.S. herds remained substantially the same between 1970 and 1998. Beef cows made upmore than 78% of the U.S. cow population in 1998 and 75% in 1970, reflecting both an absolute anda relative decline in dairy cow inventories by almost one-fourth from 1970 to 1998 (Table 1). Othermajor changes in the composition of the January 1 U.S. cattle inventory from 1997 to 1998 were thenumbers of other heifers and steers weighing 500 pounds or more. Other heifers and steers, 500pounds and over, totaled 21.4 million head or 19% of the total inventory in 1970 compared to 27.2million head or 27% of the total in 1998, reflecting primarily the increased number of cattle infeedlot inventories in 1998 versus 1970.
The largest beef cow producing region in the contiguous 48 states in 1998 was the Southern Plainswith more than 22% of the beef cow inventory, followed by the Northern Plains with almost 18%,the Mountain states with 15%, the Corn Belt with 12%, Appalachian states with 11%, followed bythe Southeast, the Delta, and the Pacific regions (Table 2). The populous Northeast and Lake statesaccounted for about 3% of the beef cow inventory in the contiguous 48 states.
Total beef cow numbers remained virtually unchanged between 1990 and 1998 with small declinesin beef cow numbers noted in the Northeast, the Corn Belt, the Southeast, the Delta and the Pacific(Table 2). Beef cow inventories increased in all other regions over the same time period. Stateswith the highest numbers of beef cows in 1998 were Texas with 16% of the total followed byMissouri, Oklahoma, Nebraska, South Dakota, Montana, Kansas and Kentucky.
Three regions (Lake states, Pacific, and Northeast) accounted for 62% of the U.S. dairy cowinventories on January 1, 1998 (Table 2). The most populous dairy cow region was the Lake stateswith 25% of the U.S. inventory, followed by the Pacific (predominately California) and theNortheast regions both with another 19%. A common characteristic of these three regions is thatthey also contain substantially higher proportions of the U.S. population than do the other regions.Regions with the next highest dairy cows numbers were the Corn Belt and the Mountain states.California and Wisconsin, with almost equal numbers of dairy cows, together accounted for almostone-third of the total U.S. dairy cows in 1998. The next largest dairy cow producing states wereNew York with 8% of the total, Pennsylvania with another 7%, and Minnesota with 6%. Together,these 5 states held 51% of the dairy cow inventory in 1998.

1 Stocker cattle supplies, an important source of placement cattle for feedlots, were estimated by summingother heifers and steers 500 pounds or more and subtracting cattle on feed for 1990 and 1998 (January 1 data).
11
Other important supply consideration for U.S. beef production include the annual calf crop and theavailability of stocker cattle which eventually end up in the beef production stream as do cull beefcows and bulls including cull dairy cattle. Because the annual calf crop, other things equal, is aproduct of the combined beef and dairy cow populations in the respective states and/or regions,annual state and regional calf crops closely resemble the pattern and numbers of beef and dairy cowpopulation numbers. The January 1 calf crop represented 90.5% of total cow inventories in 1990and 89.6% in 1998 (Tables 2 and 3).
The Southern Plains region was the largest producer of calves in 1998, followed closely by theNorthern Plains and Mountain states, the Corn Belt, the Appalachian and Pacific states (Table 3).The largest increase in the calf crop between 1990 and 1998 was in the Mountain states while theLake states reported the largest decline in the calf crop for that period (Table 3).
Regional supplies of stocker cattle1 reflect, among other things, a variety of factors and availableresources, including: (1) supply and condition of range grasslands; (2) fall and winter small grainacreage available for grazing; (3) feedlot costs of gain versus cost of gain on grassland; (4) feedlotcosts of gain versus cost of feeder cattle and price of grain; and (5) grazing practices and quality ofmanagement. The major sources of stocker cattle in 1998 were the Northern Plains, the SouthernPlains, and the Mountain states (Table 3). Common characteristics of these three regions includerelatively large amounts of rangeland for grazing stocker cattle, relatively large acreages of smallgrain for grazing, and often nearby feedlot outlets for stocker cattle.
Texas, Kansas, Nebraska, Oklahoma, the Dakotas, Colorado, Missouri and Iowa accounted for two-thirds of total stocker cattle inventories on January 1, 1998. Cattle feeding is relatively prominentin these states. Feedlots or owners of feeder cattle to be placed on feed at a later date often purchaselighter weight feeder cattle which are placed in stocker growing programs to gain additional weightand also to “cheapen-up” such cattle prior to placement in feedlots. Substantial proportions of suchcattle are also owned by professional stocker cattle producers who purchase feeder cattle forplacement in stocker growing programs with expectations of future profits by selling such stockercattle to feedlots, custom cattle feeders, or by retaining ownership through the feedlot finishingphases.
Number and Size of Operation by Region
The number of beef operations in the U.S. declined from 932,000 in 1990 to 855,000 by 1998 (Table4). The average number of cows per operation, however, increased from 36 head in 1990 to 40 headby 1998. Numbers of beef cow operations declined in all regions between 1990 and 1998 exceptthe Lake states, the Southern Plains, and the Mountain area. The largest number of beef cowoperations is in the Southern Plains, followed by the Appalachian region and the Corn Belt. TheNortheast accounts for the fewest number of beef cow operations.

12
Average beef cows per operations increased in all regions between 1990 and 1998 except theSouthern Plains and Lake states (Table 4). These statistics suggest that additional producers hadentered the beef cow business during the 1990 to 1998 period but that the proportions of producersentering and leaving the beef cow business were about the same. The greatest number of beef cowsper operation were in the Mountain and Northern Plains regions while beef cows per operation werelowest in the Northeast and the Lake area. Almost four out of five beef cow operations in theMountain states contained 100 head or more beef cows during 1998 (Table 5). The Pacific andNorthern Plains regions also report that over two-thirds of their beef cow operations had 100 or morehead. States with the highest percentages of beef cow herds of 100 or more head include Wyoming,Arizona, Montana, New Mexico, California, Florida and Oregon. Regions with largest percentagesof beef cow herds of 50 head or less include the Northeast, Appalachia, the Lake states, the CornBelt, and the Southeast.
The number of dairy operations declined 40% in the U.S. between 1990 and 1998 (Table 6). Overthe same period, the average number of dairy cows per operation increased from 52 head in 1990to 79 head in 1998. Although dairy cow operations declined in all regions between 1990 and 1998,the largest declines occurred in the Southeast and Delta states. The smallest declines occurred inthe Northeast and the Lake states, two prominent U.S. milk producing regions.
Regions with the largest number of dairy cow operation in 1998 were the Lake states with about37,000 operations, the Northeast with 25,000 operations, and the Corn Belt with another 20,000operations (Table 6). These three states accounted for 70% of all U.S. dairy cow operations during1998. Other regions with substantial dairy cow operations were the Appalachian states with 9,100operations, the Northern Plains with 5,800 operations, and the Southern Plains, the Mountain andPacific regions, each with about 5,000 operations during 1998.
The largest dairy cow operations during 1998 were in the Pacific, the Mountain, and the Southeastregion (Table 6). Regions reporting the lowest number of dairy cows per operation in 1998 werethe Corn Belt, the Northern Plains, and Appalachia. States reporting the largest number of dairycows per operation were California and Arizona with about 520 head per operation, followed byNew Mexico with 432 head, and Florida with 246 head (Table 6). States with the lowest numberof diary cows per operation were Wyoming, West Virginia, and Montana. New Mexico and Arizonawere the largest among states reporting 78% of more of their dairy cows in herds of the 500 heador more (Table 7). Other states with high proportions of dairy herds containing 500 or more headincluded Florida, California, and Utah. The most often reported dairy herd size group in theNortheast, the Lake states, and the Corn Belt was 50 to 99 head.
Production Systems and Land Tenure by Region
Cow-calf production systems (often defined as systems where calves are sold at weaning age) varyon a regional basis by such factors as calving system, annual growing season, availability ofimproved pastures, type of native forages available, terrain, size of operation, etc. More than 40%of the beef cow herds in the southern states, including the Southeast, the Delta, and the easternportion of the Southern Plains often practice year-round calving practices due to size of operation,

13
climatic conditions favorable to longer growing seasons, and generally greater utilization ofimproved pastures for grazing (Dietrich, Amosson, and Crawford 1988). Seasonal calving patternsare more pronounced in the Mountain states, the Northern Plains, the Pacific, the Northeast, and theCorn Belt. In those areas, up to 70% of the beef cows are bred to calve in the February-May period.
Improved pastures, with appropriate applications of fertilizers, have greatly improved cow-calfcarrying capacities in the Delta, the Southeast, and the eastern Southern Plains during the last twodecades. Beef cow herds in the Northeast, the Corn Belt and Lake states are often supplementaryenterprises. Beef cow herds in the Corn Belt and Lake states often depend on small acreages notsuitable for cropping, hay from rotation cropland, and residues from field crops, especially corn(Gustafson and Van Arsdall 1970). Much of the land in the western Southern Plains and theMountain states is pastureland, rangeland, or timberland with substantial variation in elevation,topography, climate, soils and vegetation (Van Arsdall and Skold 1973). Also, much of the land inthe Southwest, including most of the western Southern Plains and the Mountain states, receives lowaverage annual rainfall. Given the thin, rocky soils from which a small amount of forage isproduced, livestock grazing (e.g., cow-calf production) is often the most suitable enterprise forutilization of available resources. Beef cows in the Mountain and Pacific states are grazed underMountain ranching, inter-mountain desert, and mixed crop-livestock systems.
Up-to-date published information concerning stocker cattle operations and land tenure systems forcow-calf production systems are generally not available. However, case studies of stocker cattle andcow/calf operations provide information on current leasing and cattle grazing practices. Stockercattle wheat grazing lease arrangements are often for 120 days, beginning in November andterminating in March of the following year. Winter wheat grazing fee arrangements vary within andbetween regions. For example, stocker cattle wheat grazing fees are often based on in-weights witha grazing fee assessment schedule based on per 100 pounds of gain or on a per-pound-of-gain basiswith side stipulations regarding supplemental feeding, labor furnished, or payment for services, etc.
Cow-calf and stocker cattle pasture or range grazing leases in the Northern Plains or Mountain stateregions are often from May to October with charges based on a per animal unit per month or peranimal unit per season. An animal unit is generally defined as a cow-calf pair while animal unitsfor stocker cattle vary depending upon weight.
Land tenure practices vary by region and size of herd, especially in cow-calf operations. As cowherd size increase to 200 or more head, observations by livestock specialists suggest that numerouslarger cow-calf operations often find it more economical to expand their operations by leasing ratherthan purchasing additional acreage (Wellman 1999). Further, owner-operators represent anestimated 75 to 90% of the beef herds currently grazing on the western non-public range lands.
Technological Innovations and Animal Health Practices
Technical innovations which have had a major impact on the cow-calf industry include performancetesting, hybrid vigor, advances in reproduction and animal health, and continuing improvements inforage production. Performance testing, which is available through numerous programs, focuses on

14
such desirable traits as calving rate, weaning weight, rate of gain from birth to weaning age, andvarious carcass characteristics. Selections based on performance testing provides a basis forselecting herd replacements to improve quantity and quality of output and more efficient use ofavailable resources.
Hybrid vigor (selective crossbreeding between breeds) often produces larger and faster growingcalves which tend to utilize available resources at the cow-calf, stocker, and feedlot level moreefficiently. Further, improved management of breeding herds, including better nutrition, culling,pregnancy testing, and use of prudent animal health practices, generally lends to improvements incalving percentages and weaning weights.
Other major innovations include estrous synchronization, artificial insemination, embryotransplanting, and more recently, cloning, all of which have or are likely to have the potential toproduce a beef product to meet the quantity, quality, and time constraints of consumers. Anabolicimplants, commonly called growth promotants, have been used by cow-calf, stocker cattle, and fedcattle producers since the 1960s to improve feed efficiency and increase the rate of gain (Williams,Dietrich and Byers 1991). Other innovations in the cattle industry include various phases of verticalintegration. Although total vertically integrated operations have been highly successful in thepoultry and hog industry, such operations have not met with major successes on an industry-widebasis at the cow-calf level other than retained ownership by some producers through the initialphases of production.
Cattle Feedlot Finishing Operations
The function of cattle feedlots is to place feeder or stocker cattle on a feeding program to convertfeed grains and other feedstuffs into additional muscle and bone growth to produce finished beefcarcasses exhibiting the weight, quality, and yield grades desired by consumers. A number ofimportant factors define the nature of cattle feedlot finishing, including the number and size of cattlefeedlot operations by region, marketings by size and region, feeding and selling practices employed,contractual and financial arrangements, technological innovations, and animal health practicesemployed.
Number and Size of Feedlot Operations
Dramatic shifts occurred in the cattle feeding industry between 1970 and 1998 (Table 8). The CornBelt ranked first in numbers of cattle on feed in the U.S. in 1970. By 1998, however, cattle on feedin the Corn Belt had declined almost 60%. The predominant cattle feeding regions in 1998 were theNorthern Plains with 37% of the cattle on feed, followed by the Southern Plains with 24%, and theMountain states with another 15%. Over the same 1970 to 1998 period, the Pacific region (primarilyCalifornia) also experienced a decline of cattle on feed of more than 60%.
The decline of the cattle feeding industry in the Corn Belt between 1970 and 1998 can be attributedprimarily to the lack of economy of size for most feedlot operations and the absence of continuousspecialized management in cattle feeding since cattle feeding operations in the Corn Belt were

15
predominantly small-scale farmer-feeders. These combination of factors, among others, contributedto a substantial competitive disadvantages in cattle feeding by Corn Belt feeders compared to theNorthern and Southern Plains where large scale commercial feedlots predominate (Dietrich 1969and 1971).
With the proliferation of large-scale commercial cattle feeding, and subsequent construction of large,specialized cattle slaughter and processing facilities near concentrated cattle feeding areas, the Plainsarea became the dominant cattle feeding area in the 1980s and 1990s (Table 8). The NorthernPlains, the Southern Plains, and the Mountain states (primarily Colorado) have become the dominantcattle feeding belt in the U.S. as projected by Dietrich in 1971. Together, these three areasaccounted for more than three-fourths of the U.S. cattle in feedlots in 1998.
The number of U.S. cattle feedlot operations declined from almost 184,000 units in 1970 to 104,071units in 1998 (Table 9 and 10). Farmer-feeder operations, lots with less than 1,000 head one-timefeeding capacity, accounted for 99.9% of the decline in feedlot numbers. Corn Belt farmer-feederoperations declined from 105,192 in 1970 to 35,900 in 1980, representing more than 87% of the U.S.feedlot decline over that period.
The second major change in the U.S. feedlot structure was an increase in feedlots with a 16,000 heador more, one-time feeding capacity from 149 in 1970 to 249 by 1998. The major impetus for thischange has been an attempt by feeders to realize economies of size in feedlot operations to reduceper head cost of feeding by spreading annual fixed costs over a larger number of output units(Dietrich, Thomas, and Farris 1985). Attempts to realize economies of size were especially evidentin the number of feedlots with a 32,000 head or more capacity which increased by 150% between1970 and 1998 (Table 9). Construction of such large, commercial cattle feeding facilities was mostprominent in the commercial cattle feeding states of Kansas, Nebraska, Texas, and Colorado.
Fed Cattle Marketings by Size of Feedlot and Region
Fed cattle marketings in the U.S. increased from 24.9 million in 1970 to 26.7 million head by 1998(Tables 10 and 11). Although farmer-feeders marketed 45% of the fed cattle in 1970, theyaccounted for less than 15% of the total U.S. fed cattle sold in 1998. Much of the decline occurredin the Corn Belt and the upper Northern Plains where fed cattle marketings by farmer-feedersdeclined 72% and 74%, respectively, between 1970 and 1998 (Table 10). States experiencing thelargest decline in fed cattle marketings by farmer-feeders during this period were Iowa, Nebraska,and Illinois.
Fed cattle marketing by commercial cattle feedlots (lots with 1,000 head or more one-time capacity)increased by more than two-thirds between 1970 and 1998 (Table 11). Fed cattle marketings fromcommercial feedlots during this period increased in all states except Arizona, New Mexico andCalifornia. Although generally benefitting from economies of size, feedlots in Arizona, NewMexico, and California suffer a locational competitive disadvantage with respect to readily availablesupplies of feed grains and feeder cattle. Such impediments are often a major disadvantage tosuccessful cattle feeding operations in a highly competitive industry (Dietrich 1971).
16
The USDA began reporting fed cattle marketings by size of feedlot during 1998 for commercialcattle feeding operation for the 12 states shown in Table 11. While the data reported for those 12major commercial cattle feeding states are highly useful, regional analysis is limited since data arenot available for all states within specified regions. Nevertheless, the data provided are useful foranalyzing some of the major changes in commercial cattle feeding between 1970 and 1998.
Texas, Kansas, Nebraska and Colorado are currently the predominant commercial U.S. cattle feedingstates, accounting for almost 80% of the fed cattle marketed by commercial feedlots during 1998(Table 11). An analysis of marketing by size of feedlot indicates that feedlots with a 32,000 heador more capacity accounted for more than 45% of the U.S. commercial fed cattle marketed during1998, followed by lots with 16,000 to 31,999 head capacity with another 24% or a total of almost70% by the two largest feedlot size categories. In contrast, these two size groups accounted for only44% of the fed cattle marketed by commercial feedlots in 1970. The changing structure of thecommercial cattle feeding industry is further evidenced by the decline in the number of fed cattlemarketed by feedlots with less than 8,000 head capacity in 1998 compared to 1970 in most of thecommercial cattle feeding regions. Fed cattle marketed by these small commercial feedlots declinedfrom 33% of total U.S. fed cattle marketed by commercial lots in 1970 to less than 18% in 1998.Past research has shown that the commercial cattle feeding industry is a capital-intensive industrywhich requires high levels of expertise in such areas as buying and selling cattle, purchasing feed,healthcare, and financial and personnel management (Dietrich, Thomas, and Farris 1985). Pastresearch has also shown that given the competitive advantages associated with economies of sizeand their general advantages in feeding, feed procurement, marketing, healthcare, and management,commercial feedlots are likely to continue increasing in number and size. The number of smallercommercial feedlots are almost certain to continue declining (Clary, Dietrich and Farris 1984).
Cattle Feeding and Marketing Practices
Cattle feeding practices associated with such factors as days on feed, placement and market weight,ration ingredients, and kind of cattle placed on feed vary by region, season, price of feeder cattle,feed ingredients, size of feedlot, price of fed cattle, and other factors. Days on feed are generallythe lowest in traditional cattle feeding regions like the Northern and Southern Plains, the Mountainstates, and the Corn Belt and somewhat higher in non-traditional cattle feeding regions like theNortheast, the Southeast, and the Delta regions during (Table 12). Placement weights tend to beheavier in the Corn Belt, the Lake states, and the Northern Plains than in the Mountain and SouthernPlains regions. The weight at which cattle are placed on feed is impacted by the sex of the animals,available grazing and growing conditions, economic considerations, and strategies relating to theprices and weights of feeder cattle, the cost of feed ingredients, and the cost of gain in feedlotsversus stocker cattle cost of gain. Placement weights are currently reported by the USDA for onlya limited number of states which limits detailed seasonal and regional analyses of placementweights.
Market weights of fed cattle are relatively uniform among the major cattle feeding regions.Slaughter firms market the majority of their beef production as boxed beef which requires relativelyuniform carcass weights. Steers and heifers carcass weights, however, have increased substantially

2 See Wilcox et al. (1927) for a discussion of cattle feeding in the 1920s.
17
since 1970, reflecting current feeding practices and the increased proportion of cattle beingslaughtered as fed cattle. The average dressed weight of steers slaughtered under federal inspectionincreased from 683 pounds in 1970 to 764 pounds in 1997 while heifer carcass weights increasedfrom 573 pounds to 703 pounds over the same period.
Feed conversion ratios (the pounds of feed per pound of gain) are generally highest in the Lakestates, the Corn Belt, and Pacific states (Table 12). Regions with higher feed conversion ratiosgenerally include substantially larger proportions of high moisture feed ingredients (e.g., silage andby-product feeds) in the cattle feeding rations than do regions with lower feed conversion ratios.The economic objective of cattle feeding is to obtain pounds of gain at a profit which is bestachieved through least-cost feed ration mixes for given energy requirements. The regionalcomposition of such rations varies and depends on the available supplies and cost of feed ingredientsgiven the available feed processing technology.
The volume and composition of cattle feeding rations varied substantially among regions in the U.S.during 1997/98 (Table 13). Cattle finished in U.S. feedlots consumed about 4,100 pounds of feedper head, on an as is basis, during 1997/98 with total rations varying from 3,900 pounds per headin the Southern Plains to more than 5,000 pounds per head in the Northeast and Pacific regions(Table 13). The major feed ingredient in cattle feeding rations is grain which averaged about 70%of the cattle feeding rations during 1997/98. The second most used feed ingredient was silage,followed by hay and roughage, and pre-mixes, protein supplements, additives, etc.
The basic feed grain ingredient in most major cattle feeding regions is corn which can be replacedor partially substituted for in cattle feeding rations by such feed grains as sorghum, wheat, andbarley depending upon market price relationships. Corn accounted for more than 83% of thecombined corn, barley, grain sorghum, and wheat used for livestock and poultry feed in the U.S.during 1975/76 and 1996/97 (Table 14). Further, U.S. corn and grain sorghum producers dependupon sales to the domestic livestock feeding industry for only 60% and 68%, respectively, of theirproduction. The remaining 30% to 40% is sold in the export market or to domestic food, alcohol,and industrial use industries. The two major outlets for wheat were the export market and thedomestic food, alcohol, and industrial use industries with the livestock feed industry a distant third.
Grain rations in the Corn Belt, the Lake States, and much of the Northern Plains and Mountainregions typically consist of 90% to 100% corn. Although the major feed grain ingredient inSouthern Plains feed grain rations is also corn, grain sorghum has become a major feed ingredientin that region. Since the advent of steam flaking technology, grain sorghum has been widely usedby cattle feeders in the Southern Plains, the Central Plains, and in the Southwest. Nevertheless, cornhas remained the major feed grain ingredient in cattle rations since almost the inception of cattlefeeding2.

18
A recent study of fed cattle procurement by Williams et al. (1996) indicates that about 69% of allfed cattle are sold on a liveweight basis (Table 15). The second most important sales method iscarcass weight and grade, followed by carcass weight, and contracting. Sales of fed cattle on aformula or rail basis are generally not used by feedlots. The proportions of fed cattle merchandisedunder a particular sales method tends to vary by region. For example, a 1985 study of cattle feedingshowed that more than 90% of the fed cattle in Texas feedlots were sold on a direct to packerliveweight basis (Dietrich, Thomas and Farris 1985). An earlier study reported similar results forArizona (Menzie, Hanekamp, and Phillips 1973).
Contractual and Financial Arrangements
Contractual arrangements, including custom feeding practices, and financial arrangements vary bysize of feedlot and by region. Under custom feeding arrangements, feedlots provide facilities,management, healthcare, feeding services, feed, and usually selling services to clients or owners ofnon-feedlot cattle for a fee. Because 95% of cattle feeding costs are short-term or variable costs andbecause more than 90% of the variable cost is accounted for by feed, interest on feeder cattle andfeed, and death loss, custom feeding offers some economic advantages to feedlots. Custom feedingdecreases their working capital requirements and spreads the high risk, short-term capitalrequirements over many cattle owners (Dietrich, Thomas and Farris 1985).
Custom feeding charges are usually assessed on the cost of feed plus a mark-up ranging from 10%to 30% above feed costs to cover handling, milling, labor costs, and feedlot management.Assessments for medication, vaccination, branding, dehorning, etc. are generally made on a per headbasis and are not included in custom feeding charges. Regional variations exist relative to types ofcharges assessed above basic feed costs. For example, some feedlots assess a per head per day feeto cover such charges while others assess a daily pen charge per head of cattle fed. The proportions of cattle fed on a custom basis vary by size of feedlot and region. Generally, thepercentages of cattle fed on a custom basis increase with feedlot size. The percentages of cattle fedon a custom basis in the Southern Plains, the Mountain states of Colorado and Arizona, and thesouthern Northern Plains area range from 40% to 90%. Custom clients include professional cattlefeeders who feed in several feedlots at the same time, ranchers and non-farm cattle owners such asdoctors and lawyers who wish to retain ownership through another production phase, feedmanufacturers, slaughter plants, etc.
The primary source for operating capital for feedlots and custom clients are commercial banks,followed in importance by PCAs (Production Credit Associations), finance companies, andindividuals. Commercial banks have been the most important source of financing for fixedinvestments. However, as they increase in size, feedlot owners often use insurance companies asa source for funding capital investments.
Animal Health Practices

19
Feedlot animal health practices focus on disease prevention and control. Feeder and stocker cattleprocessed by feedlots as cattle are placed on feed are closely monitored for signs of sickness, diseaseor animal health concerns and normally given a battery of vaccinations consistent with the seasonof the year and practices of feedlots in a region. Feedlot animal health practices include usage ofantibiotics in feed and water as well as injections, vitamin injections, clostridial and nonclostridialvaccinations, and internal and external parasite control (Feedlot Health Management, NAHMS).Feedlots generally administer antibiotics in feed for 90 days or more, while antibiotics are alsoplaced in water for 8 days or more for cattle arriving in feedlots. Antibiotic injections (regular orlong-lasting) were administered to less than 20% of the cattle fed by feedlots surveyed by NAHMSin 1993/94. Similarly, vitamin injections were administered by almost 60% of the feedlots surveyedby NAHMS.
Clostridial vaccinations as enterotoxemia - overeating, blackleg, malignant edema, black disease,etc. were administered by 90% or less of the feedlots surveyed by NAHMS depending on the typeof vaccination. Similarly, non-clostridial vaccinations as bovine viral diarrhea (BVD), infectiousbovine rhinotracheitis (IBR), parainfluenza (PI3), and bovine respiratory syncytial virus (BRSV),etc., were administered by 96% or less of the feedlots surveyed by NAHMS in 1993/94. Feedlotswith less than 1,000 head one-time capacity generally administered the clostridial and non-clostridialvaccinations at one-third to one-half the rate at which such vaccinations were applied by feedlotswith 1,000 head or more capacity.
According to NAHMS, commercial feedlots treated cattle placed on feed for internal and externalparasites as worms, flukes, cattle grubs, ticks, cattle lice and mites. The incidence of treatmentranged from 43% to more than 96% of the feedlots depending upon type of parasite.
Technological Innovations
A combination of technological innovations in cattle feeding over the last 30 years has shaped itsdevelopment, including technological advancements in feed milling and processing and bulk feedmixing and distribution which have facilitated timely, efficient, and large-scale commercial cattlefeeding systems. For example, the development of corn flaking and steam flaking of grain sorghumincreased the total digestible nutrients of these feeds for cattle feeding which enhanced theconversion feed energy into meat and muscle. Innovations in processing and management of cattlefeeding have also been important for the development of the cattle feeding industry, includingimprovements in feedlot design and layout which facilitated efficiencies in feed distribution, feedlotrunoff control systems, and cattle handling systems to reduce excessive cattle movement whichaffects the rate of gain and meat loss from bruising as cattle approach their finished stage. Alsohighly important has been the availability of state and federal market information systems and ofhighly specialized feed nutrition and animal health expertise.
Equally important has been the development and usage of growth promoting agents in beefproduction to insure the competitiveness of beef with alternative protein sources and to increaseproducer returns. Most supplemental growth hormones are administered through implants. In thisprocess, natural or synthetic sex steroid implants are usually placed into the ears of young calves or

20
feedlot cattle. Due to the low, constant blood supply to the ear, the implants release hormone at aconstant rate over a period of 80 to 200 days, depending on the brand chosen. Implants improvegrowth rate and feed conversion efficiency by 5% to 15% and also increase the amount of leanmuscle tissue that the cattle gain while decreasing rates of fat deposition. The use of anabolicimplants reportedly result in an annual increase in production of 734 million pounds of beef in theU.S. while saving 2.9 million tons of feed (Anderson and Males 1998). Implants typically cost$1-$2 each and return $10-$15 to the beef producer for each dollar invested.
Since most implants include estradiol or some other form of estrogen, consumer and food safetyawareness groups, environmental activists, and others have questioned whether beef from implantedcattle contains levels of estrogenic activity that pose a health risk. The health risk debate of steroidimplants has reached international levels. The European Union (EU), for example, has bannedimports of beef from cattle treated with growth hormones. Research, however, has failed to find astrong link between the use of growth promotants in the production of beef and human health. Eventhough the estrogen content of the kidney and liver (the tissues that are involved in estrogenexcretion) in implanted steers is raised to the levels found in unimplanted heifers, researchers havegenerally concluded that the increase in estrogen exposure in humans from consuming meat fromcattle treated with growth hormones is negligible (Anderson and Males 1998). The Council forAgricultural Science and Technology (CAST) reports that "in a meal of mashed potatoes, wholewheat bread, green salad, green peas and ground round steak from estrogen-treated cattle, the foodthat would contain by far the least estrogenic potency is the ground round steak" (quoted inAnderson and Males 1998).
The debate on the use of growth hormones, however, is far from being settled. In the continuingdispute over the EU ban on imports of beef produced with growth-promoting hormones, the WorldTrade Organization (WTO) Appellate Body ruled in January 1998 that the EU beef ban is not basedon scientific evidence and, thus, violates international trade rules. The U.S. recently announced thatthe EU has until May 13, 1999 to either lift the ban or provide scientific justification for it.Otherwise, the U.S. has threatened to slap a long list of EU products with 100% import duties inretaliation. Other continuing concerns about hormone residues in meat from growth promotantsfocus on reports that such residues can facilitate carcinogenic activity already initiated in the humanbody although such residues are not themselves carcinogens.
Also, concerns continue regarding the potential effects of the use of the growth hormone known asbovine somatotropin (BST), a protein hormone produced naturally in the pituitary glands of allcows. Biotechnologists have produced a recombinant form of this protein called rBST which isadministered to lactating cows and improves their efficiency as milk producers. The mammaryglands of such dairy cows take in more nutrients from the bloodstream and, consequently, producemore milk. Cows supplemented with BST increase their overall milk production between 5% and10% without proportionately increasing production costs. While the consensus among scientists isthat BST, whether recombinant or natural, has no biological effect on humans, concerns are stillraised about possible health effects of a potential increase in the hormone content of milk. The U.S.Food and Drug Administration (FDA) approved the use of rBST for use in dairy cows in 1993.Proponents say it will enable farmers to bring consumers a safe supply of milk products more

21
efficiently, an innovation that would especially benefit nations suffering from hunger andmalnutrition. Because of concerns that the use of BST would cause a substantial increase the U.S.milk supply and, thus, lower returns to milk producers, a number of farm activists formed allianceswith some consumer groups to fight its introduction. Although they lost the fight, they helped createa large and growing market for organic milk and milk not produced with hormones. Opponents alsopoint to other concerns such as a possible link between BST and breast cancer rates because BSTis reported to stimulate the production in cows of a compound known as insulin-like growth factor(IGF-I). Consequently, opponents have insisted insist that milk produced with BST be labeled assuch. Anti-biotechnology activists express concerns that BST poses consumer and animal healthrisks due to a slight change in the molecular structure of the genetically engineered BST molecule.Opponents also argue that there is a difference in the fatty acid content of the milk from BST-treatedcows and cows not so treated. The FDA has disagreed on both points and, so far, milk from BST-treated cows has not had to carry a BST label.
Cattle Slaughtering, Processing, and Beef Wholesaling
The function of cattle slaughtering firms is to convert live cattle (steers, heifers, cows, and bulls)into dressed beef carcasses for further conversion at the slaughter level or by other processors orwholesalers into the form or type of product demanded at the retail level and/or other end users.Many forces affect the volume of cattle slaughtered by state and region, the number and size ofcattle slaughter plants and concentration in the cattle slaughter industry. Both technologicalinnovations and the role of meat inspection and regulatory agencies have been particularly importantfactors in the development of the cattle slaughtering, processing, and beef wholesaling industries.
Cattle Slaughter by State and Region
Major changes occurred in the cattle slaughter industry between 1970 and 1997 relative to theregional location of slaughter, the size of cattle slaughter plants, changes in the number of totalslaughter plants, and changes in the composition and slaughter weights of cattle slaughtered.
Slaughter levels dropped sharply in the Corn Belt, the Southeast, the Appalachian and Delta states,and the Pacific states between 1970 and 1997 (Table 16). The combined slaughter in these regionsdropped from 15.1 million head (43% of the U.S. commercial slaughter) in 1970 to only 5.0 millionhead (14% of the U.S. commercial cattle slaughter) by 1997. The greatest percentage declineoccurred in the Delta region. The largest absolute decline in the number of head slaughtered,however, took place in the Corn Belt, primarily the result of the demise of numerous small farmer-feeder cattle operations. The cattle slaughter decline in the Southeast, Appalachia, and the Deltastates was due mostly to a declining dairy industry in those areas. Cattle feeding has not been highlysuccessful in those three regions primarily because they face a large deficit in feed grain supplies.Likewise, cattle slaughtering has not flourished in those regions either both because of the limitedand declining supplies of fed cattle and the passage of the 1967 Wholesome Meat Act which has

22
made it difficult for many of the smaller and older slaughter establishments in those areas to meetmeat inspection standards. The slaughter decline in the Pacific region occurred primarily inCalifornia where fed cattle marketing decreased more than 70% between 1970 and 1998.
Commercial cattle feedlot operations have flourished in the Northern Plains and the Southern Plainswhich now account for about 60% of the total commercial cattle slaughter (Table 16). TheMountain and Lake states also figure prominently as cattle slaughtering regions. More than two-thirds of the commercial slaughter in the Mountain states took place in Colorado which has been amajor cattle feeding state. The relatively large commercial cattle slaughter in the Lake states wasdue primarily to the concentrated dairy cow operations in this region. The Lake states accountedfor one-fourth of the U.S. dairy cow inventory in 1998.
The increased cattle feeding activity in the U.S. is reflected primarily in the growth of average cattleslaughter weights between 1970 and 1998 (Table 17). Over that period, the average cattle slaughterweight rose almost 15% or 154 pounds per head slaughtered. Consequently despite little change inthe total number of cattle slaughtered over that period, the production of beef was 4.1 billion poundshigher in 1998 than in 1970 (Table 17). The increased production of beef over that period was alsoachieved despite little change in the proportion of total commercial cattle slaughter accounted forby fed steers and heifers (Table 18).
Number and Size of Cattle Slaughter Firms
Along with a major shift in the regional location of commercial cattle slaughter and a decline innumber of federally inspected slaughter plants between 1970 and 1997, commercial cattle slaughterand the increasingly sophisticated beef processing and boxed beef operations became increasinglyconcentrated over that period in a relatively few large, specialized, and highly efficient cattleslaughter and beef processing operations. During 1997, 14 slaughter plants slaughtered in excessof one million head of cattle, accounting for 50% of the federally inspected cattle slaughter (49.3%of the total commercial cattle slaughter) (Table 19). Assuming a 50-week, 5-day-per-week slaughteroperation, the average daily cattle kill in these plants would have had to have been about 5,100 head.Because such a large daily kill volume requires a large and consistent quantity and quality offinished cattle, the majority of these plants have located in or near the regions with highconcentrations of large commercial cattle feeding operations to minimize the costs of cattleprocurement and beef distribution.
Federally inspected slaughter plants which slaughtered 100,000 or more cattle during 1997represented less than 8% of the federally inspected cattle slaughter facilities but accounted foralmost 93% of the cattle slaughtered that year. Table 19 reveals, however, that 586 plants, or 71.2%of the FIS cattle slaughter plants, killed less than 1,000 head per plant during 1997, accounting forless than 0.5% of the FIS cattle slaughtered that year. Further, assuming a 50-week, 5-day-per-weekslaughter plant operation, the average kill per day for 71.2% of the FIS plants was only 1.2 head perday. In addition, according to USDA data, the cattle kill per day for 708 FIS plants representingmore than 86% of all FIS plants was only 3.1 head per plant. In other words, a majority of the U.S.

23
FIS plants slaughtering cattle during 1997 were not a competitive force in the national beef market.These plants generally serviced small, local markets.
Following passage of the Wholesome Meat Act in 1967, the total number of slaughter plantsdeclined by more than 50% between 1970 and 1998 (Table 20). The decline occurred across allregions of the U.S. and included primarily the slaughter plants classified as “other,” i.e., mostlysmall, older non-FIS plants some of which had been subject to state or local inspection while othershad not been subject to any type of inspection. The Wholesome Meat Act forced these smallerplants to either renovate to meet FIS standards or cease operations altogether. Most chose to ceaseoperations, resulting in a decline in the number of these smaller plants from 7,400 in 1969 to 6,418by 1970 and only 2,372 by 1998 (Table 20). Meanwhile, the number of FIS slaughter plants in thecontiguous 48 states increased from 725 in 1970 to 954 by 1998.
Concentration in the Cattle Slaughter Industry
Concentration of cattle slaughter among the top four firms increased substantially during the last twodecades as a result of mergers, acquisitions and construction of new slaughter and processingfacilities (Azzam and Anderson 1996). The top four steer and heifer slaughtering firms increasedtheir proportion of total U.S. steer and heifer slaughter from 36% in 1980 to more than 80% by 1996(Table 21). The number of steers and heifer plants operated by the top four firms increased only22% from 1980 to 1996. Consequently, much of the increase in cattle slaughter by the top fourslaughtering firms was the result of a large increase in steer and heifer slaughter capacity per plant.
The concentration ratio (i.e., the proportion of the total accounted for by the largest firms) in theboxed beef sector also increased dramatically over the last two decades. The share of total boxedbeef processed by the top four firms increased from 53% in 1980 to 90% by 1997 (USDA 1998).The increasing concentration of this industry also reflects the highly specialized and large capacityfacilities of the top four firms in boxed beef processing who enjoy a competitive position indistributing boxed beef directly to most of the major retail outlets.
Technological Innovations
The major innovations in cattle slaughtering and beef processing over the last three decades havecoincided with the growth of the large volume, highly specialized cattle slaughter facilities. Mostof these large slaughter facilities have developed sophisticated boxed beef fabrication systemsinvolving automated storage, handling, and inventory control systems which facilitate efficient andtimely control of inventories and expeditious distribution of boxed beef to customers in the form,quantity, and quality demanded. These systems have revolutionized cattle slaughtering and beefprocessing and distribution and forced changes in the handling and storage systems at the retaillevel. At the same time, modern boxed beef fabrication systems have facilitated efficiencies in beeftransportation, purchasing and storage of beef products at retail, and inventory and quality controlat the packer, wholesale and retail levels.
Meat Inspection and Regulatory Agencies

24
The livestock and meat industry is faced with a wide array of regulations dealing with such itemsas health standards, wholesomeness of product, animal disease, unfair trade practices, humanerequirements, meat import laws, environmental concerns, pollution, water and air quality, fiduciaryrequirements, and safety standards.
Meat inspection laws were enacted in 1891 and 1895 but provided little or no protection forconsumers against health hazards. The principle meat inspection acts were the Meat Inspection Actof 1906 and the Wholesome Meat Act of 1967. In general, the purpose of meat inspection is to (1)eliminate diseased and unwholesome meat from human consumption, (2) maintain sanitaryconditions during slaughter and processing, and (3) prevent the addition or use of harmfulingredients to meat and meat products. Federal inspection expenses are borne by the federalgovernment. Plants or firms wishing to trade in interstate commerce must operate in federallyinspected facilities. Federal inspection includes ante- and post-mortem inspection of animals andcarcasses, inspection of plant operations and facilities, inspection of ingredients used for processing,checks on truthfulness of labeling, inspection of imported meats, inspection of plants in foreigncountries shipping meat to the U.S., and examination of plans and specification of plants applyingfor FIS status.
The 1967 Wholesome Meat Act further strengthened the provisions of the 1906 act by requiring (1)each state to establish inspection standards and procedures for red meat at least equal to those of thefederal government and (2) states which did not comply to submit all non-FIS plants selling meatto federal inspection. The most recent changes in meat inspection requirements involves theHACCP (Hazard Analysis Critical Control Point) concept, considered to be a sophisticated, science-based food safety program that makes the separate livestock, manufacturing and retailing segmentscollectively responsible for food safety. The HACCP concept essentially transfers food safetyresponsibilities from the government to industry.
Major programs and regulations impacting the cattle and beef industry include the following:
• Animal and Plant Health Inspection Service (APHIS) originally established as the Bureauof Animal Industry in 1884 and has the authority and responsibility to control and eradicateanimal disease;
• Food and Drug Administration (FDA) established in 1906 to assure the public ofwholesome, sanitary, unadulterated and truthfully labeled foods.
• Federal Trade Commission (FTC) established in 1914 to curb unfair trade practices; • Livestock Market News Service established to1916 but did not become workable until the
USDA established official standards for market classes and grades for carcass beef whichprovided a common terminology throughout the cattle and beef industry. The LivestockMarket News Service is currently a cooperative federal-state program providing marketinformation throughout the livestock and meat industry;
• Packers and Stockyard Act enacted in 1921 to regulate business practices of those who buyand sell livestock and meat. This Act gives the U.S. Secretary of Agriculture authority overpublic livestock markets, market agencies, dealers, packers, and wholesalers who sell andbuy livestock and meat;

25
• Environmental Protection Agency (EPA) established in 1970 to regulate the interface of theeconomy and the environmental by integrating research, monitoring, standard setting, andenforcement;
• Occupational Safety and Health Administration (OSHA) established in 1970 to developsafety standards, issue regulations, conduct investigations, and issue citations for non-compliance with safety standards and regulations;
• Water Quality Control Act enacted in 1972 to set standards concerning pollution and waterquality control standards;
• Commodity Futures Trading Commission (CFTC) established in 1974 to prevent pricemanipulation and unfair trading practices in the trading of futures commodities;
• Water and Air Pollution Control Acts gave jurisdiction of cattle feeding and slaughterindustries to state-level Water Quality Control or Water Pollution Control Agencies (Menzie,Hanekamp and Phillips 1973);
• Hazard Analysis Critical Control Points (HACCP) enacted in 1996 requiring all FIS meatand poultry slaughter and processing plants to develop a HACCP plan for each plant and todevelop a written daily sanitation standard operating procedure. Further, the Food SafetyInspection Service is empowered to test for Salmonella while slaughter plants are to test forgeneric E. Coli on carcasses.
Beef Retailing
The U.S. beef retailing system operates to make beef available at specified prices in the form, time,quantity, quality and location demanded by end users. Form refers to the type and weight of cut,packaging systems, and either fresh, frozen, processed, semi-cooked, cooked etc. Beef retailingincludes the sale of beef or beef products at supermarkets and grocery stores, convenience stores,meat markets, restaurants and fast food outlets, commissaries, etc.
Type, Number and Size of Beef Retailing Firms
The retail food industry has undergone more changes in the last three decades than have most othersectors of the food industry. The industry is characterized by declining store numbers and largeincreases in store size and sales per store. For example, grocery store numbers declined from193,000 in 1972 to 128,000 by 1995 (Table 22). Over the same period, sales per grocery storeincreased from $475,000 to $3.2 million (Table 22).
The U.S. grocery store industry of the 1990s is characterized by large supermarkets which representless than 25% of the grocery stores but account for more than 75% of grocery sales (Table 22).Further, supermarket sales averaged $10.5 million per store in 1995 compared to $1.3 million salesper store for the “other,” smaller, non-supermarket grocery stores. These smaller “other” grocerystores are finding it difficult to compete with the supermarkets, suffering a nearly 50% decline innumbers between 1985 and 1995 (Table 22).
The grocery store industry is also experiencing a rapid proliferation of convenience outlets whichnow account for 44% of total grocery stores but less than 7% of grocery sales (Table 22).
26
Convenience stores sell mostly non-perishable or frozen items and are generally not important retailoutlets for fresh meat, especially beef.
Other important retail outlets for beef include eating establishments such as restaurants, cafeterias,institutions, etc. The U.S. Census of Retail Trade (Department of Commerce) reported 377,760eating establishments in the U.S. during 1992. According to the 1995 Directory of ChainRestaurants, the majority of U.S. eating establishments are fast food restaurants followed by familyrestaurants (Table 23). Hamburgers were the most popular menu item offered by fast food restaurantchains during 1994 followed by pizza, sandwich items, and chicken (Table 24).
Percent of Beef Handled by Type of Beef Retailing Firms
Although small volumes of beef are purchased directly from packers and wholesale distributors byend users, such purchases represent a small proportion of total beef sales (Dietrich, Williams, andMiller 1963). The predominant retail outlet for beef are retail grocery stores accounting for 60%or more of the total beef retail sales during the 1990s (Supermarket Business 1992 and 1998).Furthermore, 80% of the beef sales by retail grocery firms were accounted for by supermarketgrocery stores (stores with annual sales of $2 million or more) during 1991 and 1997. Theremaining 40% of the beef sold at retail during 1997 was merchandised almost exclusively by thehotel, restaurant, and institution (HRI) trade. Although important outlets in some local areas,independent meat markets account for small proportions of beef merchandised nationally each year.The importance of the HRI retail outlet is further emphasized by USDA research showing thatexpenditures on food eaten away from home increased from 34% of total food dollars in 1970 to47% by 1995 (Dumagon and Hackett). Although per capita beef consumption in the U.S. hasdeclined annually since 1976 when commercial beef production reached an all time high, analysisof expenditures at commercial eating establishments in 1989 revealed that hamburgers ranked firstwith 15.1% of the sales while beef steaks ranked fifth with 4.4% of the expenditures (Dumagon andHackett).
Beef Purchasing and Merchandising Practices
Beef purchases or orders for purchases by individual retail grocery stores and restaurants, especiallythose affiliated with chains, corporations, restaurants, or supermarket groups, are generallycoordinated through a central or regional purchasing office. Several decades ago, most large retailfirms owned and operated regional warehousing and fabrication centers where fresh meat and curedproducts were assembled, processed, and packaged as required, prior to store door delivery.However, with the advent of boxed beef, almost all beef items are now purchased and deliveredintact as boxed beef. Under the boxed beef system, carcasses are broken down into primals, sub-primals or specific beef items, which are then vacuum-packed in plastic bags and placed in speciallyfabricated boxes with appropriate labeling, coding, and specific information as required forinventory and quality control and to fulfill shipment specification. The boxed beef system may alsoinclude case-ready beef items. Many of the smaller retail grocery outlets and restaurants aredependent upon wholesale distributors and fabricators to fill their beef requirements. Such

27
distributors cater to their clients’ trim, weight, and quality specifications for specific cuts orprocessed items which are delivered directly to individual outlets on a weekly or bi-weekly basis.
Most grocery retailers use a minimum of 2 to 5 suppliers of fresh meat and beef to assure adequatesupplies, consistent quality, and competitive prices. Sources of price information and pricedetermination generally vary by size of buyer versus seller. The wholesale meat price informationsource used most often include The Yellow Sheet, published by the National Provisioner’s dailyMarket and News Service; the Meat Sheet, also known as the “Pink Sheet,” published by the MeatSheet; and Market News, published by the USDA. Retailers often use these sources as pricingguides or to develop formulas for establishing their purchase price. Retailer also use these sourcesin purchasing meat under the “offer and acceptance” method in which packers provide prospectivebuyers with a price list by type of meat item for the following week. Meat supervisors of the retailfirms place orders with packers quoting the lowest or best price for delivery on specified dates basedon previous orders from individual store managers. Meat purchases or orders involving “specials”require coordination between the supplier and purchaser regarding price discounts, volumerequirements for specialized item(s), and delivery dates. Suggestions for specials may be initiatedby suppliers who occasionally begin accumulating relatively large inventories of specific beef cutsor sub-primals.
The selling practices of beef retailers vary by region, size, and type of retailer depending upon suchfactors as ethnic background and income levels of clients, national or state promotional programsin effect, etc. Beef items are merchandised predominately on a “self-service” basis by groceryretailers in refrigerated display cases with varying shelf space allocated to specific cuts dependingon season, price, “specials” and promotion programs in effect, etc. Box beef cuts are often preparedfor purchase on a daily basis in the cutting, packaging, and price labeling area of the retail meatdepartment.
Mark-up margins for fresh and processed meat items vary by type of meat. Most retailers use apredetermined mark-up to establish prices for fresh and processed meat items. Composite grossmargins for beef items may vary from 18% to 30%. The average margin on beef sold bysupermarkets in 1997 was 22.8% (Supermarket Business 1998). Gross margins for specific beef cutsvary depending upon service requirements such as special trimming, shelf-life, pilferage, ease ofconversion into hamburger meat after no-sale in display case, etc.
Meat promotions and specials have become a standard business practice for many retailers sincesuch programs are conducted on an almost continuous basis. Such programs are often considerednecessary for either increasing beef or store sales, keeping sales from falling or maintaining marketposition.
The U.S. Cattle and Beef Marketing System
The overall function of the U.S. cattle and beef marketing system is to produce and merchandise thevolume, quality and type of beef in the form, time, and place demanded by U.S. consumers. Besides

28
the structural aspects of the system and regulatory policies as discussed in the previous section, theperformance of the system is determined by many factors, including the efficiency of the pricingsystem, consumer preference and health- related factors, issues related to the quality of the beefproduced, and international beef market forces reflected in U.S. cattle and beef exports and imports.
Overview of the Cattle and Beef Marketing System
Some 35.5 million cattle moved through the cattle production and marketing system in 1998requiring feeding, slaughtering, further processing, and transportation activities to meet the demandfor beef by consumers (Figure 2). Except for imports, the marketing channel for beef begins at thefarm-ranch level where weaner calves, feeder calves (calves that are weaned at about 350 to 600pounds), and cull cattle are generally shipped to public markets, stocker-grower operations,feedlots, or directly to slaughter plants (Figure 2). Farms and ranches accounted for 94% of thecattle in the system with 6% imported primarily from Mexico or Canada. About 61% of the cattlein the system pass through public markets to packers, stocker-growers for further conditioning, orfeedlots. Public markets were also an important source of cull cattle for slaughter plants. About78% of all cattle pass through feedlots which depend on four major sources for their supply of feedercattle: (1) stocker-growers, (2) public markets, (3) direct purchases from farmers and ranchers, and(4) imports primarily of Mexican feeder cattle. Commercial slaughter plants purchased 75% of theirslaughter cattle from feedlots through buyers, 10% directly from farmers and ranchers, 14% frompublic markets, and 1% from imports, primarily from Canada. Public markets and farmers andranchers were the predominant sources for non-fed slaughter cattle purchases by packers.
The U.S. beef distribution system moved 28.3 billion pounds of beef from packers to consumersduring 1998. U.S. packers produced 91% of the beef entering the distribution chain while beefimports from Australia, Argentina, and elsewhere accounted for the remaining 9% (Figure 3). Thepredominant beef outlets for packers were retail grocery stores followed by merchant wholesalers,brokers, agents, etc. and direct sales to HRI outlets. Only about 55% of all beef in the system passesthrough retail stores who purchase almost their total beef requirements directly from packers. Muchof the small volumes of beef shipped by merchant wholesalers to the retail sector is destined forsmaller grocery outlets who account for a small proportion of the national beef retail sales.
Merchant wholesalers handle about one-fourth of the beef in the system and provide fabrication andspecialized services, especially to the HRI outlets which were the final destination of 42% of thebeef in the system (Figure 3). Branch houses primarily distribute processed and manufactured meatand food items but are relatively unimportant in the current beef distribution system.
At home consumption accounts for only about one-half of the beef in the system attesting to thestrength of the away-from-home market for beef. Exports to Japan, Mexico, and elsewhere accountfor the remaining 8% of U.S. beef sales (Figure 3).
Functioning of the Pricing System

29
In a perfectly competitive industry, the value of products offered by sellers as perceived by buyersis communicated from consumers to producers through the price signals generated by the interactionof supply and demand in the market. The individual preferences of many small consumers, takentogether, create a market demand which confronts the aggregate market supply made up of theindividual offerings of many small producers. The result of the confrontation is a market pricewhich reflects both the preferences of consumers and the decisions of producers. Increasedconsumer preference for a product like beef with certain quality characteristics is reflected in ahigher price for that product, signaling an opportunity for producers to expand production of theproduct with the desired characteristics. By the same token, an increase in the availability of aproduct relative to consumer preferences for it would be reflected in a lower price, signalingproducers to curtail production. If there are no obstructions in the system, producers will quicklyfeel the pull or push of consumers and vice versa as indicated by changes in market price.
Unfortunately, there are few agricultural markets in which the producers of the raw product interactdirectly with final consumers. As demonstrated in Figures 2 and 3, many groups now come betweenbeef producers and consumers whose functions are to transform or otherwise add value to the cattleoffered by producers before the beef product finally reaches the consumer's plate. Even so, theinteraction of supply and demand in a competitive environment at each level in the industry wouldstill mean that the price signals of consumers would be transmitted down through the system toproducers. Obstacles to communicating price from one level to the other, however, distort marketsignals and corresponding actions of market agents.
The level of competition in the beef industry, and, therefore, the efficiency with which pricescommunicate value from consumers to producers, has been the focus of heated and protracted debatein the cattle and beef industry. The primary concern is the extent to which concentration in the cattleslaughter industry provides a few packers with market power to extract rents from the system bycontrolling prices. Cattle producers argue that the oligopsonistic structure of the beef packingindustry (i.e., relatively few beef packers accounting for the majority of slaughter cattle purchased)eliminates price competition in cattle procurement. In this view, price determination in cattleprocurement is largely based on non-price factors, many of which have more to do with bargainingpower and personal relationships than with the quality or value of the product. Packers are seen asusing their market power to pay producers low prices for their cattle and charge high prices for thebeef they produce. If this is the case, then price is no longer an adequate signal of beef consumerpreferences.
Several recent studies have found limited support for producer claims that increased concentrationmay be allowing packers to exert market power in fed cattle markets (Azzam and Schroeter 1991;Stieger, Azzam, and Brorsen 1993; Koontz and Garcia 1997). However, packer concentration, perse, does not guarantee that fed cattle prices are being manipulated by beef packers (Azzam 1996;Stieger, Azzam, and Brorsen 1993). Indeed, concentration may be primarily the result of thenecessity to gain economies of size in order to survive (Azzam and Schroeter 1995). In addition,the effects of concentration on prices may be small compared to the effects of the many other marketand non-market factors impinging on fed cattle markets.

30
In a study funded by a congressional appropriation to explore the effects of packer concentration onslaughter cattle pricing and procurement, Williams, et al. (1996) analyzed the relationships betweenthe price paid by packers for slaughter cattle and market and quality characteristics associated withspecific slaughter cattle lots purchased daily by the largest 43 beef packers over the period of a year(April 1992 through April 1993). The empirical results indicate that while increases in regionalconcentration have a negative effect on the average price of fed cattle paid by packers, the effect issmall both in absolute terms and in relation to the effects of many other market and qualitycharacteristics of the cattle purchased. The study also found that while increasing concentration hasa negative effect on the average price of fed cattle paid by packers, associated increases in slaughtercapacity have a somewhat larger effect on the fed cattle price in the opposite direction. The resultssuggest that, in an effort to maintain production at maximum capacity, competition among packersfor available fed cattle intensifies with increasing slaughter capacity. This effect tends to mitigatethe negative price effects associated with greater regional concentration.
Research has also shown that if accurate, timely, and comprehensive market information isavailable, beef packers, jobbers, retailers, and other firms buying and selling meat and meat productscan make timely alterations in their sales territory and their method of shipment or packaging tominimize losses or take advantage of favorable prices (Dietrich 1967). Furthermore, accurate andtimely market information also serves as a price stabilizer by facilitating trading and fosteringcompetition among local as well as more distant buyers and sellers.
Per Capita Consumption of Beef and Consumer Related Factors
Per capita consumption of beef in the short-run is analogous to per capita supply and is governedby annual production. However, in the longer run, consumption of beef is impacted by such factorsas per capita disposable income, prices of beef and competing meat products, tastes and preferences,urbanization, occupation, season, ethnic background, religion, size and age distribution of family,health considerations, etc. (McCoy and Sarhan).
Perhaps the two most important factors affecting consumer purchases of beef are price and per capitadisposable income. While the price of beef is negatively related to the quantity of beef purchased,increases in per capita incomes increase the level of beef purchased, especially for the moreexpensive cuts of beef (McCoy and Sarhan). Over time, however, per capita beef consumption hasdeclined steadily from a high of 94.4 pounds (retail weight) in 1976 to about 67 to 68 pounds percapita in the 1990s despite substantial annual increases in per capita disposable incomes during thisperiod (Table 25). At the same time, at an inflation adjusted beef price of $2.54 per pound, U.S. percapita beef purchases were about 84 pounds in 1970 compared to 67 pounds at an inflation adjustedbeef price of $1.75 per pound in 1997 (Purcell 1998).
A heated debate has raged over why the per capita demand for beef has continued to decline despiteboth the increase in income and the lower real price of beef. A comparison of the per capitaconsumption and share of consumer income spent on beef, pork, and poultry between 1970 and 1998provides at least some of the answer (Table 26). While declining sharply for beef, both the percapita consumption and the percent of consumer income spent on poultry increased between 1970

3 U.S. Good was changed to U.S. Select in 1987.
31
and 1998. The relatively low prices and abundant supplies of chicken led consumers increasinglyto switch from beef to poultry as a protein source in their diets. These economic factors werereinforced by increasing health concerns related to beef consumption supported by widespreadpublicity concerning the possible contributions of beef and pork to higher cholesterol levels andobesity. The net result has been a shifting away from perceived fatter meats like beef to perceivedleaner meats like chicken and from animal fats to vegetable fats in consumer diets (McCoy andSarhan).
Changes In Quality of Beef Produced
The production of beef in the U.S., as determined by quality grades and yield grades, has undergonesubstantial change since the1970s (Table 27). Official grade standards for U.S. beef consist ofquality grades and yield grades. Quality grades determine palatability and are defined, from highestto lowest level of palatability, as U.S. Prime, U.S. Choice, U.S. Select, U.S. Standard, U.S.Commercial, U.S. Utility, and U.S. Cutter and Canner. A major determinant of palatability ismarbling or interspersions of flecks of fat in the muscle fibers which impacts tenderness, juiciness,flavor, and palatability. Other factors considered in determining quality grades are firmness andmaturity.
Yield grades were designed to measure cutability and to reflect differences in yield of bonelessclosely trimmed retail cuts. Yield grades for U.S. beef are numbered 1 through 5 on a decliningscale from highest to lowest percentage of retail cuts. Major factors accounting for variation in yieldgrades are amount of fat that must be trimmed and thickness and fullness of muscling. For example,a yield grade 5 tends to be an over finished product with excessive fat.
The percentage of the U.S. commercial beef production that is quality and yield graded increasedbetween 1975 and 1998 from 43% to 71% and from 38% to 64%, respectively (Table 27). Theincrease in quality and yield grading of beef parallels an increase in cattle feeding activity over thesame period. Fed cattle comprised 75% of the U.S. commercial beef slaughter in 1998 comparedto 52% in 1975. Further, the retail and HRI trade prefer U.S. graded beef since official U.S. gradesfacilitate the negotiation process in purchasing beef from suppliers. Also, U.S. grade designations( U.S. Prime, U.S. Choice, etc.) are an important tool in merchandising beef.
Major changes have also occurred in the distribution of quality and yield grades since the mid-1970sreflecting major changes in cattle feeding practices and type of cattle fed (Table 27). These changesprimarily represent attempts by the cattle feeding and beef industry to produce a beef productrequiring less fat trim. For example, of the beef quality graded in 1975, 77% was graded U.S.Choice followed by another 13% graded U.S. Good. However, by 1998, U.S. Choice accounted for60% and U.S. Select3 37% of the beef quality graded. At the same time, 64% of the beef yieldgraded in 1975 were assigned U.S. Yield Grade 3 compared to 31% that were assigned Yield Grade2. By 1998, Yield Grade 2 accounted for 50% and Yield Grade 3 36% of the beef yield graded.Also, more than 12% of the beef yield graded in 1998 was graded as U.S. Yield Grade 1 compared

32
to less than 2% in 1975. This is especially significant considering that almost two-thirds of the beefyield graded was graded as either Yield Grade 1 or 2 in 1998 compared to one-third of the total in1975.
U.S. Cattle and Beef Trade
The U.S. has exported and imported beef for more than three centuries. In 1652, farmers in theConnecticut Valley were stall-feeding cattle which they slaughtered and shipped to the West Indies(Ball 1992). Early accounts of U.S. agricultural trade indicate that the U.S. shipped beef, pork, andanimal products to New Foundland, Barbados, Jamaica, Portugal, and the Orient from the 1600sthrough the early 1800s.
Imports and Exports of Cattle
Imports of cattle to the U.S. and the relationship of exports to imports has been a concern to thecattle industry since the 1880s. Voorhies and Koughan (1928) examined foreign trade in U.S. beefand acknowledged that almost all live cattle imported into the U.S. since the early 1900s originatedfrom Mexico and Canada.
Canada has generally remained a major source of imported cattle into the U.S. (Table 28). During1998, Canada and Mexico shipped 2.0 million cattle to the U.S. Canada accounted for about twothirds of the cattle imported, 90% of which were fat cattle weighing more than 700 pounds destinedfor immediate slaughter. With increasing slaughter capacity in Canada, however, shipments ofCanadian slaughter cattle to the U. S. have declined since 1996. Cattle imported from Mexicotraditionally have been predominantly stocker and feeder cattle. In 1995, however, drought and thepeso devaluation forced many Mexican cattlemen to liquidate entire herds, including breeding stock.The consequence was the shipment of substantial numbers of Mexican cows into the U.S. forslaughter.
Mexico has also been a major importer of live cattle from the U.S. since 1996 (Table 28). Most ofthese imports were for herd restocking after the drought of the mid-1990s. Canadian imports of U.S.cattle in recent years have been primarily feeder cattle because of the continued growth of the cattlefeeding industry in Canada. The continued economic development of the Mexican economy plusimproved range conditions and the continued expansion of the Canadian feeding and slaughterindustry has greatly reduced the ratio of U.S. cattle imports to exports from 29 to 1 in 1995 to 7 to1 in 1998.
Imports and Exports of Beef
More than 2.6 billion pounds of beef was imported by the U.S. in 1998 compared to 2.1 billionpounds in 1995 (Table 29). The major suppliers of imported beef into the U.S. during 1998 wereAustralia (32% of the total), Canada (31%), and New Zealand (22%). The remaining 15%originated predominantly from Brazil, Argentina, and Central America.

33
Two types of beef (grass-fed and grain-fed) are imported by U.S. packers, wholesalers, andprocessing firms. Much of the beef imported from Canada during recent years has been grain-fed.However, the remaining beef imports from Australia, New Zealand, Brazil, Argentina, and CentralAmerica is grass-fed which is used for processing. The U.S. has faced a deficit in processing beefsupplies since 75% of the U.S. cattle slaughter is comprised of fed cattle.
The U.S. exported 2.2 billion pounds of beef during 1998 (Table 29). The major export market forU.S. grain-fed beef in the last decade has been Japan which purchased almost 52% of U.S. beefexports in 1998. The next most important foreign outlet for U.S. beef was Mexico (20% of totalexports) followed by Canada (12%) and the Republic of Korea (7%).
Future Trends in the Cattle and Beef Industry
The dynamic cattle and beef industry is characterized by rapid growth and development, innovativeproduction technologies, a fierce pride of producer independence, a highly fragmented industry withregard to coordination through the various stages of production, large numbers of cow-calfproducers many of which lack economies of scale to adopt current technological innovations, afeedlot industry which is becoming increasingly concentrated, and a slaughter industry which ishighly concentrated in the steer-heifer sector. Major forces currently impacting the cattle and beefindustry and future concerns within the industry will likely focus on such questions as (1) how tocompete more effectively with the poultry and pork industries in a consumer-driven domesticmarket, (2) how to remain competitive and expand the market for beef in the international market,(3) how to produce a product which more nearly meets the concerns of health-conscious consumerswhile also maintaining product quality and consistency attributes, (4) how to develop industrytechnological and structural changes which reduce cost of production, and (5) how to collaboratemore effectively with regulatory agencies to assure food safety, animal disease control, and providefor the long-term integrity of the environment consistent with common goals of society and industrysurvival.
Although industry and societal concerns and requirements several decades into the future aredifficult to project, given the dynamic and continuously changing consumer and marketenvironment, likely future trends within the cattle and beef industry in response to societal demandsand concerns may be summarized as follows:
Cow-calf and stocker cattle sector: • Consolidation of enterprises will be a continuing phenomenon in the cow-calf sector given
that production costs of producers with fewer than 50 cows are likely to exceed those ofproducers with 50 cows and over by more than 30%.
• The past introduction, proliferation, and usage of continental and exotic beef breeds willdecline sharply as the industry seeks to produce feeder cattle which yield more uniformcarcasses with respect to size, quality and yield grades.
• Cow-calf producers, especially those with 100 cows or more, will become increasinglydependent on genetic and performance information from feedlots and slaughter plants

34
through formal and informal cooperative agreements to assess and improve breedingprograms.
• Cow-calf producers, in the computer age, will become increasingly dependent uponindividual animal identification systems to monitor genetic and performance attributes at theranch, feedlot, and slaughter levels.
• Cow-calf producers, especially those with 50 cows or more, will become increasinglydependent on artificial insemination, embryo transplanting, and embryo splitting technologyto enhance the genetics and performance capability of individual herds.
• Cow-calf and stocker cattle producers will become increasingly dependent upon anabolicsteroids (implants) to improve production efficiency and reduce production costs.
Cattle feeding sector: • The number of cattle feedlots will continue to decline, especially those with less than 1,000
head one-time capacity, as feedlots attempt to realize economies of scale and benefits ofspecialized management to reduce production costs.
• Commercial cattle feedlots with 16,000 or more head one-time capacity will continue toaccount for an increasing share of the cattle fed in the U.S.
• Commercial cattle feedlots will likely expand quality control efforts through varioustechniques including electronic ear tagging to monitor individual animal performance. Thenet benefits will be that cattle performing below acceptable levels will be able to be culledafter designated feeding periods thereby reducing feeding costs for the cattle remaining onfeed while also improving the quality of the finished cattle reaching the slaughter plant.
• Development of improved technology involving ultrasound measurement techniques forimaging back fat and rib eye will likely reduce feeding costs by allowing cattle to be sortedinto more uniform quality groups for more efficient management of the days on feed toproduce a product more nearly consistent with consumer demands.
Cattle Slaughter and Beef Wholesaling: • In the absence of federal intervention, cattle slaughter and boxed beef processing will remain
highly concentrated as firms seek to realize economies of scale in cattle slaughter, boxedbeef processing, and beef distribution.
• Cattle slaughtering firms, because of competition from foreign suppliers for internationalbeef markets, will make greater efforts to remain competitive in the foreign arena bytailoring beef cattle cuts destined for foreign markets to the specific requirements of selectedinternational markets.
Beef Retailing: • The beef processing and wholesaling industries will form alliances or working agreements
with the retail sector to develop and merchandise various pre-cooked and convenience stylebeef dinners to compete with the “heat and eat” user-friendly packages featured by thepoultry and pork sectors.
• Although slow in developing, central vacuum-packaged beef (case-ready) systems have acost advantage over most other systems and will likely become prominent in the retail sector

35
once advanced technology alleviates the appearance problem associated with the case-readysystem.
• The beef retail counter will likely continue to reorganize by segmenting with appropriatemerchandising signs as to cooking style with preparation instructions, pre-cooked heat andeat packages, grilling meats, etc.
• The beef market will remain increasingly segmented with the highest quality cuts destinedfor the export and hotel-restaurant market and the remaining domestic beef suppliescompeting against increasing supplies of relatively lower price meats.
Vertical and Horizontal Coordination: • The U.S. beef industry will likely not experience the same level of full vertical coordination
as that of the poultry and pork industries. Major impediments include wide geographicdispersions of cattle production units within the industry, large numbers of fiercelyindependent producers, the biological nature of cattle, economic considerations, and aruminant animal which can be used for harvesting available resources as grass and forageon rangeland and pasture for much of its productive life at lower costs than can be achievedin confined production facilities.
• The U.S. cattle and beef industry will continue to foster vertical integration agreements withproducer groups relative to providing performance and genetic information amongproducers, feedlots, and slaughtering firms to evaluate carcass characteristics in an effort tomore nearly develop and produce a carcass meeting the demands of increasingly healthconscious consumers.
• Other forms of partial vertical integration evident in the cattle and beef industries (e.g.,packers contracting with feedlots for future delivery of fed cattle, packer feeding, producersretaining ownership through the feedlot phase, firms performing the slaughter, boxed beefprocessing, and beef wholesaling functions) will likely continue in its present form. Majorinnovations now underway among selected feedlots and slaughter firms include agreementsas to various feeding practices and feeder cattle characteristics to be fed and delivery dates,including price discovery between feedlots and slaughter firms.
• Producer cooperatives, or horizontal coordination, in which ranchers coordinate activitiesat the same production stage to lower costs, raise prices, or both, will continue to havelimited success. Producer organizations involving full integration of cattle feeding activities,cattle slaughter, and beef wholesaling, however, will continue to encounter serious problems,including large capital requirements, inadequate management, lack of marketing experienceand expertise, inadequate volume to assure efficient plant operations, and lack of consistencyin quality and volume attributes to meet the requirements of potential clients.
International Cattle and Beef Markets: • Depending upon the performance of the economies of Russia and Pacific-Rim countries, the
U.S. will likely become a net exporter of beef. • The major grain-fed beef export markets for the U.S. will be Japan and Pacific-Rim
countries, the resort areas of Mexico, and eventually some resort areas in Europe.

36
• The major markets for the lower priced U.S. beef cuts and offal items will continue to beJapan and Pacific-Rim countries (in competition with Australia, New Zealand, andArgentina), Mexico, and Russia.
• U.S. grain-fed beef exports to Japan, Korea, and Pacific-Rim countries will likely faceincreased competition from Canada, Australia, and Argentina. However, competition fromAustralia and Argentina will continue to be constrained by undeveloped feedgrainproduction capabilities. Australia has limited natural resources and Argentina has simplybeen slow to develop.
• U.S. imports of processing beef (grass-fed beef) will continue to fill the U.S. deficit ofprocessing beef supplies created by the large proportions of U.S. cattle being grain-fed priorto slaughter. The major suppliers of grass-fed beef to the U.S. will be Australia and NewZealand with Argentina also entering the U.S. market after being declared free of foot andmouth disease.
• Although the U.S. will continue to import feeder cattle primarily from Mexico, thedevelopment of Mexican cattle feeding and cattle slaughter capabilities will constrain futuregrowth in those imports. A relatively smaller number of feeder cattle will be imported fromCanada. Exports of U.S. live cattle will continue to be primarily breeding and dairy cattleto neighboring Mexico, Canada, South America. and Caribbean countries.
Governmental Policies and Regulations: • Future air and water pollution policy concerns will likely mandate strict enforcement of
existing regulations across all industries to insure a pollution-free and healthy environmentfor future generations.
• More strict enforcement of air and water quality standards will likely be cost increasing andrequire renovation, redesign or relocation of existing facilities, which may become costprohibitive for some smaller and less efficient firms, thereby causing both a change in thestructure and location of selected industries as standards are enforced across all segments ofan industry.
• Agricultural industries, primarily the livestock and poultry feeding and dairy sectors, whichare actively collaborating with governmental agencies on air and water pollution control,will likely face continual requirements to improve air and water quality control proceduresas more efficient air and water quality control technologies emerge.
• Segments of agricultural industries currently exempt from compliance with air and qualitycontrol requirements may lose such exemptions due to public concerns which favorcomprehensive environmental plans conducive to creation of an air and water pollution- free environment.
Interactions of the Cattle and Beef Industry with the Environment
The preceding discussion of the nature, structure, and future trends of the U.S. cattle and beefindustry provides the necessary basis for exploring and assessing the incidence and extent ofinteractions between the industry and the various attributes of the environment. With emphasis on

37
the cow-calf, stocker, cattle feeding and finishing, and cattle and beef slaughter and retailing sectors,this section analyzes the linkages between the U.S. cattle and beef industry and the natural resourcebase (land, air, water, and energy resources). Potential environmental improvements andimpediments to change will also be described for each instance where significant negativeenvironmental impacts are identified.
Cow-Calf and Stocker Production and the Environment
Cow-calf (beef cattle) and stocker production relies on grazed forages for the vast majority of therequired feed . Thus, their impact on the environment is primarily on soil and plant resources andwater runoff and percolation into ground water aquifers. Essentially all pollutants associated withthese stages of beef production are classified as arising from “non-point” sources.
Cow-Calf/Stocker Production and Land
In this section the impacts of cow-calf and stocker production on soil structure and erosion, plantcomposition, wildlife interactions and biodiversity will be discussed.
Soil Structure and Soil Erosion
Soil structure can be characterized by the nature of soil aggregate stability and soil surface features.Cattle grazing impacts surface features, bulk density, and aggregate stability. The effect of largeherbivores on surface detention of water are mixed and dependent on grazing intensity and physicalcharacteristics of the soil (Thurow 1991). Hoofprints made by livestock increase micro-relief ifstocking intensity is moderate. If stocking intensity is heavy, micro-relief is reduced due todisaggregation of soil structure resulting in the soil surface becoming either loose dust if soilmoisture is low or flattened and compacted if soil moisture is high. Heavy grazing can alter micro-relief by reducing litter accumulation and bunchgrass growth forms, thereby increasing runoffvelocity. Alteration in soil structure affects infiltration rates.
Soil structure is impacted by grazing animals in the upper 25 cm, indicating that it is a near-surfacephenomena (Tollner et al. 1990, Chancelor et al. 1962). As duration of stock density increases, soilcompaction generally increases, especially in high moisture, early growth conditions. Grazing landssubjected to frequent freeze-thaw or shrink-swell processes mediate negative soil structure impacts.Short-term heavy grazing does not yield measurable impacts on root mass in the soil but has beenshown to decrease earthworm activity. Periodic rest from rotational grazing can reverse anynegative effects of increased bulk density and reduced infiltration rates with proper stocking andsufficient rest periods. However, long-term heavy grazing impacts are more notable and must beviewed in the context of scale. Nutrients and water patterns flow across and beneath landscapesfrom a series of sources and sink with grazing, serving as a redistribution agent. Grazing per se doesnot alter systems significantly until landscape features are altered to a point where water, nutrients,organic matter, and sediment loss is accelerated. The challenge for resource managers is to identify

38
threshold conditions which lead to formation of erosion cells causing accelerated soil loss, leachingvia lateral flow, increased runoff, and reduced infiltration processes. As long as the erosionconstitutes redistribution within the landscape, it does not lead to irreversible degradation. Whenit reaches the level where there is a net loss of soil from the landscape (via channels, streams, andrivers), degradation becomes evident.
Livestock grazing impacts the grazing land watershed through removal of protective cover andthrough trampling disturbance. Effects may include altered water quality, increased overland flow,reduced soil moisture, and increased erosion. Consequently, improper livestock grazingmanagement effects may be manifested as a non-point source of pollution and may ultimately resultin loss of productivity from rangelands. In their summary of a literature review on the influence ofgrazing on watershed parameters, Blackburn et al. (1982) stated that most studies report little or nodifference in sediment production from light and moderately grazed pastures. Likewise, manystudies report no difference between non-grazed areas and light or moderately grazed pastures.However, heavy continuously grazed pastures almost always show an increase in sedimentproduction over light, moderate, or non-grazed pastures.
Where there is root stock or a seed source remaining, the obvious key to reduction of soil lossthrough erosion is altering the use of soil cover by grazing animals. In most cases, this approachdoes not mean that no grazing takes place but rather that controlled grazing allows adequate levelsof biomass to remain on and above the soil surface. Grazing management, including the possibilityof grazing systems, to provide rest periods and proper levels of plant defoliation should be promoted.
Plant Composition
This subsection discusses the impacts of cow-calf and stocker production on the composition ofplant communities including the impacts on ground cover, above-ground and root biomass, andbotanical composition. Differential impacts where cattle graze on forest land are also delineated.
Vegetation Ground Cover. Cover of vegetation has been identified as one of the major mediators ofraindrop impact and subsequent infiltration rates, runoff levels, and sediment loading. Vegetationstructure also impacts light and water interception, competitive interactions between plant species,and habitat structure for animals and insects. Grazing directly impacts vegetation cover throughremoval of foliage and trampling, indirectly affecting competitive interactions and subsequentspecies composition. Increasing grazing pressure decreases interception loss, reduces litter turnoverand interception losses, increases bare ground, and increases raindrop velocity. This results inslower infiltration rates, increased runoff amount and flow rates, and greater sediment loading.Hydrologic thresholds of vegetation cover, where grazing has been noted to have significant impacton hydrologic processes, have been identified to be 300 kilograms per hectare (kg/ha) for sodgrasscover and 1000 to 1440 kg/ha for bunchgrass communities in temperate grasslands (McGinty et al.1991; Bari et al. 1993).
Aboveground Biomass. Grazing-induced modifications of competitive interactions are eventuallyexpressed at the population level through the modification of canopy size, basal area, and

39
tiller/meristem demography of individual plants (Briske 1991, Milchunas and Lauenroth 1993).Grazing impact on aboveground biomass is a function of chosen herbivore mix, numbers of animalsfor each kind of herbivore, and plant growth patterns relative to temporal and spatial weather events.Species composition change is a relatively rapid response, while changes in annual net primaryproduction are an intermediate response. Soil nutrient loss is a slow, variable response.Aboveground net primary production does not necessarily change when species compositionchanges and can increase or decrease depending on the replacement species, life-history traits, andthe manner in which the continuing grazing pressure or stress affects water and light resources andnutrient cycling rates. Increases in short-term nutrient cycling rates may increase primaryproduction over time periods of years to decades while decreasing large, recalcitrant nutrient pools.Yields of bunchgrass species appear to be slightly reduced (less than 10%) with end-of-seasonutilization levels up to 60%. However, yield is negatively impacted in an exponential manner withend-of-season use levels from 60% to 90% (Stuth 1995).
Root Biomass. Defoliation by grazing animals commonly results in cessation of root growth,followed by a period of rapid tillering. The net effect of defoliation on pasture production, however,depends on the relative growth rate of the sward (i.e., the portion of ground covered with grass) aswell as intensity and frequency of grazing (Hilbert et al. 1981). Suppression of root growth isgenerally proportional to the intensity and frequency of defoliation. Longevity of roots variesbetween species and generally is reduced when shoots are defoliated However, the significance ofroot longevity to plant survival and competition has not been clearly ascertained. Heavy grazing hasresulted in higher tiller density but lower root mass than plants in a lightly grazed pastures. The useof species-based criteria in management may lead to erroneous conclusions about the long-termability of grazing lands to sustain productivity when changes in species composition are minor andchanges in soil nutrient levels are negative and large, or may lead to an overestimate of the impactof grazing when the opposite occurs (Milchunas and Lauenroth 1993).
Botanical Composition. The literature contains extensive references to changes in vegetationcomposition caused by the influence of livestock grazing in grassland and forest ecosystems. Themost common manifestation of vegetation change is the result of livestock overutilization of theherbaceous component. Those species that are preferred first and foremost by livestock aresubjected to inordinate grazing pressure and physiological stress. Such species usually decline inrelative composition in stands compared to less preferred, less abusively grazed species. Therefore,within the ground-based layer of vegetation, a shift from most palatable to less palatable vegetation,as a result of preference of grazing animals, is common. This preference explains the shift over timefrom tall, broadleaf, palatable grass species preferred by cattle to midgrasses and even shortgrassesas overgrazing continues. It is important to differentiate the act of grazing, an evolutionarycomponent of grassland ecosystems, with overgrazing or overutilization of the range (Schuster1995).
On rangelands, as the ground layer of vegetation is reduced in competitive capability with shrubsand tree-type vegetation, these plants find a niche in grassland ecosystems and often becomedominant. Domestic livestock have apparently improved the dispersal of seed for several woodyspecies and have also enhanced the chance of germination and survival in a grassland environment.

40
Although they may have been part of the natural potential vegetation, these woody plants increasein density and distribution in a disturbance regime that reduces the herbaceous layer. Onceestablished, woody plants form an overstory that, in turn, intercepts sunlight and competesvigorously with the herbaceous layer for soil moisture and nutrients. Woody plants are able, inmany cases, to escape grazing stress by growing above the browsing height of animals. At the sametime, as the herbaceous layer is further diminished, the role of fire to suppress woody plantsdiminishes due to inadequate fuel loads and fuel continuity to cause significant damage to the woodyoverstory. As the canopy cover of woody plants increases and approaches closure, there is anincremental decrease in the herbaceous component of vegetation. This, in turn, ensures that thereis insufficient fuel load and distribution to significantly damage woody plants with fire, a cycle thatgets progressively worse as woody plants increase (Scifres and Hamilton 1993).
Several researchers who have elucidated the role of increasing atmospheric CO2 on vegetationindicate that plants with a C3 carbon pathway will have a comparative advantage as CO2 levelscontinue to rise. Thus, significant shifts in range vegetation may occur, which in turn will influencetotal forage production, kind of forage/browse production, and most appropriate grazing animal(Archer et al. 1994).
Considerable attention has been directed to minimizing the impact of livestock grazing on rangeland,the most powerful human influence on rangeland other than housing development and conversionto cropland,. Controlling the timing, duration, and intensity of grazing appears to be the key. Manyperennial range grasses, particularly prairie grasses, are adapted to periodic, sometimes intense,grazing. Periods of rest allow grazed perennials to replenish leaf area, set seed, and store foodreserves in their roots. Continuous or too frequent access to the same range by large numbers oflivestock impedes the ability of new growth to store food. When perennial grasses are repeatedlycropped back, leaf growth takes precedence over root growth. With continued severe grazing, rootsdie and plants become less vigorous. The result is reduced forage and greater plant susceptibilityto drought and disease. Watershed protection also suffers as plant cover and leaf litter diminish,leaving erodible, exposed soil (World Resources Institute 1994).
In general, North American range conditions reflect a pattern of early overuse by cattlemen andsheep herders, followed by slow recovery as ranching and public land management practicesimproved. According to some reports, U.S. rangelands are in better shape today than at any timein this century, even though they are still degraded compared to their natural potential vegetation.According to the U.S. General Accounting Office, available trend information indicated thatalthough most public rangelands were either stable or improving, one out of five Bureau of landManagement (BLM) and Forest Service allotments may be threatened with further damage becausemore livestock were being permitted to graze than range managers believed the land could support(U.S. GAO 1988).
Forest Utilization. Livestock grazing can have both positive and negative impacts on botanicalcomposition of forested ecosystems, depending on the type of forest ecosystem and the type oflivestock production system. Positive impacts associated with livestock production in silvo-pastoralsystems in the tropics include biological advantages, i.e., both improving soil nutrients while

41
supporting considerable livestock grazing. Grazing improves soil fertility, increases efficient use ofsolar energy, and facilitates nutrient recycling. The dual production system also has economicadvantages (Payne 1985).
In forests, understory forage production generally increases dramatically when woody overstory isremoved due to increased incoming radiation, reduced rainfall interception in tree canopies andground litter, reduced transpirational demand from the woody vegetation, and release of soilnutrients concentrated under the woody canopy. As a general rule, herbaceous production declinesas tree canopy cover, basal area, or density increases. Resulting allometric equations of theserelationships are allowing grazing land managers to strategically plan ahead and adjust livestocknumbers in anticipation of future stand clearings and/or closures. However, such predictions arenot suitable for within-year operational adjustments (Tapia et al. 1990).
In general, grazing does not appear to be detrimental to tree growth in most forest types unlessgrazing is permitted to occur on young trees prior to reaching sufficient height to avoid being grazedor trampled. Livestock grazing, depending on the understory plant species and forest ecosystem,can change species composition of understory brush. As canopy cover of trees increases, grass andshrub production of understory forage can become a limiting factor for livestock and big gamegrazing.
Wildlife Interactions and Impacts on Biodiversity
This subsection is devoted to a discussion of the impacts that beef cattle production may have onwildlife and biodiversity. Potential impacts through modification of wildlife habitat are alsoexamined.
Wildlife-Livestock Interactions. Livestock in extensively managed production systems usuallyinteract to a degree with wildlife in competing for food or space. This interaction can have apositive, negative, or no impact (Vavra 1994). Currently, an increasingly vocal segment of thegeneral public perceives the interaction as being negative, especially relative to the impact oflivestock grazing on threatened or endangered wildlife or plant species.
In riparian areas, livestock grazing is generally perceived as having a negative impact on fish andother aquatic species because grazing can alter stream hydrologic flows and reduce habitat diversityby altering or reducing stream bank vegetation. In the U.S. Pacific Northwest, livestock grazing ofriparian zones associated with salmonid spawning and rearing areas is perceived as having a directnegative impact on recovery of salmonid populations (Bjornn and Reiser 1991).
In most regions, multi-herbivore grazing commonly occurs. Livestock and wild herbivores cancompete directly or indirectly for food, cover, and water. Usually, the potential competition for foodis perceived as being the most important interaction, especially between livestock and big gamewildlife. Livestock can impact wildlife by utilizing key forage species needed by wild herbivoresduring critical times of the year, by altering short- and long-term habitat quality, and by transmittingdisease (Cooperrider 1994).

42
Interactions between wildlife and livestock are not always negative. Properly managed livestockcan be used as a tool to improve wildlife habitat. In the Inter-mountain Region of the western U.S.,judicious cattle grazing during the summer can improve quality of forage available to large wildherbivores using seasonal rangelands during other times of the year. Grazing management strategiesdeveloped for livestock production should also account for the needs of all wildlife (Vavra 1994).
Habitat Composition Changes/Biodivesity. In most regions of the U.S., herbivory has occurred formillennia. However, not all regions were subject to the concentrated herbivory of domesticlivestock that differed significantly from native herbivores in intensity, season, and dispersal acrossthe landscape. The introduction of domestic livestock to North America and the attempt to intensifylivestock production have altered habitat for wildlife. Often the intensification of livestockproduction has been accompanied by the direct human conversion of native vegetation communitiesto communities more suited to maximize livestock production.
The act of grazing by domestic livestock can in itself, either through direct and indirect impact onvegetation or through impacts associated with trampling, alter habitat. In areas of concentratedlivestock use, such as riparian areas, the potential for altered habitat is high. The greatest impact ofdomestic livestock on wildlife is through alteration of habitat that changes plant species compositionand/or community structure.
An increase in livestock management awareness is critical in regions having several herbivoresusing the same habitat. For example, using animal unit equivalents to allocate forage betweendomestic and wild herbivores does not usually reflect actual forage and habitat needs of the wildherbivores. Management of livestock use in riparian and meadow communities is especially criticalbecause of the high probability that habitat for non-herbivores will be drastically altered if livestockare allowed to follow their natural propensity to concentrate use (Sheehy et al. 1996).
Potential Environmental Improvements and Impediments to Change
In general, beef cattle numbers in the US have declined significantly over the past quarter century.This would indicate a general lessening of the impact of beef cattle on US land and relatedresources. The impacts of cow-calf and stocker production on specific resources and specificregions, however, may, or may, not follow this general trend.
Soil. In general beef cattle production has resulted in very little soil erosion. Certainly minusculein comparison to cropland agriculture. Improved awareness of the need to avoid overgrazing, theincreased emphasis on maintaining biodiversity, and the general reduction in cattle numbers shouldinsure that negative impacts on soil will diminish further in the future.
Plant composition. There can be no doubt that cattle grazing has resulted in significant changes inplant composition across most regions of the US. This impact has been either through the use ofagronomic practices to establish and propagate derived pastures, or through the continuous grazingpressure and reduction in use of fire in rangeland ecosystems. During the last half century, cattleproducers have learned a great deal about the need for using proper stocking rates and the result has

43
been some general improvement in the ecological condition of US rangelands. It must be noted,however, that many of these rangeland ecosystems have been irreversibly altered. This isparticularly true in regions where the plant composition has changed from grassland to shrublands.Simply reducing or removing grazing pressure from these lands will not result in restoration to theirprevious ecological state. While restoration is technically possible, it requires expensive andintensive perturbations and therefore is unlikely to be under taken on more than a modest fractionof the impacted areas.
Wildlife /biodiversity. To the extent that cattle grazing has impacted plant composition, it has alsoimpacted wildlife habitat and, therefore, wildlife composition. Nowhere has this negative impactreceived more attention than in the riparian areas of the public lands of the Western US. One resultof this attention has been a proportionally larger reduction in cattle numbers over the past quartercentury for this region compared to the rest of the country. In other areas, the interaction betweencattle and wildlife has been more complementary. An example is the symbiotic relationship betweencattle, deer and quail on ranches in South Texas. In all areas, cattle producers are increasingly awareof the need to maintain wildlife habitat and biodiversity. Moreover, they are also increasingly awarethat wildlife can also be the basis of profitable enterprises; e.g., lease hunting or nature tourism.These changes, plus the trend toward declining cattle numbers would indicate that beef cattleproduction’s negative impact on wildlife and biodiversity will also continue to decline in the future.
Cow-Calf/Stocker Production and Water Quality
This section is devoted to discussion of the impacts of cow-calf and stocker production on waterquality including pesticide residues and nutrients. In addition, potential improvements in theinteraction of cow-calf and stocker production and water quality are also discussed along with thelikely obstacles to needed changes in that interaction.
Pesticide Use
Pesticides used in cow-calf and stocker production are of three major classes: (1) pharmaceuticalsfor internal parasites (e.g., stomach worms), (2) chemicals for treatment of external parasites (e.g.,flies and ticks) and herbicides used to control weeds and brush on land used for cattle grazing.Pesticide residues in both water and meat from such sources are a potential problem.
Pesticide Residues in Water. Pesticide levels in water from rangelands are minimal and generallypoorly documented. Most monitoring sites are associated with water systems where cropland is amajor component of the landscape, masking any potential loading from rangelands. The primarysource of pesticides from rangelands are associated with runoff from sites where external parasitesare controlled. The location of such sites needs to consider overland flow issues and downslopefiltering of runoff and grazing of run-on areas to minimize pesticide loading in watershed systems.
The literature indicates that relatively high levels of herbicides can be measured in runoff water fromtreated rangeland areas immediately after treatment or after the first precipitation event followingtreatment. However, there is little evidence that even these initial rates measured are of significant

44
environmental concern. Moreover, the dissipation rates of the compounds are rapid. The key toenvironmentally safe use of herbicides in the rangeland environment is to ensure that they are usedin accordance with the labels for rates of application. When this precaution is followed, little chancefor negative environmental impact exists. The use of herbicides for the purpose of altering thecomposition of vegetation on grazing lands for a variety of objectives is a sound practice. Weeds,including forbs, half-shrubs, or woody plants, can severely reduce forage production on rangelandsand derived pastures. In many cases, chemicals may be the only practical or economically feasiblemethod to reduce woody and herbaceous weed competition and restore the opportunity for rangecondition improvement through grazing management (Hamilton et al. 1996).
Pesticide Residues in Meat. Extensive testing of pesticide residues in meat from grazing animalsreared or imported into the U.S. and Europe indicate that few environmental hazards exist toconsumers. Mean residues have been at 0.23% of acceptable daily intake levels with violative ratesassociated with inspections at less than 0.43% (Ritchie 1994). The emerging concern of pesticideresidues in meat products is primarily in consumption of processed by-products and crop residuesnot destined for human consumption. More education, special care of feeding nontraditionalfeedstuffs, and subsequent monitoring needs to be given special focus as nonhuman consumptivecrop by-products are considered for feedstuff.
Nutrient Distribution
Grazing animals redistribute nutrients and speed up nutrient cycling. Depending on the degree ofhuman interaction, humans exert some control on distribution of nutrients and the degree of externalnutrient input via supplemental feeds (Stuth et al. 1993). When viewing livestock-croppinginteractions, the human decision process is critical to understanding soil fertility impact, particularlyas the forage selection process becomes less animal driven. Animal manuring systems involve either(1) direct animal input through rotational nighttime holding on croplands or (2) off-site grazing orseeding with transfer to the cropland system. In the former case, nutrient input is wholly dependenton the quality of adjacent grazing lands and amount of supplemental feed. Additional factors, suchas handling and storage of the manure, are important in the second system.
In any case, manure management systems are considered poor when the import of nutrients andorganic matter exceeds export. Excessive leakage of nutrients in positive balanced systems throughrunoff and leaching in deep drainage and lateral flow (interflow) creates serious environmentalproblems, particularly with water-quality issues. When animals graze pasture lands, losses throughleaching may occur due to uneven distribution of feces and urine (Vander Meer and Meenwissen1989). As dietary crude protein rises and rumen solubility rises in forage/feed, urine nitrogen losseswill rise in proportion to total nitrogen excretion. Volatilization of nitrogen from urine patches canbe as much as 10-25%, depending on soil surface moisture, aeration, and inherent nitrogenconcentration. Imbalances in feeds with excessive rumen degradable protein will result in excessiveurination and volatilization of ammonia. The rate of ammonia volatilization is influenced byammonia concentration in the manure, temperature, and wind speed. In general, 10% of urine-Nvolatilizes in temperature climates while 25% is lost through utilization in subtropics and tropicalclimates (Brandjes et al. 1996).

45
The negative effects of ammonia volatilization can be odor, nitrogen enrichment, and acidificationof soil and surface water. Acidification can lead to mobilization of aluminum ions which are toxicto fish and reduce nutrient uptake in plants. The principal concern for leaching is nitrogenconversion to nitrates in the nitrification process. The period of manure application can have amajor effect on nitrate leaching. Saturation losses are more of a problem in temperate zones whileexcess removal is a greater problem in the humid zone. Manure from grazing cattle is generally nota major problem given the extensive nature of grazing and limited concentration of livestock per unitarea of grazingland (Hamilton et al. 1996).
Riparian Areas
Riparian and meadow plant communities on rangeland are considered critical resource areas forlivestock and wildlife. Availability of water for drinking and producing high quality forage is oftena major constraint to livestock production throughout most regions. The presence or absence ofwater generally has a major influence on livestock use of associated upland ecosystems in thewatershed (Kauffman and Krueger 1984). Consequently, water and associated riparian and meadowcommunities often are a focal point for livestock and wildlife use.
Depending on the season, riparian and meadow areas have more succulent forage, shade, reliablewater supply, accessibility, and favorable microenvironment compared to associated upland range.These characteristics tend to attract and hold livestock unless livestock management strategies aredesigned and implemented that will distribute animals to upland foraging areas.
Livestock grazing and trampling can negatively affect riparian and meadow communities and thestream itself by reducing or eliminating riparian vegetation, changing stream bank and channelmorphology, and increasing sediment load in streams. Also viewed negatively is the potentialincrease in coliform bacteria associated with livestock fecal deposition in or near the stream.Nutrient loss can occur in overgrazed and trampled riparian and meadow areas. The loss is minimal,however, where the streamside vegetation remains in good condition. Streamside vegetation hasthe capacity to buffer the stream from direct waste input and assimilate the nutrients into plant tissue(Sheehy et al. 1996).
Livestock and wildlife seek out and use riparian and meadow plant communities which canadversely impact quality and stability of these critical resource areas. Whether or not livestock havea negative impact on a riparian zone depends on many different factors, including (1) managementconstraints that confine livestock to riparian and meadow areas, (2) type and availability of watersources, (3) factors associated with terrain that predispose the grazing animal to increase the amountof time in areas near water sources, and (4) season of the year which influences the animal's needfor water or influences animal behavior relative to grazing and the need for water. So manyvariables are involved in livestock grazing in general and for riparian and meadow communities thatone cannot simply assume that any and all livestock grazing will be detrimental to these criticalresources. Each water source must be evaluated in terms of problems associated with livestock use.
Potential Environmental Improvements and Impediments to Change

46
In general cow-calf and stocker cattle production have had minimal impacts on water quality. Thisis particularly true with respect to incidents of water contamination via pesticide residues andnutrient loading from feces or urine.
Riparian areas. Cow calf and stocker production have undoubtedly negatively impacted streamsand riparian zones. As was noted in the previous subsection, the public lands of the Western US.have been the most often cited locations of this problem and this attention has been partiallyresponsible for larger reductions in cattle numbers over the past quarter century for this regioncompared to the rest of the country. Another result of the attention this problem has attracted is thechange in grazing allotment management procedures used by Bureau of Land Management and USForest Service to reduce grazing pressure on riparian zones. Practices to reduce grazing pressureon riparian areas are, however, expensive. In many cases, the cost of the alternative managementprocedures may be so high as to preclude use of the grazing allotments by cattlemen. Alternatively,to the extent that cattle are not precluded from grazing public lands, it is highly probable that theassociated riparian areas will continue to experience some negative impacts.
Cow-Calf/Stocker Production and Air Quality
In this section, the impact of cow-calf and stocker production on air quality are discussed. Effectsof cattle on atmospheric methane and the relation between beef cattle production and atmosphericlevels of CO2 are discussed in turn. Odors are generally not a problem associated with cattleproduced on grazing lands.
Methane Emissions
Over the past 150,000 years, earth processes produced stable concentrations of 600 to 700 parts perbillion volume (ppbv) of methane during warm interglacial periods and about half as much duringthe major ice age (Stauffer et al. 1985). Currently, global methane concentration is approximately1700 ppbv, more than double those levels (Khalil et al. 1994). Domestic animals account forapproximately 14% of the current methane generated. Cattle account for the largest share of globalanimal emissions (71%) followed by sheep (9%), water buffalo (8%), goats (3%), equine (2%), andcamels (1%) (Lerner et al. 1988). Over the past 200 years, livestock methane emissions have simplyreplaced wild-animal emissions in temperate zones and, to a more limited extent, in the other zones.More than 49% of future global methane emissions are likely to be the result of environmentalprograms designed to expand wetlands (21%), wild ruminant populations (7%), expanding landfills(7%), coal mining (6%), and oil and gas drilling (8%) (Johnson et al. 1994). The contribution oflivestock to global methane emissions is projected to decline relative to human-made sources, giventhe limited capacity to greatly expand livestock populations and limited acreage to expand highmethane-emitting rice paddies (Khalil et al. 1994).
Waste-Manure and Methane Emissions
Few studies are available related to methane emissions of livestock manure from grazinglandconditions. However, methane emission rates have been shown to be strongly influenced by the

47
internal temperature of the manure. Emissions occur from 10° to 40° C, increasing exponentiallyabove 25° C (Williams 1993). Overall, emissions from feces were found to be insignificantcompared to those from the rumen. However, methane emissions can be significant from swampycesspit areas or runoff accumulation areas where high concentrations of livestock occur.
Carbon Dioxide Balance
One of the major interpretations from the CO2 hypothesis is that shifts from grasslands to shrublandscannot be fully attributed to mismanagement, as has been frequently maintained in much of theliterature. The CO2 hypothesis suggests that a lack of understanding of the fundamental causes ofvegetation dynamics on rangelands has probably been the primary constraint to the development oftotally successful approaches to dealing with the range brush and weed problem (Mayeux et al.1991). Given the reality of the changes to shrub-dominated ecosystems that have already takenplace on many rangeland areas and with the probability of increasingly competitive advantage toshrubs and broadleaf herbaceous plants, the use of grazing animals more suited to C3 plants may bewarranted. This approach would mean more efficient use of range vegetation could be made bygoats and sheep in areas historically grazed totally or predominately by cattle. There may also bea basis for considering the use of introduced or native animals with higher affinity for shrubs andforbs than domestic livestock. Significant shifts in grazing management paradigms and the socialstructure associated with land use may also be implied. The impact of leaf-eating herbivores mayincrease as the level of atmospheric CO2 rises. Furthermore, C3 weeds may grow faster than C4
crops of agricultural importance in a CO2-enriched environment, and vice versa. In unmanagedecosystems, these effects of elevated CO2 may cause marked changes (Bhattacharya 1993).
Potential Environmental Improvements and Impediments to Change
In general, cow-calf and stocker cattle production have had minimal impacts on air quality. Worldmethane emissions from all livestock are only 14% of the total. These levels are not expected toincrease. In the US, methane emissions from beef cattle are most likely going to decline withdeclining cattle numbers. Increased atmospheric CO2 , however, while not caused by cattle maynegatively impact the quantity and quality of forage available for cattle grazing by its favorableimpact on C3 (forbs and shrubs) versus C4 (warm-season grasses) plants. Unfortunately, atmosphericCO2 is expected to continue increasing over at least the next several years.
Cattle Feeding and Finishing and the Environment
In contrast to cow-calf and stocker production, cattle feeding results in high concentrations of cattleper unit of area. Thus, the potential for feedlot cattle to produce environmental damage in thevicinity of these operations is significant. In this section, the impacts of cattle feeding on air andwater quality are discussed.
Cattle Feeding and Water Quality
48
Cattle feeding impacts on water quality are primarily through the potential for environmental loadingof nitrogen (N) and phosphorus (P). Most feedlot manure is disposed of through land-spreading.
Nutrient Distribution
Fed cattle annually consume huge quantities of feed containing nutrients like nitrogen andphosphorus. For example, in the Texas High Plains alone, the approximately 7.5 million head ofcattle fed annually consume over 7 million tons of feed containing over 150,000 tons of nitrogen (N)and 25,000 tons of phosphorus (P). A large amount of these nutrients are transported into Texasfrom other areas to help meet the nutritional requirements of the cattle. However, the efficiency ofconverting these nutrients into marketable products is low. Nutrients in excess of cattlerequirements are excreted and accumulate in the local environment. Due to the inefficiencies indigestion, absorption, and retention of these nutrients, over 121,000 tons of N and 20,400 tons ofP stay in the Texas High plains as animal manure.
Losses or emissions in the form of volatilization, leakage, and run-off occur during storage andapplication of the manure. In the U.S., solid storage is the most prominent manure storage system(Safley et al.1992). Since most feedlots are not paved, leaching losses may be significant,depending on the soil type, precipitation levels, etc. Run-off water, containing some dissolvedmanure particles and nutrients, is increasingly being collected and treated in lagoons before beingdischarged to surface waters. Manure surpluses hardly occur for areas larger than counties (Sweeten1994). Due to the large size of some feedlots, however, large land areas are required for groundspreading at levels that do not exceed crop requirements for P. For example, a 50,000 head capacityfeedlot would produce about 1,000 tons of N and 266 tons of P per year while corn silage wouldrequire only about 26 lbs P per acre. Thus, more than 20,000 acres of corn silage (or equivalent cropP demand) would have to be available if the entire manure production of the 50,000 head feedlotwere to be disposed of via land spreading. Problems of the enormous land requirements arecommonly aggravated by (1) under estimation of the actual amount of manure being applied peracre, (2) basing the manure application rate on the amount of N required which results in theapplication of more P than the crop can use), and lack of manure storage resulting in manurespreading in seasons when crops are not growing which, in turn, results in increased volatilization,leeching and run-off of the nutrients from the cropland.
As a result, EPA requirements for water quality protection at concentrated animal feeding operations(CAFOs) are becoming more stringent; especially regarding application of manure to cropland andmanagement of waste/run-off water from feeding facilities.
Potential Environmental Improvements and Impediments to Change
Because the EPA requirements for water quality protection at CAFOs are becoming more stringent,the risk of nutrient loading from the application of manure to cropland and waste/runoff water fromfeeding facilities will be reduced considerably as the management practices necessary to complywith these regulations are implemented.

49
Cattle Feeding and Air Quality
Cattle feedlots are a potential source of air pollution, both in the form of impacts on atmosphericmethane and other gasses and in terms of the potential to produce offensive odors. To a lesserdegree, feedlots may also damage air quality through the production of dust. All of these potentialpoint sources of pollution related to cattle feeding, plus the relationship between beef production andfossil fuel produced energy, are discussed in this section.
Methane and Other Atmospheric Gasses
Cattle feedlots represent expansive sources of fugitive emissions including particulate matter,odorous compounds, and greenhouse gasses. There are two primary sources of methane emissionrelated to cattle feeding: (1) emissions from the digestive process and (2) emissions from thedecomposition of manure. Johnson et al. (1994) estimate that the average animal in a U.S. feedlotproduces 153 liters (lt) of methane per day. Methane from decomposition of manure from U.S.feedlots is about 23 kg per head of feedlot capacity (Safley et al. 1992). Thus, methane productionper head in feedlots is higher compared to per head levels for grazing cattle, primarily because ofhigher emissions from feedlot manure and higher feed intake levels. However, methane per poundof beef produced in feedlots is lower compared to grazing-based finishing systems because of thehigher production levels in feedlots.
Odors and Dust
While odors are a problem in livestock feeding, of particular concern are the PM10 and PM25 dustfractions, ammonia and hydrogen sulfide and odorous volatile such as indoles, skatoles andmercaptans. Emissions of these regulated pollutants from roads, feedyard surfaces, and, to a lesserextent, from allied point sources such as elevators and feed mills, can be partially controlled witha combination of nutritional and management practices. Due to the significant influence of localclimatic conditions, the effects of such practices cannot be adequately quantified. Additionalabatement technologies must be developed to provide the beef cattle feeding industry with moreoptions for meeting environmental goals.
Energy Requirements
U.S. beef production is characterized by relatively high fossil energy utilization. Most (63%) of thefossil energy requirements for beef production result from feedlots, 86% of which is for feedproduction (Fox 1994). Total fossil energy required per pound of edible beef is approximately 4.8Mcal or about 2 Mcal per pound of live weight slaughtered. Most of the fossil energy used in theproduction of cattle feed is for fertilizer and irrigation.
If beef production were to become less dependent on feedlots and more dependent on grazedforages, fossil energy per pound of beef produced could be reduced. Ward (1994) estimates thatfossil energy requirements for beef production would be reduced by 24% if no feedlot feeding wereused. Keener and Roller (1994) estimate that fossil energy requirements for beef fattening could be

50
reduced by 16% if the days on feed were to be reduced from 280 to 120. Since the average numberof days on feed for cattle in U.S. feedlots is approximately 150, much of the estimated 16%reduction in fossil energy demand has apparently already been achieved. Nevertheless, a reductionin fossil energy requirement per pound of beef produced of 16% would likely be inconsequentialsince the result in reduced CO2 emissions would equate to only approximately 5% of the typicalmethane emission from rumen digestion (De Wit et al. 1996).
Potential Environmental Improvements and Impediments to Change
Little change in the levels of methane production and energy use (CO2 production) associated withfeedlots is expected over the next few years, with the possible exception of slight reductions inmethane emitted from manure as a result of expected continued improvement in manuremanagement practices. Environmental damage from dust and odors associated with feedlots,however, will likely improve significantly over the next several years as EPA develops and enforcesmore stringent monitoring and regulations.
Cattle Slaughter, Beef Retailing and the Environment
Environmental impacts from cattle slaughter and beef retailing in the U.S. are generally minimalbecause of the highly stringent regulations on air and water quality enforced by the U.S.Environmental Protection Agency (EPA) and its state-level counterparts. The requirements forwaste water treatment and the monitoring of both the water and sludge that results from thewastewater treatment plants are intended to insure that U.S. slaughter plants are environmentallysafe even though they are also extremely large. The potential for these activities to impact theenvironment are discussed in this section.
Slaughter, Retailing and Water Quality
A primary interface between the cattle and beef industry and water resources is through the use ofwater in cattle slaughtering and leather tanning. The potential impacts of these activities on waterquality are discussed in this section.
Wastewater
Most processes in the slaughtering and processing of beef and leather tanning require the use ofwater which produces wastewater laden with pollutants. The composition and concentration of thepollutants vary with the specific processes used.
The discharge of the wastewater to surface waters can effect water quality in three ways. First,biodegradable organic compounds (BOCs) may cause significant reduction in the amount ofdissolved oxygen in lakes and streams which, in turn, may result in death to aquatic life due tooxygen depletion. Parameters for the amounts of BOCs are Biochemical Oxygen Demand (BOD),Chemical Oxygen Demand (COD), and the concentration of Suspended Solids (SS). Second, macro-nutrients (N, P) in wastewater discharge may cause eutrophication, excessive algae growth, and

51
subsequent die-off which ,in turn, may lead to death of aquatic animals due to oxygen depletion.Finally, wastewater effluents may contain compounds that are directly toxic to aquatic life; e.g.,tannins, chromium, and un-ionized ammonia.
Slaughter and Processing Waste Production
The slaughter of cattle results in a number of products and by-products, including retail bone-in cuts(42% of the live weight); organs (4%); edible fats (11%); blood (4%); inedible raw materials (17%);hide and hair (8%); and waste(14%). U.S. slaughter and processing plants treat their effluentintensively before it is discharged. Most use screening devices through which wastewater has toflow prior to being treated. In this process, large solids such as hair, paunch manure, pieces ofviscera and meat, etc. are removed. Many of these solids have economic value and are furtherprocessed to produce salable products. The largest part of solid waste produced by theslaughter/processing industry is sludge from the wastewater treatment plants. The sludge isgenerally suitable for use as fertilizer or land spreading (Verheijer et al. 1996).
Tanning
In the U.S., over 20,000 hides are tanned per day, of which 23.5% are processed with vegetabletannins and 76.5% with chromium. U.S. tanneries also treat their effluent intensively before it isdischarged. As a result of wastewater purification, the chromium and BOD levels of the treatedwater discharge is relatively low. The sludge from the wastewater purification process has to bedisposed of in special refuse facilities because of the potential for the chromium to leach throughthe soil into groundwater aquifers.
Potential Environmental Improvements and Impediments to Change
Due primarily to EPA enforcement of strict regulations regarding treatment of waste water andsludge from waste water treatment plants, the cattle slaughter and tanning industries in the US havevery little negative impacts on surface or ground water quality. No change in this performance isexpected.
Trends in the Cattle and Beef Industry and Potential Changes in Environmental Impact
This section of the report explores trends in technology, policy, competitive forces, and other factorsthat may result in changes in the interaction of the cattle and beef production and marketing systemwith the environment including the incentives and/or impediments to these changes. In mostinstances, these changes are evolutionary in that they are the result of long-term trends currently inprogress. Revolutionary changes in the cattle-beef production industry are unlikely. Unlike thepoultry and pork industries, the cow-calf and stocker production segments are not likely to evolveinto the integrated, closely confined production factories now typical in the farrow-to-finishoperations of the hog industry.

52
Trends in Cattle and Beef Production and Management Practices
In this subsection, the relationship between beef cattle production and the environment is discussedin light of trends in land and forage management, herd health and production technologies, and landuse and demographics. Interpretations of the likely environmental results of these trends are alsodiscussed.
Land and Forage Management
Cattle ranching in the Great Plains region of the U.S. has been dramatically altered in recent decadeswith the advent of systems that include both high-producing introduced forage species and croplandused in conjunction with native range. The combination of increased land carrying capacity fromnative range-crested wheatgrass systems versus native range and increased animal gains has thepotential to nearly double the yield per land unit in the northern plains. As a consequence, the sameland area could produce about twice the amount of beef as the traditional native rangeland systemat an increase of only about 25% to 30% in stocking rate.
In the southern plains, studies have documented an 82% increase in land carrying capacity with theweeping lovegrass-native range combination and an 89% increase with the wheat-sudan-native rangesystem compared to native range alone. These same systems increased gains per acre by 73% and100%, respectively, compared to native range. Sims (1985) reports a 62% increase in steer gainsper hectare for systems that include native range and weeping lovegrass, a108% increase for systemsof wheat-sudan or pearl millet, a 314% increase with lovegrass, wheat sudan, or pearl millet, anda 348% increase with a system of Old World bluestems. Similar results were noted in studiesinvolving cow-calf production systems (Sims and Bailey 1995).
While not all livestock producers in the Great Plains have mixed rain-fed farming potential andmany of those still use straight native range systems, the mixed crop-pasture-native range systemshave provided an opportunity for substantial increases in total carrying capacity of the land and beefyield per unit of land over the past fifty years. The potential for still further increases in the totalnumber of livestock in the ecozone is great, particularly as improved perennial and annual foragespecies are developed and additional producers integrate the use of complementary pastures withnative range. However, while land carrying capacity and individual animal production has beengreatly enhanced by such systems, climate and soils cause the area to remain primarily one ofextensive rather than intensive use by livestock when compared to dairies or drylot operations. Theuse of crops in forage systems in areas of less than 22 inches per year of rainfall increases the riskof crop failure (an economic factor) and increases risk of vulnerability to soil erosion. Conversely,the use of improved perennial grasses involves no risk after initial land exposure during the processof stand establishment (Hamilton et al. 1996).
U.S. cattle population was estimated at about 82 million head at the turn of the century, reached ahigh of over 130 million in the mid-1970s, and has now declined to approximately 100 million.Clearly, although the carrying capacity of the land area is being enhanced through the use ofcomplementary pastures and cropland, the cattle available to contribute pollutants, such as methane

53
and manure, are declining in number. The declining national cattle herd also indicates that there isimproved opportunity for rangeland condition improvement in the general sense of lower cownumbers per unit of land area.
Public Land Use and Management
In the United States the efforts of federal government agencies to manage public land and toinfluence private use of these lands have led to conflicts as a result of the influence of opposingenvironmental and livestock interest groups. According to Holechek et al. (1995) about 2% of thenation’s beef cattle ranchers graze about 4% of the nation’s beef cattle on federal lands. While thismay seem as such a small portion of the total as to be insignificant, their seasonal impact is muchgreater in that about 22% of the nation’s stocker cattle spend a portion of their lives on federal lands.
Often the controversy over the uses of federal lands for cattle grazing has focused on the grazingfees charged for grazing permits. The sports and environmental interests argue that the fees chargedneither cover the cost of management nor meet the criteria of being competitive with other sourcesof grazed forages from the private sector. The root of the controversy, however, has much more todo with differing interests regarding the use of federal lands than with the size of the grazing fee.
Environmentalists frequently claim that significant portions of federal land currently being usedunder permit to graze livestock exhibit ecosystem disruption and loss of biodiversity, particularlyin riparian and upland areas (Gillis 1991, Fleischner 1994). This result has led to siltation of streamsand rivers, detrimentally affecting water supplies for major urban centers. Based on these claims,environmental groups are energetically lobbying for the restriction or removal of cattle from publicranges, even when livestock production may have a beneficial ecological role.
On the other hand, many ranchers view any prohibition on grazing as an attack on their traditionalresource base and argue that where livestock grazing on public lands has been judicious, rangeconditions have generally improved since the turn of the century. The inability of the federalgovernment to mediate effectively between these groups and its insensitive enforcement ofenvironmental regulations have resulted in near-revolution by livestock producers in some westernstates (Kenworthy 1995).
Internalizing the costs of public land use has become a pressing issue in the western States. Whilelivestock producers are reluctant to give up their rights of access to this source of forage, manyenvironmentalists wish to reserve such land for their wildlife and recreational use. Both sides wishto externalize at least some of the costs of using the resources on this land by allowing taxpayers topay for the federal costs of administering these lands.
Yet, there are numerous examples where non-government organizations, such as the NatureConservancy, are effectively preserving wildlife habitat and species on purchased land that wasformerly used for commercial livestock production. Conversely, given the opportunity to usewildlife profitably, many livestock ranchers in western states are actively preserving wildlife habitat.However, continued resistance to for-profit use of wildlife is inhibiting such behavior. In order to

54
provide landowners with positive incentives to conserve a broad spectrum of natural resources ontheir property, markets must be allowed to develop for such resources.
Herd Health, Nutrition, Reproductive Efficiency
Numerous genetic-oriented technologies are being developed or have recently been made available.Examples are heat-period control to improve conception, embryo transfer to reduce time for geneticimprovement and/or to obtain multiple calves, and embryo splitting to increase the number ofembryos and to be used as a genetics-research device using multiple identical births. Great advanceshave also been made in sexing embryos and freezing them for long-term storage. In many parts ofthe world, this latter technique will revolutionize small ruminant production, particularly the cattleindustry.
Other genetic technologies include bovine growth hormone (BGH) as a means to expand milkproduction from dairy cows, embryo infusion of human growth hormone genes to alter animalgenetic makeup, and bred-in parasite resistance. Knowledge in the form of theory and applicationof genetic principles has led to more sophisticated sire evaluation programs, crossbreeding, anddevelopment of genetically superior calves.
Animal health improvements include recombinant DNA- developed vaccines, bovine interferon,electronic mastitis detection, implanted identification tags, use of ivermectins for parasite control,and monoclonal antibodies. Recently there has been an explosive discovery of new hormones thatregulate various physiological functions. The implications in this area are enormous. A host of newvaccines have either been developed or will be available over the next decade. The real problem ishow to effectively utilize them, especially in developing countries. Indeed, animal health is one ofthe most rapidly expanding agribusiness areas. Overall, the products and techniques are muchfurther advanced than is adoption or even producer knowledge of them.
The nutrition area encompasses a multitude of new products. Considerable improvement can beexpected in current products such as anabolics (growth stimulants) and feed additives. Furthermore,producers have had, and will continue to have, a broad range of new practices and products--whatmay be called management tools--made available to them. Some recent advances are use of sodiumbicarbonate to enhance feed conversion, magnesium to increase milk yield, and treatment of straw,hay, and crops residues by ammonification and hydrogen peroxide to increase digestibility andenergy value. Much research has been carried out on recycling of wastes from animals. Oneexample is recyclable plastic pellets to provide roughage in animal feeds. Other nutritional advancesinclude supplement selection procedures and rumen-regulating drugs (rumen metabolites).
Agricultural biotechnology as well as other research advances previously described will have amajor impact on animal productivity over the next several decades. A 1992 report by the U.S. Officeof Technology Assessment (OTA) provides a good overview of 41 potentially available animaltechnologies. Of the 41 animal-related technologies assessed by the OTA, 22 were estimated to beavailable by 1995 under the most likely scenario (Table 30). The main impact of these 22technologies is on feed efficiency for all animals and reproductive efficiency for beef cattle.

55
The OTA report also lays out three possible animal efficiency technology adoption scenarios for theUnited States, including (1) less new technology, i.e., a relatively slow rate of adoption of newtechnologies; (2) the most likely adoption rate; and (3) more new technology, i.e., a relatively rapidrate of technology development and adoption (Table 31). The concept of three technology adoptionscenarios is appropriate because, besides the research process itself, there is an often lengthy processof evaluation for product safety, market size, product positioning, and adoption time. The widedebate over use of anabolic growth promotants in Europe and discussions about whether BGH isreally needed in the United States are cases in point. Although many countries are pushing hard fornew agricultural and livestock-production technology, both researchers and public officials are alsoquite cognizant of product safety and international controversies surrounding agricultural inputs.
According to the OTA report, feed efficiency in U.S. livestock production under the most likelyscenario will increase at an annual rate varying from 0.39% for dairy cattle to 0.74% for beef cattle(Table 31). Thus, in the case of dairy cattle, feed efficiency was expected to increase by just 4%,from 2.227 kg of milk produced per kg of feed in 1990 to 2.315 kg in 2000. The most dramaticproductivity increase in the past few decades in the United States has been the 2.5% annual increasein dairy cattle milk yield between 1960 to 1990. The OTA projected that milk yield would mostlikely grow at a compound annual rate of 3.06% between 1990 and 2000 (Table 31).
The need for emphasis on technological advancements in feed efficiency has been well illustrated.Conrad and van Es (1983), for example, show that if the daily weight gain of cattle is 0.25 kg perday, 15% of feed energy intake is used for the gain with the other 85% used just for maintenance.However, if the animal is gaining rapidly, say 1.5 kg per day, 65% of feed energy intake is used forthe gain with only 35% needed for maintenance.
Feed efficiency for beef has been stable in the U.S. for the past decade. According to the OTAreport, however, new technologies are likely to increase feed efficiency (Table 31). Under the mostlikely scenario, feed efficiency will increase at a rate of 0.74% annually for beef cattle and 0.39%annually for dairy cattle. If technology is adopted rapidly, the annual growth rate in feed efficiencyfor beef cattle is projected to more than double between 1990 and 2000 to 1.68%. For dairy cattle,the annual growth rate in feed efficiency at the higher rate of adoption is projected to be modestlyhigher between 1990 and 2000 at 0.46%.
The future extent and rate of technology adoption depends critically on several factors related toindustry structure and producer behavior. Many of the technologies, and modern productionpractices in general, can only be adopted by producers with advanced management skills, producerswhose continued interest is increased efficiency. Additionally, use of technology largely dependson the type of production subsector involved. Cattle production subsectors with few producers andhigh control of production variables use a relatively high proportion of available technology. Forexample, in the United States breeding-level beef cattle producers face great difficulty in the controlof production variables and often operate on a too small scale to have the basic infrastructure,knowledge, and management ability to adopt even well-known techniques such as growthpromotants. Such producers apply only an estimated 40% to 60% of all the latest cattle production

56
technologies to their operations. Cattle feedlots, however, have factory-type characteristics andapply about 85% to 90% of available technology to their operations.
Land Use, Demographics, and Cultural Values
Continued increases in population pressure and economic activity (i.e., growth in personal income)are impacting rural land uses, particularly the rangelands of the West and Southwestern U.S. whichwere traditionally used primarily as cattle ranches. Many factors are now influencing and willcontinue to influence land use and ownership changes. Some of the major factors impacting landuse and ownership and implications of these changes for our society will be discussed. Whilespecific examples for Texas will be highlighted, similar trends are developing for other states in theWest and Southwest.
Demographics
The population of Texas is now over 19 million and will likely almost double to 33 million by 2030.Importantly, over 70% of this expected growth will new immigrants rather than new births. Mostcounties in Texas experienced rapid growth during the early 1990s. However, many counties in theTrans-Pecos, High Plains, and Rolling Plains regions experienced population loses or very slowgrowth. Over the next 35 years, the Texas population growth rate is expected to be highest alongthe central and southern portions of the I -35 corridor and in the Lower Rio Grande Valley.
During the 1900 to 1970 period, Texas shifted from a predominately rural to a predominately urbanpopulation. Currently, about 82% of the state population is urban. Another important expectedchange in the population of Texas is a shift in ethnicity from 61% Anglo in 1990 to an expected40% Anglo by 2030. Minority populations are expected make up nearly 90% of the projectedgrowth in the Texas population between 1990 and 2030. Anglos will no longer be a majority by2008 and by 2030, Hispanics will out number Anglos in the State (Conner and James 1996).
Economic Factors
The Texas economy has been and is expected to continue to grow at a healthy rate. In 1994, the percapita personal income for the state was about $20,000. However, as can be seen in Figure 4, therewere considerable differences in per capita income between regions of the state. The EdwardsPlateau, East Texas, the Rolling and High Plains, and South Central regions were all fairly close tothe State average. The Coastal Prairies and north Central regions were significantly above theaverage while the border regions are significantly lower than the state average. New job growth isexpected to be concentrated in areas along and east of I-35. Employment and income are expectedto lag in the border regions where the jobs tend to be low paying and population growth rapid.Traditional agriculture areas will likely need to look to other industries and other uses of their landand other resources for jobs and income.
Implications for Land Use

57
Conner and James (1996) provide some insights on how demographic, economic and other factorshave and will continue to influence land use and ownership. In general, the patterns of Texas landuse and population exhibit opposite trends (Figure 5). Only 6% of Texas land is urban while 82%of the Texas population is urban. Thus, 18% of the Texas population lives on 94% of the land. The94% rural land in Texas is predominately range, about 95 million acres or 61% of the total ruralacreage (Figure 6). Range and pasture land together account for 72 % of total rural area (about 113million acres).
A recent survey of several thousand cattle ranchers in different regions of Texas shows how rangeand pasture land is being used in Texas (Rowan 1992). While the average size of the respondentranches was 5,644 acres, half of the ranches in the survey were less than 650 acres. Thus, the Texasranch industry is characterized by many relatively small and a few large operations owned andoperated by an older and aging population. More than half of the respondent ranchers were over 55(Figure 7). More were over 65 than under 45. Even though all of the respondents professed to beranchers, only 32 % of their income came from livestock and wildlife combined while 45 % camefrom off-ranch employment and investments (Figure 7).
The share of ranch income from livestock and wildlife in all Texas regions was less than 50%(Figure 8). In the Coastal Prairie and Central regions, less than 25% of the total income of theranchers responding came from livestock and wildlife. Thus, in addition to being characterized bymany small ranches, the Texas cattle industry is also comprised of a large number of ranchers whoseprimary source of income is from off-ranch sources.
Census of Agriculture data provide insight on the share of farm or ranch operators that do not resideon their farm or ranch. For most of the counties in Texas, the trend from 1982 to 1992 was towardmore absentee operators. Census data also shows that the percent of total farm and ranch land thatwas operated by full owners between 1982 and 1992 declined for most of Texas counties. Thus, thetrend is toward more of Texas total farm and ranch land being operated by lessees or renters.
Census of Agriculture data also indicate that, for the entire state of Texas, the average age of farmersand ranchers increased by three years from 53 to 56 between 1982 and 1992 collaborating thefindings of Rowan. Clearly, a large share of rural land has and will continue to change ownershipsimply because large numbers of aging Texas farmers and ranchers will soon be retiring and orpassing away.
As land is passed to a new generation, pressure to divide increases simply because there are usuallymore heirs than benefactors. Thus, most commonly, the heirs either sell the property or subdivideit into smaller parcels. In areas of relatively rapid population and income growth, the buyer or heirswill have economic incentives to subdivide the rural land into smaller parcels which will eventuallybe turned into even smaller parcels. Many of these rural tracts will be turned into 5 to 20 acre“ranchetts.” The aging population will force substantial ownership change even in areas wherepopulation growth is negative or slow. In these areas, the heirs are unlikely to continue operationof the farm or ranch. So upon passing to the next generation, the land will most likely be absorbedinto other farms or ranches either by sale or lease. In either case, the land will be less likely to retain

58
a residence. These type of land ownership and use changes come at a heavy price to ruralcommunities. Fewer ranch families mean fewer customers for small rural towns forcing ruralbusinesses to close. In the end, all that is left of many rural towns is a historical marker and a ruralcommunity center in the old school building.
Data from local ad valorem tax districts in Texas show that over the past 10 years, the number ofrural parcels in most counties has increased while the average parcel size has correspondinglydecreased, in some areas as mush as 14% in ten years.
In summary, future rural lands in Texas are likely to exhibit more absentee owners, fewer owner-operator farms and ranches, more urbanization and suburbanization (in areas with rapid populationgrowth) and more fragmentation of rural lands into smaller and smaller parcels. The future will alsolikely bring, along with the increased fragmentation, more loss of wildlife habitat, a larger portionof the population who do not own land, increased demand for public access to rural lands (perhapsmore opportunities for nature tourism enterprises), and a decreasing proportion of the populationwith any attachment to land and the traditional agrarian values that go with it. Implications for thebeef cattle industry are that, in total, less grazing land will be available due primarily to two factors:(1) direct conversion of grazing land to urban and suburban uses and (2) the fragmentation ofremaining rural lands which will, as tract sizes shrink, reduce the number of tracts available foreconomically efficient-sized cattle enterprises.
Trends in Feedgrains vs. Forage in the Production of Beef
A growing demand for lean beef is generating interest in the use of forages rather than grain to fattenbeef. Greater reliance of the U.S. cattle and beef industry on forages to produce beef and lessreliance on feedgrains would, of course, reduce the demand for and production of feedgrains and,therefore, any environmental impacts associated with feedgrain production. Such a shift in U.S. beefproduction practice, however, would also exacerbate the negative environmental impacts of U.S.cattle production. Nevertheless, the likelihood that the U.S. cattle and beef industry will move toany significant extent toward less reliance on feedgrains to produce beef in the foreseeable futureis extremely low for a number of reason. First, as discussed earlier, the U.S. beef consumer isconditioned to and demands the consistency in taste, tenderness, and availability in beef productsthat are much easier to produce with grain finishing compared to forage finishing. Second, asseveral studies (e.g., Brokken et al. 1980; Conner and Rogers 1979) of the relative cost andprofitability of producing beef on grazed forages alone rather than on feedgrains have concluded,feedlot finishing produces the beef products desired by consumers at a lower cost than forage-basedprograms under conditions prevailing in the U.S. over at least the past four decades. That is not tosay that there are not trade-offs between the relative amounts of grain and forage used in theproduction process. During periods when grain prices are high relative to beef, producers tend toshorten feeding periods by purchasing heaver animals and feeding them for shorter periods. Ingeneral, non-fed slaughter also increases when these price conditions prevail. In contrast, when theprice of beef is high relative to that of feedgrain, feedlots put lighter animals on feed and feed themfor longer periods. Finally, in most cattle producing areas of the U.S., maintaining grazeable forage

59
of the quality required to fatten young cattle year-round is impossible. Thus, forage-based fatteningsystems are seasonal and subject to a high degree of variation in the volume and quality of theresulting beef product due to fluctuating forage growing conditions (e.g. drought).
Trends in Beef Demand, Competition, Vertical Coordination, and Other Factors
In terms of total cattle numbers and per capita consumption, the beef cattle industry is shrinking.To some extent, this trend may be encouraged by competing demands for alternative uses oftraditional grazing lands The primary causal factors, however, are related to changes in U.S.consumer demand for beef. Several factors impacting this trend were discussed in previous sectionsof this report including the competition from pork and poultry, the changes being demanded inproduct convenience and packaging, the effects of exports and imports and the trends toward morevertical coordination and genetic uniformity . Some of these trends will potentially impact theextent to which the industry impacts the environment.
The shrinking size of the U.S. national cattle herd will, of course, result in a general decrease in thepotential for both direct and indirect negative environmental impacts from cattle in the US.Institutional and technological developments which lead to increases in beef production efficiencywill tend to continue this trend. Such declines in cattle and beef related environmental impacts,however, will likely be offset to a large extent by increases in the potential for negativeenvironmental impacts by the increasing numbers of poultry and hogs. In fact, given the greaterreliance of non-ruminants like hogs and poultry on feedgrains, the negative environmental impactsof grain production will undoubtedly increase on net over time. At the same time, to the extent thata larger portion of total beef marketed in the future is pre-cooked and packaged in individual servingsize containers ready for the microwave, materials and energy costs per pound of beef consumed willlikely increase as well.
Many of the pending changes in the beef industry such as increased vertical coordination andincreased genetic homogeneity will likely improve the overall efficiency of beef production. In thefinal analysis, however, such changes will not likely alter the basic biological-based beef productionprocess and, therefore, are not likely to have significant impacts on the industry’s interaction withthe environment, either positively or negatively.
Summary: The Environmental Challenges of the U.S. Cattle and Beef Industryand Obstacles to Change
The cattle and beef industry generates both direct and indirect impacts on the environment. Directimpacts include the relatively large amounts of methane emissions generated by foraging cattle,alteration of the composition of native plant communities, particularly by the cow-calf and stockersegments of the industry, and the associated impacts on wildlife (through habitat disruption) andbiodiversity, and air and water quality impacts particularly by the feedlot segment of the industry.
60
The industry also has indirect impacts on the environment through the use of feedgrains in thefeedlot finishing of cattle. Such indirect impacts include, for example, increased atmospheric CO2
from the use of fossil fuels in fertilization and irrigation in the production of feedgrains to meet thefeed demands of cattle feeders. Despite current and past efforts to ameliorate the environmentalimpacts of the cattle and beef industry, a number of obstacles and challenges remain relating to (1)cattle producer behavior, (2) the structure of the market as impacted by government regulations, and(3) economic, social, and political issues.
Principal Obstacles to Change in Cattle Producer Behavior
Whether market induced or otherwise, the primary obstacles to change in the cattle-beef industryare rooted in the biological makeup of the bovine animal. Because cattle are ruminants, cows canreproduce and young animals can grow efficiently on grazed forages. The unique ability of cattleto utilize grazed forages has resulted in a cow-calf and stocker industry that is characterized by alarge number of relatively small producers who are widely dispersed geographically. In addition,many of the small operators, and some of the larger ones, are motivated to produce cattle by goalsother than financial gain and efficiency; e.g., lifestyle. The more concentrated and financiallymotivated segments of the industry (feedlot, slaughter, processing and retail companies) are forcedto utilize the highly variable quantity (seasonally) and quality of animals provided by the cow-calfand stocker producers. This highly atomistic, widely dispersed and economically insensitive portionof the industry limits the ability of the entire beef industry to make adjustments of any kind whethermarket (price) or socio-culturally induced.
Status of Current Efforts to Solve Environmental Problems
Despite the obstacles, cattle producers have made some progress in improving the impact of thecattle-beef industry on the environment. Most notably, cattle producers and land managers have,through reduced grazing pressure and other management practices, succeeded in improving theecological condition of much of the nation’s rangelands over the conditions which existed in theearly decades of this century. This success is, in large part, due to the tremendous educational andtechnical assistance effort of the Natural Resource Conservation Service (NRCS), formerly the SoilConservation Service, of the U.S. Department of Agriculture during the mid- and latter part of thiscentury. There is also increasing evidence that cattle producers and land managers are recognizingthe importance of wildlife and biodiversity and are managing for improved wildlife habitat alongwith or, in some cases, instead of enhanced livestock grazing.
Challenges Remaining
Despite these successes, many of the plant communities in the US have been so severely alteredthat, even if livestock grazing were eliminated, they would never recover to their original ecologicalstate without the use of expensive restoration practices. Due to the vast number of acres involvedand the fact that many of these degraded plant communities are now in relatively stable, although

61
altered, ecological states, most of this land will likely remain in an altered ecological stateindefinitely.
Alternative Solutions and Resource Constraints
Further degrading of wildlife habitat and biodiversity as a result of U.S. beef cattle production seemsunlikely given the current trends. However, efforts to educate cattle producers and land managersregarding the potential benefits of enhanced wildlife habitat and biodiversity should be continuedor even expanded. The success achieved by the NRCS in improving ecological condition onrangelands could also be expected in improving wildlife habitat and biodiversity. Given theopportunity to use wildlife profitably, many livestock ranchers are actively preserving wildlifehabitat. However, continued resistance to for-profit use of wildlife is inhibiting such behavior. Inorder to provide landowners with positive incentives to conserve a broad spectrum of naturalresources on their property, markets must be allowed to develop for such resources.
Role of the Market Structure and Current Regulatory Environment
The beef industry exists in a highly competitive, consumer driven market. Over the past severaldecades, beef has lost significant market share to poultry, primarily because the poultry industry wasable to convince consumers that poultry was less expensive, more convenient, a healthier source ofprotein and consistently more tasty and tender compared to other meats. In competing with poultryand pork, the beef industry tried to improve the reputation of its product by emphasizing the moreconsistent good taste, tenderness and availability achieved through grain-finished beef. Pricecompetition with poultry and pork has also supported the trend toward larger portions of total beefslaughtered being finished in feed lots.
Status of Current Efforts to Solve Environmental Problems
The cattle and beef industry’s potential for negatively impacting air and water quality is greatest inthe feedlot segment. The concentrations of large numbers of animals in relatively small areascreates the potential for contributing to air pollution through odors and dust and to surface andground water pollution through nutrient loading from improper handling of manure. In both cases,however, since the animals are so concentrated, feedlots are considered point sources of pollutionby EPA. Over the past two to three decades, EPA and its state agency counterparts have becomeincreasingly stringent and vigilant in their regulations of potential pollutants from feedlots. Becauseregulatory pressure is expected to continue and even increase, the beef cattle industry will not likelycontribute to significant additional environmental damage in the future through feedlots.
The cattle and beef industry’s contribution to increased atmospheric CO2 is primarily through cattlefeeding. The primary sources of fossil fuel use are in the fertilization and irrigation of the feedgrains. Beef cattle, however, utilize only a small portion of the total annual supply of feed grains

62
(e.g., about 11% of the 1992/93 corn supply). However, given the competition from pork andpoultry and the current and projected prices of fossil fuels and feed grains, the U.S. cattle industrywill likely continue to use feedlots for grain finishing of beef cattle for the foreseeable future.
Challenges Remaining
The U.S. beef consumer is conditioned to and demands the consistency in taste, tenderness, andavailability that is much easier to produce with grain finishing compared to forage finishing. In mostcattle producing areas of the U.S., maintaining grazeable forage of the quality required to fattenyoung cattle year-round is impossible. Thus, forage-based fattening systems are seasonal andsubject to a high degree of variation in the volume and quality of the resulting beef product due tofluctuating forage growing conditions (e.g. drought). Given these conditions relative to forage-based finishing, the competition from pork and poultry, and the current and projected prices of fossilfuels and feed grains, the U.S. cattle and beef industry faces a severe challenge in reducing itscontribution to increased levels of atmospheric CO2 through reductions in use of feedlots for grainfinishing of beef cattle for the foreseeable future.
Alternative Solutions and Resource Constraints
One alternative for increasing consumer acceptance of forage-finished in contrast to grain-finishedbeef is through programs to educate consumers that forage-finished beef is both a healthier (reducedfat) and an environmentally friendlier product. This strategy is, in fact, being used by some up-scalerestaurants featuring “speciality” meats and in some grocery meat markets specializing in “organic”or “natural” foods. Some of the beef marketed in this manner is being imported from Argentinawhere most beef is forage-finished. One problem with this approach, in addition to the variabilityin quality and availability mentioned above, is the fact that much of the forage-grazed by cattle isfertilized with non-organic chemicals and in some cases subjected to use of chemical pesticides.Also, many of the cattle in the forage-finishing production systems will have been treated withanabolic steroids and/or other pharmaceuticals and/or pesticides. Use of these technologies is, inthe minds of many, inconsistent with the concept of “organic” or “natural” food. Production,processing and marketing arrangements to assure the public that these practices are not being usedwill be expensive, but likely necessary, if this approach is to achieve any measure of success.
Principal Economic, Social, and Political Challenges
Two centuries ago, the U.S. was an atomistic, agrarian-based society with a seemingly unlimitedsupply of natural resources. Human well being was relatively closely linked to the solar powerednatural system on which they depended. Today, most of the population of the U.S. and many othercountries live in an urban, industrialized society, largely dependent on energy from fossil fuels fortheir existence. The socio-cultural changes that have evolved with these technological developmentsare no less dramatic. One of the major developments in the advent of our modern society is thegrowth of consumerism as a defining characteristic of our culture. One result of these technologicaland cultural developments is that most members of our society have become much less attuned to

63
the relationship between our well being and the natural environment within which we all exist andon which we ultimately depend for our very sustenance. Another result is that we have, and are,experiencing an unprecedented population explosion in the world. Together, these developmentshave allowed us to evolve into a society that is almost totally concerned with pursuing our personalsatisfaction through constantly increasing our material possessions and convenience and throughsatisfying our personal curiosities while at the same time using up our natural resources and ourecology’s ability to assimilate our wastes at clearly unsustainable rates. Status of Current Efforts to Solve Environmental Problems
In recent decades, a great deal of attention and public information effort has been devoted toeducating the public about the potential dangers of some of our current technologies and rates ofresource use. Examples of how these efforts have paid off include the creation of agencies like EPAto help protect us from ourselves through efforts to insure the maintenance of clean air and waterand the preservation of biodiversity through protection of endangered species. While much has beendone, we have been notably less successful in other efforts, including, for example, reducing therate of fossil energy consumption and its resultant increased levels of atmospheric CO2.
Challenges Remaining
In the face of our current culture and fossil energy-based economy, the challenge to achieve furtherprogress in reducing the rate of consumption of natural resources and the assimilative capacity ofour environment is formidable. Our representative democracy form of government and ourconsumer-minded electorate make the political task of implementing environmentally friendlyregulations and constraints, with their usual negative economic impacts, doubly difficult.Additionally, the challenge is also made more difficult in that some of the major environmentalproblems are truly global in scale, such as increased levels of atmospheric CO2 , methane, etc. Thus,the solutions to these problems require multi-national concessions, agreements, and programs. Thedifficulty in achieving progress on this scale is exemplified by the slow rate of progress to dateresulting from “The United Nations Conference on Environment and Development” held in Rio deJaneiro in June 1992 and similar efforts. Alternative Solutions and Resource Constraints
Many argue that, particularly in the US, we are subsidizing the use of fossil-based energy primarilythrough our failure to make consumers pay the full costs of its use, including the cost of disposingof the resultant wastes. Instead of recycling, or otherwise treating the wastes from our use of fossil-based energy to yield them inert, we simply dump them into the atmosphere as if its assimilativecapacity were unbounded. Of the several remedies that have been proposed to help rectify thissituation, perhaps the one with the most promise is the carbon tax. The effect of the carbon taxwould be to essentially raise the price that consumers pay for the use of fossil-based energy to morecompletely cover the cost of the use of fossil fuels, including the cost of yielding the wastes fromthe process inert. Obviously, the implementation of such measures would be unpopular since itseffect would be to lower the rate of consumption (standard of living) of the citizenry; thus making

64
such a measure difficult to implement in our representative democracy. Nevertheless, such ameasure may be achievable with a long-term, well-designed public education effort.
If such a tax was implemented, the relative prices of all consumer goods and services, includingfood, would likely be impacted. The price and markets of those items requiring the more fossil-based energy in their production and marketing would be the most negatively impacted. In theextreme, success in achieving a reduction in fossil fuel use through a carbon tax would make grainand other foods directly derived from plant products less expensive relative to animal-based foodproducts derived from the feeding of grain to animals. Obviously, under such a scenario, meatconsumption by humans would be drastically reduced compared to current levels. Cattle and beefproduction under this scenario would likely revert to that which could be produced with little or nograin finishing. Other changes which this situation would likely force include a de-concentrationof the slaughter and processing segments of the beef industry due to the loss of feedlots. In addition,more acreage would likely be converted from grazing land for cattle to the production of crops thatcould be more directly consumed by humans which, in turn, would mean the loss of more wildlifehabitat, a greatly increased opportunity for soil erosion, etc.
Measures like a carbon tax are going to be difficult to implement through a process that is anythingmore than slow and incremental. In addition to the problem of direct economic effects on thecitizenry, international trade and global equity issues will insure that changes will be neither fast nordramatic. For these reasons, and those discussed throughout this report, we believe that there isunlikely to be much change in the rate of grain-based finishing in the beef industry for theforeseeable future.

65
References
Anderson, A.L. 1951. Introductory Animal Husbandry. New York: Macmillan Co.
Anderson, P. and J.R. Males. 1998. “Typical Management Practices in U.S. Beef Production:Efficacy and Food Safety Considerations,” Department of Animal and Range Science, SouthDakota State University, Brookings, South Dakota (available on the Internet athttp://www.abs.sdstate.edu/flcs/Extra%20Stuff/Typmgmt.htm#TOP).
Archer, S.R., D.S. Schimel, and E.A. Holland. 1994. “Mechanisms of Shrubland Expansion: LandUse, Climate or CO2? in Climatic Change. The Netherlands: Kluwer Academic Publishers,pp. 1-9.
Azzam, A.M. 1996. “Testing the Monopsony-Inefficiency Incentive for Backward Integration.”Amer. J. Agr. Econ. 78:585-590.
Azzam, A.M. and Anderson, D.G. 1996. Assessing Competition in Meatpacking: Economic History,Theory and Evidence. GIPSA-RR-96-6. Grain Inspection, Packers and StockyardsAdministration, U.S. Department of Agriculture.
Azzam, A.M. and J.R. Schroeter. 1991. “Implications of Increased Regional Concentration andOligopsonistic Coordination in the Beef Packing Industry.” Western J. of Agr. Econ. 16:374-381.
Azzam, A.M. and J.R. Schroeter. 1995. “The Tradeoff Between Oligopsony Power and CostEfficiency in Horizontal Consolidation: An Example from Beef Packing.” Amer. J. Agr.Econ. 77:825-836.
Ball, C.E. 1992. The Finishing Touch. Amarillo: Texas Cattle Feeders Association.
Bari, F., M. K. Wood, and L. Murray. 1993. “Livestock Grazing Impacts on Infiltration Rates ina Temperate Range of Pakistan.” J. of Range Management 46:367-372.
Bhattacharya, N.C. 1993. “Prospects of Agriculture in a Carbon Dioxide-Enriched Environment.”Chap. 24 in R.A. Geyer,ed. A Global Warming Forum: Scientific, Economic, and LegalOverview. Boca Raton, Fla.: CRC Press, pp. 487-505.
Bjornn, T.C. and D.W. Reiser. 1991. “Habitat Requirements of Salmonids in Streams. Amer.Fisheries, Special Publication 19:83-138.
Blackburn, W.H., R.W. Knight, and M.K. Wood. 1982. Impact of Grazing on Watersheds: A Stateof Knowledge. Texas Agricultural Experiment Station, MP 1496, College Station, Texas.

66
Brandjes, P.J., J. deWit, H.G. van der Meer, and H. van Keulen. 1996. “Environmental Impact ofAnimal Manure Management” in Livestock and the Environment - Finding a Balance.Wageningen, The Netherlands: International Agriculture Centre.
Briske, D. D. 1991. “Developmental Morphology and Physiology of Grasses” in Grazing
Management: An Ecological Perspective. Portland, Ore,: Timber Press, pp.85-108.
Brokken, R.F., C.W. O’Connor and T.L. Nordblom. 1980. Cost of Reducing Grain Feeding of BeefCattle. Agricultural Economic Report No. 459, USDA, Washington, D.C.
Chancelor, W.J., R.H. Schmidt and W. Soehne. 1962. “Laboratory Measurement of Soil Compactionand Plastic Flow. Trans. ASAE 5:235-39.
Clary, G.A., Dietrich, R.A. and Farris, D.E. 1984. Interregional Competition in the U.S. CattleFeeding Fed-Beef Economy. Bulletin 1487, Texas Agricultural Experiment Station, TexasA&M University, College Station, Texas.
Conner, J.R. and L. James. 1996. “Environment and Natural Resources: Trends and Implications”in Texas Agricultural and Natural Resources Summit: Environmental and Natural ResourcePolicy for the 21st Century. Texas A&M University, College Station, Texas.
Conner, J. R., and R. W. Rogers. 1979. “Ground Beef: Implication for the Southeastern U.S. BeefIndustry,” Southern Journal of Agricultural Economics 11: 21-6.
Conrad, J.H., and A.J.H. van Es. 1983. “Efficient Utilization of Feed Resources for LivestockProduction” Proceedings of the Fifth World Conference of Animal Production 1:83-93.
Cooperrider, A. 1994. “Cattle and Wildlife Interactions” in F.M. Byers, ed. Cattle on the Land.College Station, Texas: Byers Communications, pp. 181-5.
De Wit, J., P.T. Westra and A.J. Nell. 1996. “Environmental Impact Assessment of LandlessLivestock Ruminant Production Systems” in Livestock and the Environment - Finding aBalance. Wageningen, The Netherlands: International Agriculture Centre.
Dietrich, R.A. 1967. Price Information and Meat Marketing in Texas and Oklahoma. AgriculturalEconomic Report No.115, Economic Research Service, U.S. Department of Agriculture,Washington, D.C.
Dietrich, R.A. 1968. The Texas-Oklahoma +Cattle Feeding Industry. Bulletin 1079, TexasAgricultural Experiment Station, Texas A&M University, College Station, Texas.
Dietrich, R.A. 1969. Costs and Economies of Size in Texas-Oklahoma Cattle Feedlot Operations.Bulletin 1083. Texas Agricultural Experiment Station, Texas A&M University, CollegeStation, Texas.

67
Dietrich, R.A. 1971. Interregional Competition in the Cattle Feeding Economy – with SpecialEmphasis on Economies of Size. Bulletin 115, Texas Agricultural Experiment Station, TexasA&M University, College Station, Texas.
Dietrich, R.A., Amosson, S.H. and Crawford, R.P. 1988. Operational Characteristics and HerdHealth Management Practices Associated with Brucellosis Quarantined Cattle Herds, U.S.,1980-82. Bulletin 1589, Texas Agricultural Experiment Station, Texas A&M University,College Station, Texas.
Dietrich, R.A., Thomas, P.J. and Farris, D.E. 1985. The Texas Cattle Feeding Industry -Operations, Management, and Costs. Bulletin 1495. Texas Agricultural ExperimentStation, Texas A&M University, College Station, Texas.
Dietrich, R.A., Williams, W.F. and Miller, J.E. 1963. The Texas-Oklahoma Meat Industry –Structure and Marketing Practices. Agricultural Economic Report No.39, EconomicResearch Service, U.S. Department of Agriculture, Washington, D.C.
Dumagon, J.C. and Hackett, J.W. 1995. “Almost Half of the Food Budget is Spent Eating Out,”Food Review. Economic Research Service, U.S. Department of Agriculture, Washington,D.C.
Fleischner, T.L. 1994. “Ecological Costs of Livestock Grazing in Western North America,”Conservation Biology 8(3): 629-44.
Fox, D.G. 1994. “Saving Energy in Beef Production” in F.M. Byers, ed. Cattle on the Land.
College Station, Texas: Byers Communications, pp 105-111.
Gillis, A.M. 1991. “Should Cows Chew Cheatgtrass on Commonlands?” BioScience 41(10): 668-75.
Gustafson, R.A. and Van Arsdall, R.N. 1970. Agricultural Economic Report No.186, EconomicResearch Service, U.S. Department of Agriculture, Washington, D.C.
Havel, J.T. 1966. “Inspection of Intrastate Meat In Kansas,” Your Government, University ofKansas, Sept 15.
Hamilton, W.T., J.W. Stuth, J.R. Conner, D.P. Sheehy, U.P. Kreuter and J.R. Simpson. 1996. “Vol.IV: Mixed Rainfed Systems in Temperate Zones” in Interactions Between LivestockProduction Systems and the Environment. Bryan, Tx: Grazingland Management SystemsInc.
Hilbert, D.W., D.M. Swift, J.K. Detling, and M.I. Dyer. 1981. “Relative Growth Rates and theGrazing Optimization Hypothesis,” Oecologia (Berl.) 51:14-18.

68
Holechek, J.L., R.D. Piper, and C.H. Herbal. 1995. Range Management: Principles and Practices.Englewood Cliffs, New Jersey: Prentice Hall, pp.61-62.
Johnson, D.E., M. Branine, G.M. Ward, B. Carmean and D. Lodman. 1994. “The PotentialContribution of Beef Cattle Methane to Global Warming: Background Information andPerspectives” in F.M. Byers, ed. Cattle on the Land. College Station, Texas: ByersCommunications, pp 29-33.
Kauffman, J.B.and W.C. Krueger. 1984. “Livestock Impacts on Riparian Ecosystems andStreamside Management Implications: A Review,” J. of Range Management 37:430-437.
Keener, H.M. and W.L. Roller. 1994. “Energy Cost of Beef Production Systems” in F.M. Byers, ed.Cattle on the Land. College Station, Texas: Byers Communications, pp 119-133.
Kenworthy, T. 1995. “Dueling with the Forest Service: Western Ranchers Have Launched a RevoltOver Federal Public Land Policies,” Washington Post, National Weekend Edition, Feb. 27-Mar. 5, 1995.
Khalil, M.A.K., R.M. MacKay, M.J. Shearer and R.A. Rasmussen. 1994. “Methane and theGreenhouse Effect: The Role of Cattle Over the Last Century” in F.M. Byers, ed. Cattle onthe Land. College Station, Texas: Byers Communications, pp. 35-55.
Koontz, S.R. and P. Garcia. 1997. “Meat-Packer Conduct in Fed Cattle Pricing: Multiple-MarketOligopsony Power.” J. of Agr. and Res. Econ. 22:87-103.
Lerner, J., E. Mathews and I. Fung. 1988. “Methane Emission from Animals: A Global HighResolution Data Base,” Global Biogeochemical Cycles II: 139.
Mayeux, H.S., Jr., H.B. Johnson, and H.W. Polley. 1991. “Global Change and VegetationDynamics,” Chap. 7 in L.F. James, J.O. Evans, M.H. Ralphs, and R.D. Childs, eds. NoxiousRange Weeds. Boulder, Colorado: Westview Press, pp. 62-74.
McCoy, J.H. and Sarhan, M.F. 1988. Livestock and Meat Marketing. New York: Van NostrandReinhold Co.
McGinty, A., T.L. Thurow and C.A. Taylor, Jr. 1991. “Improving Rainfall Effectiveness onRangeland,” Texas Agricultural Extension Service Report No. L-5029, Texas A&MUniversity, College Station, Texas.
Menzie, E.L., Hanekemp, W.J. and Phillips, G.W. 1973. The Economics of the Cattle FeedingIndustry in Arizona. Report No. TB-207, Arizona Agricultural Experiment Station,University of Arizona, Tucson, Arizona.

69
Milchunas, D.G., and W.K. Lauenroth. 1993. “Quantitative Effects of Grazing on Vegetation andSoils Over a Global Range of Environments,” Ecological Monographs 63:327-66.
National Commission on Food Marketing. 1966. Organization and Competition in Food Retailing.Technical Study No. 7, Washington, D.C.
Packer Consent Decree. 1925. 68th Congress, Document No. 219. Government Printing Office,Washington, D.C.
Payne, W.J.A. 1985. “A Review of the Possibilities for Integrating Cattle and Tree Crop ProductionSystems in the Tropics,” Forest Ecology and Management 12:1-36.
Purcell, W.D. 1998. “A Primer on Beef Demand.” Research Bulletin No. 2-98. Research Instituteon Livestock Pricing, Virginia Tech University.
Ritchie, H.D. 1994. “Food Safety in the Beef Cattle Industry” in F.M. Byers, ed. Cattle on the Land.College Station, Texas: Byers Communications, pp. 163-177.
Rowan, R.C. 1992. Understanding the Human Factor in Texas Range Resource Management.Ph.D. dissertation, Texas A&M University.
Runge, C.F. and K. Stuart. 1998. “The History, Trade, and Environmental Consequences of Corn(Maize) Production in the United States.” Study for the World Wildlife Fund, Departmentof Applied Economics, University of Minnesota, March.
Safley, L.M., M.E. Casada, J.W. Woodbury and K.F. Roos. 1992. “Global Methane Emissions fromLivestock and Poultry Manure,” U.S. Environmental Protection Agency, Report No.EPA/4001/1-91/048.
Scifres, C.J. and W.T. Hamilton. 1993. Prescribed Burning for Brushland Management: The SouthTexas Example. College Station, Texas: Texas A&M University Press.
Schnittker, J.A. 1997. “The History, Trade, and Environmental Consequences of SoybeanProduction in the United States.” Study for the World Wildlife Fund, Santa Ynez,California, December.
Schuster, J.L. 1995. “Range Improvements: Principles and Practices for Arid and Semi-Arid Landsof the Arabian Gulf” in Proceedings of the 2nd Conference on Range Management in theArabian Gulf. London, England: Kuwait Institute for Scientific Research, p.77-85.
Sheehy, D.P., W.T. Hamilton, U.P. Kreuter, J.R. Simpson, J.W. Stuth and J.R. Conner. 1996. “Vol.II: Grassland-Based Systems in Temperate Zones” in Interactions Between LivestockProduction Systems and the Environment. Bryan, Tx: Grazingland Management SystemsInc.

70
Sims, P.L. 1985. “Using Improved Pastures to Complement Native Range” in Proceedings ofInternational Ranchers Roundup. College Station, Texas: Texas Agricultural ExtensionService, p. 218-225.
Sims, P.L., and D.W. Bailey. 1995. “Calf Production by Angus-Hereford and Brahman-HerefordCows on Two Native Rangeland Forage Systems,” J. of Animal Science 73:2893-2902.
Stauffer, B., G. Fischer, A. Neftel, and H. Oeschger. 1985. “Increase of Atmospheric MethaneRecorded in Antarctic Ice Core,” Science 229:1386.
Stieger, K.W., A. Azzam, and B.W. Brorsen. 1993. “Markdown Pricing and Cattle Supply in theBeef Packing Industry.” Amer. J. of Agr. Econ. 75:549-558.
Stuth, J.W. 1995. “Tiller Dynamics of Major Grasses in South Texas,” Texas AgriculturalExperiment Station, La Copita Research Area. (Mimeo).
Stuth, J.W., R.K. Lyons, and U.P. Kreuter. 1993. “Animal/Plant Interactions: Nutrient Acquisitionand Use by Ruminants” in Proceedings of Conference on Livestock and Sustainable NutrientCycling in Mixed Farming Systems of Sub-Saharan Africa, Vol. II: Technical Papers. ILCA,Addis Ababa, Ethiopia, pp. 63-82.
Supermarket Business. 1992 and 1998. Howfrey Communications, Inc. New York City, NewYork,September.
Sweeten, J.M. 1994. “Water Use and Water Quality Issues in Beef Production” in F.M. Byers, ed.Cattle on the Land. College Station, Texas: Byers Communications, pp 83-91.
Tapia, L.A.B., P.F. Ffoolliott, and D.P. Cuertin.1990. “Herbage Production-Forest OverstoryRelationships in Two Arizona Pronderosa Pine Forests,” J. of Range Manage. 43:25-28.
Texas Comptroller of Public Accounts. Various years. “Annual Property Tax Report,” Property TaxDivision, Austin, Texas.
Thurow, T. L. 1991. “Hydrology and Erosion” in R.K. Heitschmidt and J.W. Stuth, eds. Grazing
Management: An Ecological Perspective. Portland, Oregon: Timber Press, pp. 141-59.
Tollner, E.W., G.V. Calvert, and G. Langdale. 1990. “Animal Trampling Effects on Soil PhysicalProperties of Two Southeastern U.S. Ultisols,” Agriculture, Ecosystems, and theEnvironment 33:75-87.
Van Arsdall, R.H. and Skold, M.D. 1973. Cattle Raising in the United States. AER 235. ERS, U.S.Department of Agriculture.
Voorhies, E.C. and Koughan, A.B. 1928. Economic Aspects of the Beef Cattle Industry. Bulletin461. University of California, Berkeley, CA.

71
U.S. Department of Agriculture (USDA). 1998. “Livestock and Poultry Situation and Outlook,”Economic Research Service, Washington, D.C.
U.S. Department of Agriculture (USDA). 1970. “Livestock Slaughter, 1969.” Statistical ReportingService, MtAn 1-2-1(70), Washington, D.C., April.
U.S. Department of Agriculture (USDA). 1975. “Livestock Slaughter: Annual Summary 1974.”Statistical Reporting Service, MtAn 1-2-1(75), Washington, D.C., April.
U.S. Department of Agriculture (USDA). 1965. “Number of Feedlots by Size Group and Numberof Fed Cattle Marketed, 1962-64.” Statistical Reporting Service, SRS-9, Washington, D.C.
U.S. Department of Commerce. 1994. 1992 Census of Agriculture, Vol. 1. Economics and StatisticsAdministration, Bureau of the Census, Washington, D.C.
U.S. General Accounting Office (GAO). 1988. “Rangeland Management: More Emphasis Neededon Declining and Overstocked Grazing Allotments,” Washington, D.C. p.10 and 25.
U.S. Office of Technology Assessment (OTA). 1992. “A New Technological Era for AmericanAgriculture,” U.S. Congress, Report No. OTA-F-474. Washington, D.C.: U.S. GovernmentPrinting Office.
Vander Meer, H.G. and P.C. Meenwissen. 1989. “Emisse van stikstof uit landbouwgronden inrelatie tot bemesting en bedrijfsuoerring” [“Nitrogen Emissions from Agricultural Soils asAffected by Fertilization and Farm Management], Landscape 1:19-32.
Vavra, M. 1994. “Integration of Wildlife and Livestock on Rangelands” in F.M. Byers, ed. Cattleon the Land. College Station, Texas: Byers Communications, pp. 209-12.
Verheijen, L.A.H.M., D. Wiersema, L.W. Hulshoff Pol and J. De Wit. 1996. “Management of Wastefrom Animal Product Processing” in Livestock and the Environment - Finding a Balance.Wageningen, The Netherlands: International Agriculture Centre.
Ward, G.M. 1994. “Fossil Fuel Energy Use for U.S. Beef Production” in F.M. Byers, ed. Cattle on
the Land. College Station, Texas: Byers Communications, pp 135-139.
Wellman, A. 1999. Personal Conversation. Livestock Extension Specialist and Professor.University of Nebraska, Lincoln.
Wilcox, R.H. et al. 1927. Costs and Methods of Fattening Beef Cattle in the Corn Belt 1919-1923.Technical Bulletin 23. U.S. Department of Agriculture.
Williams, D.J. 1993. “Methane Emissions from Manure of Free-Range Dairy Cows,” Chemosphere26:179-187.

72
Williams, G.W. et al. 1996. Price Determination in Slaughter Cattle Procurement. GIPSA-RR-96-2. Contract report prepared by the Teas Agricultural Market Research Center, Texas A&Mfor the Grain Inspection, U.S. Department of Agriculture, Packers and StockyardsAdministration.
Williams, R.L., Dietrich, R.A. and Byers, F.M. 1991. Economic Impact of Alternative GrowthPromotant Strategies on the United States Beef Industry. Bulletin 1701. Texas AgriculturalExperiment Station.
Williams, W.F. 1966. “Structure and Conduct of the Commercial Cattle Feeding Industry.”Supplement Study No. 1 to Technical Study No. 1, Organization and Competition in theLivestock and Meat Industry. National Commission on Food Marketing.
Williams, W.F. and Stout, T.T. 1964. Economics of the Livestock-Meat Industry. New York:Macmillan Co.
World Resources Institute. 1994. “Chapter 7, Forests and Rangelands” in A Report by the WorldResources Institute in collaboration with the United Nations Environment Programme andthe United Nations Development Programme. New York City,New York: Oxford Univ.Press.

73
Figures here.

74
Table 1. Cattle Inventory, United States, January 1, 1970 to January 1, 1998.
Class 1970 1980 1990 1998
---------------------------1,000 Head-------------------------
Cattle and Calves 112,369 111,242 95,816 99,501
Cows and Heifers That Have Calved 48,780 47,865 42,469 42,874
Beef Cows 36,689 37,107 32,454 33,683
Dairy Cows 12,091 10,758 10,015 9,191
Heifers 500 Pounds and Over 16,443 17,233 17,257 19,746
Beef Cow Replacement 6,431 5,942 5,283 5,745
Dairy Cow Replacement 3,880 4,159 4,171 3,982
Other Heifers 6,132 7,132 7,803 10,018
Steers 500 Pounds and Over 15,265 16,049 15,512 17,197
Bulls 500 Pounds and Over 2,272 2,492 2,160 2,266
Calves Under 500 Pounds 29,609 27,603 18,418 17,418
Sources: Livestock, Dairy, and Poultry Situation and Outlook, Economic Research Service, U.S. Department ofAgriculture, various issues.

75
Table 2. Beef Cow and Diary Cow Inventory, by State and Region, United States,January 1, 1990 to January 1, 1998.
1990 1998
State and Region Beef Cows Dairy Cows Beef Cows Dairy Cows
-----------------------------------1,000 Head---------------------------------
Northeast:
Maine (ME) 16 43 12 41
New Hampshire (NH) 4 19 4 20
Vermont (VT) 14 167 13 163
Massachusetts (MA) 11 31 7 27
Rhode Island (RI) 1 2 1 2
Delaware (DE) 2 9 3 10
Maryland (MD) 56 106 49 86
Connecticut (CT) 7 34 7 30
New York (NY) 75 790 80 700
New Jersey (NJ) 10 26 13 19
Pennsylvania (PA) 176 694 165 625
Sub-Total 372 1,921 354 1,723
Lake:
Michigan (MI) 131 344 115 300
Wisconsin (WI) 180 1,760 220 1,380
Minnesota (MN) 350 715 395 555
Sub-Total 661 2,819 730 2,235
Corn Belt:
Ohio (OH) 380 354 305 265
Indiana (IN) 370 160 285 135
Illinois (IL) 555 195 440 130
Iowa (IA) 1,122 308 1,005 225
Missouri (MO) 1,964 226 2,045 175
Sub-Total 4,391 1,243 4,080 930
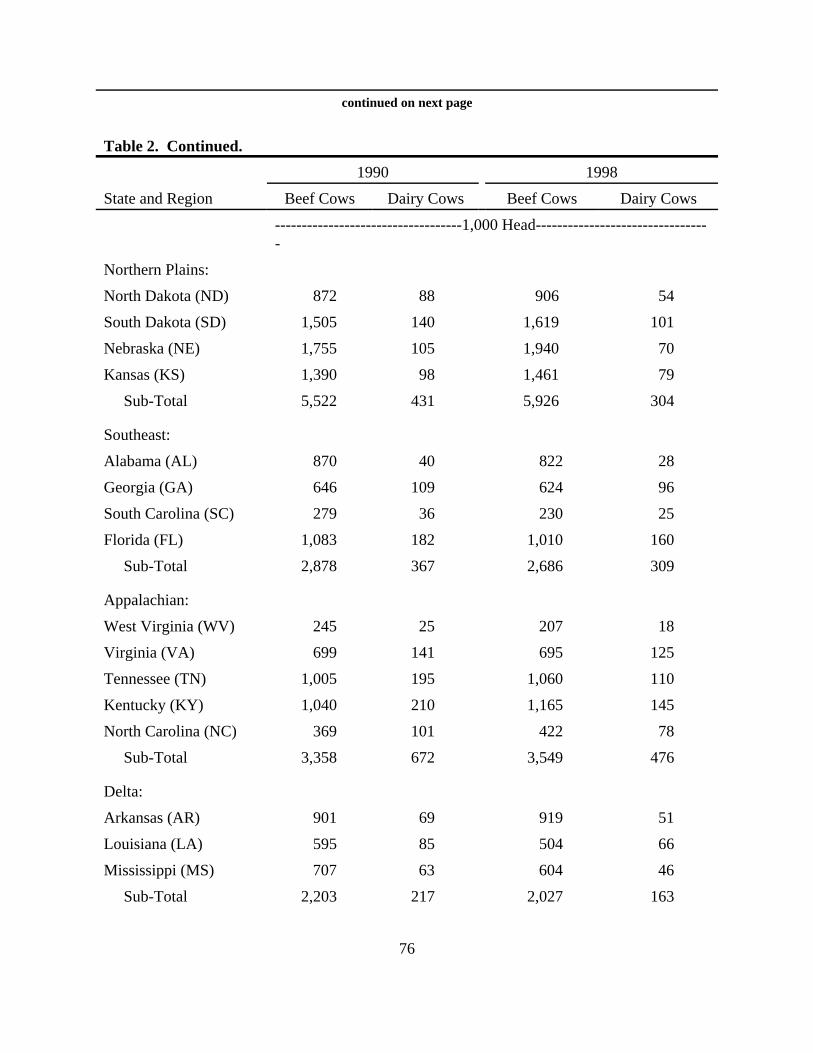
76
continued on next page
Table 2. Continued.
1990 1998
State and Region Beef Cows Dairy Cows Beef Cows Dairy Cows
-----------------------------------1,000 Head---------------------------------
Northern Plains:
North Dakota (ND) 872 88 906 54
South Dakota (SD) 1,505 140 1,619 101
Nebraska (NE) 1,755 105 1,940 70
Kansas (KS) 1,390 98 1,461 79
Sub-Total 5,522 431 5,926 304
Southeast:
Alabama (AL) 870 40 822 28
Georgia (GA) 646 109 624 96
South Carolina (SC) 279 36 230 25
Florida (FL) 1,083 182 1,010 160
Sub-Total 2,878 367 2,686 309
Appalachian:
West Virginia (WV) 245 25 207 18
Virginia (VA) 699 141 695 125
Tennessee (TN) 1,005 195 1,060 110
Kentucky (KY) 1,040 210 1,165 145
North Carolina (NC) 369 101 422 78
Sub-Total 3,358 672 3,549 476
Delta:
Arkansas (AR) 901 69 919 51
Louisiana (LA) 595 85 504 66
Mississippi (MS) 707 63 604 46
Sub-Total 2,203 217 2,027 163

77
continued on next page

78
Table 2. Continued.
1990 1998
State and Region Beef Cows Dairy Cows Beef Cows Dairy Cows
-----------------------------------1,000 Head---------------------------------
Southern Plains:
Oklahoma (OK) 1,880 100 1,959 91
Texas (TX) 5,210 390 5,510 370
Sub-Total 7,090 490 7,469 461
Mountain:
Idaho (ID) 530 170 520 280
Montana (MT) 1,328 24 1,542 18
Wyoming (WY) 650 10 874 6
Utah (UT) 325 80 355 90
Nevada (NV) 290 20 239 26
Colorado (CO) 774 76 856 84
Arizona (AZ) 259 91 220 130
New Mexico (NM) 589 71 564 216
Sub-Total 4,745 542 5,170 850
Pacific:
Washington (WA) 375 225 300 250
Oregon (OR) 592 98 682 88
California (CA) 935 1,115 820 1,400
Sub-Total 1,902 1,438 1,802 1,738
Total 48 States 33,122 10,140 33,793 9,189
Source: Cattle, NASS, U.S. Department of Agriculture, various issues.

79
Table 3. Calf Crop and Stocker Cattle Supplies, by State and Region, United States,1990 and 1998.
Calf Crop Stocker Cattle 1
State and Region 1990 1998 1990 1998
------------------------------------1,000 Head----------------------------------
Northeast:
ME 58 48 5 4
NH 22 22 1 2
VT 165 158 3 5
MA 34 24 3 3
RI 4 3 1 1
DE 11 10 6 5
MD 141 110 16 14
CT 37 29 2 3
NY 780 660 44 40
NJ 32 22 3 1
PA 780 690 176 163
Sub-Total 2,064 1,776 256 241
Lake:
MI 390 365 60 35
WI 1,880 1,460 285 240
MN 1,040 900 275 355
Sub-Total 3,310 2,725 620 630
Corn Belt:
OH 600 480 80 75
IN 440 380 57 62
IL 640 520 320 260
IA 1,300 1,130 825 540
MO 2,030 2,070 594 630
Sub-Total 5,010 4,580 1,876 1,567continued on next page

80
Table 3. Continued.
Calf Crop Stocker Cattle 1
State and Region 1990 1998 1990 1998
------------------------------------1,000 Head----------------------------------
Northern Plains:
ND 970 960 310 420
SD 1,630 1,700 677 855
NE 1,730 1,820 630 1,450
KS 1,330 1,450 1,403 1,450
Sub-Total 5,660 5,930 3,020 4,175
Southeast:
AL 850 740 126 108
GA 670 590 92 68
SC 245 205 33 30
FL 1,000 950 25 66
Sub-Total 2,765 2,485 276 272
Appalachian:
WV 265 205 60 73
VA 795 740 186 230
TN 1,075 1,040 146 160
KY 1,200 1,160 245 270
NC 460 450 49 59
Sub-Total 3,795 3,595 686 792
Delta:
AR 790 840 104 125
LA 510 430 31 38
MS 690 540 72 87
Sub-Total 1,990 1,810 207 250
continued on next page

81
Table 3. Continued.
Calf Crop Stocker Cattle 1
State and Region 1990 1998 1990 1998
------------------------------------1,000 Head----------------------------------
Southern Plains:
OK 1,820 1,840 1,400 1,245
TX 4,950 5,250 1,590 1,630
Sub-Total 6,770 7,090 2,990 2,875
Mountain:
ID 680 770 240 275
MT 1,380 1,500 268 385
WY 600 830 148 289
UT 350 380 87 160
NV 265 220 22 62
CO 830 850 600 665
AZ 280 285 -27 31
NM 500 620 162 222
Sub-Total 4,885 5,455 1,500 2,089
Pacific:
WA 530 470 178 112
OR 640 690 183 225
CA 1,750 1,900 490 410
Sub-Total 2,920 3,060 851 747
Total 48 States 39,169 38,506 12,282 13,6381 Stocker cattle supplies are estimated for January 1, 1990 and 1998 by summing other heifers and steers 500pounds and over and subtracting January 1 cattle on feed for the respective years, states and regions.Source: Cattle, NASS, U.S. Department of Agriculture.

82
Table 4. Number of Beef Cow Operations and Average Beef Cows per Operation, byState and Region, United States, 1990 and 1998.
1990 1998
State and RegionNumber ofOperations
Beef Cows perOperation
Number ofOperations
Beef Cows perOperation
Northeast:
ME 1,800 9 1,000 12
NH 600 7 550 7
VT 1,400 10 1,100 12
MA 1,200 9 850 8
RI 170 8 130 8
DE 220 9 240 12
MD 3,600 16 2,800 18
CT 1,000 7 750 9
NY 8,000 9 6,400 12
NJ 1,000 10 1,100 12
PA 15,000 12 11,300 15
Sub-Total 33,990 11 26,220 14
Lake:
MI 8,500 15 7,800 15
WI 9,700 19 12,200 18
MN 15,000 23 15,800 25
Sub-Total 33,200 20 35,800 20
Corn Belt:
OH 23,000 17 17,500 17
IN 20,000 19 15,500 18
IL 22,000 25 17,700 25
IA 31,000 36 28,000 36
MO 67,000 29 59,000 35
Sub-Total 163,000 27 137,700 30
continue on next page
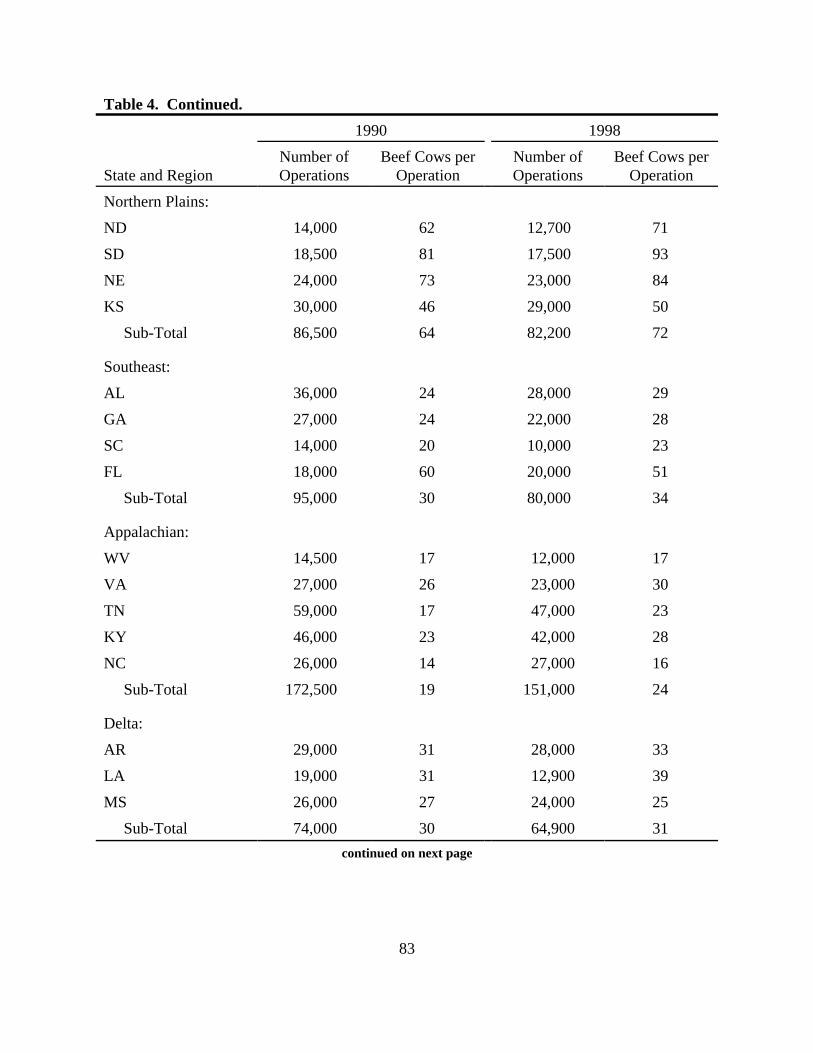
83
Table 4. Continued.
1990 1998
State and RegionNumber ofOperations
Beef Cows perOperation
Number ofOperations
Beef Cows perOperation
Northern Plains:
ND 14,000 62 12,700 71
SD 18,500 81 17,500 93
NE 24,000 73 23,000 84
KS 30,000 46 29,000 50
Sub-Total 86,500 64 82,200 72
Southeast:
AL 36,000 24 28,000 29
GA 27,000 24 22,000 28
SC 14,000 20 10,000 23
FL 18,000 60 20,000 51
Sub-Total 95,000 30 80,000 34
Appalachian:
WV 14,500 17 12,000 17
VA 27,000 26 23,000 30
TN 59,000 17 47,000 23
KY 46,000 23 42,000 28
NC 26,000 14 27,000 16
Sub-Total 172,500 19 151,000 24
Delta:
AR 29,000 31 28,000 33
LA 19,000 31 12,900 39
MS 26,000 27 24,000 25
Sub-Total 74,000 30 64,900 31
continued on next page

84
Table 4. Continued.
1990 1998
State and RegionNumber ofOperations
Beef Cows perOperation
Number ofOperations
Beef Cows perOperation
Southern Plains:
OK 51,000 37 52,000 38
TX 120,000 43 131,000 42
Sub-Total 171,000 41 183,000 41
Mountain:
ID 8,500 62 8,000 65
MT 12,300 108 12,700 121
WY 5,100 127 5,500 159
UT 5,000 65 5,600 63
NV 1,400 207 1,400 171
CO 10,800 72 11,700 73
AZ 2,700 96 2,300 96
NM 7,000 84 7,000 81
Sub-Total 52,800 90 54,200 95
Pacific:
WA 15,000 25 12,000 25
OR 17,000 35 13,500 51
CA 18,000 52 14,500 57
Sub-Total 50,000 38 40,000 45
Total 48 States 931,990 36 855,020 40
Source: Cattle, NASS, U.S. Department of Agriculture.

85
Table 5. Percent of Beef Cow Inventory, by Size of Operation, State and Region, UnitedStates, 1998.
Size of Operation
State and Region 1-49 Head 50-99 Head 100-499 Head 500+ Head
------------------Percent of total livestock inventory-----------------------
Northeast:
PA 74.0 15.0 11.0 NR
Lakes:
MN 50.0 28.0 18.5 3.5
Corn Belt:
OH 71.0 15.0 11.7 2.3
IN 68.0 18.0 14.0 NR
IL 56.0 24.0 18.2 1.8
IA 39.5 30.0 28.0 2.5
MO 42.0 26.0 27.0 5.0
Average 46.8 25.5 24.2 3.5
Northern Plains:
ND 14.5 22.0 59.0 4.5
SD 11.0 17.0 58.0 14.0
NE 13.0 17.0 47.0 23.0
KS 28.0 24.0 41.0 7.0
Average 16.4 19.5 50.4 13.8
Southeast:
AL 41.0 22.0 32.0 5.0
GA 44.0 22.0 29.0 5.0
FL 18.0 10.0 27.0 45.0
Average 44.7 18.9 27.7 8.7
continued on the next page

86
Table 5. Continued.
Size of Operation
State and Region 1-49 Head 50-99 Head 100-499 Head 500+ Head
------------------Percent of total livestock inventory-----------------------
Appalachian:
TN 58.0 23.0 17.5 1.5
KY 53.0 23.0 22.5 1.5
Average 55.9 22.7 19.9 1.5
Delta:
AR 43.0 25.0 28.0 4.0
LA 34.0 16.0 38.0 12.0
MS 43.0 23.0 28.0 6.0
Average 40.7 22.2 30.5 6.6
Southern Plains:
OK 35.0 23.0 34.0 8.0
TX 29.0 18.0 37.0 16.0
Average 30.6 19.3 36.2 13.9
Mountain:
ID 16.0 13.0 48.0 23.0
MT 7.0 10.0 56.0 27.0
WY 5.0 8.0 48.0 39.0
UT 15.0 17.0 45.0 23.0
CO 14.0 15.0 50.0 21.0
AZ 8.0 7.0 37.0 48.0
NM 12.0 11.0 42.0 35.0
Average 10.0 11.3 49.5 29.2
continue on next page

87
Table 5. Continued.
Size of Operation
State and Region 1-49 Head 50-99 Head 100-499 Head 500+ Head
------------------Percent of total livestock inventory-----------------------
Pacific:
WA 27.0 15.0 40.0 18.0
OR 18.0 10.0 40.0 32.0
CA 13.0 10.0 43.0 34.0
Average 17.2 10.8 41.4 30.6
Other States 1 50.0 17.0 19.0 14.0
United States 30.4 18.8 36.1 14.7
NR - None reported1 Other states include ME, NH, VT, MA, RI, DE, MD, CT, NY, NJ, MI, WI, SC, WV, VA, NC, NV, AK and HI. These states accounted for 7.1 percent of the January 1, 1998, beef cow inventory.Source: Cattle, NASS, U.S. Department of Agriculture.

88
Table 6. Number of Dairy Cow Operations and Average Dairy Cows per Operation, byState and Region, United States, 1990 and 1998.
1990 1998
State and RegionNumber ofOperations
Dairy Cowsper Operation
Number ofOperations
Dairy Cowsper Operation
Northeast:
ME 1,000 43 700 59
NH 400 18 300 67
VT 2,700 62 1,900 86
MA 700 44 450 60
RI 50 44 40 53
DE 160 56 130 77
MD 1,800 59 1,100 78
CT 500 68 350 86
NY 13,000 61 8,700 80
NJ 450 58 300 63
PA 15,500 45 10,900 57
Sub-Total 36,260 53 24,870 69
Lake:
MI 6,500 53 4,000 75
WI 33,000 53 23,000 60
MN 15,500 46 9,700 57
Sub-Total 55,000 51 36,700 61
Corn Belt:
OH 9,000 39 5,500 48
IN 5,000 32 3,300 41
IL 3,700 53 2,300 57
IA 7,800 39 4,300 52
MO 8,000 28 4,300 41
Sub-Total 33,500 37 19,700 47
continue on next page

89
Table 6. Continued.
1990 1998
State and RegionNumber ofOperations
Dairy Cowsper Operation
Number ofOperations
Dairy Cowsper Operation
Northern Plains:
ND 2,300 38 1,200 45
SD 3,600 39 1,800 56
NE 3,300 32 1,400 50
KS 2,400 41 1,400 56
Sub-Total 11,600 37 5,800 52
Southeast:
AL 1,200 33 380 74
GA 1,500 73 950 101
SC 1,200 30 300 83
FL 1,200 152 650 246
Sub-Total 5,100 72 2,280 136
Appalachian:
WV 2,000 13 800 23
VA 3,000 47 1,800 69
TN 4,500 43 2,000 55
KY 6,500 32 3,400 43
NC 2,000 51 1,100 71
Sub-Total 18,000 37 9,100 52
Delta:
AR 2,000 35 1,200 43
LA 2,100 40 800 83
MS 1,500 42 600 77
Sub-Total 5,600 39 2,600 63
continued on next page

90
Table 6. Continued.
1990 1998
State and RegionNumber ofOperations
Dairy Cowsper Operation
Number ofOperations
Dairy Cowsper Operation
Southern Plains:
OK 3,400 29 2,100 43
TX 5,700 68 3,200 116
Sub-Total 9,100 54 5,300 87
Mountain:
ID 2,200 77 1,300 215
MT 1,900 13 700 26
WY 700 14 300 20
UT 1,500 53 900 100
NV 300 67 150 173
CO 1,700 45 900 93
AZ 500 182 250 520
NM 1,200 59 500 432
Sub-Total 10,000 54 5,000 170
Pacific:
WA 3,000 75 1,300 192
OR 2,100 47 1,000 88
CA 4,500 248 2,700 519
Sub-Total 9,600 150 5,000 360
Total 48 States 193,760 52 116,350 79
Source: Cattle, NASS, U.S. Department of Agriculture.

91
Table 7. Percent of Dairy Cow Inventory by Size of Operation, State and Region, UnitedStates, 1998.
Size of Operation
State and Region1-29Head
30-49Head
50-99Head
100-199Head
200-499Head
500+Head
-----------------------Percent of total livestock inventory-------------------------
Northeast:
MD 2.5 6.9 36.0 34.0 13.0 7.6
NY 2.5 10.5 34.0 26.0 15.0 12.0
PA 4.5 25.0 37.0 22.0 9.5 2.0
VT 1.0 8.0 35.0 26.0 20.0 10.0
Average 3.2 15.8 35.4 24.8 13.2 7.6
Lakes:
MI 4.5 10.5 25.0 32.0 18.0 10.0
WI 4.8 21.0 43.0 18.0 10.0 3.2
MN 5.8 22.0 40.0 16.0 12.0 4.2
Average 5.0 19.9 39.8 19.4 11.6 4.3
Corn Belt:
OH 11.0 12.5 36.0 27.0 11.0 2.5
IN 14.0 18.0 31.0 25.0 7.0 5.0
IL 4.0 11.0 46.0 29.0 10.0 NR
IA 8.0 18.0 38.0 22.0 12.0 2.0
MO 7.0 16.8 33.0 36.0 8.0 NR
Average 8.9 15.0 36.6 27.6 9.9 2.0
Northern Plains: NR NR NR NR NR NR
Southeast:
GA 3.0 1.0 8.0 28.0 31.0 29.0
FL 0.5 0.2 1.5 3.8 15.0 79.0
Average 1.6 0.8 3.9 12.8 21.0 59.9
continued on the next page

92
Table 7. Continued.
Size of Operation
State and Region1-29Head
30-49Head
50-99Head
100-199Head
200-499Head
500+Head
-----------------------Percent of total livestock inventory-------------------------
Appalachian:
VA 6.0 3.0 26.0 38.0 22.0 5.0
TN 3.0 6.4 28.0 37.0 20.0 5.6
KY 8.0 18.0 40.0 24.0 8.0 2.0
NC 1.5 2.5 17.0 37.0 27.0 15.0
Average 5.2 8.5 29.3 33.2 18.0 5.8
Delta: NR NR NR NR NR NR
South Plains:
TX 0.8 2.0 8.2 20.0 29.0 40.0
Mountain:
ID 0.7 1.8 5.5 12.0 19.0 61.0
UT 1.5 2.5 13.0 26.0 37.0 20.0
CO 1.4 1.4 4.2 12.0 30.0 51.0
AZ 0.4 NR 0.5 1.4 5.7 92.0
NM 0.4 NR 0.2 0.7 2.7 96.0
Average 0.7 1.0 4.1 8.9 15.5 69.8
Pacific:
WA 0.4 0.7 3.9 16.0 32.0 47.0
OR 1.0 1.3 9.7 25.0 34.0 29.0
CA 0.1 0.3 0.7 3.4 17.5 78.0
Average 0.5 0.7 4.7 15.3 29.4 49.4
Other States: 3.5 7.7 29.5 25.0 22.8 11.5
United States: 3.6 10.1 26.0 20.0 15.0 25.3

93
NR - None reported1 Other states include ME, NH, MA, RI, DE, CT, NJ, ND, SD, NE, KS, AL, SC, WV, AR, LA, MS, OK, MT,WY, NY, AK and HI. These states accounted for 9.1 percent of the January 1, 1998, milk cow inventory.Source: Cattle, NASS, U.S. Department of Agriculture.
Table 8. Number of Cattle on Feed, by State and Region, January 1, 1970 to January 1,1998.
State and Region 1970 1980 1990 1998
-----------------------------------1,000 Head----------------------------------
Northeast:
MD 20 19 12 15
NY 15 8 18 30
NJ NR 2 2 4
PA 88 79 80 75
Sub-Total 123 108 112 124
Lake:
MI 210 165 220 200
WI 146 112 120 155
MN 589 390 300 265
Sub-Total 945 667 640 620
Corn Belt:
OH 318 180 210 175
IN 349 250 235 170
IL 755 460 310 250
IA 2,213 1,390 980 1,000
MO 402 120 90 100
Sub-Total 4,037 2,400 1,825 1,695
continued on next page

94
Table 8. Continued.
State and Region 1970 1980 1990 1998
-----------------------------------1,000 Head----------------------------------
Northern Plains:
ND 63 39 40 70
SD 361 350 260 310
NE 1,477 1,680 2,060 2,300
KS 892 1,270 1,595 2,370
Sub-Total 2,793 3,339 3,955 5,050
Southeast:
AL 38 27 30 4
GA 59 50 13 5
SC 15 23 17 7
FL 61 60 20 NR
Sub-Total 173 160 80 16
Appalachian:
WV NR 11 7 10
VA 35 50 30 30
TN 26 15 20 20
KY 53 30 20 20
NC 43 30 20 10
Sub-Total 157 136 97 90
continued on next page

95
Table 8. Continued.
State and Region 1970 1980 1990 1998
-----------------------------------1,000 Head----------------------------------
Delta:
AR 16 13 10 10
LA 10 11 9 1
MS 20 15 8 3
Sub-Total 46 39 27 14
Southern Plains:
OK 223 330 325 435
TX 1,417 1,970 2,100 2,860
Sub-Total 1,640 2,300 2,425 3,295
Mountain:
ID 230 260 200 295
MT 115 57 80 80
WY 31 52 75 85
UT 57 60 41 40
NV 47 20 28 24
CO 795 960 900 1,140
AZ 510 420 253 245
NM 209 239 118 123
Sub-Total 1,994 2,068 1,695 2,032
continued on next page

96
Table 8. Continued.
State and Region 1970 1980 1990 1998
-----------------------------------1,000 Head----------------------------------
Pacific:
WA 155 155 170 200
OR 96 73 84 60
CA 1,031 764 490 400
Sub-Total 1,282 992 744 660
Other States NR 14 26 12
Total Feeding States 13,190 12,223 11,626 13,608
NR = None ReportedSource: Cattle, NASS, U.S. Department of Agriculture.

97
Table 9. Number of Commercial Cattle Feedlots, by Size of Feedlot, 12 Major CattleFeeding States and United States, 1970 and 1998.
Year andState
Feedlot capacity (Head)
1,000-1,999
2,000-3,999
4,000-7,999
8,000-15,999
16,000-31,999
32,000 andOver
TotalFeedlots
---------------------------------------Feedlots--------------------------------------------------
1970
IA 88 57 21 5 NR NR 171
KS 31 35 25 21 16 4 132
NE 295 126 63 20 7 3 514
SD 37 9 5* NR NR NR 51
OK 15 14 7 7 4* NR 47
TX 60 44 36 39 33 15 227
AZ 7 8 13 11 8 6 53
CO 82 37 30 22 13* NR 184
ID 36 23 19 7 4 NR 89
NM 10 9 12 9 5* NR 45
CA 67 76 52 47 20 10 272
WA 6 11 6 7 NR NR 30
OtherStates 1
226 81 27 12 3 4 347
UnitedStates 2
960 530 316 207 107 42 2,162
continued on next page

98
Table 9. Continued.
Year andState
Feedlot capacity (Head)
1,000-1,999
2,000-3,999
4,000-7,999
8,000-15,999
16,000-31,999
32,000 andOver
TotalFeedlots
----------------------------------------Feedlots-------------------------------------------------
1998
IA 200 110* NR NR NR NR 310
KS 45 28 32 32 44 19 200
NE 270 181 118 65 26 8 665
SD 50 41 17 7* NR NR 121
OK 3* NR 7 5 3 6 26
TX 8 13 19 27 36 47 142
AZ NR 3* NR NR 3 3 9
CO 54 46 36 18 12 9 166
ID 19 15 9 15* NR NR 55
NM NR NR 6* NR 4* NR 10
CA 4* NR 4 4 7 5 24
WA 7* NR NR 8* NR NR 18
OtherStates
191 85 37 8 5* NR 325
UnitedStates
842 504 310 186 144 105 2,071
1 Other states for 1970 include PA, OH, IN, IL, MI, WI, MN, MO, ND, MT and OR.2 The U.S. totals for 1970 represents the 23 state total as reported by the U.S. Department of Agriculture. The 23state total includes the state in the above table and those included in other states for 1970 as defined by footnote 1 above. Lots from other size groupsare included to avoid disclosing individual operations.Source: Cattle on Feed, NASS, U.S. Department of Agriculture.

99
Table 10. Number of Farmer-Feeder Cattle Feedlots and Fed Cattle Marketed byFarmer Feeders, 11 States and United States, 1970 and 1998 1.
1970 1998
State Feedlots Cattle Marketed Feedlots Cattle Marketed
Number 1,000 Head Number 1,000 Head
IL 23,952 1,064 6,300 290
IN 14,473 451 6,400 220
IA 41,829 4,123 12,000 970
MO 15,466 617 3,900 120
OH 9,472 391 7,300 260
MI 1,673 210 4,000 210
MN 18,162 822 7,400 280
WI 7,793 205 7,400 230
ND 1,779 57 1,800 80
SD 9,049 463 3,500 210
NE 18,400 1,636 4,335 260
Other States 19,307 1,250 37,665 770
United States 181,355 11,289 102,000 3,900 1 Farmer-feeders are operations with less than 1,000 head feedlot capacity.Source: Cattle on Feed, NASS, U.S. Department of Agriculture.

Table 11. Number of Fed Cattle Marketed by Commercial Feedlots, by Size of Feedlot, 12 Major Cattle Feeding States andUnited States, 1970 and 1998.
Year and StateFeedlot capacity (Head)
1,000-1,999 2,000-3,999 4,000-7,999 8,000-15,999 16,000-31,999 32,000 and Over Total Marketed
----------------------------------------------------------Feedlots----------------------------------------------------------------------
1970
IA 150 140 105 65 NR NR 460
KS 52 107 212 311 493 220 1,395
NE 440 406 432 309 216 170 1,973
SD 35 18 36* NR NR NR 89
OK 29 56 59 127 221* NR 492
TX 53 112 281 727 915 952 3,040
AZ 6 23 76 145 254 354 858
CO 110 125 237 326 819* NR 1,617
ID 45 59 94 67 109 NR 374
NM 10 22 71 139 146* NR 388
CA 15 85 180 544 603 520 1,947
WA 7 43 48 207 NR NR 305
Other States 1 250 171 106 161
3 3 706
United States 2 1,202 1,367 1,937 3,128 3,203 2,807 13,644 continued on next page

Table 11. Continued.
Year and StateFeedlot capacity (Head)
1,000-1,999 2,000-3,999 4,000-7,999 8,000-15,999 16,000-31,999 32,000 and Over Total Feedlots
-----------------------------------------------------------Feedlots---------------------------------------------------------------------
1998
IA 210 318* NR NR NR NR 528
KS 45 100 225 640 2,060 1,960 5,030
NE 300 510 840 1,140 945 705 4,440
SD 51 82 80 118* NR NR 331
OK 15* NR 34 98 151 630 928
TX 10 20 80 420 1,270 4,200 6,060
AZ NR NR NR NR 89 195 292
CO 55 90 215 310 430 1,420 2,520
ID 21 24 33 501* NR NR 579
NM NR NR 45* NR 157* NR 202
CA 5* NR 13 26 143 383 570
WA 30* NR NR 437* NR NR 467
continued on next page

102
Table 11. Continued.
Year and State
Feedlot capacity (Head)
1,000-1,999 2,000-3,999 4,000-7,999 8,000-15,999 16,000-31,999 32,000 and Over Total Feedlots
-----------------------------------------------------------Feedlots---------------------------------------------------------------------
Other States 190 190 210 70 163* NR 823
United States 886 1,205 1,912 2,956 5,507 10,304 22,7701 Other states for 1970 include PA, OH, IN, IL, MI, WI, MN, MO, ND, MT and OR.2 The U.S. totals for 1970 represents the 23 state total as reported by the U.S. Department of Agriculture. The 23 state totalincludes the state in the above table and those included in other states for 1970 as defined by footnote 1 above.3 Unable to estimate since marketings from other size groups were combined to avoid disclosure by the U.S. Department ofAgriculture.* Marketings from other size groups are included to avoid disclosing individual operations.Source: Cattle on Feed, NASS, U.S. Department of Agriculture.

103
Table 12. Cattle Feeding Practices, by Region, United States, 1997/98.
Region Days on Feed Placement Weight Market Weight Feed Conversion 1
Days --------------------Pounds---------------- Ratio
Northeast 182 700 1,250 9.93
Lake States 150 765 1,177 11.41
Corn Belt 150 765 1,177 11.41
Northern Plains 142 756 1,190 9.25
Southeast 180 625 1,110 9.76
Appalachian 157 750 1,183 9.43
Delta 185 600 1,130 8.73
Southern Plains 152 695 1,133 8.62
Mountain 150 702 1,155 8.61
Pacific 165 660 1,135 10.87
1 Pounds of feed per pound of gain.Source: Professional Cattle Feeding Consultants, Weatherford, Oklahoma, and Cattle Feeding Consultantsthroughout the United States via telephone interview during 1998.

104
Table 13. Estimated Typical Cattle Feeding Ration, per Head Fed, by Region, United States, 1997/1998.
Ration Mixture
Region Total Ration Grain
Pre-mix, ProteinSupplements,Additives, etc. Silage
Hay andRoughage By-Products Total
Pounds ---------------------------------------------------Percent-----------------------------------------------------
Northeast 5,460 67.5 9.0 12.5 3.0 8.0 100.0
Lake States 4,700 60.0 4.0 30.0 6.0 NR 100.0
Corn Belt 4,700 60.0 4.0 30.0 6.0 NR 100.0
Northern Plains 4,010 71.0 4.5 18.0 6.5 NR 100.0
Southeast 4,730 74.0 5.0 14.0 7.0 NR 100.0
Appalachian 4,080 70.0 5.6 17.7 6.7 NR 100.0
Delta 4,625 70.0 10.0 6.0 14.0 NR 100.0
Southern Plains 3,830 74.0 5.0 14.0 7.0 NR 100.0
Mountain 3,900 72.0 5.0 12.0 7.0 4.0 100.0
Pacific 5,160 60.0 7.0 2.5 8.0 22.5 100.0
Average 4,129 69.6 5.6 16.5 6.6 1.7 100.0NR - none reported.Source: Professional Cattle Feeding Consultants, Weatherford, Oklahoma, and cattle feeding consultants throughout the United States via telephone interviewsduring 1998.

Table 14. Marketing Year Supply and Disappearance for Corn, Barley, Grain Sorghum, and Wheat, United States,1975/1976 and 1996/1997.
Domestic Use
Marketing Year &Grain
Total Supply 1 Food, Alcohol,and Industrial Seed
Feed andResidual Exports
TotalDisappearance Ending Stocks
1975/1976:
Corn 6,400 501 20 3,582 1,664 5,766 633
Barley 484 131 16 186 23 355 128
Grain Sorghum 820 9 2 494 232 737 82
Wheat 2,564 589 100 37 1,173 1,899 666
Total 10,286 1,230 138 4,299 3,092 8,757 1,509
1985/1986:
Corn 10,534 1,133 20 4,114 1,227 6,494 4,040
Barley 844 156 21 319 20 517 327
Grain Sorghum 1,421 26 2 664 178 870 551
Wheat 3,866 674 93 284 909 1,961 1,905
Total 16,665 1,989 136 5,381 2,334 9,842 6,823
1996/1997:
Corn 9,733 1,671 20 5,362 1,795 8,849 883
Barley 532 161 11 220 31 423 109
Grain Sorghum 821 39 1 529 205 774 47
Wheat 2,754 892 103 314 1,001 2,310 444
Total 13,840 2,763 135 6,425 3,032 12,356 1,483 1 Total supply includes beginning stocks, production, and imports.Source: Feed Situation and Outlook Yearbook (1998) and Wheat Yearbook (1998), Economic Research Services, U.S. Department of Agriculture.

106
Table 15. Cattle Feedlot Selling Practices, by Method of Sale, United States, 1994/1995.
Selling Method Head Sold Percent
Liveweight Basis 4,448,388 68.7
Carcass Weight Basis 628,144 9.7
Carcass Weight/Grade Basis 930,235 14.4
Formula Basis 75,435 1.2
Contract Basis 385,789 6.0
Rail Basis 1,100 1
Total 6,469,142 100.0
1 Less than 0.05 percent.Source: Williams, Gary W., et al., 1996. Price Determination in Slaughter Cattle Procurement. Report preparedfor Packers and Stockyard programs, U.S. Department of Agriculture. Data was developed from a survey of 195feedlots throughout the United States.

107
Table 16. Commercial Cattle Slaughter, by State and Region, United States, 1970 to1997.
State and Region 1970 1980 1990 1997
-----------------------------------1,000 Head----------------------------------
Northeast:
New England 164 97 54 35
DE-MD 90 67 45 38
NY 373 242 66 94
NJ 326 124 21 25
PA 746 716 962 973
Sub-Total 1,699 1,246 1,148 1,165
Lake:
MI 665 465 NR 491
WI 1,155 1,148 1,149 1,643
MN 1,654 930 1,045 1,121
Sub-Total 3,474 2,543 2,194 3,255
Corn Belt:
OH 1,066 606 233 160
IN 589 360 109 47
IL 1,349 1,348 NR 1,034
IA 4,322 2,999 1,830 1,049
MO 1,272 700 327 110
Sub-Total 8,598 6,013 2,499 2,400
continued on next page
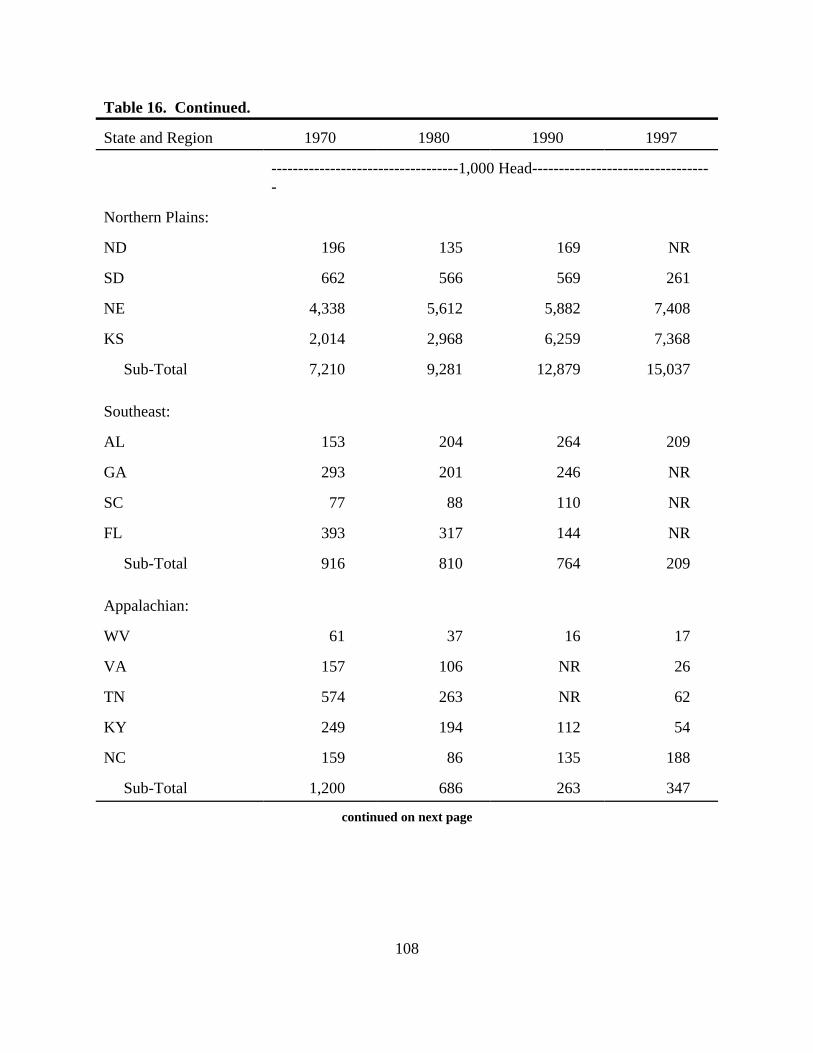
108
Table 16. Continued.
State and Region 1970 1980 1990 1997
-----------------------------------1,000 Head----------------------------------
Northern Plains:
ND 196 135 169 NR
SD 662 566 569 261
NE 4,338 5,612 5,882 7,408
KS 2,014 2,968 6,259 7,368
Sub-Total 7,210 9,281 12,879 15,037
Southeast:
AL 153 204 264 209
GA 293 201 246 NR
SC 77 88 110 NR
FL 393 317 144 NR
Sub-Total 916 810 764 209
Appalachian:
WV 61 37 16 17
VA 157 106 NR 26
TN 574 263 NR 62
KY 249 194 112 54
NC 159 86 135 188
Sub-Total 1,200 686 263 347
continued on next page

109
Table 16. Continued.
State and Region 1970 1980 1990 1997
-----------------------------------1,000 Head----------------------------------
Delta:
AR 180 133 36 31
LA 144 139 40 30
MS 311 206 NR NR
Sub-Total 635 478 76 61
Southern Plains:
OK 648 461 64 46
TX 3,184 5,793 5,681 6,615
Sub-Total 3,832 6,254 5,745 6,661
Mountain:
ID 385 810 641 742
MT 208 156 28 18
WY 31 15 6 6
UT 259 192 477 NR
NV 24 6 1 1
CO 1,975 1,685 2,079 2,595
AZ 509 358 344 471
NM 341 429 135 24
Sub-Total 3,732 3,651 3,711 3,857
continued on next page

110
Table 16. Continued.
State and Region 1970 1980 1990 1997
-----------------------------------1,000 Head----------------------------------
Pacific:
WA 545 687 NR 933
OR 341 137 65 18
CA 2,849 1,972 1,172 1,030
Sub-Total 3,735 2,796 1,237 1,981
States Not Reporting 2,672 1,325
Total 48 States 35,031 33,758 33,188 1 36,298
NR-Not reported1 Totals include states not reporting data on an individual state basis.Source: Livestock Slaughter, NASS, U.S. Department of Agriculture, various issues.
Table 17. Commercial Cattle Slaughter, Average Cattle Slaughter Weight, andCommercial Beef Production, United States, 1970 to 1998.
YearCommercial Cattle
SlaughterAverage Cattle Slaughter
WeightCommercial Beef
Production
1,000 Head Pounds Mil. Pounds
1970 35,031 1,049 21,505
1980 33,758 1,080 21,469
1990 33,188 1,140 22,634
1995 35,639 1,183 25,117
1998 35,471 1,203 25,655
Source: Livestock slaughter, NASS, U.S. Department of Agriculture.

111
Table 18. Composition of Commercial Cattle Slaughter, United States, 1970 to 1997.
Steers and Heifers Cows Bulls and Stags Total
Year Fed Nonfed
-----------------------------------------------Percent-----------------------------------------------
1970 73.5 7.4 17.5 1.6 100.0
1980 71.0 8.1 18.7 2.2 100.0
1990 77.3 3.0 17.8 1.9 100.0
1997 4 75.0 5.0 18.1 1.9 100.0
Source: Livestock and Poultry Situation and Outlook, ERS, U.S. Department of Agriculture. 1997 coefficientswere estimated from Livestock Slaughter and Cattle on Feed, NASS, U.S. Department of Agriculture.
Table 19. Number of Federally Inspected Plants Slaughtering Cattle and HeadSlaughtered, by Size Group, United States, 1980, 1990, and 1997.
1980 1990 1997
Size Group(Head)
Plants(number)
Head(1,000)
Plants(number)
Head(1,000)
Plants(number)
Head(1,000)
Less than 1,000 801 299.7 793 209.0 586 176.4
1,000-9,999 314 960.9 153 521.3 122 376.2
10,000-49,999 147 3,612.5 68 1,677.7 37 1,005.2
50,000-99,999 1 149 27,030.0 29 2,232.5 14 1,017.2
100,000-499,999 44 10,652.2 40 9,721.2
500,000-999,999 2 18 17,020.9 9 5,742.1
1,000,000+ 14 17,972.3
Total 1,411 31,903.1 1,105 32,313.6 822 36,010.7
1 The largest size group reported for 1980 was 50,000+.2 The largest size group reported for 1990 was 500,000+.Source: Livestock Slaughter, SRS-1980, NASS-1990 and 1997, U.S. Department of Agriculture.

112
Table 20. Number of Livestock Slaughter Plants, by Type of Inspection, by State andRegion, United States, 1970 and 1998.
1970 1998
State and RegionFederal
Inspection Other TotalFederal
Inspection Other Total
-----------------------------------------Number----------------------------------------
Northeast:
New England 13 145 158 31 35 66
DE-MD 8 57 65 25 3 28
NY 36 103 139 56 17 73
NJ 11 47 58 16 4 20
PA 26 510 536 138 53 191
Sub-Total 94 862 956 266 112 378
Lake:
MI 10 191 201 39 33 72
WI 21 237 258 18 101 119
MN 17 358 375 34 139 173
Sub-Total 48 786 834 91 273 364
Corn Belt:
OH 39 319 358 15 202 217
IN 14 228 242 11 94 105
IL 35 245 280 26 160 186
IA 41 474 515 25 165 190
MO 22 331 353 59 75 134
Sub-Total 151 1,597 1,748 136 696 832
continued on next page

113
Table 20. Continued.
1970 1998
State and RegionFederal
Inspection Other TotalFederal
Inspection Other Total
-----------------------------------------Number----------------------------------------
Northern Plains:
ND 3 76 79 14 39 53
SD 9 154 163 9 84 93
NE 34 231 265 39 78 117
KS 22 232 254 12 135 147
Sub-Total 68 693 761 74 336 410
Southeast:
AL 7 81 88 8 52 60
GA 6 155 161 18 51 69
SC 2 72 74 5 34 39
FL 8 49 57 30 NR 30
Sub-Total 23 357 380 61 137 198
Appalachian:
WV 1 77 78 5 37 42
VA 19 77 96 13 50 63
TN 15 139 154 27 23 50
KY 13 109 122 29 45 74
NC 11 112 123 20 57 77
Sub-Total 59 514 573 94 212 306
continued on next page

Table 20. Continued.
1970 1998
State and RegionFederal
Inspection Other TotalFederal
Inspection Other Total
-----------------------------------------Number----------------------------------------
Delta:
AR 9 87 96 27 27 54
LA 3 283 286 3 75 78
MS 6 125 131 6 66 72
Sub-Total 18 495 513 36 168 204
Southern Plains:
OK 11 174 185 11 82 93
TX 67 520 587 46 124 170
Sub-Total 78 694 772 57 206 263
Mountain:
ID 10 61 71 17 35 52
MT 6 58 64 14 34 48
WY 2 27 29 1 24 25
UT 9 47 56 8 20 28
NV 1 5 6 4 NR 4
CO 23 59 82 26 23 49
AZ 6 28 34 4 21 25
NM 21 12 33 6 16 22
Sub-Total 78 297 375 80 173 253
continued on next page

115
Table 20. Continued.
1970 1998
State and RegionFederal
Inspection Other TotalFederal
Inspection Other Total
----------------------------------------Number----------------------------------------
Pacific:
WA 25 31 56 13 4 17
OR 14 70 84 15 10 25
CA 69 22 91 31 45 76
Sub-Total 108 123 231 59 59 118
Total 48States
725 6,418 7,143 954 2,372 3,326
Source: Livestock Slaughter, NASS, U.S. Department of Agriculture.
Table 21. Steer and Heifer Slaughter Concentration: 4, 8 and 20 Largest Firms, UnitedStates, 1975 to 1996.
Top 4 Firms Top 8 Firms Top 20 Firms
Year Plants(number)
Concentration 1
(percent)Plants
(number)Concentration1
(percent)Plants
(number)Concentration 1
(percent)
1975 NA 25.3 NA 37.6 NA 53.7
1980 23 35.7 47 51.4 66 64.1
1985 20 50.2 29 63.9 50 78.4
1990 26 71.6 36 82.1 52 91.5
1996 28 80.4 34 87.8 46 96.1
1 Concentration is percentage of total commercial slaughter.NA - Not availableSource: Livestock and Poultry Situation and Outlook, ERS, USDA and Packers and Stockyards Statistical Report,1998, GIPSA, USDA.

116

117
Table 22. Number of Grocery Stores and Sales Volume by Kind of Grocery Store,United States, 1985 and 1995.
Year and Kind of StoreNumber of
StoresPercent of
StoresTotal Store
SalesPercent of Total
Sales
number percent million $ percent
1985:
Supermarkets 1 30,505 19.8 209,820 71.8
Chain Supermarkets 2 17,220 11.2 143,705 49.2
Independents 3 13,285 8.6 66,115 22.6
Convenience Stores 4 45,400 29.5 20,410 7.0
Other Stores 5 78,095 50.7 61,970 21.2
Total Stores 154,000 100.0 292,200 100.0
1995:
Supermarkets 29,800 23.2 311,700 75.6
Chain Supermarkets 18,500 14.5 240,300 58.2
Independents 11,300 8.7 71,400 17.4
Convenience Stores 56,000 43.8 27,300 6.6
Wholesale Club Stores 710 0.6 19,600 4.8
Other Stores 41,490 32.4 53,900 13.0
Total Stores 128,000 100.0 412,500 100.0
1 Annual Sales of $2 million or more.2 An operator of 11 or more retail stores.3 An operator of less than 11 retail stores.4 Compact, drive to stores offering limited line of high convenience items.5 Less than $2 million annual sales.6 Stores with more than 1,500 items, primarily dry goods with some perishables. Low margin and limited service. Source: Progressive Groceries 1987 and 1997 Marketing Guidebook.

118
Table 23. U.S. Restaurant Chains, by Type of Food Service, 1994 1.
Type of Food Service Companies Units
--------------------------------Number---------------------------------
Cafeteria 88 2,372
Dinner House 408 7,232
Fast Food 1,674 146,952
Family Restaurant 1,066 45,324
Food Service Management 192 34,177
In-Store Feeder 38 2,064
Table Cloth 210 969
Total 3,676 239,090
1 A chain restaurant operates 3 or more units.Source: 1995 Directory of Chain Restaurants.

119
Table 24. Type of Menu Offered by Fast Food Restaurant Chains 1, 1994.
Type of Menu Companies Units
--------------------------------Number---------------------------------
Barbecue 66 716
Chicken 293 22,881
Cookies 27 1,707
Donuts 37 4,947
Hamburgers 579 44,237
Hot Dogs 66 2,524
Ice Cream 130 11,802
Pizza 351 34,511
Sandwich 332 25,365
Taco 173 8,716
Yogurt 64 7,393
Total 2,118 164,799
1 A chain restaurant operates 3 or more units.Source: 1995 Directory of Chain Restaurants.

120
Table 25. Per Capita Consumption of Beef and per Capita Disposable Personal Income,United States, 1960 to 1997.
YearPer Capita BeefConsumption
Per Capita DisposableCurrent Dollars
Personal IncomeConstant Dollars (1992)
Retail Pounds ---------------------------Dollars----------------------------
1960 63.4 2,008 8,660
1970 84.6 3,545 12,022
1980 76.6 8,665 14,813
1990 67.8 16,721 17,996
1995 67.4 20,214 18,789
1997 66.9 21,633 19,349
Source: U.S. Department of Agriculture and U.S. Department of Commerce and Survey of Current Business.
Table 26. Per Capita Consumption and Expenditures per Person for Beef, Pork andPoultry, United States, 1970 to 1998.
Beef Pork Poultry
YearPer Capita
Consumption% of
IncomePer Capita
Consumption% of
IncomePer Capita
Consumption% of
Income
Retail lbs. % Retail lbs. % Retail lbs. %
1970 84.6 2.44 55.8 1.22 48.3 0.56
1980 76.6 2.12 57.3 0.93 58.3 0.64
1990 67.8 1.18 49.8 0.65 79.1 0.64
1995 67.4 0.96 49.1 0.51 88.3 0.59
1998 68.1 0.85 52.5 0.54 92.0 0.58
Source: 1995 Read Meats Yearbook, Statistical Bulletin 921, ERS, and Livestock Marketing Information Center,U.S. Department of Agriculture.
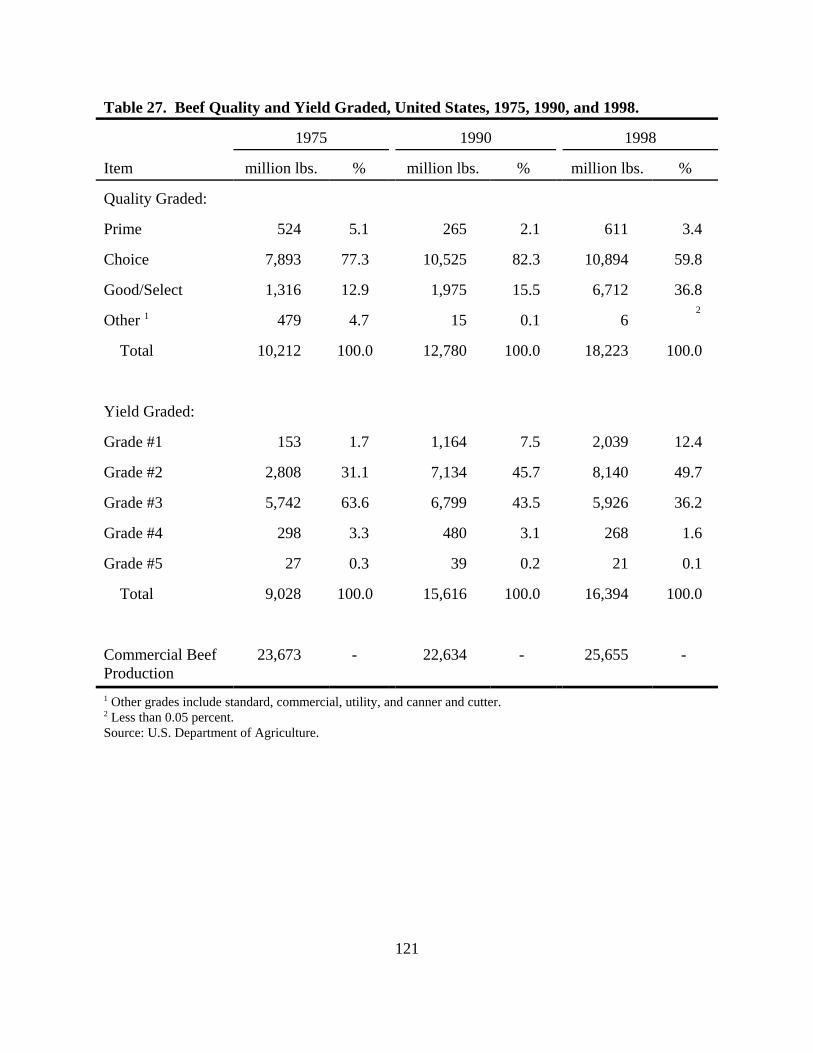
121
Table 27. Beef Quality and Yield Graded, United States, 1975, 1990, and 1998.
1975 1990 1998
Item million lbs. % million lbs. % million lbs. %
Quality Graded:
Prime 524 5.1 265 2.1 611 3.4
Choice 7,893 77.3 10,525 82.3 10,894 59.8
Good/Select 1,316 12.9 1,975 15.5 6,712 36.8
Other 1 479 4.7 15 0.1 6 2
Total 10,212 100.0 12,780 100.0 18,223 100.0
Yield Graded:
Grade #1 153 1.7 1,164 7.5 2,039 12.4
Grade #2 2,808 31.1 7,134 45.7 8,140 49.7
Grade #3 5,742 63.6 6,799 43.5 5,926 36.2
Grade #4 298 3.3 480 3.1 268 1.6
Grade #5 27 0.3 39 0.2 21 0.1
Total 9,028 100.0 15,616 100.0 16,394 100.0
Commercial BeefProduction
23,673 - 22,634 - 25,655 -
1 Other grades include standard, commercial, utility, and canner and cutter.2 Less than 0.05 percent.Source: U.S. Department of Agriculture.

122
Table 28. Cattle Imports and Exports, United States, 1995 to 1998.
Item 1995 1996 1997 1998
---------------------------------Number of Head----------------------------------
Imports:
Mexico 1,653,408 456,246 669,409 720,439
Canada 1,132,691 1,509,136 1,376,814 1,313,476
Over 770 lbs. 1,063,720 1,374,583 1,200,642 1,183,457
440-700 lbs. 14,641 74,293 107,650 47,558
Total 2,786,245 1,965,448 2,046,352 2,033,915
Exports:
Mexico 14,641 115,249 235,121 160,474
Canada 67,442 40,722 41,189 116,762
Other 12,465 18,336 6,034 8,481
Total 94,548 174,307 282,344 277,236
Source: Livestock, Dairy and Poultry Situation and Outlook, NASS, U.S. Department of Agriculture.

123
Table 29. Beef and Veal Imports and Exports, United States, 1995 to 1998.
Item 1995 1996 1997 1998
------------------------------Carcass wt., 1,000 Pounds-------------------------
Imports:
Australia 670,440 544,996 639,420 855,259
New Zealand 579,335 503,657 576,044 593,092
Canada 445,614 585,751 711,454 822,608
Brazil 67,509 86,901 94,766 135,054
Argentina 172,220 153,398 146,657 124,192
Central America 144,511 111,107 93,227 51,793
Other 23,843 86,363 81,371 60,631
Total 2,103,472 2,072,173 2,342,939 2,642,628
Exports:
Japan 1,004,452 1,015,778 1,053,553 1,118,490
Canada 311,982 295,424 282,725 261,210
Mexico 92,302 172,246 312,583 418,857
Korean Republic 272,176 203,796 261,673 153,807
Caribbean 12,360 12,924 12,979 20,111
Other 127,542 178,046 212,165 198,167
Total 1,820,813 1,878,214 2,135,677 2,170,642
Source: Livestock, Dairy and Poultry Situation and Outlook, NASS, U.S. Department of Agriculture.

124
Table 30: Timing of Commercial Introduction of Advancing AnimalTechnologies in the United States.
Technology scenario
TechnologyMore newtechnology
Most likelytechnology
Less newtechnology
Somatotropins Bovine Dairy BeefBeta-agonistsAntibiotic growth promotantsSteroid-like promotants Estrogen/androgen combinations Control/sustained releaseReproductive and embryo transfer Control of ovarian functions Separation of X&Y bearing sperm In vitro fertilization Embryo sexing Cloning and nuclear transfer Gene transferTransgenic for ruminants Hormonally enhanced growth Pharmaceutical production Enhanced-disease resistanceAnimal health rDNA technology Gene deletion Monoclonal antibodies Peptides Immunomodulators
1991199519911990
19901990
199319921990199819932000
200020002000
19911991199119941994
1991199719921990
19901990
19951995199020001995
>2000
>2000 >2000
2000
19931995199519961996
1991200019951990
19901990
199519951990
>2000 1995
>2000
>2000 >2000 >2000
199519951995
>2000 >2000
Source: OTA 1992.

125
Table 31: Animal Production Efficiency in the United States, 1990 and 2000
Beef Cattle Dairy Cattle
Itemkg meat
per kg feedcalves
per 100 cowskg milk
per kg feedkg milk
per cow per year
1990 0.315 90.000 2.227 6.440
2000 Less new technology Most likely technology More new technology
0.3220.3400.373
93.75096.221
102.455
2.2712.3152.331
7,8228,7049,297
Annual rate of change,1990 to 2000 Less new technology Most likely technology More new technology
0.21 0.74 1.68
0.41 0.67 1.30
0.20 0.39 0.46
1.96 3.06 3.74
Source: OTA 1992.