Embed Size (px)
Citation preview
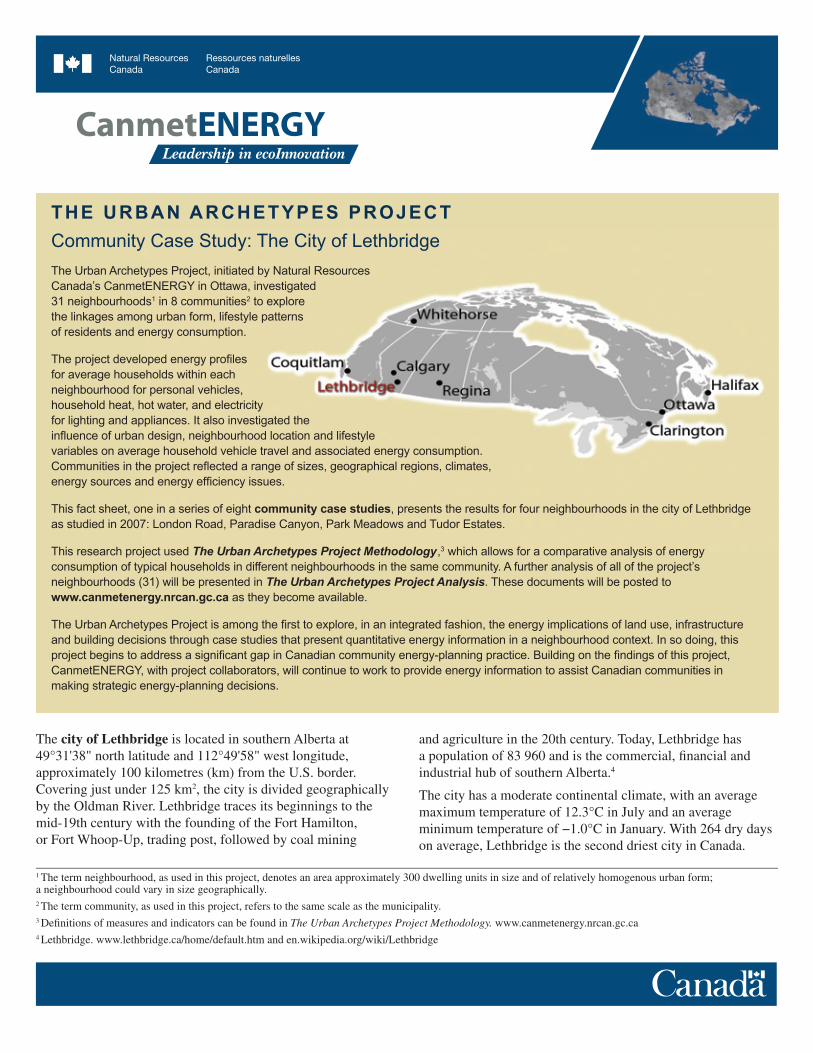
The city of Lethbridge is located in southern Alberta at 49°31'38" north latitude and 112°49'58" west longitude, approximately 100 kilometres (km) from the U.S. border. Covering just under 125 km2, the city is divided geographically by the Oldman River. Lethbridge traces its beginnings to the mid-19th century with the founding of the Fort Hamilton, or Fort Whoop-Up, trading post, followed by coal mining
and agriculture in the 20th century. Today, Lethbridge has a population of 83 960 and is the commercial, fi nancial and industrial hub of southern Alberta.4
The city has a moderate continental climate, with an average maximum temperature of 12.3°C in July and an average minimum temperature of −1.0°C in January. With 264 dry days on average, Lethbridge is the second driest city in Canada.
THE URBAN ARCHETYPES PROJECT
Community Case Study: The City of Lethbridge
1 The term neighbourhood, as used in this project, denotes an area approximately 300 dwelling units in size and of relatively homogenous urban form; a neighbourhood could vary in size geographically. 2 The term community, as used in this project, refers to the same scale as the municipality.3 Defi nitions of measures and indicators can be found in The Urban Archetypes Project Methodology. www.canmetenergy.nrcan.gc.ca4 Lethbridge. www.lethbridge.ca/home/default.htm and en.wikipedia.org/wiki/Lethbridge
The Urban Archetypes Project, initiated by Natural Resources Canada’s CanmetENERGY in Ottawa, investigated 31 neighbourhoods1 in 8 communities2 to explore the linkages among urban form, lifestyle patterns of residents and energy consumption.
The project developed energy profi les for average households within each neighbourhood for personal vehicles, household heat, hot water, and electricity for lighting and appliances. It also investigated the infl uence of urban design, neighbourhood location and lifestyle variables on average household vehicle travel and associated energy consumption. Communities in the project refl ected a range of sizes, geographical regions, climates, energy sources and energy effi ciency issues.
This fact sheet, one in a series of eight community case studies, presents the results for four neighbourhoods in the city of Lethbridge as studied in 2007: London Road, Paradise Canyon, Park Meadows and Tudor Estates.
This research project used The Urban Archetypes Project Methodology,3 which allows for a comparative analysis of energy consumption of typical households in different neighbourhoods in the same community. A further analysis of all of the project’s neighbourhoods (31) will be presented in The Urban Archetypes Project Analysis. These documents will be posted to www.canmetenergy.nrcan.gc.ca as they become available.
The Urban Archetypes Project is among the fi rst to explore, in an integrated fashion, the energy implications of land use, infrastructure and building decisions through case studies that present quantitative energy information in a neighbourhood context. In so doing, this project begins to address a signifi cant gap in Canadian community energy-planning practice. Building on the fi ndings of this project, CanmetENERGY, with project collaborators, will continue to work to provide energy information to assist Canadian communities in making strategic energy-planning decisions.
www.canmetenergy.nrcan.gc.ca2
Urban Archetypes Project Lethbr idge AB CanmetENERGY
NEIGHBOURHOOD DESCRIPTIONS
It is also the second windiest city in the country, due to the average 116 days when wind speeds are 40 km/h or higher. Its high elevation of 929 metres (m) and close proximity to the Rocky Mountains give Lethbridge cooler summers than elsewhere in the Prairies. In contrast, winters in Lethbridge are among the warmest in the region, with strong northwest and southwest winds contributing to chinooks that reduce the frequency and duration of cold periods.
Most houses rely on natural gas for space and water heating, and most electricity is generated by natural gas or coal. In 2006, Lethbridge became a partner in the Southern Alberta Alternative Energy Partnership, which promotes business in the region related to alternative energy, including wind power, solar power and biofuels.
LONDON ROAD PARADISE CANYON
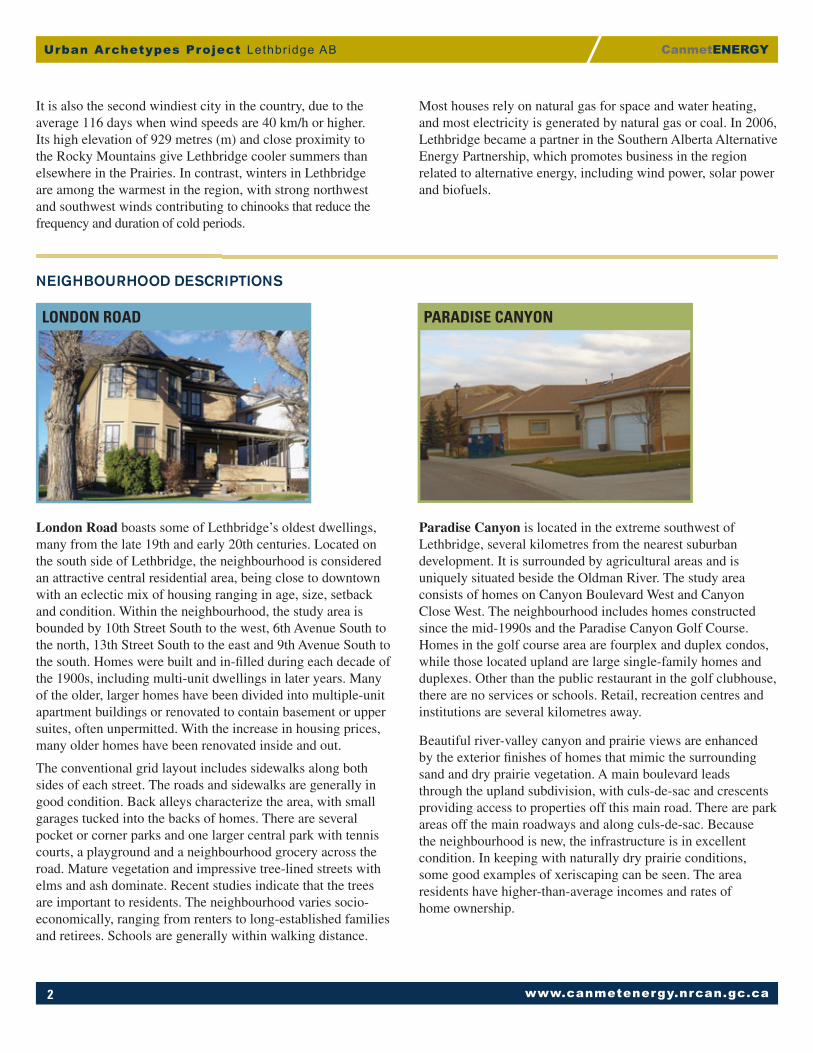
London Road boasts some of Lethbridge’s oldest dwellings, many from the late 19th and early 20th centuries. Located on the south side of Lethbridge, the neighbourhood is considered an attractive central residential area, being close to downtown with an eclectic mix of housing ranging in age, size, setback and condition. Within the neighbourhood, the study area is bounded by 10th Street South to the west, 6th Avenue South to the north, 13th Street South to the east and 9th Avenue South to the south. Homes were built and in-fi lled during each decade of the 1900s, including multi-unit dwellings in later years. Many of the older, larger homes have been divided into multiple-unit apartment buildings or renovated to contain basement or upper suites, often unpermitted. With the increase in housing prices, many older homes have been renovated inside and out.
The conventional grid layout includes sidewalks along both sides of each street. The roads and sidewalks are generally in good condition. Back alleys characterize the area, with small garages tucked into the backs of homes. There are several pocket or corner parks and one larger central park with tennis courts, a playground and a neighbourhood grocery across the road. Mature vegetation and impressive tree-lined streets with elms and ash dominate. Recent studies indicate that the trees are important to residents. The neighbourhood varies socio-economically, ranging from renters to long-established families and retirees. Schools are generally within walking distance.
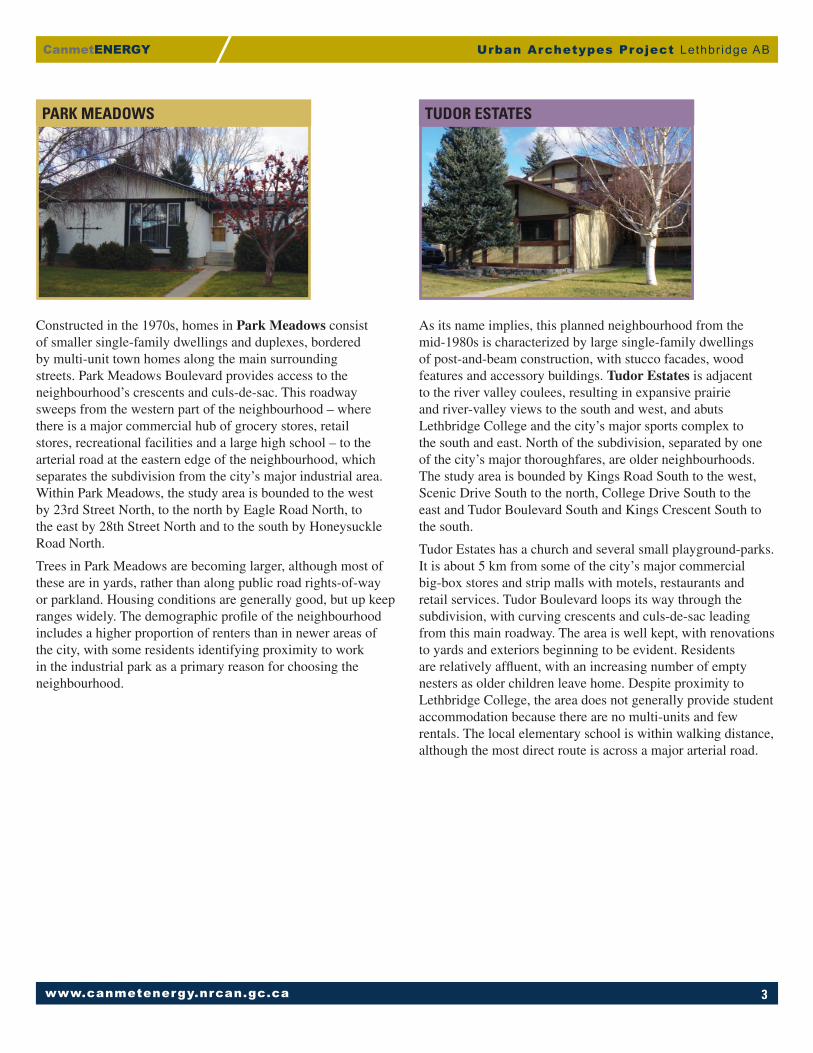
Paradise Canyon is located in the extreme southwest of Lethbridge, several kilometres from the nearest suburban development. It is surrounded by agricultural areas and is uniquely situated beside the Oldman River. The study area consists of homes on Canyon Boulevard West and Canyon Close West. The neighbourhood includes homes constructed since the mid-1990s and the Paradise Canyon Golf Course. Homes in the golf course area are fourplex and duplex condos, while those located upland are large single-family homes and duplexes. Other than the public restaurant in the golf clubhouse, there are no services or schools. Retail, recreation centres and institutions are several kilometres away.
Beautiful river-valley canyon and prairie views are enhanced by the exterior fi nishes of homes that mimic the surrounding sand and dry prairie vegetation. A main boulevard leads through the upland subdivision, with culs-de-sac and crescents providing access to properties off this main road. There are park areas off the main roadways and along culs-de-sac. Because the neighbourhood is new, the infrastructure is in excellent condition. In keeping with naturally dry prairie conditions, some good examples of xeriscaping can be seen. The area residents have higher-than-average incomes and rates of home ownership.
www.canmetenergy.nrcan.gc.ca 3
Urban Archetypes Project Lethbr idge ABCanmetENERGY
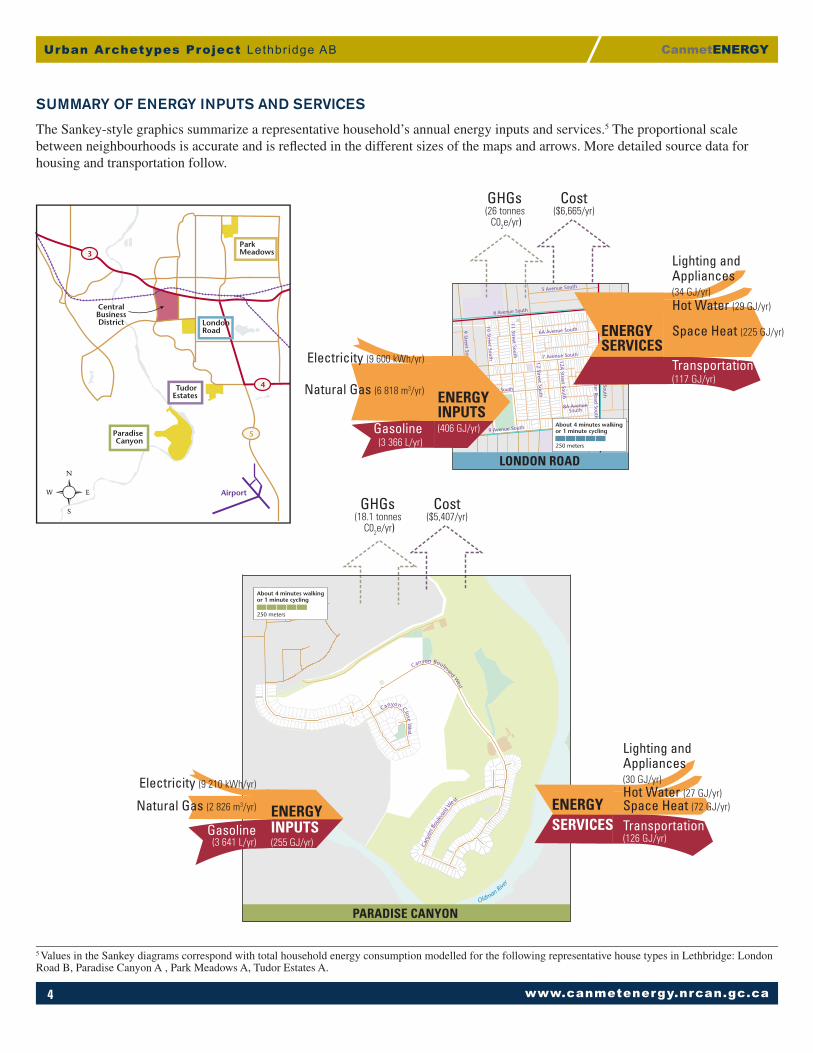
As its name implies, this planned neighbourhood from the mid-1980s is characterized by large single-family dwellings of post-and-beam construction, with stucco facades, wood features and accessory buildings. Tudor Estates is adjacent to the river valley coulees, resulting in expansive prairie and river-valley views to the south and west, and abuts Lethbridge College and the city’s major sports complex to the south and east. North of the subdivision, separated by one of the city’s major thoroughfares, are older neighbourhoods. The study area is bounded by Kings Road South to the west, Scenic Drive South to the north, College Drive South to the east and Tudor Boulevard South and Kings Crescent South to the south.
Tudor Estates has a church and several small playground-parks. It is about 5 km from some of the city’s major commercial big-box stores and strip malls with motels, restaurants and retail services. Tudor Boulevard loops its way through the subdivision, with curving crescents and culs-de-sac leading from this main roadway. The area is well kept, with renovations to yards and exteriors beginning to be evident. Residents are relatively affl uent, with an increasing number of empty nesters as older children leave home. Despite proximity to Lethbridge College, the area does not generally provide student accommodation because there are no multi-units and few rentals. The local elementary school is within walking distance, although the most direct route is across a major arterial road.
Constructed in the 1970s, homes in Park Meadows consist of smaller single-family dwellings and duplexes, bordered by multi-unit town homes along the main surrounding streets. Park Meadows Boulevard provides access to the neighbourhood’s crescents and culs-de-sac. This roadway sweeps from the western part of the neighbourhood – where there is a major commercial hub of grocery stores, retail stores, recreational facilities and a large high school – to the arterial road at the eastern edge of the neighbourhood, which separates the subdivision from the city’s major industrial area. Within Park Meadows, the study area is bounded to the west by 23rd Street North, to the north by Eagle Road North, to the east by 28th Street North and to the south by Honeysuckle Road North.
Trees in Park Meadows are becoming larger, although most of these are in yards, rather than along public road rights-of-way or parkland. Housing conditions are generally good, but up keep ranges widely. The demographic profi le of the neighbourhood includes a higher proportion of renters than in newer areas of the city, with some residents identifying proximity to work in the industrial park as a primary reason for choosing the neighbourhood.
TUDOR ESTATESPARK MEADOWS
www.canmetenergy.nrcan.gc.ca4
Urban Archetypes Project Lethbr idge AB CanmetENERGY
SUMMARY OF ENERGY INPUTS AND SERVICES
13 Street South
Westm
inister Road South
12A Street South
12 Street South
11 Street South
10 Street South
9 Avenue South
8A AvenueSouth
8 Avenue South
9 Street South 7 Avenue South
6A Avenue South
6 Avenue South
14 Street South
5 Avenue South
LONDON ROAD
GHGs (26 tonnes
C02e/yr)
Cost($6,665/yr)
Hot Water (29 GJ/yr)
Lighting and Appliances(34 GJ/yr)
Space Heat (225 GJ/yr)
Transportation (117 GJ/yr)
ENERGY SERVICES
Electricity (9 600 kWh/yr)
Gasoline(3 366 L/yr)
Natural Gas (6 818 m3/yr) ENERGYINPUTS(406 GJ/yr) About 4 minutes walking
or 1 minute cycling
250 meters
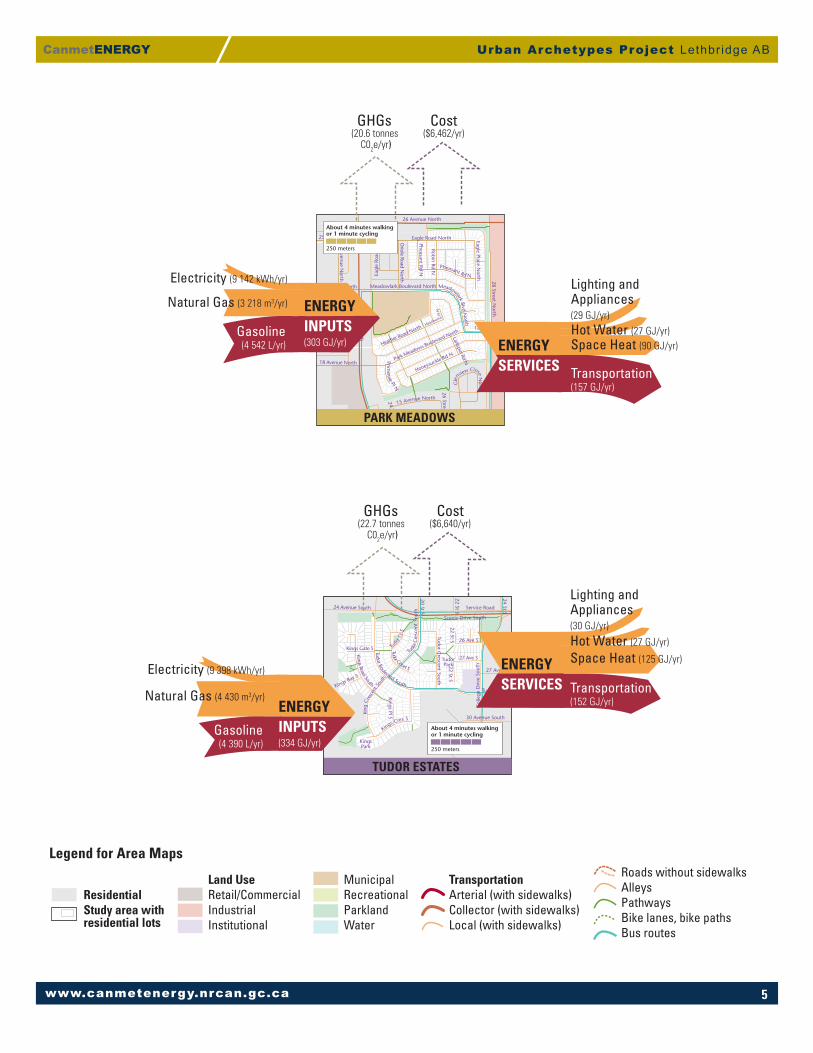
The Sankey-style graphics summarize a representative household’s annual energy inputs and services.5 The proportional scale between neighbourhoods is accurate and is refl ected in the different sizes of the maps and arrows. More detailed source data for housing and transportation follow.
Airport
3
4
5
LondonRoad
ParadiseCanyon
TudorEstates
CentralBusinessDistrict
ParkMeadows
Canyon Close West
Canyon Boulevard West
Can
yon
Boul
evar
d W
est
Oldman Rive
r
PARADISE CANYON
GHGs (18.1 tonnes
C02e/yr)
Cost($5,407/yr)
About 4 minutes walking or 1 minute cycling
250 meters
Electricity (9 210 kWh/yr)
Gasoline(3 641 L/yr)
Natural Gas (2 826 m3/yr) ENERGYINPUTS(255 GJ/yr)
Hot Water (27 GJ/yr)
Lighting and Appliances(30 GJ/yr)
Space Heat (72 GJ/yr)
Transportation (126 GJ/yr)
ENERGY SERVICES
�
5 Values in the Sankey diagrams correspond with total household energy consumption modelled for the following representative house types in Lethbridge: London Road B, Paradise Canyon A , Park Meadows A, Tudor Estates A.
www.canmetenergy.nrcan.gc.ca 5
Urban Archetypes Project Lethbr idge ABCanmetENERGY
Roads without sidewalksAlleysPathways Bike lanes, bike pathsBus routes
ResidentialStudy area with residential lots
Land UseRetail/CommercialIndustrialInstitutional
TransportationArterial (with sidewalks)Collector (with sidewalks)Local (with sidewalks)
Municipal Recreational ParklandWater
Legend for Area Maps
Scenic Drive South
Service Road
22 St S
24 St S
20St
S
22 St S 26 Ave S
Tudor Crescent South
22 St S
27 Ave S
King
Cre
scen
t Sou
th
Tu
dor C
resc
ent
Sout
h
Tudo
r Ct
S
Tudor Boulevard South
Kings Cres S
Kings Pl S
Kings Road South Kings Bay S
Tudor Court S
Kings Gate S
24 Avenue South
27 Ave S
Tudor Blvd S
Col
lege
Driv
e So
uth
30 Avenue South
TUDOR ESTATES
GHGs (22.7 tonnes
C02e/yr)
Cost($6,640/yr)
Electricity (9 398 kWh/yr)
Gasoline(4 390 L/yr)
Natural Gas (4 430 m3/yr)ENERGYINPUTS(334 GJ/yr)
Tudor Park
Kings Park
Hot Water (27 GJ/yr)
Lighting and Appliances(30 GJ/yr)
Space Heat (125 GJ/yr)
Transportation (152 GJ/yr)
ENERGY SERVICES
About 4 minutes walking or 1 minute cycling
250 meters
Meadowlark Boulevard North
26 Avenue North
23 Street North
28 Street North
Eagle Road North
Park Meadows Boulevard North
Honeysuckle Rd N
Heather Road North
Pheasant Rd N
Eagle Place NorthEa
gle
Road
Nor
th
MeadowlarkBlvd
North
Oriole Road N
orth
Robin Rd N
Pheasant Rd N
18 Avenue North
19 Ave N
20 Ave N
21 Ave N
23 Avenue North
Primerose
Pl N
15 Avenue North
26 Street N
24 St N
Larkspur Rd N
Gle
nview Close
North
23 Avenue North
25 Ave N
Hawthorne
PlN
18 Avenue No
PARK MEADOWS
GHGs (20.6 tonnes
C02e/yr)
Cost($6,462/yr)
Electricity (9 142 kWh/yr)
Gasoline(4 542 L/yr)
Natural Gas (3 218 m3/yr) ENERGYINPUTS(303 GJ/yr)
Hot Water (27 GJ/yr)
Lighting and Appliances(29 GJ/yr)
Space Heat (90 GJ/yr)
Transportation (157 GJ/yr)
ENERGY SERVICES
About 4 minutes walking or 1 minute cycling
250 meters
www.canmetenergy.nrcan.gc.ca6
Urban Archetypes Project Lethbr idge AB CanmetENERGY
6 Analysis was derived from ecoENERGY Retrofi t – Homes (formerly EnerGuide for Houses) records within the study areas. A generalized profi le for each representative house type was simulated using HOT2000* software and compared with the regional building archetype. Default values for house temperature and internal gains were used, and occupancy was determined by interview; Parekh, Anil. 2005. “Development of Archetypes of Building Characteristics Libraries for Simplifi ed Energy Use Evaluation of Houses.” Ninth International Building Performance Simulation Association Conference, Montréal.
*HOT2000 is an offi cial mark of Natural Resources Canada.
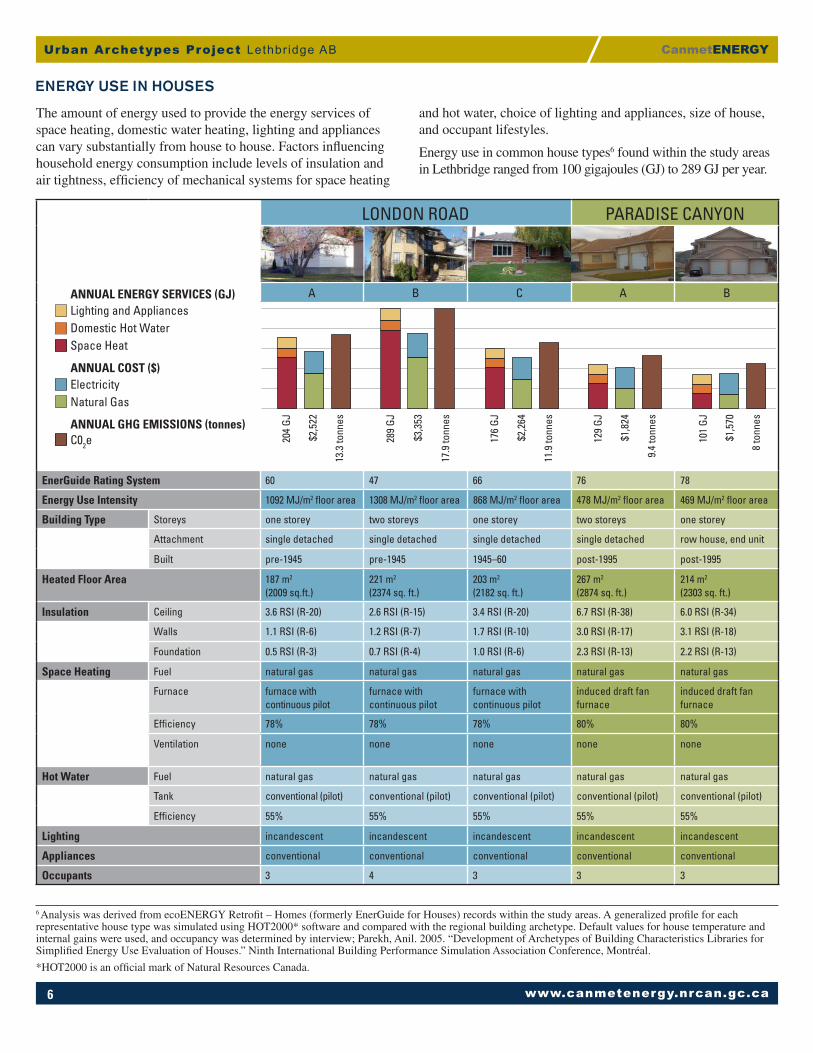
The amount of energy used to provide the energy services of space heating, domestic water heating, lighting and appliances can vary substantially from house to house. Factors infl uencing household energy consumption include levels of insulation and air tightness, effi ciency of mechanical systems for space heating
ENERGY USE IN HOUSES
and hot water, choice of lighting and appliances, size of house, and occupant lifestyles.
Energy use in common house types6 found within the study areas in Lethbridge ranged from 100 gigajoules (GJ) to 289 GJ per year.
LONDON ROAD PARADISE CANYON
A B C A B
EnerGuide Rating System 60 47 66 76 78
Energy Use Intensity 1092 MJ/m2 fl oor area 1308 MJ/m2 fl oor area 868 MJ/m2 fl oor area 478 MJ/m2 fl oor area 469 MJ/m2 fl oor area
Building Type Storeys one storey two storeys one storey two storeys one storey
Attachment single detached single detached single detached single detached row house, end unit
Built pre-1945 pre-1945 1945–60 post-1995 post-1995
Heated Floor Area 187 m2
(2009 sq.ft.)221 m2
(2374 sq. ft.)203 m2
(2182 sq. ft.)267 m2
(2874 sq. ft.)214 m2
(2303 sq. ft.)
Insulation Ceiling 3.6 RSI (R-20) 2.6 RSI (R-15) 3.4 RSI (R-20) 6.7 RSI (R-38) 6.0 RSI (R-34)
Walls 1.1 RSI (R-6) 1.2 RSI (R-7) 1.7 RSI (R-10) 3.0 RSI (R-17) 3.1 RSI (R-18)
Foundation 0.5 RSI (R-3) 0.7 RSI (R-4) 1.0 RSI (R-6) 2.3 RSI (R-13) 2.2 RSI (R-13)
Space Heating Fuel natural gas natural gas natural gas natural gas natural gas
Furnace furnace with continuous pilot
furnace with continuous pilot
furnace with continuous pilot
induced draft fan furnace
induced draft fan furnace
Effi ciency 78% 78% 78% 80% 80%
Ventilation none none none none none
Hot Water Fuel natural gas natural gas natural gas natural gas natural gas
Tank conventional (pilot) conventional (pilot) conventional (pilot) conventional (pilot) conventional (pilot)
Effi ciency 55% 55% 55% 55% 55%
Lighting incandescent incandescent incandescent incandescent incandescent
Appliances conventional conventional conventional conventional conventional
Occupants 3 4 3 3 3
204
GJ
13.3
tonn
es
$2,5
22
289
GJ
17.9
tonn
es
$3,3
53
176
GJ
11.9
tonn
es
$2,2
64
129
GJ
9.4
tonn
es
$1,8
24
101
GJ
8 to
nnes
$1,5
70
Lighting and AppliancesANNUAL ENERGY SERVICES (GJ)
ANNUAL GHG EMISSIONS (tonnes)
ANNUAL COST ($)
Domestic Hot WaterSpace Heat
ElectricityNatural Gas
C02e
www.canmetenergy.nrcan.gc.ca 7
Urban Archetypes Project Lethbr idge ABCanmetENERGY
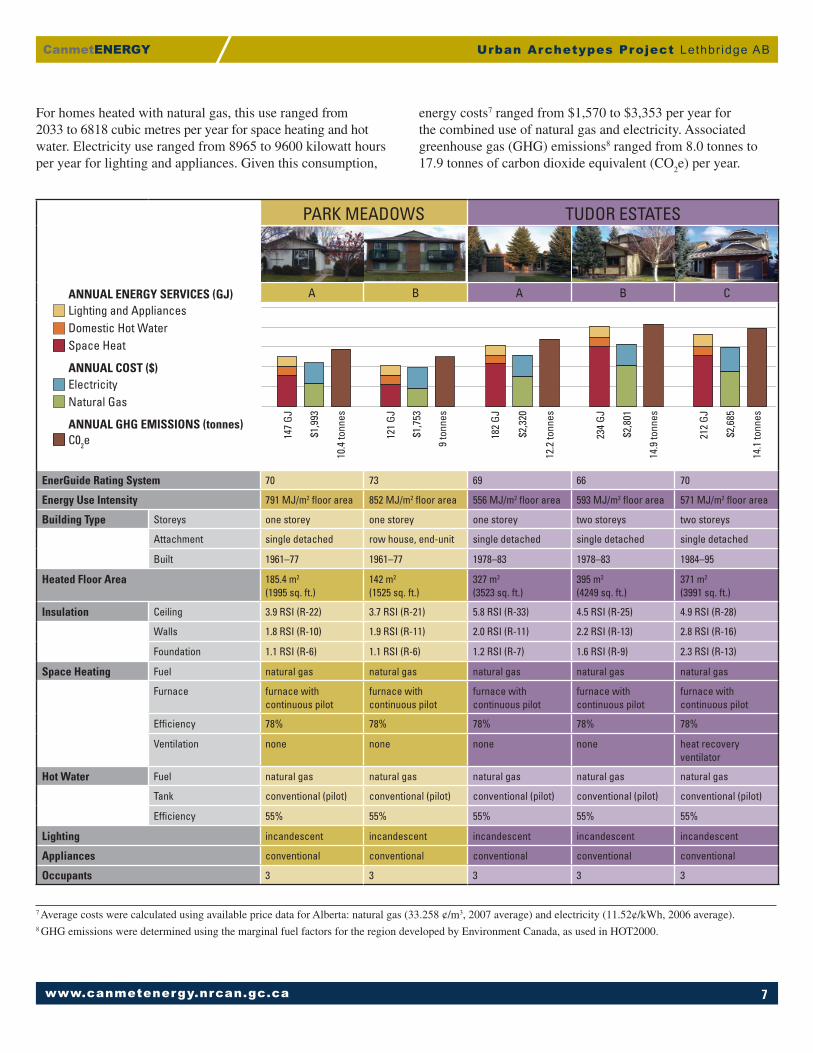
For homes heated with natural gas, this use ranged from 2033 to 6818 cubic metres per year for space heating and hot water. Electricity use ranged from 8965 to 9600 kilowatt hours per year for lighting and appliances. Given this consumption,
energy costs7 ranged from $1,570 to $3,353 per year for the combined use of natural gas and electricity. Associated greenhouse gas (GHG) emissions8 ranged from 8.0 tonnes to 17.9 tonnes of carbon dioxide equivalent (CO
2e) per year.
7 Average costs were calculated using available price data for Alberta: natural gas (33.258 ¢/m3, 2007 average) and electricity (11.52¢/kWh, 2006 average).8 GHG emissions were determined using the marginal fuel factors for the region developed by Environment Canada, as used in HOT2000.
PARK MEADOWS TUDOR ESTATES
A B A B C
EnerGuide Rating System 70 73 69 66 70
Energy Use Intensity 791 MJ/m2 fl oor area 852 MJ/m2 fl oor area 556 MJ/m2 fl oor area 593 MJ/m2 fl oor area 571 MJ/m2 fl oor area
Building Type Storeys one storey one storey one storey two storeys two storeys
Attachment single detached row house, end-unit single detached single detached single detached
Built 1961–77 1961–77 1978–83 1978–83 1984–95
Heated Floor Area 185.4 m2
(1995 sq. ft.)142 m2
(1525 sq. ft.)327 m2
(3523 sq. ft.)395 m2
(4249 sq. ft.)371 m2
(3991 sq. ft.)
Insulation Ceiling 3.9 RSI (R-22) 3.7 RSI (R-21) 5.8 RSI (R-33) 4.5 RSI (R-25) 4.9 RSI (R-28)
Walls 1.8 RSI (R-10) 1.9 RSI (R-11) 2.0 RSI (R-11) 2.2 RSI (R-13) 2.8 RSI (R-16)
Foundation 1.1 RSI (R-6) 1.1 RSI (R-6) 1.2 RSI (R-7) 1.6 RSI (R-9) 2.3 RSI (R-13)
Space Heating Fuel natural gas natural gas natural gas natural gas natural gas
Furnace furnace with continuous pilot
furnace with continuous pilot
furnace with continuous pilot
furnace with continuous pilot
furnace with continuous pilot
Effi ciency 78% 78% 78% 78% 78%
Ventilation none none none none heat recovery ventilator
Hot Water Fuel natural gas natural gas natural gas natural gas natural gas
Tank conventional (pilot) conventional (pilot) conventional (pilot) conventional (pilot) conventional (pilot)
Effi ciency 55% 55% 55% 55% 55%
Lighting incandescent incandescent incandescent incandescent incandescent
Appliances conventional conventional conventional conventional conventional
Occupants 3 3 3 3 3
182
GJ
12.2
tonn
es
$2,3
20
234
GJ
14.9
tonn
es
$2,8
01
212
GJ
14.1
tonn
es
$2,6
85
147
GJ
10.4
tonn
es
$1,9
93
121
GJ
9 to
nnes
$1,7
53
Lighting and AppliancesANNUAL ENERGY SERVICES (GJ)
ANNUAL GHG EMISSIONS (tonnes)
ANNUAL COST ($)
Domestic Hot WaterSpace Heat
ElectricityNatural Gas
C02e
www.canmetenergy.nrcan.gc.ca8
Urban Archetypes Project Lethbr idge AB CanmetENERGY
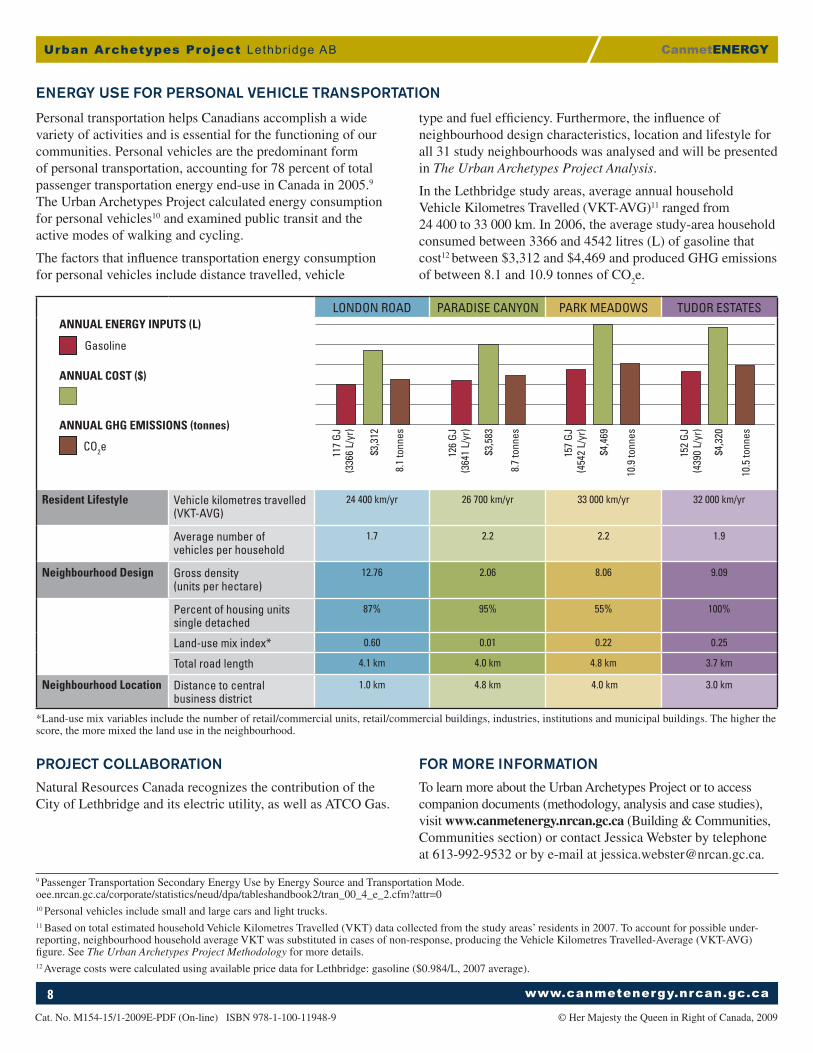
Personal transportation helps Canadians accomplish a wide variety of activities and is essential for the functioning of our communities. Personal vehicles are the predominant form of personal transportation, accounting for 78 percent of total passenger transportation energy end-use in Canada in 2005.9
The Urban Archetypes Project calculated energy consumption for personal vehicles10 and examined public transit and the active modes of walking and cycling.
The factors that infl uence transportation energy consumption for personal vehicles include distance travelled, vehicle
ENERGY USE FOR PERSONAL VEHICLE TRANSPORTATION
type and fuel effi ciency. Furthermore, the infl uence of neighbourhood design characteristics, location and lifestyle for all 31 study neighbourhoods was analysed and will be presented in The Urban Archetypes Project Analysis.
In the Lethbridge study areas, average annual household Vehicle Kilometres Travelled (VKT-AVG)11 ranged from 24 400 to 33 000 km. In 2006, the average study-area household consumed between 3366 and 4542 litres (L) of gasoline that cost12 between $3,312 and $4,469 and produced GHG emissions of between 8.1 and 10.9 tonnes of CO
2e.
PROJECT COLLABORATION
Natural Resources Canada recognizes the contribution of the City of Lethbridge and its electric utility, as well as ATCO Gas.
9 Passenger Transportation Secondary Energy Use by Energy Source and Transportation Mode.oee.nrcan.gc.ca/corporate/statistics/neud/dpa/tableshandbook2/tran_00_4_e_2.cfm?attr=010 Personal vehicles include small and large cars and light trucks. 11 Based on total estimated household Vehicle Kilometres Travelled (VKT) data collected from the study areas’ residents in 2007. To account for possible under-reporting, neighbourhood household average VKT was substituted in cases of non-response, producing the Vehicle Kilometres Travelled-Average (VKT-AVG) fi gure. See The Urban Archetypes Project Methodology for more details.12 Average costs were calculated using available price data for Lethbridge: gasoline ($0.984/L, 2007 average).
FOR MORE INFORMATION
To learn more about the Urban Archetypes Project or to accesscompanion documents (methodology, analysis and case studies),visit www.canmetenergy.nrcan.gc.ca (Building & Communities, Communities section) or contact Jessica Webster by telephone at 613-992-9532 or by e-mail at [email protected].
Cat. No. M154-15/1-2009E-PDF (On-line) ISBN 978-1-100-11948-9 © Her Majesty the Queen in Right of Canada, 2009
*Land-use mix variables include the number of retail/commercial units, retail/commercial buildings, industries, institutions and municipal buildings. The higher the score, the more mixed the land use in the neighbourhood.
LONDON ROAD PARADISE CANYON PARK MEADOWS TUDOR ESTATES
Resident Lifestyle Vehicle kilometres travelled (VKT-AVG)
24 400 km/yr 26 700 km/yr 33 000 km/yr 32 000 km/yr
Average number of vehicles per household
1.7 2.2 2.2 1.9
Neighbourhood Design Gross density(units per hectare)
12.76 2.06 8.06 9.09
Percent of housing units single detached
87% 95% 55% 100%
Land-use mix index* 0.60 0.01 0.22 0.25
Total road length 4.1 km 4.0 km 4.8 km 3.7 km
Neighbourhood Location Distance to central business district
1.0 km 4.8 km 4.0 km 3.0 km
117
GJ(3
366
L/yr
)
8.1
tonn
es
$3,3
12
126
GJ(3
641
L/yr
)
8.7
tonn
es
$3,5
83
152
GJ(4
390
L/yr
)
10.5
tonn
es
$4,3
20
157
GJ(4
542
L/yr
)
10.9
tonn
es
$4,4
69
ANNUAL COST ($)
ANNUAL ENERGY INPUTS (L)
Gasoline
ANNUAL GHG EMISSIONS (tonnes)
CO2e