Embed Size (px)
Citation preview

STUDY – FWC B4/ENTR/08/006
in collaboration with
THE UPTAKE OF GREEN PUBLIC
PROCUREMENT IN THE EU27
Submitted to the European Commission,
DG Environment
Prepared by:
Centre for European Policy Studies (CEPS)
Andrea Renda, Jacques Pelkmans, Christian Egenhofer, Lorna Schrefler, Giacomo
Luchetta, Can Selçuki
College of Europe (core team)
Jesus Ballesteros, Anne-Claire Zirnhelt
Brussels, 29 February 2012
© European Union, 2012. All rights reserved. Reproduction is authorised provided the source is acknowledged.
The contents and views contained in this report are those of the authors, and do not necessarily represent those
of the European Commission.

STUDY – FWC B4/ENTR/08/006
TABLE OF CONTENTS
EXECUTIVE SUMMARY ............................................................... I
INTRODUCTION ...................................................................... 23
1.1 Purpose and structure of the report ........................................................... 26
2 METHODOLOGY ................................................................. 28
2.1 The questionnaire used ............................................................................... 28
2.2 Accuracy and representativeness ................................................................ 30
2.2.1 Accuracy: balancing the level of detail with the response rate ............. 30
2.2.2 Representativeness of the sample ......................................................... 31
3 DISCUSSION OF EMPIRICAL FINDINGS ................................... 34
3.1 The majority of respondents include an environmental
component in their procurement ................................................................ 34
3.2 Most authorities “often” use green requirements when procuring
goods or services ......................................................................................... 35
3.3 Perceptions regarding the difficulty of including green criteria
vary across the EU27 ................................................................................... 36
3.4 Purchasing price remains the predominant criterion to evaluate
contracts .......................................................................................................37
3.5 More than 50% of public authorities use at least one EU core GPP
criterion when procuring ............................................................................ 39
3.6 GPP uptake in the EU27: still a very fragmented picture .......................... 40
3.7 Summary of uptake of individual EU core GPP criteria ............................. 44
3.8 Green criteria are frequently included in the technical
specifications of contracts ........................................................................... 46
4 CONCLUDING REMARKS AND POLICY SUGGESTIONS ................. 48
ANNEX A- COMPARISON WITH OTHER STUDIES
ANNEX B- RESULTS BY PRODUCT GROUP
ANNEX C- COUNTRY FICHES
ANNEX D- BIBLIOGRAPHY
ANNEX E- QUESTIONNAIRE
ANNEX F- SURVEYED EU CORE GPP CRITERIA BY PRODUCT GROUP

STUDY – FWC B4/ENTR/08/006
LIST OF TABLES
Table 1 – Level of precision of our results, per Member State ................................ 33
Table 2 – Prevalent award criterion for selected Member States ........................... 39
Table 3 – Stages of procurement cycle where green criteria are applied
and available guidance (2010) .................................................................... 44
LIST OF FIGURES
Figure 1 – Is there an environmental component to your organization’s
procurement policy? ........................................................................................... 35 Figure 2 – Inclusion of “green” requirements in procurement procedures............. 36 Figure 3 – Perceived level of difficulty of including green criteria in public
procurement ........................................................................................................ 37 Figure 4 – Use of life cycle costing (LCC), total cost of ownership (TCO) and
purchasing cost ................................................................................................... 38 Figure 5 – Inclusion of EU GPP criteria in individual contracts .............................. 40 Figure 6 – Uptake of EU GPP in the EU27 (last contracts by number)* ................. 41 Figure 7- Uptake of GPP in the EU27 (share of all contracts in 2009-2010 – by
value)* ................................................................................................................. 42 Figure 8 – Level of uptake of individual EU core GPP criteria for all 10 product
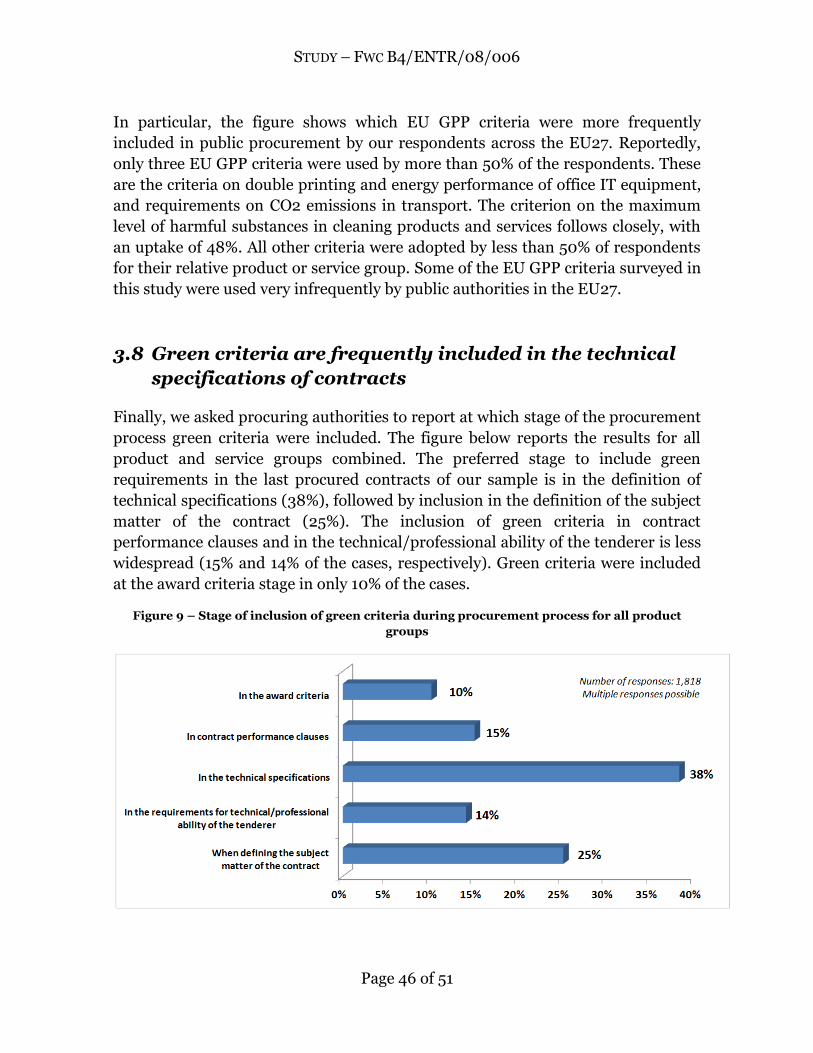
groups .................................................................................................................. 45 Figure 9 – Stage of inclusion of green criteria during procurement process for all
product groups .................................................................................................... 46

STUDY – FWC B4/ENTR/08/006
List of abbreviations
AT: Austria
BE: Belgium
BG: Bulgaria
CY: Cyprus
CZ: Czech Republic
DE: Germany
DK: Denmark
EE: Estonia
ES: Spain
EU: European Union
FI: Finland
FR: France
GDP: Gross Domestic Product
GPP: Green Public Procurement
GR: Greece
HU: Hungary
IE: Ireland
IT: Italy
LCC: Life Cycle Costing
LT: Lithuania
LU: Luxembourg
LV: Latvia
MT: Malta
NL: Netherlands
PL: Poland
PT: Portugal
RO: Romania
SCP/SIP: Sustainable Consumption and Production and Sustainable Industrial
Policy
SE: Sweden
SI: Slovenia
SK: Slovakia
TCO: Total Cost of Ownership
TED: Tenders Electronic Daily
UK: United Kingdom

STUDY – FWC B4/ENTR/08/006
MAIN FINDINGS
1. The uptake of EU core Green Public Procurement (GPP) criteria in the EU27 is significant. Our survey on the procurement of ten product/service groups shows that 26% of the last contracts signed by public authorities in the EU27 included all EU core GPP criteria. In addition, 55% of these contracts included at least one EU core GPP criterion.
2. The uptake of EU core GPP criteria is on the increase. The percentage of last contracts that included at least one EU core GPP criterion (55%) is much higher than the percentage of contracts signed in 2009-2010 containing some form of GPP criteria, be they EU, national, regional, local or other ones (29%). This suggests that GPP uptake is increasing.
3. In terms of value of procurement, GPP uptake appears very significant. Besides asking information about last contracts signed, we also collected information on a total of 236,752 contracts signed by public authorities in 2009-2010, for a value of 117.5 billion Euros. Results show that 38% of the total value procured included GPP criteria, be they EU, national, regional, local or other ones.
4. The uptake of EU GPP criteria varies significantly across the EU27. There are four top performing countries, in which EU core GPP criteria were applied in 40%-60% of the last contracts signed by public authorities. On the other hand, there are as many as twelve countries where this occurred in less than 20% of the last contracts.
5. The uptake of EU core GPP criteria does not vary only across countries, but also across product groups. For one of the ten product groups considered, over 50% of the contracts respond to EU core GPP criteria, thus meeting the target set at the EU level. Yet, four product groups still lag significantly behind with an uptake level below 20%.
6. A few individual EU core GPP criteria are very frequently used. Out of a total of 24 EU core GPP criteria considered, only three were used by more than 50% of the respondents in the last contracts they signed to procure the related product. Conversely, four of these criteria were used by less than 20% of the respondents.
7. Life Cycle Costing (LCC) and Total Cost of Ownership (TCO) methods are not frequently used by public authorities. The most commonly used criterion is still the purchasing cost (64%), followed by a mix of the latter and LCC or TCO (30%); and finally, by the predominant use of LCC/TCO (6%).
8. Many authorities face difficulties in including GPP criteria in public procurement. On a 1 to 5 scale, the average level of perceived difficulty among all respondents is 3.06. Independent regulators and central government respondents reported the highest levels of perceived difficulty.

STUDY – FWC B4/ENTR/08/006
i
THE UPTAKE OF GREEN PUBLIC
PROCUREMENT IN THE EU27
EXECUTIVE SUMMARY
uring the past decade, the role of governments and public institutions in
the achievement of public policy goals has been thoroughly reconsidered.
In particular, there is an increasing awareness of the fact that sustainability
goals such as the production and consumption of environmentally friendly
products and services can be promoted not only by regulation, but also by
including environmental considerations in the daily activities of government as a
purchaser of products and services. Since public procurement accounted for
approximately 19.9% of the EU Gross Domestic Product (GDP), encouraging the
use of “green” criteria in public procurement is a very important way to stimulate
markets to produce and sell greener products.1 Accordingly, the Europe 2020
strategy mentions the need to encourage “wider use of green public procurement”
within the context of the flagship initiative on a “Resource-efficient Europe”2. At
the same time, stimulating GPP might also mean contributing significantly to
smart growth by encouraging the development of environmental and climate-
friendly technologies.
EU institutions have emphasized the importance of GPP since 2001, when the
Commission adopted an Interpretative Communication on the “Community law
applicable to public procurement and the possibilities for integrating
environmental considerations into public procurement” (COM(2001) 274), which
was the first to explain how environmental concerns may be taken into account at
each separate stage of the contract award process in public procurement. Later on,
in 2004, the Council and the European Parliament adopted two directives on
public procurement3 containing specific reference to the possibility of including
1 Data for 2009 reported in the EU Annual Growth Survey 2012, COM(2011) 815 final, Brussels, 23.11.2011.
2 See Communication from the Commission, Europe2020. A strategy for smart, sustainable and inclusive growth, Brussels, 3.3.2010, COM(2010) 2020 final, at 15.
3 Directive 2004/18/EC covers public works contracts, public supply contracts and public service contracts. Directive 2004/17/EC covers the procurement procedures of entities operating in the water, energy, transport and postal services sectors.
D

STUDY – FWC B4/ENTR/08/006
ii
environmental considerations as specific provisions on the inclusion of
environmental requirements in technical specifications (Article 23(3)b); the use of
eco-labels (Article 23(6)); setting social and environmental conditions for the
performance of contracts (Article 26); requiring economic operators to
demonstrate they have met their environmental obligations (Article 27); requiring
economic operators to demonstrate they can perform a contract in accordance with
environmental management measures (Articles 48(2)f and 50); and applying
award criteria based on environmental characteristics (Article 53).
Following the 2008 Communication “Public Procurement for a Better
Environment”4 which accompanied the Sustainable Consumption and Production
and Sustainable Industrial Policy Action Plan,5 the European Commission has
developed common GPP criteria for a number of product and service groups,
inviting authorities to include these criteria into their tendering procedures and
thus to purchase greener products, works and services. These common criteria
should also lead to a more harmonised use of green criteria in procurement
procedures throughout the EU. More specifically, the Commission initially
identified 10 product and service groups, and proposed a first set of “core” criteria
to foster GPP uptake by procuring authorities. The ten selected product groups are:
cleaning products and services; construction; electricity; catering services and food
products; gardening services and products; office IT equipment; copying and
graphic paper; textiles; transport; and furniture.6
4 COM(2008)400. The Communication defines Green Public Procurement (GPP) as “a process whereby public authorities seek to procure goods, services and works with a reduced environmental impact throughout their life cycle when compared to goods, services and works with the same primary function that would otherwise be procured.”
The text of the Communication is available at: http://eurlex.europa.eu/LexUriServ/LexUriServ.do?uri=COM:2008:0400:FIN:EN:PDF. For further details, see also the dedicated website of the European Commission, Directorate General for Environment: http://ec.europa.eu/environment/gpp/what_en.htm
5 COM (2008) 397. The text of the Action Plan is available at: http://eur-lex.europa.eu/LexUriServ/LexUriServ.do?uri=COM:2008:0397:FIN:EN:PDF
6 At the time of writing, the European Commission had expanded the initial list to 19 EU GPP criteria sets. The complete list of criteria is available at: http://ec.europa.eu/environment/gpp/eu_gpp_criteria_en.htm.

STUDY – FWC B4/ENTR/08/006
iii
For each of those product groups, the Commission has set:
“Core criteria” – i.e., criteria suitable for use by any contracting authority
across the EU, which address key environmental impacts and are designed to be
used with minimum additional verification efforts or cost increases.
“Comprehensive criteria”, aimed at contracting authorities who wish to
purchase the best environmental products available on the market. These
criteria may require additional verification efforts or a slight increase in cost
compared to other products with the same functionality.
The European Commission has set the objective to achieve a 50% uptake of “core”
GPP criteria by 2010, and announced the intention to monitor this uptake. This
study by the Centre for European Policy Studies (CEPS) and the College of Europe
(CoE) is part of this monitoring exercise. In other words, it aims at measuring the
level of uptake of EU core GPP criteria by procuring authorities in the EU27.
We obtained our results through a targeted survey of contracting authorities in the
27 Member States of the European Union. Specifically, we developed and widely
disseminated a questionnaire, in which public authorities were asked whether and
to what extent they make use of “any form of green” criteria when procuring the
selected products and services; and how often and for which of the ten
abovementioned product groups they used specific GPP criteria from the EU GPP
criteria set.
The questionnaire asked respondents to give specific information on the last
contract signed for each of the ten product groups, plus information on all
contracts signed in the period between 2009 and 2010. We assumed that the most
recent contract gives the most up-to-date information on GPP practices. Moreover,
some product groups (e.g. electricity) will not be procured more than once every
two years by one authority, so in these cases, the last contract also represents "all
contracts" in this product group for the period 2009-2010. In order to verify if the
last contract was not an outlier, the information provided on the last contract was
complemented by the information given by respondents on all contracts signed in
2009 and 2010 for a given product group.
Overall, 18,517 questionnaires were sent to unique contact points of public
authorities across the EU27. Our final sample consists of a total of 1,783 individual
contracts, amounting to a little over 6 billion Euros in terms of procured value. The

STUDY – FWC B4/ENTR/08/006
iv
general information collected on all contracts in 2009-2010 reported on a total of
236,752 contracts worth over 117.5 billion Euros7. We received 856 (usable)
responses, which corresponds to a response rate of 4%. Figure A below shows the
number of individual contracts analyzed per country (in red), as well as the total
number of contacts per country covered by our survey (Luxembourg is not included
in our results, as we have received no response from the local authorities, despite
repeated attempts).8
Figure A – Responses per country and individual contracts
The low response rate in some cases, such as in the Netherlands, can be explained
by the recent conduct of a survey on GPP at the national level, which may have led
to a certain “consultation fatigue” among respondents. Another reason for varying
response rates is the difference in the degree of GPP awareness among different
Member States. Finally, the response rate has been low in some countries that
recently experienced severe cuts in the public sector.
In our survey of GPP uptake in the EU27, we have decided to collect information by
distinguishing between type of authority and level of government, to offer a more
in-depth view of the patterns of uptake among different types of procurers. Figure
B provides a breakdown of our sample in terms of type of authorities. As shown in
the figure, central and local government authorities are the most numerous in our
7 We have decided to include both data from 2009 and 2010 in our survey. This is dictated by the need to build the most comprehensive picture of the uptake of GPP among public institutions in the EU27. In particular, procurers that have tendered large contracts in 2009 might not replicate the same purchase for 2010: asking for information related to 2010 only would not take these 2009 contracts into account.
8 Country codes follow the Eurostat denomination. For a complete list of country codes, see the list of abbreviations in the beginning of the study.

STUDY – FWC B4/ENTR/08/006
v
sample, each accounting for one third of the total number of authorities that
responded to our survey.
Figure B – Percentage of responses by type of authority
Figure C below shows that, today, most public authorities in Member States include
an environmental component in their procurement processes. From this
standpoint, regional and local government authorities appear as the strongest
performers in our sample: 67% reportedly include a “green” component in their
procurement policy, against 60% of central government authorities. To the
contrary, 49% of independent regulators include an environmental component in
their contracts.
These results are broadly consistent with the findings of a previous study for the
European Commission completed by PricewaterhouseCoopers (PWC) in 2009,
which looked only at the seven Member States considered - at the time - as the
most advanced in GPP uptake (i.e., Austria, Denmark, Finland, Germany, the
Netherlands, Sweden, and the UK). In the PWC study, on average, 71% of
authorities in these countries reported to have an environmental component in
their public procurement, with local authorities outperforming central ones
(percentages of 72% and 67% respectively).

STUDY – FWC B4/ENTR/08/006
vi
C – Authorities having an “environmental component” and using core criteria in
procurement
In what follows, we show the overall level of GPP uptake measured in different
ways. The figures reported can be considered as our “answer” to the main research
and policy question underpinning the present study: namely, whether the level of
EU GPP uptake has reached the target set by the European Commission in 2008 –
that 50% of procurement for the selected ten product/service groups comply with
the EU “core” GPP criteria by 2010. Overall, our conclusion is that public
authorities in the EU 27 have gone a long way towards improving the “greenness”
of their public procurement practice. However, for many product and service
groups, considerable improvements are still needed to reach the 50% target.

STUDY – FWC B4/ENTR/08/006
vii
FINDING #1
The Uptake of EU core GPP criteria in the EU27 is significant.
An individual contract is considered “green” by our study only if it includes all the
surveyed EU “core” green criteria. According to the information provided by the
respondents on the last contract signed, 26% of the total number of these contracts
is “green”. Although significant, such level of uptake is well below the 50% uptake
target. However, considering the difficulty of including all “core” green criteria for a
product/service group, a 26% uptake should be seen as a conservative estimate and
a lower bound for the overall level of EU GPP uptake. Moreover, 55% of the last
contracts included at least one of the surveyed EU core criteria.
FINDING # 2
The uptake of EU core GPP criteria is on the increase.
The percentage of last contracts that included at least one EU core GPP criterion
(55%) is much higher than the percentage of contracts signed in 2009-2010 that
contained some form of GPP criteria, be they EU, national, regional, local or other
ones (29%). This suggests that GPP uptake is increasing.
FINDING #3
In terms of value of procurement, GPP uptake appears very significant.
Based on the information provided by respondents on all contracts signed in 2009-
2010, 38% of the total value procured included some form of GPP criteria. This
figure further confirms the significant level of uptake reported in last contracts (i.e.,
26%). These results are based on the analysis of the self-reporting by public
authorities on 236,752 contracts for an overall value of approximately 117.5 billion
Euros. Instead, the up-take of EU GPP criteria, by monetary value, in the last
contracts signed for each product group is 19%. However, as explained in the main
report (Section 2), this figure does not constitute an accurate estimate of the actual
up-take level as it may include outliers that do not necessarily represent the overall
procurement trend of the responding public authority.

STUDY – FWC B4/ENTR/08/006
viii
FINDING #4
The uptake of EU GPP criteria varies significantly across the EU27
Figure D shows the overall level of EU GPP uptake for all ten product/service
groups in the EU27.9 The different shades of green in the figure portray a very
fragmented picture of the EU27, with four top performers (Belgium, Denmark, the
Netherlands, and Sweden), followed by a second group of countries reporting a
level of uptake between 20% and 40% for the selected 10 product and service
groups. It must however be borne in mind that for some countries, due to the low
response rate, these results must be read with caution.
Overall, the level of EU GPP uptake in the EU27 appears lower than the 50% target
set by the European Commission in 2008. As many as twelve countries – i.e.
Portugal, Ireland, Poland, the Czech Republic, Finland, Slovenia, Hungary,
Romania, Bulgaria, Greece, Latvia and Estonia – feature a level of EU GPP uptake
that is below 20%. As mentioned, Luxembourg (in grey in the figure) could not be
included in our analysis due to the fact that we received no responses to our survey.
Figure E instead shows the total value of procurement including GPP criteria for
the ten product/service groups in all contracts signed in 2009 and 2010. In total, 7
countries have a level of uptake of 50% or more. The top performer and the only
country with an uptake above 80% is Finland, followed by 4 countries (the
Netherlands, Latvia, Hungary, and Lithuania) that have an uptake between 60%
and 80%. Italy, Austria, Belgium, and Romania display an uptake between 40%
and 60%, with the former two reaching a level equal to or higher than 50%. Finally,
6 countries perform between 20% and 40% (Slovenia, Denmark, Sweden,
Germany, Spain and the Czech Republic) followed by 11 countries with a level of
uptake below 20% (Bulgaria, Cyprus, Poland, Greece, Slovakia, France, Estonia,
Malta, the United Kingdom, Ireland and Portugal).
There are several reasons for this fragmentation, including the fact that certain
countries have adopted National Action Plans several years ago and feature a more
9 As mentioned, the level of uptake refers to the percentage of individual contracts that included all core green criteria set at the EU level. It is worth stressing that some countries and public authorities are using their own set of green procurement criteria. These are often very similar to those established at the EU level and described above, while in other instances the overlap is only partial. This is why measuring the actual uptake of the EU GPP criteria remains a challenging exercise, as already shown in previous studies on the subject (Adelphi 2011; PwC 2009).

STUDY – FWC B4/ENTR/08/006
ix
complete set of training and dissemination tools to raise the awareness of the
importance of GPP. As regards the ranking of countries with respect to their GPP
uptake performance, these results are broadly in line with the PWC and Adelphi
studies, with some exceptions.
Figure D – Uptake of EU GPP in the EU27 (share of last contracts – by number)*
*Luxembourg excluded due to unavailability of data.

STUDY – FWC B4/ENTR/08/006
x
Figure E – Uptake of GPP in the EU27 (share of all contracts in 2009-2010 – by value)*
*Luxembourg excluded due to unavailability of data.
FINDING #5
The uptake of EU core GPP criteria does not vary only across countries,
but also across product groups.
The current levels of EU GPP uptake also differ when broken down by product
group. In figure F below, the red bar shows the extent to which public authorities
have included “any form of green” criteria (regardless of compliance with EU core
GPP criteria); the light green bar shows the percentage of contracts that included
“at least one EU core GPP criterion”; finally, the dark green bar displays the
percentage of contracts that complied with all EU core GPP criteria. For 8 out of 10
product groups, responses indicate that half of the contracts include some form of
green criteria. It is worth specifying that this question in our survey is of a more
subjective nature, because the definition of "green" was left to the respondent.

STUDY – FWC B4/ENTR/08/006
xi
Conversely, questions on the application of EU core GPP criteria for a
product/service group implied the provision of specific data (e.g., if they included
requirements on energy efficiency) by respondents10. In this case, only one product
group (transport) meets the 50% target set at the EU level. Conversely, four
product groups (furniture, textiles, food products and catering services, and
construction) significantly lag behind with a level of uptake below 20%.
10 This is why in the case of Construction the uptake of at least one EU core GPP criterion appears higher than the reported use of any (unspecified) form of green criteria. In other words, sometimes administrations may be “greener” than they think.

STUDY – FWC B4/ENTR/08/006
xii
Figure F –“Green” contracts by number of contracts
*No data available on the inclusion of EU core GPP criteria for Gardening Products and Services

STUDY – FWC B4/ENTR/08/006
xiii
FINDING #6
A few individual EU core GPP criteria are very frequently used
Figure G displays the reported level of uptake for the individual EU core GPP
criteria used in our survey for all product/service groups, with the exception of
Gardening Products and Services. As shown in the figure, only three out of the 24
EU core GPP criteria included in the survey were reportedly used by more than
50% of the respondents: double printing and energy performance for office IT
equipment, and the criterion on CO2 emissions for transport. The high score for
energy performance of IT equipment surely also stems from the fact that, under the
Energy Star regulation, central governments have the obligation to buy energy
efficient equipment.
Conversely, some of the surveyed EU core GPP criteria are seldom employed by
public authorities when procuring the products or services for which such criteria
were conceived.

STUDY – FWC B4/ENTR/08/006
xiv
FIGURE G– UPTAKE OF INDIVIDUAL EU CORE GPP CRITERIA FOR 9 PRODUCT GROUPS*
*No data available on EU core GPP criteria for Gardening Products and Services.

STUDY – FWC B4/ENTR/08/006
xv
FINDING #7
Life Cycle Costing (LCC) and Total Cost of Ownership (TCO) methods
are not frequently used by public authorities.
We also asked respondents to our survey to report on the methods that are more
commonly used to evaluate contracts. These included life cycle costing (LCC) and
Total Cost of Ownership (TCO) 11, a mix of LCC, TCO and purchasing costs, and
mostly evaluation on the basis of the purchasing cost. Figure H below illustrates the
distribution of award criteria per type of authority in our sample (a breakdown per
country is provided in Annex C). On average, the most commonly used criterion is
still purchasing costs (64%), followed by the mixed option (30%). Finally, decisions
are rarely based predominantly on LCC/TCO (6%).
This order does not change when results are broken down per type of authority.
Specifically,
Purchasing cost – the most widespread criterion - is used by 70% of
independent regulators, 66% of regional governments, 63% of local
governments and 62% of central governments.
A mix of LCC/TCO and purchasing costs (red bars in the figure) is used by 35%
of “other semi-public authorities”, and less often by – in decreasing order –
local government authorities (32%), regional governments (31%), central
government procurers (29%), and independent regulatory authorities (24%).
Finally, LCC/TCO is predominantly used as an award criterion by 13% of “other
semi-public authorities”, by 9% of responding central government institutions
and by 6% or less of other types of authorities.
These results are broadly in line with those obtained by PWC (2009), based on
contracts signed between 2006 and 2007. The PWC study found that in seven of
the leading European countries on EU GPP, LCC was regularly used only by 13% of
the respondents, while 45% of the respondents reported using “sometimes
11 Life Cycle Costing (LCC) is a technique used to estimate the total costs that are linked with a purchase. It takes into account not only the costs of buying a product, but also its running costs (energy, maintenance) and the disposal of it. This is often also referred to as Total Cost of Ownership (TCO). LCC can also take into account environmental externalities ("Whole LCC"). A more detailed definition of LCC and related information can be found at: http://ec.europa.eu/environment/gpp/pdf/toolkit/module1_factsheet_lcc.pdf.

STUDY – FWC B4/ENTR/08/006
xvi
evaluation on LCC, sometimes evaluation on purchasing costs”, and 41% only used
purchasing costs.
FIGURE H – USE OF LCC, TCO AND PURCHASING COST IN EVALUATING TENDERS
Table A below displays the top ten member states evaluating tenders according to
purchasing cost and LCC/TCO, respectively. In some countries, like Portugal and
Romania, the use of LCC or TCO is still very limited. Ireland is the country where
LCC/TCO is most widespread: however, even there, only 25% of respondents
reported that they mostly make use of this evaluation criterion.

STUDY – FWC B4/ENTR/08/006
xvii
Table A- Criteria for evaluating proposals, by Member State
FINDING #8
Many authorities face difficulties in including green criteria in public
procurement.
Our survey also asked authorities to report on the perceived level of difficulty of
including “green” criteria in contracts. We used a five points scale ranging from 1=
very easy to 5= very difficult. The average level of perceived difficulty among all
respondents is 3.06. Independent regulators and central government respondents
reported the highest levels of perceived difficulty with 3.21 and 3.16 respectively.
For local governments, the average perceived level of difficulty was 3.09, while
regional goverments reported an average level of perceived difficulty of 2.84 and
other semi-public authorities of 2.50. 17% of the respondents reported that they
found the process realtively easy (with scores ranging between 1 and 2), 44%
reported a perceived difficulty of 3 out of 5, and the remaining 39% found including
green criteria in public procurement to be relativeley difficult (with scores ranging
between 4 and 5). A complete breakdown of the average level of perceived difficulty
per country is provided in Annex C.

STUDY – FWC B4/ENTR/08/006
xviii
FIGURE I – PERCEIVED DIFFICULTY OF INCLUDING GREEN CRITERIA IN PROCUREMENT

STUDY – FWC B4/ENTR/08/006
Page 23 of 51
THE UPTAKE OF GREEN PUBLIC
PROCUREMENT IN THE EU27
INTRODUCTION
Over the past decade, EU institutions have placed growing emphasis on the need to
ensure that public administrations contribute to the achievement of environmental
policy goals. In particular, a key document for Green Public Procurement policies
in the EU is the 2001 EC Interpretative Communication on the “Community law
applicable to public procurement and the possibilities for integrating
environmental considerations into public procurement”,12 which clarified how
Community law offered numerous possibilities to public purchasers wishing to
integrate environmental considerations into public procurement procedures. Later,
the Communication was followed by the 6th Environmental Action Plan (in 2002)13
and by the Communication on Integrated Product Policy (2003) 14 that present
green public procurement as a central tool to create the appropriate economic and
legal framework for continuous environmental improvement. In 2004, the new
legal framework for Public Procurement15 explicitly mentioned the possibility to
include green criteria in procurement processes. In the same year, the “Buying
Green!” Handbook16 was published in order to provide procurers with specific
guidance on GPP. Later, the Renewed EU Sustainable Development Strategy
(2006) and, in 2008, the Sustainable Consumption and Production and
12 COM (2001) 274. The full text of the Communication is available here: http://eur-lex.europa.eu/LexUriServ/LexUriServ.do?uri=COM:2001:0274:FIN:EN:PDF
13 The Action Plan was established with Decision 1600/2002/ EC. Article 4 stresses the importance of promoting a green public procurement policy. For further details, see: http://eur-lex.europa.eu/LexUriServ/LexUriServ.do?uri=OJ:L:2002:242:0001:0015:EN:PDF
14 Integrated Product Policy - Building on Environmental Life-Cycle Thinking. COM(2003)302.
For further details, see: http://eur-lex.europa.eu/LexUriServ/LexUriServ.do?uri=COM:2003:0302:FIN:EN:PDF
15 EU Directive 2004/17 – procurement in the water, energy, transport and postal services sectors Directive, and EU Directive 2004/18 - procurement - contracts for public works, public supply and public service. For further details on the legislation, applicable thresholds, and guidelines, see: http://ec.europa.eu/internal_market/publicprocurement/rules/current/index_en.htm.
16 For further details, please see the second edition of the Handbook published in 2011 at: http://ec.europa.eu/environment/gpp/buying_handbook_en.htm.

STUDY – FWC B4/ENTR/08/006
Page 24 of 51
Sustainable Industrial Policy (SCP/SIP) Action Plan17 and the Communication on
“Public procurement for a better environment”18 completed the framework. Under
the SCP/SIP Action Plan, the European Commission undertook to further
strengthen GPP; with the 2008 Communication, the Commission provided further
guidance on how to reduce the environmental impact caused by public sector
consumption and on how to use GPP to stimulate innovation in environmental
technologies, products and services. At EU level, the European Commission also set
an indicative target that, by 2010, 50% of all public tendering procedures should be
green, where “green” means compliant with endorsed common core EU GPP
criteria19. This approach was later supported and endorsed by the Competitiveness
Council on 25-26 September 2008 and by the Environment Council in 2008.20 The
present study has been commissioned in order to monitor the 50% GPP targets.
The large portion of EU GDP accounted for by public procurement (estimated at
19.9% for 2009) indicates that public authorities can significantly affect market
demand with their purchasing decisions. Against this background, GPP is expected
to contribute to the achievement of the goals set by the EU 2020 strategy in terms
of sustainable and smart growth, especially by encouraging the development of
climate-friendly technologies21. The adoption of the EU 2020 Strategy is therefore
likely to be coupled with an even stronger attention for the promotion of GPP
17 COM (2008) 397. The Action Plan contains a dedicated section on how to promote green public procurement through voluntary measures and announces the Communication issued later the same year. For further details, see : http://eur-lex.europa.eu/LexUriServ/LexUriServ.do?uri=COM:2008:0397:FIN:EN:PDF
18 COM (2008) 400. For further details: http://eur-lex.europa.eu/LexUriServ/LexUriServ.do?uri=COM:2008:0400:FIN:EN:PDF
19 The Commission was officially entrusted with a number of tasks, including (i) setting common GPP criteria; (ii) encouraging publication of information on life-cycle costing (LCC) of products; (iii) increasing certainty about legal possibilities to include environmental criteria in tender documents; (iv) establishing support for the promotion and implementation of GPP through a political target linked to indicators and monitoring.
20 See the Competitiveness Council conclusions, Press Release, 12959/1/08 REV 1 (Presse 251), available at http://www.consilium.europa.eu/uedocs/cms_data/docs/pressdata/en/intm/103101.pdf. And the Environment Council’s conclusions on the Sustainable Consumption and Production and Sustainable Industrial Policy Action Plan, Brussels, 5 December 2008, 16914/08, at http://register.consilium.europa.eu/pdf/en/08/st16/st16914.en08.pdf.
21 For further details, see: http://ec.europa.eu/europe2020/index_en.htm

STUDY – FWC B4/ENTR/08/006
Page 25 of 51
among public administrations, and especially within the context of the flagship
initiative on “Resource Efficient Europe” 22.
More in detail, in order to promote the uptake of GPP in the EU, the European
Commission developed common GPP criteria for 19 product and service groups (as
of February 2012),23 inviting authorities to include these criteria into their
tendering procedures so as to purchase greener products, works and services.
These common criteria should also lead to a more harmonised use of procurement
criteria throughout the EU, thus positively contributing to the consolidation of the
EU Internal Market.
Initially, the European Commission had identified 10 product and service groups,
and proposed a first set of criteria for GPP uptake in 2008. These first 10 product
groups, which are also those covered by the present study, are:
Cleaning products and services;
Construction;
Electricity;
Catering and food;
Gardening;
Office IT equipment;
Copying and graphic paper;
Textiles;
Transport;
Furniture.
For each of those groups, this study monitors compliance with the “core criteria”
set by the Commission – i.e., criteria suitable for use by any contracting authority
across the EU. Core criteria address key environmental impacts and are designed
22 For additional information on this flagship initiative, see the dedicated website at: http://ec.europa.eu/resource-efficient-europe/. For specific details on concrete actions in this areas and reference to example on procurement practice, such as the case of the Eco-Buy initiative of the City of Vienna, see: http://europa.eu/rapid/pressReleasesAction.do?reference=MEMO/11/43&format=HTML&aged=0&language=EN&guiLanguage=en
23 For further details, and the updated list of criteria see: http://ec.europa.eu/environment/gpp/eu_gpp_criteria_en.htm. As will be explained further on, the initial list of product/service groups covered 10 categories and was then expanded.

STUDY – FWC B4/ENTR/08/006
Page 26 of 51
to be used with minimum additional verification efforts or cost increases.24 They
differ for each of the products and services identified, and are backed by a technical
report for each product group (see Annex F to this report for the list of core criteria
for each product group). Since some Member States and public authorities are
using different GPP criteria from the ones provided by the Commission, the criteria
were formulated in more general terms so as to take into account green
procurement practices which are similar, but not exactly the same as the EU
criteria.
This report contains an analysis of the level of uptake of a selection of EU core GPP
criteria, as they were available in 2010 (some have been updated in 2012, but all
the data provided in this study refer to the 2010 version of each criterion). As will
be explained in greater detail in the methodological section below, we have decided
to limit our analysis to a subset of the EU core GPP criteria for each
product/service group. This selection was agreed with the European Commission
and is primarily intended to strike a balance between the goal of providing an
accurate picture of the uptake of EU core criteria for each product/service group,
and the need to obtain a statistically meaningful number of responses to our
questionnaire. Surveying all the existing core criteria for each product group would
have significantly reduced the expected response rate to the survey, thus
undermining the validity of our findings.
1.1 Purpose and structure of the report
As already announced in the Communication “Public procurement for a better
environment”, the European Commission must regularly monitor GPP uptake. The
Communication also clarifies that since EU “core” GPP criteria are used as a basis
for target-setting and benchmarking, monitoring must take into account
compliance with EU “core” GPP criteria.
Partially similar monitoring exercises have already been done by two studies in the
past few years25. The present study provides information on GPP uptake in the
24 Conversely, a second set of criteria, the so-called “comprehensive criteria” are for authorities who wish to purchase the best environmental products available on the market. These criteria may require additional verification efforts or a slight increase in cost compared to other products with the same functionality.
25 Adelphi et al. (2011), “Strategic Use of Public Procurement in Europe”, final Report to the European Commission, MARKT/2010/02/ C; PricewaterhouseCoopers, Significant and Ecofys

STUDY – FWC B4/ENTR/08/006
Page 27 of 51
EU27, with specific reference to the target set at EU level, that by 2010 50% of all
public procurement procedures are compliant with endorsed common core EU
GPP criteria. As mentioned, our analysis covers the first ten product and service
groups selected at the EU level, and is focused in particular on the so-called “core”
criteria identified by the European Commission. For some product groups,
comprehensive criteria of special interest have been surveyed as well. The inclusion
of these criteria however did not influence the overall answer on the GPP uptake in
the EU27.
Section 2 below explains in detail the methodology we have followed in order to
complete the analysis, as well as the size of the sample of authorities and public
contracts we were able to survey. Section 3 reports our main findings on the uptake
of GPP throughout the EU27 in general terms. Finally, concluding remarks and
policy suggestions are provided in Section 4.
This study also features six annexes. Annex A includes the comparison of our
findings with those of previous studies carried out for the European Commission.
Annex B describes the current level of EU GPP uptake in the EU27 by reporting the
responses provided by public authorities on the last contracts and all contracts they
signed in 2009 and 2010 for each of the ten product/service groups under
examination. Annex C contains detailed country fiches, where results per country
are shown and briefly discussed. Where relevant, we compare our findings with
those of the EU level studies (Annex A) and four studies performed at national
level.26 Annex D provides bibliographic references; Annex E contains the original
questionnaire we used for our survey (only in the English version, although the
questionnaire was translated in all the official languages of the EU for the survey).
Finally, Annex F describes the core criteria selected at the EU level for the 10
product/service groups that are the subject of this study.
2009),"Collection of statistical information on Green Public Procurement in the EU Report on data collection results", January. For further details on these studies and a comparison with the present one, see Annex A.
26 The studies were performed in Italy, the Netherlands, the Slovak Republic, and Spain. For further details, see Annex C.

STUDY – FWC B4/ENTR/08/006
Page 28 of 51
2 METHODOLOGY
This Section describes the methodological approach that was chosen, in agreement
with the European Commission, to appraise the level of GPP uptake in the EU27
for the already mentioned ten product and service groups. In order to secure a
greater level of detail in our analysis, we have relied on the support of 27 national
public procurement experts selected by the College of Europe. In addition to
collecting contact information and translating questionnaires in their respective
language, national experts also conducted personal interviews with public
authorities during the questionnaire design process for design feedback, and acted
as contact persons for their own countries to ease the process of data collection.
Besides desk research and a review of the recent literature, this study essentially
draws on the findings of a comprehensive data collection exercise based on an
online survey that was submitted to public authorities at different levels of
government in each EU Member State. For the survey, we contacted 18,517
authorities out of an estimated total of at least 167,000, and retrieved 856
responses with detailed information on 1,783 “last contracts” signed, as well as less
detailed information on a total of 236,752 contracts signed between 2009 and
2010.
In what follows, we illustrate in greater detail our approach for designing and
administering the questionnaire used for the data collection. In particular, Section
2.1 describes the questionnaire; while Section 2.2 explains how we addressed the
problem of building a representative sample.
2.1 The questionnaire used
A questionnaire was designed in order to collect data on the procurement behaviors
of public authorities across the EU27 (see Annex E for the original text of the
questionnaire in the English language). The questionnaire was translated in all the
national languages of the EU27 and disseminated both in paper and online/HTML
format to facilitate data collection and tailor the survey to the respondents’
preferences. The online questionnaires were promoted on the European

STUDY – FWC B4/ENTR/08/006
Page 29 of 51
Commission web page as well as on the web sites of some public authorities and
promoted by procurement networks27.
The questionnaire was structured as follows:
A general section contained questions on the respondent’s role in the public
sector, level of government, estimated level of GPP uptake, etc.
Another section focused on each of the 10 product groups. In this case, two
separate sets of questions were directed at the respondents:
o The first set of questions concerned the last contract that a given
procurement authority signed in the period 2009-2010 for the product
group at hand.
o Then, respondents were asked to provide “general information” on their
total procurement in the 2009-2010 timeframe for the product group at
hand.
In the remainder of the text, when reporting the results from the set of questions
on the last contracts, we will refer to such contracts as “individual contracts” in
order to differentiate them from the contracts reported under the “general
information” part.
Overall, 18,517 questionnaires were sent to unique contact points of public
authorities across the EU27. The contact information database was constructed
through the efforts of the national experts as well as through information available
from the Tenders Electronic Daily (TED) database28. The contact information
gathered from the TED database was collected only from those tender
announcements that included the 10 product groups filtered with respect to their
CPV29 codes. By doing this we tried to ensure that the questionnaire was sent to
public authorities that have procured, in 2009/2010, at least one of the ten
27 For further details, see: http://ec.europa.eu/environment/gpp/survey2011_en.htm. 28 TED is the online version of the 'Supplement to the Official Journal of the European Union', dedicated to European public procurement. Information about every procurement document is published in the 23 official EU languages. All notices from the European Union's institutions are published in full in these languages. http://ted.europa.eu/TED/main/HomePage.do 29 Regulation 2195/2002 on the Common Procurement Vocabulary (CPV) lists the "supplies, works or services forming the subject of the contract" and provides as well correspondence tables of the CPV with CPA 1996 and NACE Rev.1. http://eur-lex.europa.eu/LexUriServ/LexUriServ.do?uri=CELEX:32002R2195:en:NOT

STUDY – FWC B4/ENTR/08/006
Page 30 of 51
product/service groups that form the subject of this study. The survey was carried
out between 12 September and 28 October 2011 for a duration of 7 weeks.
2.2 Accuracy and representativeness
Our overarching goal in this study was to assess whether the current GPP uptake in
the public authorities of the EU27 is reaching the objective set by the European
Commission’s Communication “Public procurement for a better environment” –
i.e., that, by 2010, 50% of all public tendering procedures should be green. In order
to make statistically valid statements from the data collected, we had to ensure that
(i) our results are as accurate as possible; and (ii) the sample of authorities
contacted is statistically representative. Below, we discuss both concepts.
2.2.1 Accuracy: balancing the level of detail with the response rate
A number of steps were taken in order to avoid sampling errors and to obtain a
statistically significant data set that would allow us to make statistical inferences.
First, in order to avoid the risk of a low response rate stemming from the content of
the questionnaire we have discussed the questionnaire thoroughly with the
European Commission and submitted a draft of the questionnaire for consultation
to the informal GPP Advisory Group coordinated by the European Commission.
Second, we complemented our analysis by including targeted consultations of
experts in a number of Member States. Moreover, the survey questionnaires were
translated into the different native languages of respondents to reach a higher
number of local authorities and make it easier for them to respond.
In terms of accuracy, our questionnaire goes far beyond what was done in previous
monitoring exercises. As a matter of fact, ours is the first survey in which
information is collected for the 27 Member States of the European Union, and not
based only on information related to the last contract signed by responding
authorities. This is a very important achievement: for example, the previous report
related to GPP uptake in 2006-2007 (PWC, 2009) only looked at seven Member
States (the top performing ones, or “green-7”), and only gathered information on
the last contract signed. The latter issue can create concerns, as responding
authorities might have an incentive to report the “last green contract”, rather than
the “last contract” only. This could lead to over-stating GPP uptake, if the results
based on the last contract are generalized as results for the whole practice of a
given authority. We would thus not expect that “false positives” (cases of
authorities considered as “green”, which in fact do not always use green criteria)

STUDY – FWC B4/ENTR/08/006
Page 31 of 51
and “false negatives” (cases in which the last contract was not green, but the
authority indeed uses green criteria) compensate each other in the results of such a
survey. Rather, we would expect “false positives” to be more numerous,
exacerbating the problem of the selection bias that already exists (though to a much
lesser extent) due to the fact that authorities that decide to respond to the
questionnaire might on average be more likely to be “green” than non-responding
ones.
In addition, our results allow for tracking progress on GPP uptake, in line with the
overarching goal of the monitoring exercise. More specifically, we can compare our
detailed results for 1,783 “last contracts” with slightly less detailed results on
236,752 contracts signed by more than 800 authorities during the period 2009-
2010. As shown in our main findings and throughout the text, we can indeed show
– based on these data sources – that several countries exhibit signs of progress in
the level of GPP uptake in the past two years.
Finally, the level of detail of our survey has also resulted in a slightly lower
response rate than what obtained by other surveys in this field. Put differently, we
have tried to strike a different balance between accuracy and representativeness,
and we believe that, overall, the result is robust. Section 2.2.2 below contains our
assessment of the precision of the individual results obtained per Member State.
2.2.2 Representativeness of the sample
Assessing the representativeness of a given sample can be done from both an ex
ante and an ex post perspective30. From an ex ante perspective, one can estimate
the number of responses needed (so-called estimated “net sample size”) out of the
total number of questionnaires sent (so-called “gross sample size”), which in turn is
a fraction of the total population. Once the survey has been completed, adopting an
30 The level of precision is calculated as follows :
, where the sample size is
measured as
ss= Sample Size (Number of responses for a country)
ps= Population Size (Total number of contacts for a country)
z= 1.65 (for 90% confidence from the Cumulative Normal Probability Table)
p= 50% (target level of up-take)

STUDY – FWC B4/ENTR/08/006
Page 32 of 51
ex post perspective amounts to asking whether the number of responses obtained is
indeed sufficient to guarantee a given level of accuracy. We take this latter
approach in this section, since we are describing the level of precision of a survey
that has already been finalized.
In order to determine the precision of our findings, we use a technique called
“estimation of the confidence interval”. In statistics, the confidence interval
measures the level of precision of estimates derived by use of samples instead of
the total population. For a known population and sample size, it is possible to infer
with a certain level of confidence that a given result is within a confidence interval
around the GPP uptake target of 50%.
The main data we have in terms of sample size are the following:
Gross sample size = 18,517
Net sample size = 856
Given the size of our sample, we consider it reasonable to use either a normal
distribution or a hyper-geometric distribution, as was done in previous studies
(PWC, 2009). Hence, Table 1 shows the level of precision of our results expressed
both according to a normal distribution and a hypergeometric one. Since the
difference in results is negligible, below we explain our estimates of the confidence
interval based on a normal distribution.
In order to illustrate the meaning of confidence interval, we can use an example
from Table 1 below. For Germany, the calculated level of precision is 6.7% with a
90% confidence. This means that if our survey result for Germany is 50% uptake,
there is a 90% probability that the “real” value falls between 43.3% and 56.7%, or
±6.7% with respect to the survey result. This value makes our estimate for Germany
reasonably precise; however, for most countries we have not reached the same level
of precision. Table 1 shows (fourth column) that the countries for which we have
reached the highest level of accuracy are Germany and Slovenia; for another 16
Member States the results are reasonably precise; but for 5 countries (Ireland,
Luxembourg, Portugal, Malta and Slovakia) we could not obtain a sufficient level of
precision due to the very low number of responses.
Overall, it must be recalled that the net sample size required to satisfy a certain
level of accuracy is only weakly affected by the size of the gross sample. As observed
also by PWC (2009: 65), “the smaller the population, the smaller the variation in
sample outcome, however, the effect is limited”. As a result, as the net sample size
and the gross sample size both increase, the level of accuracy also increases. This

STUDY – FWC B4/ENTR/08/006
Page 33 of 51
explains why our total result for all Member States, reported at the end of Table 1,
shows that our estimate for the whole EU is way more precise than estimates for
every individual Member State. Should we find a 50% uptake, there would be only a
10% likelihood that the actual result does not fall between 47.2% and 52.8%.
Table 1 – Level of precision of our results, per Member State
Country
Number of Contacts
Responses obtained Precision Level Precision Level
(gross sample
size) (per
authority)
Normal Distribution (90%
confidence)
Hypergeometric Distribution (90%
confidence)
AT 547 18 19.10% 19.14% BE 862 29 15.10% 15.13% BG 516 21 17.60% 17.65% CY 155 46 10.20% 10.23% CZ 533 17 19.70% 19.71% DE 2930 146 6.70% 6.66% DK 318 34 13.40% 13.39% EE 448 24 16.40% 16.40% ES 1150 39 13% 13% FI 589 24 16.50% 16.51% FR 3187 49 11.70% 11.70% GR 427 13 22.60% 22.56% HU 482 13 22.60% 22.59% IE 179 4 40.90% 40.90% IT 1281 29 15.20% 15.15% LT 597 21 17.70% 17.70% LV 118 18 18% 18% MT 148 6 33.10% 33.10% NL 290 9 27.10% 27.12% PL 1179 29 15.10% 15.14% PT 282 7 30.80% 30.85% RO 359 17 19.60% 19.56% SE 1215 59 10.50% 10.48% SI 430 162 5.10% 5.12% SK 159 6 33.10% 33.14% UK 998 16 20.50% 20.47%
Total 18517 856 2.8% 2.8%
* No responses obtained for Luxembourg

STUDY – FWC B4/ENTR/08/006
Page 34 of 51
3 DISCUSSION OF EMPIRICAL FINDINGS
In this Section, we describe the main conclusions we drew from the analysis of the
responses received, in particular for what concerns the general part of our
questionnaire, and further present data regarding our main findings. As mentioned
earlier, a detailed breakdown of our results both per product group and per country
are included in Annexes B and C respectively.
3.1 The majority of respondents include an environmental
component in their procurement
Figure 1 below provides a breakdown of the percentage of respondents (per type of
authority) that reported whether their organisation includes “an environmental
component” in its procurement policy (a detailed breakdown of these responses per
country is provided in the country fiches in Annex C). The figure shows that
regional and local government authorities are the strongest performers in our
sample, 67% of them having a “green” component in their procurement policy,
followed by central governments with 60% while independent regulators stand at
only 49%.31
These results are broadly consistent with the findings of a previous study for the
European Commission completed by PricewaterhouseCoopers in 2009, which – as
mentioned - looked only at the seven Member States considered as the most
advanced countries in GPP at the time (Austria, Denmark, Finland, Germany, the
Netherlands, Sweden, and the UK). In the PWC study, on average 71% of
authorities in these countries reported to have an environmental component in
their public procurement. In the PWC study, local authorities also had a higher
percentage (72%) than central ones (67%). Further detailed comparison between
the 7 analyzed countries of the PWC study and this report is provided in Annex A.
31 For each authority type, percentages do not add up to 100% because not all the participants to the survey responded to this question.

STUDY – FWC B4/ENTR/08/006
Page 35 of 51
Figure 1 – Is there an environmental component to your organization’s procurement policy?*
*Not all respondents answered this question; hence the sum of percentage points per authority-type may not add up to 100%.
3.2 Most authorities “often” use green requirements when
procuring goods or services
Figure 2 below provides a breakdown of the frequency with which each type of
authority believes that certain “green” criteria such as limits on substances harmful
to human health and the environment, energy efficiency and renewable energy,
waste management, and so on, are included in its procurement policy. Only a small
percentage of authorities report that they always include green requirements in
their procurement policy (purple bars in the figure). Other (semi)-public
authorities are the best performers in this respect (13%), followed by local
governments (7%). Regional governments in our sample often include an
environmental criterion in their procurement policy in 51% of the cases, followed
by local governments (47%) and other (semi)-public authorities (45%).
Independent regulators and central governments in our sample reported that they
rarely include a “green” component in 43% and 41% of the cases respectively, while
the corresponding percentage among local governments and regional ones are 32%
and 25% respectively. Finally, independent regulators reported they never include
green requirements in 16% of the cases. The corresponding percentage for central
governments is 12%. Finally, only 5% of respondents among regional authorities
reported that green criteria are never included, and the corresponding percentage
for local authorities is 6%.

STUDY – FWC B4/ENTR/08/006
Page 36 of 51
Figure 2 – Inclusion of “green” requirements in procurement procedures*
*Not all respondents answered this question; hence the sum of percentage points per authority-type may not add up to 100%.
3.3 Perceptions regarding the difficulty of including green
criteria vary across the EU27
The survey also required authorities to report on the perceived level of difficulty of
including “green” criteria in contracts. We used a five points scale ranging from 1=
very easy to 5= very difficult. The average level of perceived difficulty among all
respondents is 3.06. Independent regulators and central government respondents
reported the highest levels of perceived difficulty with 3.21 and 3.16 respectively.
For local governments the average perceived level of difficulty was 3.09, while
regional goverments reported an average level of difficulty of 2.84 and other semi-
public authorities of 2.50. Only 17% of the respondents find the inclusion of GPP
criteria realtively easy (scores ranging between 1 and 2), while 44% reported a
perceived difficulty of 3 out of 5, and the remaining 39% find it relativeley difficult
(with scores ranging between 4 and 5) 32.
It is worth adding that the authorities that reported not to include any
environmental component in their procurement process also find it more difficult
to include GPP criteria in contracts when compared to authorities reporting the
existence of an environmental component in their procurement policy. Specifically,
54% of the respondents in the former group reported to find it difficult (i.e., 32%
reported 4 and 22% reported 5 as perceived level of difficulty), whereas the same
32 A breakdown of the average level of perceived difficulty per country is provided in Annex C to this report

STUDY – FWC B4/ENTR/08/006
Page 37 of 51
figure for the latter group is lower, at 32% (24% of respondents reported 4 and 8%
reported 5 as perceived level of difficulty).
Figure 3 – Perceived level of difficulty of including green criteria in public procurement
3.4 Purchasing price remains the predominant criterion to
evaluate contracts
Traditionally, public procurers have relied mostly on the offered price (i.e., on the
purchasing cost for the procurer) as the key award criterion. However, the need to
take into account other factors, e.g. environmental and wider sustainability
concerns, has led EU and national institutions to advocate a wider use of more
sophisticated methods, such as “life cycle costing” (LCC) and “total cost of
ownership” (TCO). Accordingly, we have asked respondents if they still use
purchasing costs as the main award criterion, or have moved to a mix of LCC/TCO
and purchasing costs, or even use LCC/TCO as their standard criterion for
evaluating offers.
The figure below illustrates the distribution of award criteria per type of authority
in our sample. The figures are calculated over the total number of responses
available for this question. On average, the most commonly used criterion is
purchasing costs (64%), followed by the mixed option (30%). Finally, LCC/TCO is
the least commonly used criterion (6%).

STUDY – FWC B4/ENTR/08/006
Page 38 of 51
Such order remains unaltered when results are broken down per type of authority.
Specifically, purchasing costs – the most widespread criterion – is used in 70% of
the cases by independent regulators, in 66% of the cases by regional governments,
closely followed by local governments (63%) and by central governments (62%). A
mix of LCC/TCO and purchasing costs (red bars in the figure) is used by other
semi-public authorities in 35% of the cases and in similar but lower proportion by
other types of authorities. Finally, LCC/ TCO is predominantly used as an award
criterion by other semi-public authorities in 13% of the cases, by central
governments in 9% of the cases included in our sample, and never goes above 6%
for the other types of authorities.
It is worth noting that 36% of the respondents using purchasing costs to evaluate
proposals reported to find the inclusion of green criteria in contracts to be difficult
(on a scale of 5, 11% reported 4 and 25% reported 5 as perceived level of difficulty).
The ratio is 33% for respondents using LCC/TCO (on a scale of 5, 17% reported 4
and 16% reported 5). Finally, 34% of the respondents using a hybrid of both
evaluation methods reported to find it difficult to include green criteria in
procurement (on a scale of 5, 10% reported 4 and 24% reported 5).
Figure 4 – Use of life cycle costing (LCC), total cost of ownership (TCO) and purchasing cost
These results are broadly in line with those obtained by PWC (2009), based on
contracts signed between 2006 and 2007. The PWC study found that in seven of
the leading European countries on GPP, LCC/TCO was regularly used only by 13%

STUDY – FWC B4/ENTR/08/006
Page 39 of 51
of the respondents, while 45% of the respondents observed that they used
“sometimes evaluation on LCC, sometimes evaluation on purchasing costs”, and
41% only used purchasing costs.
Table 2 below displays the top ten member states evaluating tenders according to
purchasing cost and LCC/TCO. In some countries, like Portugal and Romania, the
use of LCC or TCO is still very limited. Ireland is the country where LCC/TCO is
most widespread: however, even there, only 25% of respondents reported that the
always make use of these evaluation criteria.
Table 2 – Prevalent award criterion for selected Member States
3.5 More than 50% of public authorities use at least one EU
core GPP criterion when procuring
Overall, 55% of surveyed public authorities included at least one EU core GPP
criterion in their last contracts. The inclusion of all surveyed EU GPP criteria
instead is at 26%. More in detail, 48% of central government authorities reportedly
used at least one EU core GPP criterion. However, only 17% of them used all EU
core GPP criteria in their public contracts. Figures are broadly similar for
independent regulators that used all EU core GPP criteria only in 14% of the cases.
Instead, percentages are higher for local and regional government authorities. In
this case, the inclusion of at least one EU core criterion is above 60%. Accordingly,

STUDY – FWC B4/ENTR/08/006
Page 40 of 51
there seems to be room for promoting a greater uptake of green criteria especially
in the public contracts awarded by central governments and independent
regulators.
Figure 5 – Inclusion of EU GPP criteria in individual contracts
3.6 GPP uptake in the EU27: still a very fragmented picture
Figure 6 shows the overall level of EU GPP uptake for all ten product/service
groups in the EU27. The different shades of green in the figure portray a very
fragmented picture, with four top performers (Belgium, Denmark, the Netherlands,
and Sweden), followed by a second group of countries reporting a level of uptake
between 20% and 40% for the selected 10 product and service groups. Overall, the
level of EU GPP uptake in the Eu27 appears lower than the 50% target set by the
European Commission in 2008. As many as twelve countries – Portugal, Ireland,
Poland, the Czech Republic, Finland, Slovenia, Hungary, Romania, Bulgaria,
Greece, Latvia and Estonia – feature a level of EU GPP uptake that is below 20%33.
Due to the low response rate in some countries, these results have to be read with
caution.
33 Luxembourg (in grey in the figure) could not be included in our analysis due to the fact that we received no responses to our survey.

STUDY – FWC B4/ENTR/08/006
Page 41 of 51
Figure 6 – Uptake of EU GPP in the EU27 (last contracts by number)*
A similarly fragmented picture can be observed when looking at the monetary value
of all contracts signed by respondents in 2009 and 2010, as illustrated in the figure
below.

STUDY – FWC B4/ENTR/08/006
Page 42 of 51
Figure 7- Uptake of GPP in the EU27 (share of all contracts in 2009-2010 – by value)*
There are several possible explanations for this fragmentation in GPP uptake:
The existence and implementation of dedicated National Action
Plans (NAPs) for GPP. Many of the countries that lead in GPP uptake are
also those where a NAP was adopted early on. For example, Denmark has
introduced the first NAP back in 1994, and then revised it in 2008. The
Netherlands has a dedicated NAP since 2003 (revised in 2007). To the contrary,
the study by Adelphi (2011) reports that several countries did not have NAPs in
place for the period covered by this study (Estonia, Latvia, Romania, Bulgaria,
Greece, Hungary and Ireland).
The variety of approaches and targets in the EU27. The study by
Adelphi (2011) reports that some countries have set general GPP targets for all
public contracts, and only in three cases these targets are aligned with the EU
target of achieving a 50% uptake by 2010 (Latvia, Denmark, Portugal). In some
countries, targets have been set also for specific product groups: however,
across the EU27, only a subset of countries have included in their NAPs all the
10 product groups indicated by the European Commission, and many other

STUDY – FWC B4/ENTR/08/006
Page 43 of 51
countries have indicated other product or service groups, sometimes partly
overlapping with the EU ones. As a result, any survey exercise like the one
presented in this study might capture only part of the reality. We have tried to
avoid this problem by asking also for general information on green
procurement, regardless of the product group: this, compared to previous
studies, could potentially alleviate the problem of capturing such a variety of
practices.
Different practices of the inclusion of green criteria. Public authorities
can include green criteria at different stages of the procurement process.
Including them in technical specifications is making them a "must-have", while
their inclusion in the contract award phase, as a preferential element with a
certain weighing, will not necessarily lead to a green contract. Table 3 below
shows data from the OECD procurement survey on this issue.
Governance-related problems. Further analysis would be needed in order
to find out whether monitoring and enforcement of the provisions in support of
GPP are effective in laggard countries. Leading countries in GPP seem to exhibit
more consistent and significant efforts in the direction of establishing credible,
long-standing policies with compulsory elements, as well as “institutionalized,
proactive capacity-building efforts”34. Table 3 (right part) shows that many of
the less well performing European countries have a less developed set of
guidance materials on green public procurement, from guidance documents to
codes of practice, training tools and ad hoc advice/support.
34 Adelphi (2011), at III.

STUDY – FWC B4/ENTR/08/006
Page 44 of 51
Table 3 – Stages of procurement cycle where green criteria are applied and available guidance
(2010)
3.7 Summary of uptake of individual EU core GPP criteria
Figure 7 below shows the reported level of uptake for each of the EU core GPP
criteria that were surveyed in our questionnaire for the 10 product and service
groups. These findings are based on the data obtained from respondents on the last
contract signed for a given product group in 2009-2010.

STUDY – FWC B4/ENTR/08/006
Page 45 of 51
Figure 8 – Level of uptake of individual EU core GPP criteria for 9 product groups*
*No data available on EU core GPP criteria for Gardening Products and Services
STUDY – FWC B4/ENTR/08/006
Page 46 of 51
In particular, the figure shows which EU GPP criteria were more frequently
included in public procurement by our respondents across the EU27. Reportedly,
only three EU GPP criteria were used by more than 50% of the respondents. These
are the criteria on double printing and energy performance of office IT equipment,
and requirements on CO2 emissions in transport. The criterion on the maximum
level of harmful substances in cleaning products and services follows closely, with
an uptake of 48%. All other criteria were adopted by less than 50% of respondents
for their relative product or service group. Some of the EU GPP criteria surveyed in
this study were used very infrequently by public authorities in the EU27.
3.8 Green criteria are frequently included in the technical
specifications of contracts
Finally, we asked procuring authorities to report at which stage of the procurement
process green criteria were included. The figure below reports the results for all
product and service groups combined. The preferred stage to include green
requirements in the last procured contracts of our sample is in the definition of
technical specifications (38%), followed by inclusion in the definition of the subject
matter of the contract (25%). The inclusion of green criteria in contract
performance clauses and in the technical/professional ability of the tenderer is less
widespread (15% and 14% of the cases, respectively). Green criteria were included
at the award criteria stage in only 10% of the cases.
Figure 9 – Stage of inclusion of green criteria during procurement process for all product
groups

STUDY – FWC B4/ENTR/08/006
Page 47 of 51

STUDY – FWC B4/ENTR/08/006
Page 48 of 51
4 CONCLUDING REMARKS AND POLICY SUGGESTIONS
In this Section, we conclude by summarizing the main findings of our survey, and
provide an interpretation of these results.
As a first, preliminary finding, it is safe to state that under the present conditions,
monitoring progress towards the achievement of the EU-stated goal of reaching
50% of EU GPP uptake in selected product/service groups is very difficult. This is
due to a number of concurring factors, including most notably: (i) the wide variety
of definitions adopted across the EU27 as regards what belongs to the different
product groups; (ii) various classifications of when a contract can be considered to
be green; and not the least, (iii) the very limited availability of information on GPP
in official European and national statistics or in dedicated databases on public
contracts, such as TED. To be sure, one can show that some countries do more GPP
than others, yet obtaining more detailed information remains a challenging
exercise.
That said, we have tried to maximize the accuracy of our results by asking
respondents three sets of information: (i) on their general green procurement
practices, (ii) on GPP criteria included in the last contract signed for each of the ten
product groups; and (iii) on the share of green contracts signed for each product
group in 2009 and 2010, both in terms of number and overall value. This
information requirement made our questionnaire inevitably more burdensome for
respondents, thus leading to a lower amount of replies compared to previous
studies. We believe, however, that the results we are able to provide can be
considered more detailed than those included in previous reports. Finally, the
consistency of data obtained from different parts of the questionnaire gives
robustness to our overall results.
The main findings of our analysis can be summarized as follows:
The uptake of EU core Green Public Procurement (GPP) criteria in
the EU27 is significant. Our survey on the procurement of ten
product/service groups shows that 26% of the last contracts signed by public
authorities in the EU27 for the ten product groups included all EU core GPP
criteria. In addition, 55% of the last contracts signed included at least one EU
core GPP criterion.
The uptake of EU core GPP criteria is on the increase. The percentage
of last contracts that included at least one EU core GPP criterion (55%) is much
higher than the percentage of contracts signed in 2009-2010 that contained

STUDY – FWC B4/ENTR/08/006
Page 49 of 51
some form of GPP criteria, be they EU, national, regional, local or other ones
(29%). This suggests that GPP uptake is increasing.
In terms of value of procurement, GPP uptake appears very
significant. Besides asking information about last contracts signed, we also
collected information on a total of 236,752 contracts signed by public
authorities in 2009-2010, for a value of 117.5 billion Euros. Results show that
38% of the total value procured included GPP criteria, be they EU, national,
regional, local or other ones.
The majority of public authorities are undertaking some form of
GPP. Today, two thirds of the regional and local government authorities, 60%
of central government authorities and 49% of independent regulators in the
EU27 include a “green” component in their procurement policy.
The uptake of EU GPP criteria varies significantly across the EU27.
There are four top performing countries, in which EU core GPP criteria were
applied in 40%-60% of the last contracts signed by public authorities. On the
other hand, there are as many as twelve countries where this occurred in less
than 20% of the last contracts. For some countries, because of low response
rates, these results must however be read with caution.
The uptake of EU core GPP criteria does not vary only across
countries, but also across product groups. For one of the ten product
groups considered (transport), over 50% of the contracts respond to EU core
GPP criteria, thus meeting the target set at the EU level. Yet, four product
groups still lag significantly behind (furniture, textiles, food products and
catering services, and construction) with an uptake level below 20%.
A few individual EU core GPP criteria are very frequently used. Out
of a total of 24 EU core GPP criteria considered, only three were used by more
than 50% of the respondents in the last contracts they signed to procure the
related product. Conversely, four of these criteria were used by less than 20% of
the respondents.
Life Cycle Costing (LCC) and Total Cost of Ownership (TCO)
methods are not frequently used by public authorities. The most
commonly used criterion is still the purchasing cost (64%), followed by a mix of
the latter and LCC or TCO (30%); and finally, by the predominant use of
LCC/TCO (6%).
Many authorities face difficulties in including GPP criteria in
public procurement. On a 1 to 5 scale, the average level of perceived

STUDY – FWC B4/ENTR/08/006
Page 50 of 51
difficulty among all respondents is 3.06. Independent regulators and central
government respondents reported the highest levels of perceived difficulty.
In summary, the overall picture that emerges from our analysis is encouraging, but
a lot must still be done. On the one hand, we found encouraging evidence on the
rise of environmental concerns in public procurement, a development that the EU
has been advocating in the past decade.
Yet, in order to facilitate future monitoring exercises, we recommend the following
actions:
Further harmonization of terminologies, taxonomies, targets, and overall scope
of national GPP policies. The existing fragmentation – documented in the
previous sections of the report as well as in Adelphi (2011) makes monitoring
and implementation prohibitively difficult.
A number of EU core GPP criteria are rarely used in Member States. These
criteria should be reconsidered by the European Commission, together with
stakeholders. In terms of a responsive approach to regulation, there is a need to
look at the reasons for their limited uptake, which would then lead to a
reflection on whether these criteria should be removed from the list or further
promoted.
Awareness-raising and training initiatives should be promoted in all the EU27,
with specific reference to those countries that appear to be lagging behind in
terms of GPP uptake.
More coordination between the European Commission and Member States
would be highly desirable to improve the response rate in monitoring exercises.
As a matter of fact, some countries conduct their own surveys of green or
sustainable procurement, and these largely overlap with exercises like the one
contained in this study. Other countries seem to feature a very loose multi-level
coordination between central government and local/regional authorities, which
makes the statistical exercise all the more difficult.
Standardization of the questionnaire over time is also desirable, in order to
trigger “learning by doing” among responding authorities, thus reducing the
administrative burden generated by the survey. After all, it is difficult to
monitor the progress of GPP up-take if surveys are based on different questions
each time. We believe that the questionnaire used for the present study is the
most accurate used to date in this type of exercises: however, only the combined
effect of learning by doing and stronger coordination between the EU and

STUDY – FWC B4/ENTR/08/006
Page 51 of 51
Member States can help achieve accurate results without losing out in terms of
the response rate. In addition, it must be borne in mind that criteria are
regularly revised so that the definition of what is green is also changing over
time. Many of the 10 product groups included in this survey have been revised
in early 2012 which lead in many cases to more stringent criteria. Moreover, the
Clean Vehicles Directive (2009/33/EC)35 is making green procurement
mandatory to a certain degree. Similar obligations could follow if the proposed
Energy Efficiency Directive36 (COM/2011/0370 final, currently under
discussion) is adopted, thus requiring a new definition of what is green in these
fields.
35 http://eur-lex.europa.eu/LexUriServ/LexUriServ.do?uri=CELEX:32009L0033:EN:NOT 36 http://eur-lex.europa.eu/LexUriServ/LexUriServ.do?uri=CELEX:52011PC0370:EN:NOT