Embed Size (px)
Citation preview

State of New HampshireJohn H. Lynch, Governor
New Hampshire Employment SecurityGeorge N. Copadis, Commissioner
Economic and Labor Market Information BureauBruce R. DeMay, Director
November 2012
The Upper Valley – OnTheMapA profile of the Lebanon-Hanover NH-VT Micropolitan NECTA
The Upper Valley – OnTheMap
New Hampshire Employment Security, Economic and Labor Market Information Bureau
AcknowledgementsWe express our thanks to the U.S. Department of Labor, Employment and Training Administration whose support was instrumental in the production of this report.
We also express our thanks to the U.S. Census Bureau for developing the Longitudinal Employer-Household Dynamics program and supporting the federal-state Local Employment Dynamics (LED) Partnership. New time series data created under the LED Partnership provide information about America's jobs, workers, and local economies and communities. OnTheMap is a mapping and reporting application that displays workplace and residential distributions by user defi ned geographies with companion reports on worker and fi rm characteristics, employment and residential comparisons, worker fl ows, and commuting patterns.
The following New Hampshire Employment Security staff members were instrumental in producing this publication:
Economic and Labor Market Information Bureau
Amy Finamore, Labor Market Analyst Annette Nielsen, EconomistElisabeth Richardson, Informational/Web Site Representative
For further information contact:
Amy Finamore at (603) 228-4063, [email protected]
Economic and Labor Market Information BureauNew Hampshire Employment Security32 South Main StreetConcord, New Hampshire 03301
New Hampshire Employment Security, Economic and Labor Market Information Bureau 1New Hampshire Employment Security, Economic and Labor Market Information Bureau 1
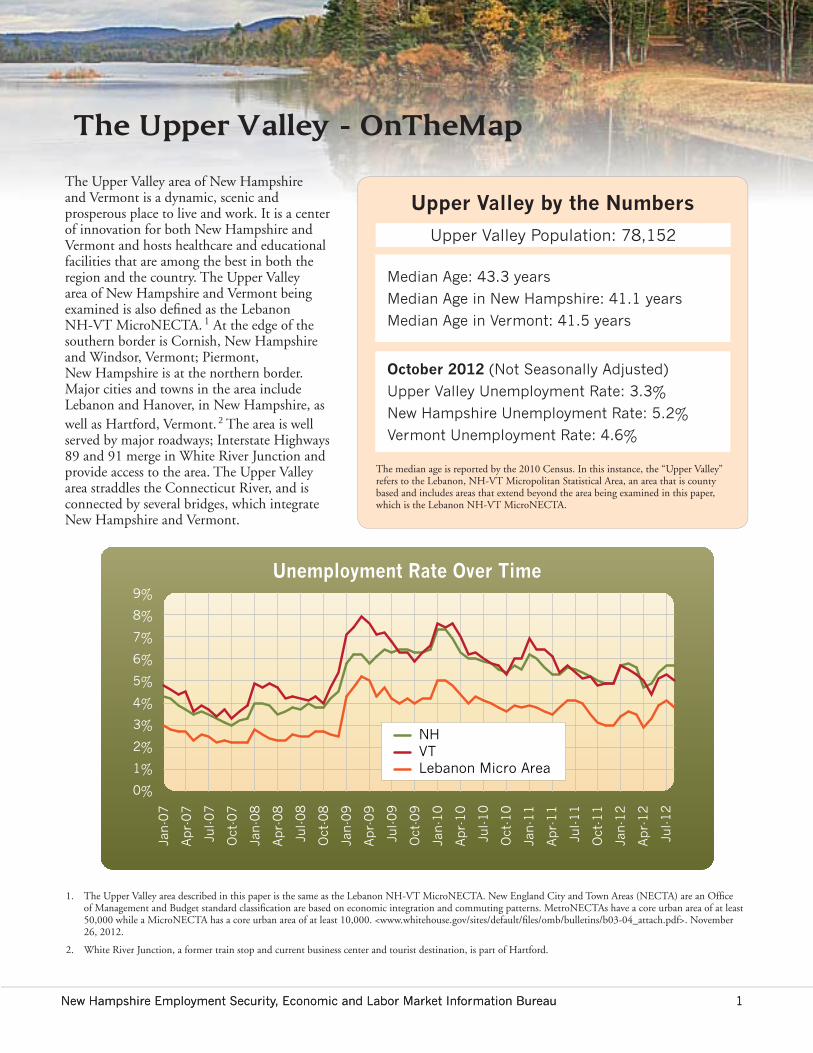
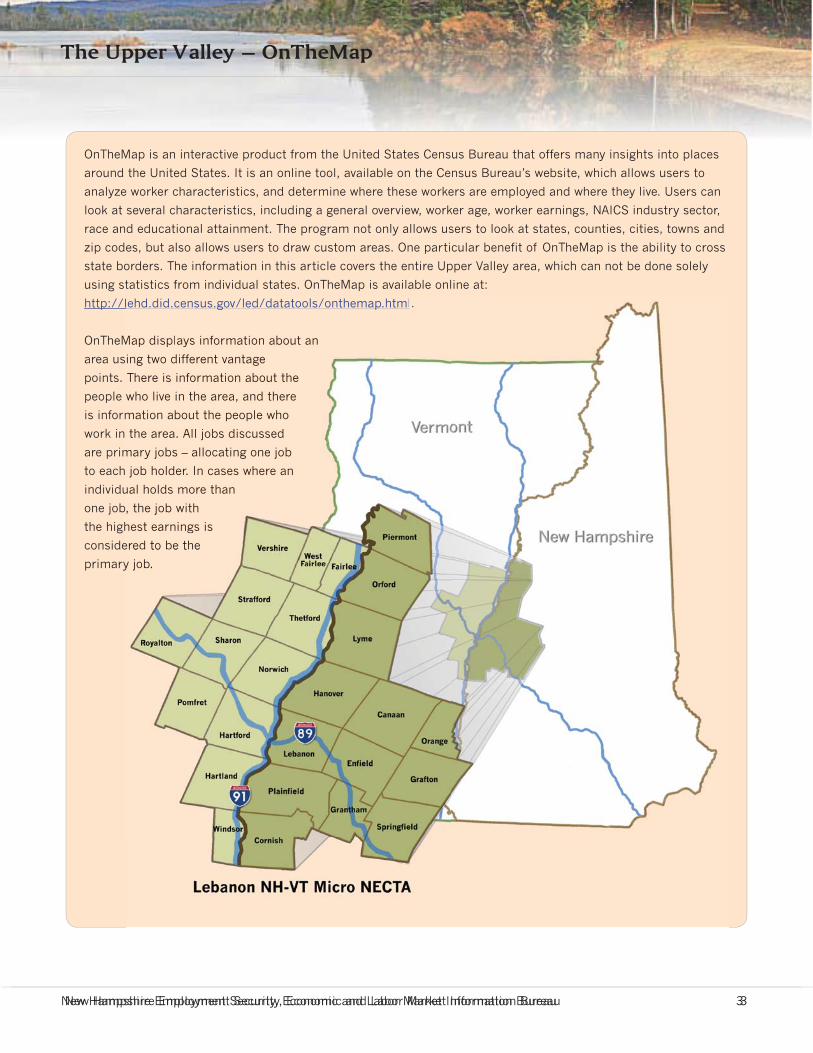
The Upper Valley area of New Hampshire and Vermont is a dynamic, scenic and prosperous place to live and work. It is a center of innovation for both New Hampshire and Vermont and hosts healthcare and educational facilities that are among the best in both the region and the country. The Upper Valley area of New Hampshire and Vermont being examined is also defi ned as the Lebanon NH-VT MicroNECTA. 1 At the edge of the southern border is Cornish, New Hampshire and Windsor, Vermont; Piermont, New Hampshire is at the northern border. Major cities and towns in the area include Lebanon and Hanover, in New Hampshire, as well as Hartford, Vermont. 2 The area is well served by major roadways; Interstate Highways 89 and 91 merge in White River Junction and provide access to the area. The Upper Valley area straddles the Connecticut River, and is connected by several bridges, which integrate New Hampshire and Vermont.
0%
1%
2%
3%
4%
5%
6%
7%
8%
9%
Jan-0
7
Apr-
07
Jul-07
Oct
-07
Jan-0
8
Apr-
08
Jul-08
Oct
-08
Jan-0
9
Apr-
09
Jul-09
Oct
-09
Jan-1
0
Apr-
10
Jul-10
Oct
-10
Jan-1
1
Apr-
11
Jul-11
Oct
-11
Jan-1
2
Apr-
12
Jul-12
NHVTLebanon Micro Area
Unemployment Rate Over Time
1. The Upper Valley area described in this paper is the same as the Lebanon NH-VT MicroNECTA. New England City and Town Areas (NECTA) are an Offi ce of Management and Budget standard classifi cation are based on economic integration and commuting patterns. MetroNECTAs have a core urban area of at least 50,000 while a MicroNECTA has a core urban area of at least 10,000. <www.whitehouse.gov/sites/default/fi les/omb/bulletins/b03-04_attach.pdf>. November 26, 2012.
2. White River Junction, a former train stop and current business center and tourist destination, is part of Hartford.
Upper Valley by the Numbers
Median Age: 43.3 years
Median Age in New Hampshire: 41.1 years
Median Age in Vermont: 41.5 years
October 2012 (Not Seasonally Adjusted)
Upper Valley Unemployment Rate: 3.3%
New Hampshire Unemployment Rate: 5.2%
Vermont Unemployment Rate: 4.6%
The median age is reported by the 2010 Census. In this instance, the “Upper Valley” refers to the Lebanon, NH-VT Micropolitan Statistical Area, an area that is county based and includes areas that extend beyond the area being examined in this paper, which is the Lebanon NH-VT MicroNECTA.
Upper Valley Population: 78,152
The Upper Valley - OnTheMap
The Upper Valley – OnTheMap
2 New Hampshire Employment Security, Economic and Labor Market Information Bureau
3. Additional factors infl uencing the choice of the Upper Valley include the distance from the Upper Valley to Massachusetts and the fact that the number of residents commuting into Massachusetts is limited. While OnTheMap is able to provide information about individuals working in New Hampshire and Vermont, at this time it is unable to provide information about individuals working in Massachusetts. Currently, then, individuals who live in Massachusetts and work in New Hampshire and Vermont are recognized and accounted for, but individuals who live in New Hampshire or Vermont and work in Massachusetts are not. This undercounts, for example, the number of primary jobs held by residents in the southern counties of New Hampshire, notably Hillsborough and Rockingham. By performing analysis on the Upper Valley area of New Hampshire, this issue is largely avoided. Data also do not include the self-employed.
The Upper Valley is home to Dartmouth College, Dartmouth-Hitchcock Medical Center, and the White River Junction Veterans Administration Medical Center. These institutions are beacons of the local economy and the community. The Upper Valley has a variety of job opportunities, low population density, plenty of recreational and shopping activities, an airport, and excellent healthcare services. In addition, wages in the area are higher than statewide rates of either state. Overall, the Upper Valley is known for being a nice place to live and work. The area’s low unemployment rate refl ects the
strong economy in the Upper Valley, and is consistently lower than the statewide rates of both New Hampshire and Vermont.
The Upper Valley is an excellent example of the OnTheMap capability. Industry employment, wages, education levels and worker demographics are some of the variables a user can examine using OnTheMap. For this OnTheMap analysis, both the Upper Valley and selected towns within the Upper Valley are examined. 3
The Upper Valley – OnTheMap
New Hampshire Employment Security, Economic and Labor Market Information Bureau 3New Hampshire Employment Security, Economic and Labor Market Information Bureau 3
OnTheMap is an interactive product from the United States Census Bureau that offers many insights into places
around the United States. It is an online tool, available on the Census Bureau’s website, which allows users to
analyze worker characteristics, and determine where these workers are employed and where they live. Users can
look at several characteristics, including a general overview, worker age, worker earnings, NAICS industry sector,
race and educational attainment. The program not only allows users to look at states, counties, cities, towns and
zip codes, but also allows users to draw custom areas. One particular benefit of OnTheMap is the ability to cross
state borders. The information in this article covers the entire Upper Valley area, which can not be done solely
using statistics from individual states. OnTheMap is available online at:
http://lehd.did.census.gov/led/datatools/onthemap.html.
OnTheMap displays information about an
area using two different vantage
points. There is information about the
people who live in the area, and there
is information about the people who
work in the area. All jobs discussed
are primary jobs – allocating one job
to each job holder. In cases where an
individual holds more than
one job, the job with
the highest earnings is
considered to be the
primary job.
ehd.did.census.gov/led/datatools/onthemap.htmlg p .
Map displays information about an
ing two different vantage
There is information about the
who live in the area, and there
mation about the people who
the area. All jobs discussed
mary jobs – allocating one job
job holder. In cases where an
ual holds more than
, the job with
hest earnings is
ered to be the
y job.
The Upper Valley – OnTheMap
4 New Hampshire Employment Security, Economic and Labor Market Information Bureau
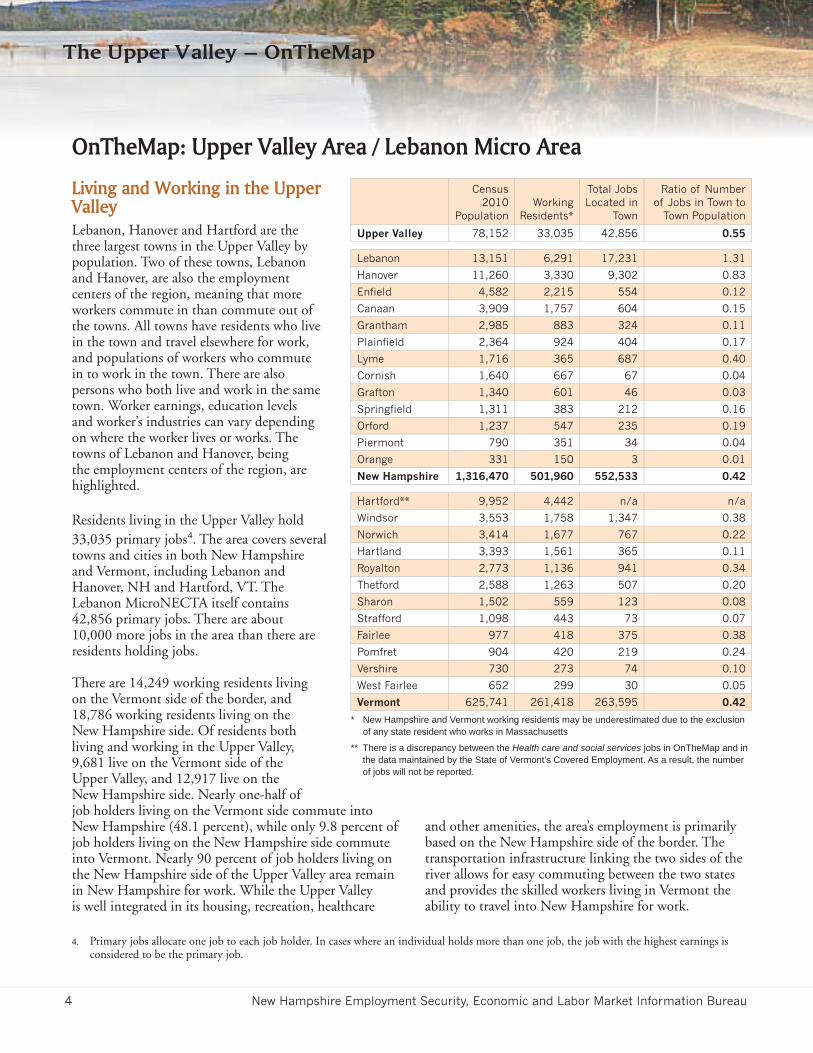
Living and Working in the Upper ValleyLebanon, Hanover and Hartford are the three largest towns in the Upper Valley by population. Two of these towns, Lebanon and Hanover, are also the employment centers of the region, meaning that more workers commute in than commute out of the towns. All towns have residents who live in the town and travel elsewhere for work, and populations of workers who commute in to work in the town. There are also persons who both live and work in the same town. Worker earnings, education levels and worker’s industries can vary depending on where the worker lives or works. The towns of Lebanon and Hanover, being the employment centers of the region, are highlighted.
Residents living in the Upper Valley hold 33,035 primary jobs 4. The area covers several towns and cities in both New Hampshire and Vermont, including Lebanon and Hanover, NH and Hartford, VT. The Lebanon MicroNECTA itself contains 42,856 primary jobs. There are about 10,000 more jobs in the area than there are residents holding jobs.
There are 14,249 working residents living on the Vermont side of the border, and 18,786 working residents living on the New Hampshire side. Of residents both living and working in the Upper Valley, 9,681 live on the Vermont side of the Upper Valley, and 12,917 live on the New Hampshire side. Nearly one-half of job holders living on the Vermont side commute into New Hampshire (48.1 percent), while only 9.8 percent of job holders living on the New Hampshire side commute into Vermont. Nearly 90 percent of job holders living on the New Hampshire side of the Upper Valley area remain in New Hampshire for work. While the Upper Valley is well integrated in its housing, recreation, healthcare
OnTheMap: Upper Valley Area / Lebanon Micro Area
and other amenities, the area’s employment is primarily based on the New Hampshire side of the border. The transportation infrastructure linking the two sides of the river allows for easy commuting between the two states and provides the skilled workers living in Vermont the ability to travel into New Hampshire for work.
Census 2010
PopulationWorking
Residents*
Total Jobs Located in
Town
Ratio of Number of Jobs in Town to
Town Population
Upper Valley 78,152 33,035 42,856 0.55
Lebanon 13,151 6,291 17,231 1.31
Hanover 11,260 3,330 9,302 0.83
Enfield 4,582 2,215 554 0.12
Canaan 3,909 1,757 604 0.15
Grantham 2,985 883 324 0.11
Plainfield 2,364 924 404 0.17
Lyme 1,716 365 687 0.40
Cornish 1,640 667 67 0.04
Grafton 1,340 601 46 0.03
Springfield 1,311 383 212 0.16
Orford 1,237 547 235 0.19
Piermont 790 351 34 0.04
Orange 331 150 3 0.01
New Hampshire 1,316,470 501,960 552,533 0.42
Hartford** 9,952 4,442 n/a n/a
Windsor 3,553 1,758 1,347 0.38
Norwich 3,414 1,677 767 0.22
Hartland 3,393 1,561 365 0.11
Royalton 2,773 1,136 941 0.34
Thetford 2,588 1,263 507 0.20
Sharon 1,502 559 123 0.08
Strafford 1,098 443 73 0.07
Fairlee 977 418 375 0.38
Pomfret 904 420 219 0.24
Vershire 730 273 74 0.10
West Fairlee 652 299 30 0.05
Vermont 625,741 261,418 263,595 0.42
* New Hampshire and Vermont working residents may be underestimated due to the exclusion of any state resident who works in Massachusetts
** There is a discrepancy between the Health care and social services jobs in OnTheMap and in the data maintained by the State of Vermont’s Covered Employment. As a result, the number of jobs will not be reported.
4. Primary jobs allocate one job to each job holder. In cases where an individual holds more than one job, the job with the highest earnings is considered to be the primary job.
The Upper Valley – OnTheMap
New Hampshire Employment Security, Economic and Labor Market Information Bureau 5
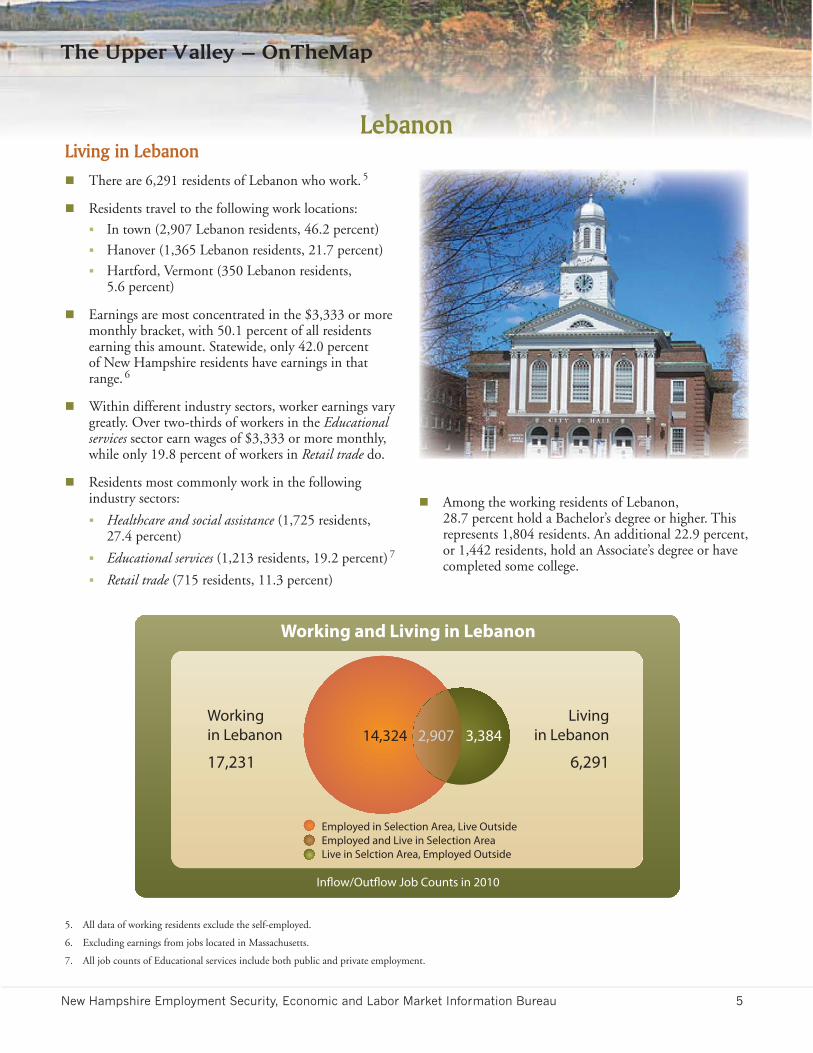
Living in Lebanon There are 6,291 residents of Lebanon who work. 5
Residents travel to the following work locations:
In town (2,907 Lebanon residents, 46.2 percent)
Hanover (1,365 Lebanon residents, 21.7 percent)
Hartford, Vermont (350 Lebanon residents, 5.6 percent)
Earnings are most concentrated in the $3,333 or more monthly bracket, with 50.1 percent of all residents earning this amount. Statewide, only 42.0 percent of New Hampshire residents have earnings in that range. 6
Within different industry sectors, worker earnings vary greatly. Over two-thirds of workers in the Educational services sector earn wages of $3,333 or more monthly, while only 19.8 percent of workers in Retail trade do.
Residents most commonly work in the following industry sectors:
Healthcare and social assistance (1,725 residents, 27.4 percent)
Educational services (1,213 residents, 19.2 percent) 7
Retail trade (715 residents, 11.3 percent)
Among the working residents of Lebanon, 28.7 percent hold a Bachelor’s degree or higher. This represents 1,804 residents. An additional 22.9 percent, or 1,442 residents, hold an Associate’s degree or have completed some college.
Inflow/Outflow Job Counts in 2010
Working and Living in Lebanon
Employed in Selection Area, Live OutsideEmployed and Live in Selection AreaLive in Selction Area, Employed Outside
14,324Working in Lebanon
17,231
Livingin Lebanon
6,291
2,907 3,384
5. All data of working residents exclude the self-employed.
6. Excluding earnings from jobs located in Massachusetts.
7. All job counts of Educational services include both public and private employment.
Lebanon
The Upper Valley – OnTheMap
6 New Hampshire Employment Security, Economic and Labor Market Information Bureau
Working in Lebanon There are 17,231 primary jobs located in Lebanon.
Workers commute in from the following locations:
In town (2,907 workers, 16.9 percent)
Hartford, VT (1,109 Hartford residents working in Lebanon, 6.4 percent)
Enfi eld, NH (943 Enfi eld residents working in Lebanon, 5.5 percent)
Workers come from as far as Manchester, Dover, Merrimack, and Salem, NH.
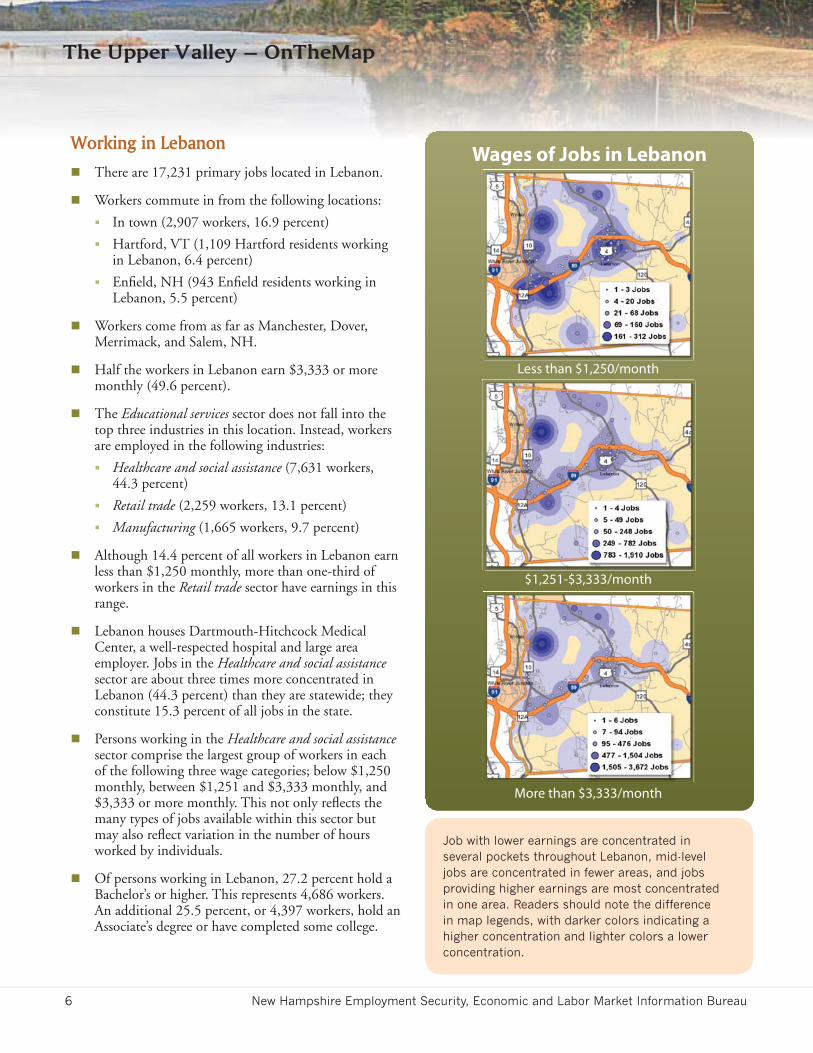
Half the workers in Lebanon earn $3,333 or more monthly (49.6 percent).
The Educational services sector does not fall into the top three industries in this location. Instead, workers are employed in the following industries:
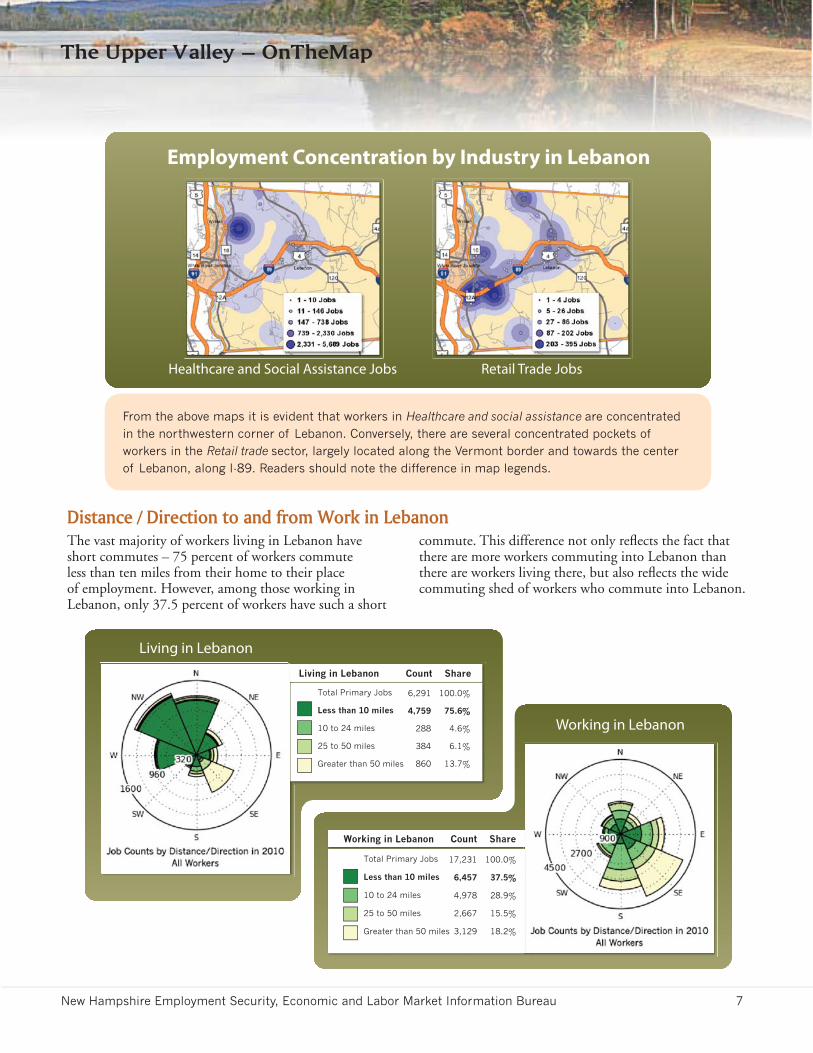
Healthcare and social assistance (7,631 workers, 44.3 percent)
Retail trade (2,259 workers, 13.1 percent)
Manufacturing (1,665 workers, 9.7 percent)
Although 14.4 percent of all workers in Lebanon earn less than $1,250 monthly, more than one-third of workers in the Retail trade sector have earnings in this range.
Lebanon houses Dartmouth-Hitchcock Medical Center, a well-respected hospital and large area employer. Jobs in the Healthcare and social assistance sector are about three times more concentrated in Lebanon (44.3 percent) than they are statewide; they constitute 15.3 percent of all jobs in the state.
Persons working in the Healthcare and social assistance sector comprise the largest group of workers in each of the following three wage categories; below $1,250 monthly, between $1,251 and $3,333 monthly, and $3,333 or more monthly. This not only refl ects the many types of jobs available within this sector but may also refl ect variation in the number of hours worked by individuals.
Of persons working in Lebanon, 27.2 percent hold a Bachelor’s or higher. This represents 4,686 workers. An additional 25.5 percent, or 4,397 workers, hold an Associate’s degree or have completed some college.
Job with lower earnings are concentrated in several pockets throughout Lebanon, mid-level jobs are concentrated in fewer areas, and jobs providing higher earnings are most concentrated in one area. Readers should note the difference in map legends, with darker colors indicating a higher concentration and lighter colors a lower concentration.
Less than $1,250/month
$1,251-$3,333/month
More than $3,333/month
Wages of Jobs in Lebanon
The Upper Valley – OnTheMap
New Hampshire Employment Security, Economic and Labor Market Information Bureau 7
From the above maps it is evident that workers in Healthcare and social assistance are concentrated in the northwestern corner of Lebanon. Conversely, there are several concentrated pockets of workers in the Retail trade sector, largely located along the Vermont border and towards the center of Lebanon, along I-89. Readers should note the difference in map legends.
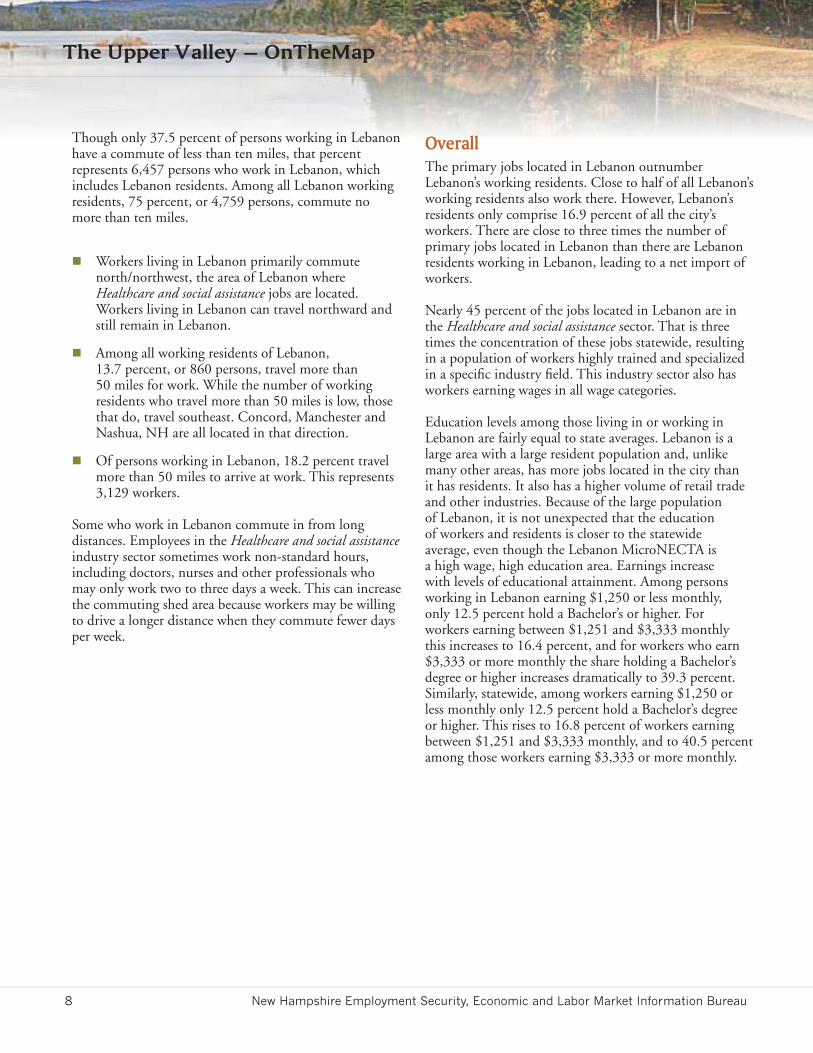
Living in Lebanon
Working in Lebanon
Count Share
Total Primary Jobs
Living in Lebanon
Working in Lebanon
6,291 100.0%
Less than 10 miles 4,759 75.6%
10 to 24 miles 288 4.6%
25 to 50 miles 384 6.1%
Greater than 50 miles 860 13.7%
Count Share
Total Primary Jobs 17,231 100.0%
Less than 10 miles 6,457 37.5%
10 to 24 miles 4,978 28.9%
25 to 50 miles 2,667 15.5%
Greater than 50 miles 3,129 18.2%
Employment Concentration by Industry in Lebanon
Healthcare and Social Assistance Jobs Retail Trade Jobs
Distance / Direction to and from Work in Lebanoncommute. This difference not only refl ects the fact that there are more workers commuting into Lebanon than there are workers living there, but also refl ects the wide commuting shed of workers who commute into Lebanon.
The vast majority of workers living in Lebanon have short commutes – 75 percent of workers commute less than ten miles from their home to their place of employment. However, among those working in Lebanon, only 37.5 percent of workers have such a short
The Upper Valley – OnTheMap
8 New Hampshire Employment Security, Economic and Labor Market Information Bureau
Though only 37.5 percent of persons working in Lebanon have a commute of less than ten miles, that percent represents 6,457 persons who work in Lebanon, which includes Lebanon residents. Among all Lebanon working residents, 75 percent, or 4,759 persons, commute no more than ten miles.
Workers living in Lebanon primarily commute north/northwest, the area of Lebanon where Healthcare and social assistance jobs are located. Workers living in Lebanon can travel northward and still remain in Lebanon.
Among all working residents of Lebanon, 13.7 percent, or 860 persons, travel more than 50 miles for work. While the number of working residents who travel more than 50 miles is low, those that do, travel southeast. Concord, Manchester and Nashua, NH are all located in that direction.
Of persons working in Lebanon, 18.2 percent travel more than 50 miles to arrive at work. This represents 3,129 workers.
Some who work in Lebanon commute in from long distances. Employees in the Healthcare and social assistance industry sector sometimes work non-standard hours, including doctors, nurses and other professionals who may only work two to three days a week. This can increase the commuting shed area because workers may be willing to drive a longer distance when they commute fewer days per week.
OverallThe primary jobs located in Lebanon outnumber Lebanon’s working residents. Close to half of all Lebanon’s working residents also work there. However, Lebanon’s residents only comprise 16.9 percent of all the city’s workers. There are close to three times the number of primary jobs located in Lebanon than there are Lebanon residents working in Lebanon, leading to a net import of workers.
Nearly 45 percent of the jobs located in Lebanon are in the Healthcare and social assistance sector. That is three times the concentration of these jobs statewide, resulting in a population of workers highly trained and specialized in a specifi c industry fi eld. This industry sector also has workers earning wages in all wage categories.
Education levels among those living in or working in Lebanon are fairly equal to state averages. Lebanon is a large area with a large resident population and, unlike many other areas, has more jobs located in the city than it has residents. It also has a higher volume of retail trade and other industries. Because of the large population of Lebanon, it is not unexpected that the education of workers and residents is closer to the statewide average, even though the Lebanon MicroNECTA is a high wage, high education area. Earnings increase with levels of educational attainment. Among persons working in Lebanon earning $1,250 or less monthly, only 12.5 percent hold a Bachelor’s or higher. For workers earning between $1,251 and $3,333 monthly this increases to 16.4 percent, and for workers who earn $3,333 or more monthly the share holding a Bachelor’s degree or higher increases dramatically to 39.3 percent. Similarly, statewide, among workers earning $1,250 or less monthly only 12.5 percent hold a Bachelor’s degree or higher. This rises to 16.8 percent of workers earning between $1,251 and $3,333 monthly, and to 40.5 percent among those workers earning $3,333 or more monthly.
The Upper Valley – OnTheMap
New Hampshire Employment Security, Economic and Labor Market Information Bureau 9
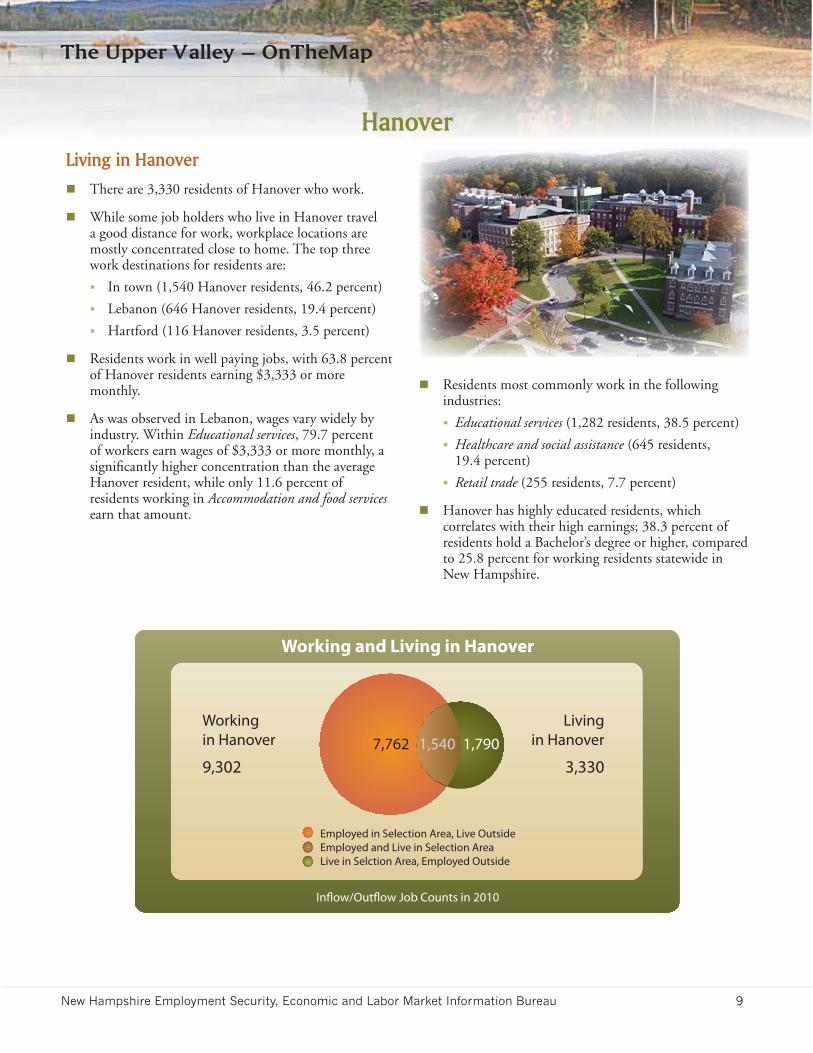
Living in Hanover There are 3,330 residents of Hanover who work.
While some job holders who live in Hanover travel a good distance for work, workplace locations are mostly concentrated close to home. The top three work destinations for residents are:
In town (1,540 Hanover residents, 46.2 percent)
Lebanon (646 Hanover residents, 19.4 percent)
Hartford (116 Hanover residents, 3.5 percent)
Residents work in well paying jobs, with 63.8 percent of Hanover residents earning $3,333 or more monthly.
As was observed in Lebanon, wages vary widely by industry. Within Educational services, 79.7 percent of workers earn wages of $3,333 or more monthly, a signifi cantly higher concentration than the average Hanover resident, while only 11.6 percent of residents working in Accommodation and food services earn that amount.
Hanover
Residents most commonly work in the following industries:
Educational services (1,282 residents, 38.5 percent)
Healthcare and social assistance (645 residents, 19.4 percent)
Retail trade (255 residents, 7.7 percent)
Hanover has highly educated residents, which correlates with their high earnings; 38.3 percent of residents hold a Bachelor’s degree or higher, compared to 25.8 percent for working residents statewide in New Hampshire.
Inflow/Outflow Job Counts in 2010
Working and Living in Hanover
Employed in Selection Area, Live OutsideEmployed and Live in Selection AreaLive in Selction Area, Employed Outside
7,762 1,540 1,790Working in Hanover
9,302
Livingin Hanover
3,330
The Upper Valley – OnTheMap
10 New Hampshire Employment Security, Economic and Labor Market Information Bureau
Working in Hanover There are 9,302 primary jobs located in Hanover.
Workers commute into Hanover from a variety of locations. Some travel in from Keene and Concord, NH. The three towns with the most residents working in Hanover are:
In town (1,540 residents working in Hanover, 16.6 percent)
Lebanon (1,365 Lebanon residents working in Hanover, 14.7 percent)
Hartford, VT (635 Hartford residents working in Hanover, 6.8 percent)
Jobs located in Hanover differ from the largest industries in both the Upper Valley and the state. The largest industries are:
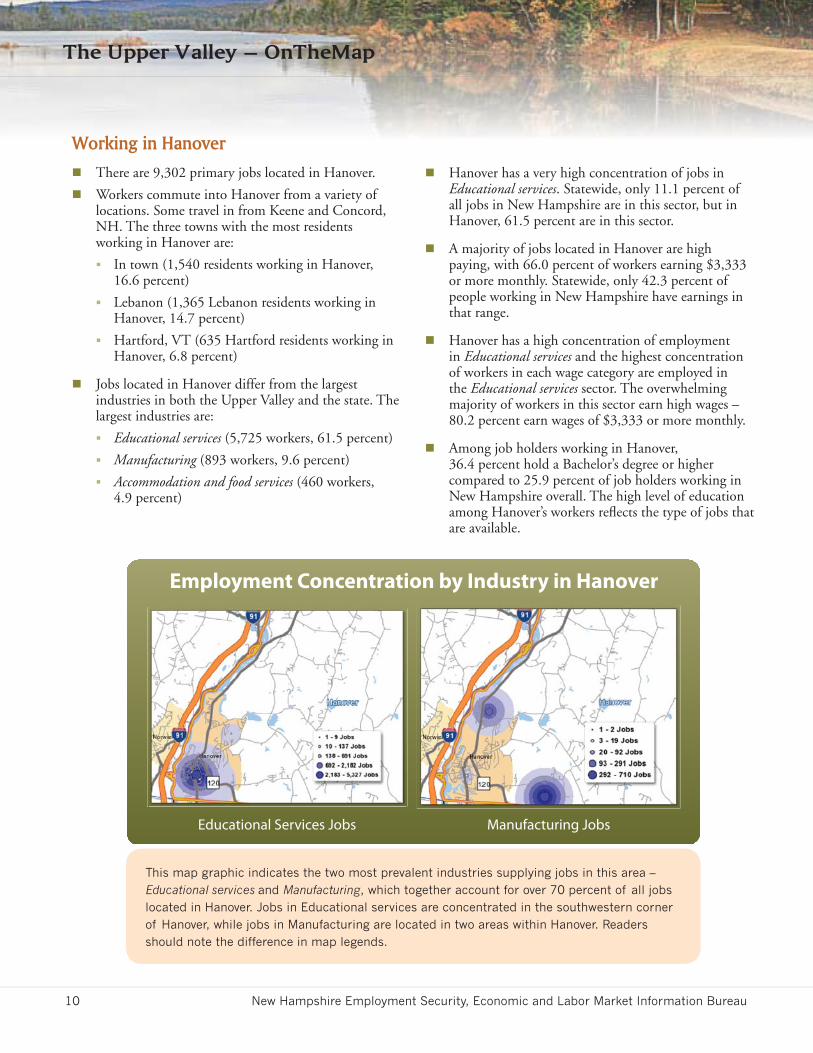
Educational services (5,725 workers, 61.5 percent)
Manufacturing (893 workers, 9.6 percent)
Accommodation and food services (460 workers, 4.9 percent)
Hanover has a very high concentration of jobs in Educational services. Statewide, only 11.1 percent of all jobs in New Hampshire are in this sector, but in Hanover, 61.5 percent are in this sector.
A majority of jobs located in Hanover are high paying, with 66.0 percent of workers earning $3,333 or more monthly. Statewide, only 42.3 percent of people working in New Hampshire have earnings in that range.
Hanover has a high concentration of employment in Educational services and the highest concentration of workers in each wage category are employed in the Educational services sector. The overwhelming majority of workers in this sector earn high wages – 80.2 percent earn wages of $3,333 or more monthly.
Among job holders working in Hanover, 36.4 percent hold a Bachelor’s degree or higher compared to 25.9 percent of job holders working in New Hampshire overall. The high level of education among Hanover’s workers refl ects the type of jobs that are available.
Educational Services Jobs Manufacturing Jobs
Employment Concentration by Industry in Hanover
This map graphic indicates the two most prevalent industries supplying jobs in this area – Educational services and Manufacturing, which together account for over 70 percent of all jobs located in Hanover. Jobs in Educational services are concentrated in the southwestern corner of Hanover, while jobs in Manufacturing are located in two areas within Hanover. Readers should note the difference in map legends.
The Upper Valley – OnTheMap
New Hampshire Employment Security, Economic and Labor Market Information Bureau 11
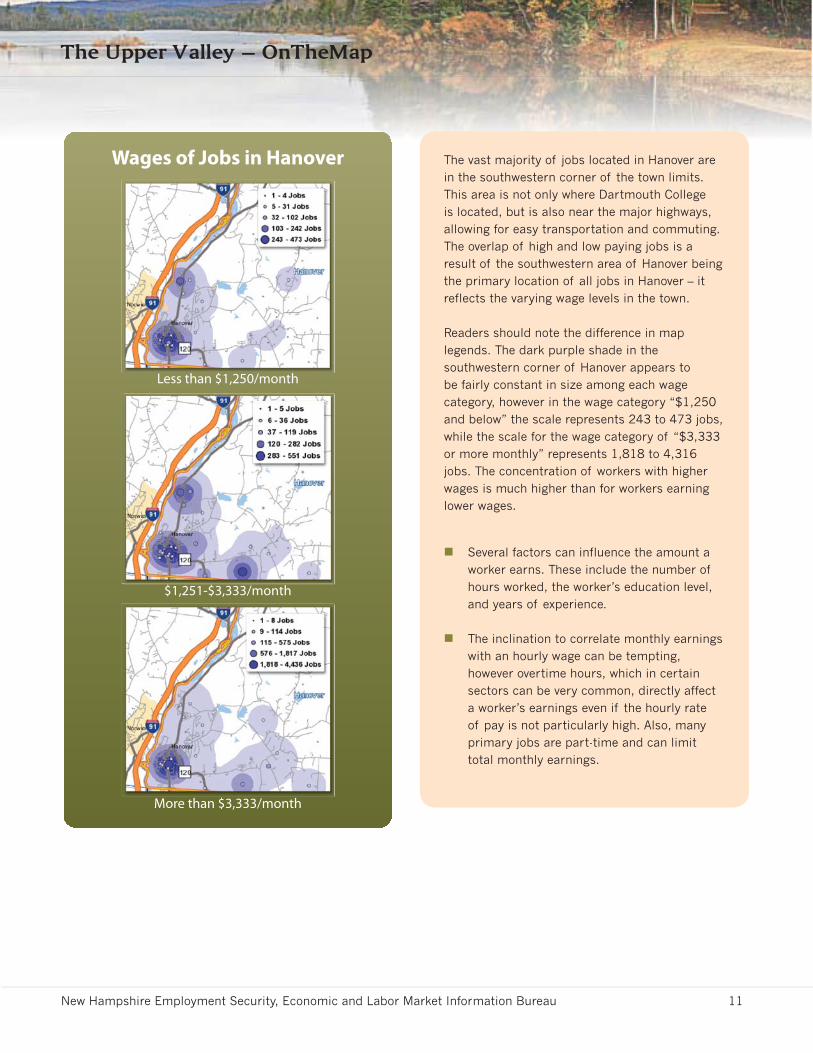
The vast majority of jobs located in Hanover are in the southwestern corner of the town limits. This area is not only where Dartmouth College is located, but is also near the major highways, allowing for easy transportation and commuting. The overlap of high and low paying jobs is a result of the southwestern area of Hanover being the primary location of all jobs in Hanover – it reflects the varying wage levels in the town.
Readers should note the difference in map legends. The dark purple shade in the southwestern corner of Hanover appears to be fairly constant in size among each wage category, however in the wage category “$1,250 and below” the scale represents 243 to 473 jobs, while the scale for the wage category of “$3,333 or more monthly” represents 1,818 to 4,316 jobs. The concentration of workers with higher wages is much higher than for workers earning lower wages.
Several factors can influence the amount a worker earns. These include the number of hours worked, the worker’s education level, and years of experience.
The inclination to correlate monthly earnings with an hourly wage can be tempting, however overtime hours, which in certain sectors can be very common, directly affect a worker’s earnings even if the hourly rate of pay is not particularly high. Also, many primary jobs are part-time and can limit total monthly earnings.
Less than $1,250/month
$1,251-$3,333/month
More than $3,333/month
Wages of Jobs in Hanover

The Upper Valley – OnTheMap
12 New Hampshire Employment Security, Economic and Labor Market Information Bureau
Distance / Direction To and From Work in Hanover
The left side of the chart highlights the commutes of workers who live in Hanover. Though it appears that workers living in Hanover are commuting southwest away from Hanover, the major concentration of jobs is in the most southwestern corner of town, with residential areas to the northeast. The chart includes residents of Hanover who are commuting within Hanover.
Living in Hanover
Working in Hanover
Count Share
Total Primary Jobs
Living in Hanover
Working in Hanover
3,330 100.0%
Less than 10 miles 2,347 70.5%
10 to 24 miles 136 4.1%
25 to 50 miles 123 3.7%
Greater than 50 miles 724 21.7%
Count Share
Total Primary Jobs 9,302 100.0%
Less than 10 miles 4,740 51.0%
10 to 24 miles 2,454 26.4%
25 to 50 miles 941 10.1%
Greater than 50 miles 1,167 12.5%
Similar to those living in Hanover, the majority of people working in Hanover drive less than ten miles to work. However, 70 percent of workers living in Hanover drive less than ten miles to their workplace and only 51 percent of those working in Hanover have a commute of less than ten miles.
Differences become apparent when the counts of workers are considered. Among persons working in Hanover, 4,740 commute to Hanover, driving less than ten miles. An additional 1,167, or 12.5 percent of all persons working in Hanover, drive more than 50 miles.
Of the 3,330 workers living in Hanover, 2,347 commute within ten miles of their home, while 724, or 21.7 percent, drive more than 50 miles to work.
Hanover is a job center, as evidenced by the fact that at any given distance more workers commute in to Hanover than commute out.
It is useful to note that statewide, the median home price in 2011 was $207,000. The 2011 median home price in Hanover was $440,000. 8 The high median price essentially precludes many workers from owning homes in the town. It may help explain why the vast majority of those living in Hanover have short commutes – these workers can afford to live near their workplace.
8. New Hampshire Housing Finance Authority. New Hampshire Housing Data. Purchase Price Data: Median Purchase Price 2011. <nhhousingdata.nhhfa.org/diveport#page=a0036>. Accessed November 26, 2012.
The Upper Valley – OnTheMap
New Hampshire Employment Security, Economic and Labor Market Information Bureau 13
Overall As one of the employment centers in the Upper Valley, the number of jobs located in Hanover greatly outnumbers the working residents of Hanover. This leads to a net import of workers. There are 3,330 working residents in Hanover, 1,540 of whom work in town, and 7,762 workers living elsewhere who commute to Hanover for work.
Hanover is notable because of its low proportion of residents who hold jobs. Statewide, 38 percent of residents hold jobs. In neighboring Lebanon, nearly half (47 percent) of all residents hold jobs. In Hanover, only 29.6 percent of residents work. The residence of college students in the town greatly impacts the composition of the worker population. Hanover residents aged 29 and younger account for 58.1 percent of the town’s population; however they only account for 16.5 percent of its job holders. Even though residents aged 30-54 make
up less than 20 percent of the town’s total population, they constitute a majority of job holders. The age group 29 and below constitutes a lower percentage of job holders in Hanover than they do statewide. Additionally, while the median age statewide in New Hampshire is 41.1 years, in Hanover the median age is 23 years, indicating a very young population. It should, however, be noted that students who are employed in a work-study program are not included in job counts.
A large share of jobs located in Hanover require high educational experience. The Educational services industry sector is well known for education and skill requirements. The Manufacturing sector, the second largest industry in Hanover, not only has high wages but high skills, and has strong educational requirements. Additionally, the fact that home prices in Hanover are more than twice that of the median home price statewide can affect the makeup of its town residents.
The Upper Valley – OnTheMap
14 New Hampshire Employment Security, Economic and Labor Market Information Bureau
Hartford and Norwich, Vermont
An indication of the strong economy of the Upper Valley is that a large percentage of workers on the Vermont side of the Upper Valley commute into Lebanon and Hanover for work. A large percentage of Hartford and Norwich, Vermont residents also work in the Healthcare and social assistance and the Educational services sectors. Conversely, a signifi cantly smaller percentage of New Hampshire residents living in the Upper Valley cross the border into Vermont for work.
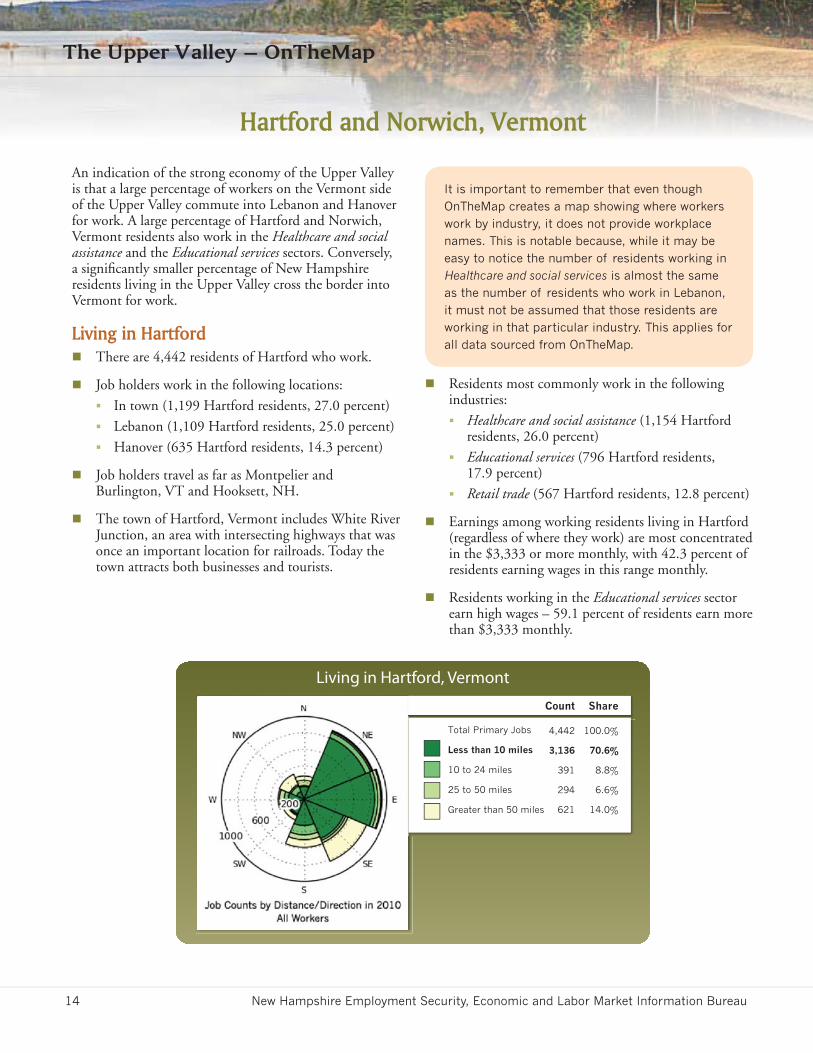
Living in Hartford There are 4,442 residents of Hartford who work.
Job holders work in the following locations:
In town (1,199 Hartford residents, 27.0 percent)
Lebanon (1,109 Hartford residents, 25.0 percent)
Hanover (635 Hartford residents, 14.3 percent)
Job holders travel as far as Montpelier and Burlington, VT and Hooksett, NH.
The town of Hartford, Vermont includes White River Junction, an area with intersecting highways that was once an important location for railroads. Today the town attracts both businesses and tourists.
Living in Hartford, Vermont
Count Share
Total Primary Jobs 4,442 100.0%
Less than 10 miles 3,136 70.6%
10 to 24 miles 391 8.8%
25 to 50 miles 294 6.6%
Greater than 50 miles 621 14.0%
It is important to remember that even though OnTheMap creates a map showing where workers work by industry, it does not provide workplace names. This is notable because, while it may be easy to notice the number of residents working in Healthcare and social services is almost the same as the number of residents who work in Lebanon, it must not be assumed that those residents are working in that particular industry. This applies for all data sourced from OnTheMap.
Residents most commonly work in the following industries:
Healthcare and social assistance (1,154 Hartford residents, 26.0 percent)
Educational services (796 Hartford residents, 17.9 percent)
Retail trade (567 Hartford residents, 12.8 percent)
Earnings among working residents living in Hartford (regardless of where they work) are most concentrated in the $3,333 or more monthly, with 42.3 percent of residents earning wages in this range monthly.
Residents working in the Educational services sector earn high wages – 59.1 percent of residents earn more than $3,333 monthly.
The Upper Valley – OnTheMap
New Hampshire Employment Security, Economic and Labor Market Information Bureau 15
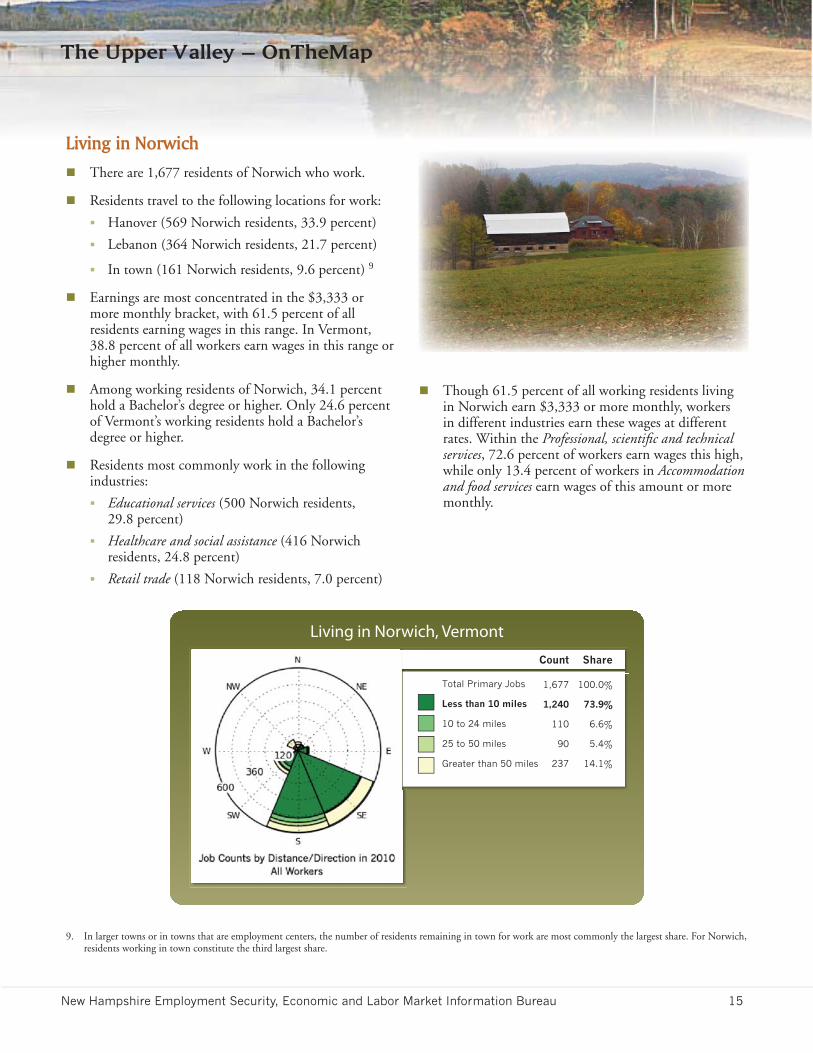
Living in Norwich There are 1,677 residents of Norwich who work.
Residents travel to the following locations for work:
Hanover (569 Norwich residents, 33.9 percent)
Lebanon (364 Norwich residents, 21.7 percent)
In town (161 Norwich residents, 9.6 percent) 9
Earnings are most concentrated in the $3,333 or more monthly bracket, with 61.5 percent of all residents earning wages in this range. In Vermont, 38.8 percent of all workers earn wages in this range or higher monthly.
Among working residents of Norwich, 34.1 percent hold a Bachelor’s degree or higher. Only 24.6 percent of Vermont’s working residents hold a Bachelor’s degree or higher.
Residents most commonly work in the following industries:
Educational services (500 Norwich residents, 29.8 percent)
Healthcare and social assistance (416 Norwich residents, 24.8 percent)
Retail trade (118 Norwich residents, 7.0 percent)
Though 61.5 percent of all working residents living in Norwich earn $3,333 or more monthly, workers in different industries earn these wages at different rates. Within the Professional, scientifi c and technical services, 72.6 percent of workers earn wages this high, while only 13.4 percent of workers in Accommodation and food services earn wages of this amount or more monthly.
9. In larger towns or in towns that are employment centers, the number of residents remaining in town for work are most commonly the largest share. For Norwich, residents working in town constitute the third largest share.
Living in Norwich, Vermont
Count Share
Total Primary Jobs 1,677 100.0%
Less than 10 miles 1,240 73.9%
10 to 24 miles 110 6.6%
25 to 50 miles 90 5.4%
Greater than 50 miles 237 14.1%
The Upper Valley – OnTheMap
16 New Hampshire Employment Security, Economic and Labor Market Information Bureau
Worker inflow and outflow in a non-employment center town
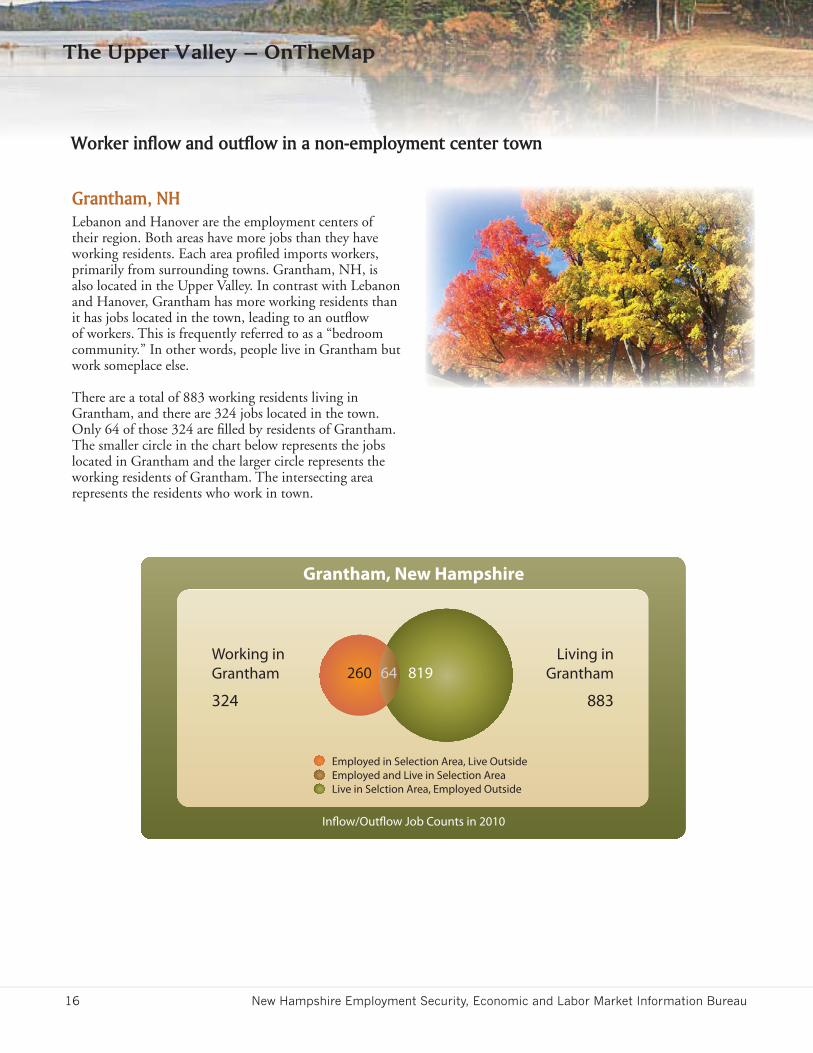
Grantham, NHLebanon and Hanover are the employment centers of their region. Both areas have more jobs than they have working residents. Each area profi led imports workers, primarily from surrounding towns. Grantham, NH, is also located in the Upper Valley. In contrast with Lebanon and Hanover, Grantham has more working residents than it has jobs located in the town, leading to an outfl ow of workers. This is frequently referred to as a “bedroom community.” In other words, people live in Grantham but work someplace else.
There are a total of 883 working residents living in Grantham, and there are 324 jobs located in the town. Only 64 of those 324 are fi lled by residents of Grantham. The smaller circle in the chart below represents the jobs located in Grantham and the larger circle represents the working residents of Grantham. The intersecting area represents the residents who work in town.
Inflow/Outflow Job Counts in 2010
Grantham, New Hampshire
Employed in Selection Area, Live OutsideEmployed and Live in Selection AreaLive in Selction Area, Employed Outside
Working in Grantham
324
Living inGrantham
883
260 64 819
The Upper Valley – OnTheMap
New Hampshire Employment Security, Economic and Labor Market Information Bureau 17
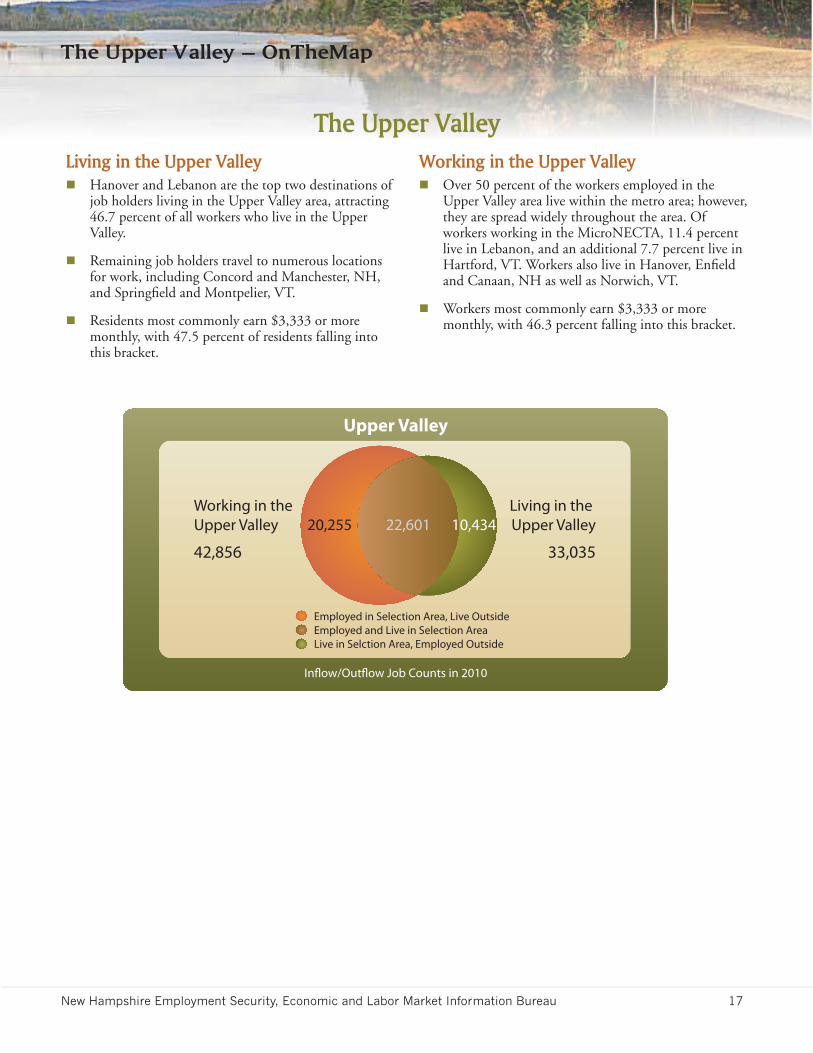
Working in the Upper Valley Over 50 percent of the workers employed in the
Upper Valley area live within the metro area; however, they are spread widely throughout the area. Of workers working in the MicroNECTA, 11.4 percent live in Lebanon, and an additional 7.7 percent live in Hartford, VT. Workers also live in Hanover, Enfi eld and Canaan, NH as well as Norwich, VT.
Workers most commonly earn $3,333 or more monthly, with 46.3 percent falling into this bracket.
The Upper ValleyLiving in the Upper Valley Hanover and Lebanon are the top two destinations of
job holders living in the Upper Valley area, attracting 46.7 percent of all workers who live in the Upper Valley.
Remaining job holders travel to numerous locations for work, including Concord and Manchester, NH, and Springfi eld and Montpelier, VT.
Residents most commonly earn $3,333 or more monthly, with 47.5 percent of residents falling into this bracket.
Inflow/Outflow Job Counts in 2010
Upper Valley
Employed in Selection Area, Live OutsideEmployed and Live in Selection AreaLive in Selction Area, Employed Outside
20,255 22,601 10,434Working in the Upper Valley
42,856
Living in the Upper Valley
33,035
The Upper Valley – OnTheMap
18 New Hampshire Employment Security, Economic and Labor Market Information Bureau
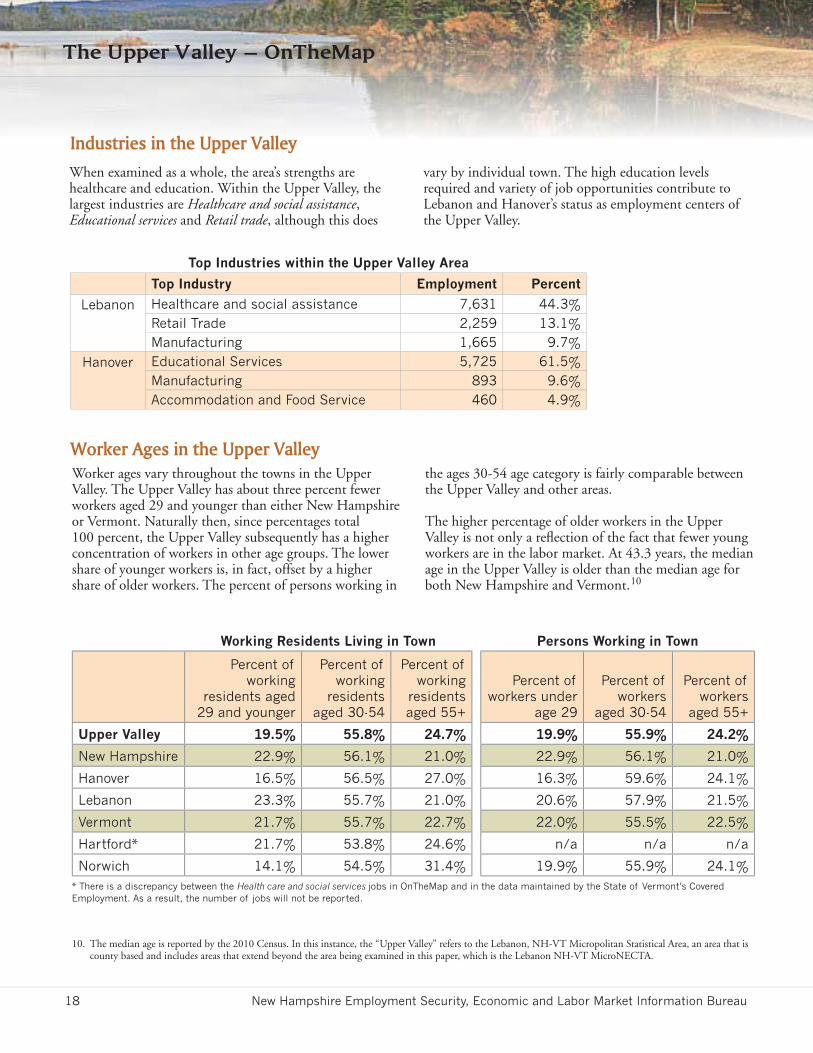
Worker ages vary throughout the towns in the Upper Valley. The Upper Valley has about three percent fewer workers aged 29 and younger than either New Hampshire or Vermont. Naturally then, since percentages total 100 percent, the Upper Valley subsequently has a higher concentration of workers in other age groups. The lower share of younger workers is, in fact, offset by a higher share of older workers. The percent of persons working in
the ages 30-54 age category is fairly comparable between the Upper Valley and other areas.
The higher percentage of older workers in the Upper Valley is not only a refl ection of the fact that fewer young workers are in the labor market. At 43.3 years, the median age in the Upper Valley is older than the median age for both New Hampshire and Vermont. 10
Working Residents Living in Town Persons Working in Town
Percent of working
residents aged 29 and younger
Percent of working
residents aged 30-54
Percent of working
residents aged 55+
Percent of workers under
age 29
Percent of workers
aged 30-54
Percent of workers
aged 55+
Upper Valley 19.5% 55.8% 24.7% 19.9% 55.9% 24.2%
New Hampshire 22.9% 56.1% 21.0% 22.9% 56.1% 21.0%
Hanover 16.5% 56.5% 27.0% 16.3% 59.6% 24.1%
Lebanon 23.3% 55.7% 21.0% 20.6% 57.9% 21.5%
Vermont 21.7% 55.7% 22.7% 22.0% 55.5% 22.5%
Hartford* 21.7% 53.8% 24.6% n/a n/a n/a
Norwich 14.1% 54.5% 31.4% 19.9% 55.9% 24.1%
When examined as a whole, the area’s strengths are healthcare and education. Within the Upper Valley, the largest industries are Healthcare and social assistance, Educational services and Retail trade, although this does
vary by individual town. The high education levels required and variety of job opportunities contribute to Lebanon and Hanover’s status as employment centers of the Upper Valley.
Top Industries within the Upper Valley Area
Top Industry Employment Percent
Lebanon Healthcare and social assistance 7,631 44.3%Retail Trade 2,259 13.1%Manufacturing 1,665 9.7%
Hanover Educational Services 5,725 61.5%Manufacturing 893 9.6%Accommodation and Food Service 460 4.9%
Industries in the Upper Valley
Worker Ages in the Upper Valley
10. The median age is reported by the 2010 Census. In this instance, the “Upper Valley” refers to the Lebanon, NH-VT Micropolitan Statistical Area, an area that is county based and includes areas that extend beyond the area being examined in this paper, which is the Lebanon NH-VT MicroNECTA.
* There is a discrepancy between the Health care and social services jobs in OnTheMap and in the data maintained by the State of Vermont’s Covered Employment. As a result, the number of jobs will not be reported.
The Upper Valley – OnTheMap
New Hampshire Employment Security, Economic and Labor Market Information Bureau 19
Overall
Job holders living in the Upper Valley share similarities with the job holders working there. This is primarily because there are 22,601 workers who both live and work in the Upper Valley, representing two-thirds of working residents. It is also the reason this area, the Lebanon NH-VT MicroNECTA is referred to as a labor market area – working residents may not live and work in the same town, but the working residents in all of these towns are likely to work within the area. Indeed, NECTA designations are based on local commuting patterns.
There are however, more job holders working in the Upper Valley area than there are living in the Upper Valley. This distinction is useful in understanding why nearly 47 percent of residents living here work in either Hanover or Lebanon, but only about 20 percent of the job holders working in the Upper Valley live in Hanover or Lebanon.
Nearly half of all job holders who live in the Upper Valley work in either Lebanon or Hanover.
Two-thirds of job holders living in the Upper Valley remain in the Upper Valley for work.
Hanover and Lebanon are the two job centers of the Upper Valley, with more jobs located in the towns than there are working residents. This is exacerbated by considering that some of the working residents in these towns commute out to different work locations, further increasing the need to import workers.
Within the Upper Valley, Healthcare and social assistance, Educational services and Retail trade are the largest sectors. Manufacturing is also a large industry, making its way into the top three industries in several towns within the Upper Valley.

The Upper Valley – OnTheMap
20 New Hampshire Employment Security, Economic and Labor Market Information Bureau