Embed Size (px)
Citation preview
The Untapped Potential of Decentralized Solutions to Provide Safe, Sustainable Drinking Water at Large Scale
The State of the Safe Water Enterprises Market
January 2017
2
ACKNOWLEDGEMENTS
• This study builds on the existing knowledge and research of many water and sanitation experts and development professionals. The findings and analyses in the pages that follow would not have been possible without the inputs of individuals from over 20 organizations who shared data, insights, and perspectives.
• The authors would like to acknowledge and thank the sponsors of this work – Aqua for All, DanoneCommunities, The Stone Family Foundation & Osprey Foundation and Conrad N. Hilton Foundation – for their valuable support and financing.
• The authors would also like to thank the members of the project’s advisory committee. Specifically, we would like to acknowledge Sjef Ernes, Saskia Reus-Makkink, Arco van der Toorn and Christiaan Quellhorst from Aqua for All, Amaury de Roujoux, Vincent Robert, and France Goldzahl from Danone Communities, Chris Dunston and Andrea Jones from Hilton Foundation, Sarah Hedley from the Stone Family Foundation and Louis Boorstin from Osprey Foundation. Their generous contribution of time, direction, and energy has been vital to the success of this research.
• We would also like to thank the entrepreneurs and innovators who are on the leading edge of developing the market for safe water enterprises (SWEs). Specifically we would like to acknowledge Jim Chu (dloHaiti), Francois Jaquenoud (1001 Fontaines), Malini Katta (Naandi), Kishan Nanavati (Spring Health), Galen Welsch (Jibu), Charles Nimako (Safe Water Network), Nandini Samajdar (Waterpoint), Hussain Naqi (Pharmagen), Maria Gomez (EcoAlberto), Barbara Ryl (Sunlight), Shoury Singareddy (Bala Vikasa), Anuj Sharma (Sarvajal) and Kate Harawa (Water For People).
• This study was authored by Nirat Bhatnagar, Sam Lampert, Vibhor Goyal, Romit Mehta, Raahil Rai and Ashwin Chandrasekhar of Dalberg Global Development Advisors.
• This is an independently drafted report and all views expressed are those of Dalberg Global Development Advisors and do not necessarily represent the views of the report’s sponsors. Although the authors have made every effort to ensure that the information in this report was correct at time of print, Dalberg Global Development Advisors does not assume and hereby disclaims any liability for the accuracy of the data, or any consequence of its use.
3
EXECUTIVE SUMMARY (1/6)New approaches are needed to achieve the Safe Water SDG for 2030
• Over 4 billion people, more than half of the world’s population, lack access to safe, sustainable, water services. Currently, about 4.4 billion people either use an untreated improved or an unimproved source. Improved water does not mean, however, that it is potable or safe – just that it is protected. Consequently, this water tends to be laden with physical, biological, and chemical contaminants at concentrations that can be several times the limit prescribed for health and can cause illnesses such as diarrhea, typhoid, and gastroenteritis.
• The lack of safe water has severe consequences for health and morbidity, especially for children. The annual number of under-5 diarrheal deaths associated with consumption of contaminated water is estimated at over 500,000 per year. The economic impact of unclean water is tens of billions of dollars globally.
• However, current approaches are unlikely to get us to the 2030 goal for clean water. Sustainable Development Goal 6 commits the international community to achieving universal and equitable access to safe and affordable drinking water for all by 2030. Between 2000 and 2015, nearly 1 billion additional people1 enjoyed access to improved drinking water sources. While these numbers seem large, the rate of progress is not sufficient to get to universal coverage by 2030. Governments across the globe have struggled with providing safe and reliable drinking water through traditional, typically centralized, solutions. And most of these systems are just ‘improved’ sources and do not involve treatment at point of consumption. In addition to accelerating just the scale of coverage, the water also needs to be reliably available, treated for chemical and biological contaminants, and, affordable. There is a clear need for new channels and mechanisms at scale.
Note: (1) According to The World Bank, access to improved sources increased from 82.49% in 2000 to 90.97% in 2015. The global population was 6.9 billion in 2000, and 7.3 billion in 2015
4
• For over 15 years, entrepreneurs, impact investors, governments and philanthropic organizations have been experimenting with decentralized solutions that complement traditional utility approaches to expand access to safe drinking water. We refer to these solutions as Safe Water Enterprises (SWEs). They complement government facilities/amenities/services by using market-based approaches to deliver high quality drinking water that goes beyond access to an improved source. They target financial sustainability and a social purpose simultaneously. SWEs use innovative solutions to provide water services across the entire drinking water value chain, including extraction, treatment, transport, delivery, and payment collection. These models can work with groundwater, surface/rain water, water from piped sources, and sea water using methods such as reverse osmosis, chlorination, UV disinfection, and sand filtration. There tends to be significant variation in business models and strategic choices that reflect both internal philosophies and external conditions. SWEs are structured as fully integrated solutions, as franchise models, and as community owned initiatives.
• Structural factors point to a large permanent role and a larger bridge role for SWEs. Water delivery is a very local problem, and the appropriate approach to providing safe drinking water depends on a range of factors related to local conditions and delivery models. The ideal solution is safe and affordable drinking water piped into people’s homes, but geographic, water resource, and infrastructure financing constraints prevent this from being a universal reality. SWEs have an important role to play as a bridge solution within a larger national framework for delivering safe, convenient and affordable water services to all. The need is obvious when there is limited access to high-quality centralized sources; in this situation, SWEs can provide access to safe drinking water independently from extraction to delivery. SWEs also have a role to play, however, in environments where quality and access have been improved. This includes providing safe drinking water to places that do not have piped water infrastructure (including last-mile delivery), serving lower income communities, and providing additional quality enhancement and assurance (including many areas with piped water).
• There is a need to better understand SWE performance and expand their footprint beyond the 3 million people using them today. In this context, an alliance of four philanthropic organizations– Aqua For All, The Osprey Foundation, The Stone Family Foundation, The Conrad N. Hilton Foundation – and an investment fund, Danone Communities, commissioned a global study to assess SWEs as an effective and sustainable channel for providing safe water to communities, especially low-income communities, at scale.
EXECUTIVE SUMMARY (2/6)SWEs are a promising option and need to be better understood
5
• This study focuses on fourteen SWEs across continents and seeks to understand their performance, bottlenecks, and opportunities. We conducted a review of these SWEs, including site visits to ten, and conducted interviews with experts to assess the long-term potential of the sector. The study is intended to support host governments, bilateral and multilateral aid agencies, social impact investors such as foundations and private donors, NGOs, the private sector, and academics as they develop strategies for providing universal and equitable access to safe and affordable drinking water.
• SWEs in our study are strongly driven by their social mission of bringing safe water to the underserved, but no SWE in our study serves more than 1 M people; the average SWE serves 200,000. The number of customers varied considerably from over 800,000 people served by Bala Vikasa in India (Maharashtra, Chattisgarh, Telangana and Andhra Pradesh) to 25,000 people served by dloHaiti in Haiti. SWEs’ typical customer lives above the poverty line, but does not have access to piped water – safe or otherwise. While the specific context varies with the venture, the typical customer is either low or middle income and spends ~2-3%1 of his or her monthly income on water.
• While markets for SWEs look quite promising in terms of need for safe water and ability to pay, the combination of low margins, low penetration rates, and competition make it a challenging business. Water is a heavy product, and profitability in the water kiosk model depends on high-penetration rates in small catchment areas. However, there exists a “value asymmetry” between SWEs who promote the value of clean water versus a large proportion of customers who value convenience over quality but are unwilling to pay substantially extra for the convenience of home delivery. Driving up penetration rates by improving the salience of “clean water” could make a large difference in the prospects for SWEs. Furthermore, SWEs typically operate in an uncertain regulatory climate where they are not recognized as part of the broader water provision ecosystem and face threats from centralized networks extending into their service areas at subsidized prices, low-cost local competitors that may not be selling safe water and ‘free’ water from local sources.
EXECUTIVE SUMMARY (3/6)Through reviews of 14 SWEs, we uncovered bottlenecks to scale and sustainability
Note: (1) The affordability thresholds are different for different agencies e.g., 3 % for the UNDP, 4% for the OECD, 5% for the AfDB and 5% for the World Bank (cited as a widely used affordability threshold for expenditure on utility services (water and power)
6
• SWEs enjoy positive gross margins for water treatment, production and distribution but lose money when capital depreciation is factored in. Most ventures have positive operating margins on water, treatment, and distribution. However, average plant utilization and market penetration levels are typically low and tend to be insufficient to recover capital costs. There are four ways in which ventures can improve operational economics.
1. Customer engagement. On the customer side, ventures can apply best practices from global experiences by(i)demonstrating the need for safe water to their customers by aligning with customers on attributes they value the most, (ii) increasing awareness by working with local champions and conducting live demonstrations, (iii) driving adoption by maximizing convenience through home delivery and getting community buy-in before the station is set up, and (iv)ensuring sustained use by creating an optimal user experience through process and accessory design.
2. Operational efficiency. At an organizational level, SWEs can improve their operational efficiencies through a range of measures such as leveraging technology to reduce costs and collecting data for real-time decision making, instituting strong knowledge management systems, exploring institutional sales to drive volumes, designing robust mitigation strategies to manage their endogenous and exogenous risks, and using automation opportunities effectively.
3. Innovative business models. SWEs can start offering higher-margin value added services such as chilling, home delivery, and even non-water products that can improve operational performance.
4. Innovative contracts and financing support. Finally, SWEs can partner with government and get capital subsidies or operational finance support through instruments such as “vouchers” that enable service provision to the most vulnerable and also improve profitability. This would still represent a very cost effective mechanism to distribute clean water for governments.
EXECUTIVE SUMMARY (4/6)SWEs have moderately attractive economics but these can be significantly improved
7
• We analyzed the potential of SWEs to bridge the safe water gap for both unserved and underserved people.
• SWEs have the potential to serve people who are currently unserved by piped networks as well as people getting unsafe water through pipes
• A total of 3.86 billion people can be served safe drinking water through SWEs– We estimate that 2.16 billion people could be served clean drinking water through SWEs globally in a manner that relies on
affordable water tariffs and leads to cost recovery, including capital investments, and hence financial sustainability.
– An additional 1.7 billion people could be served clean water through SWEs but due to affordability constraints, will need partial subsidies from government, aid agencies, and/or philanthropies.
• We see four segments emerge from these 3.86 billion people1: – Segment 1: 1.46 billion people who have the ability to pay for safe water but do not have piped water supply presently.
– Segment 2: 0.7 billion people who have the ability to pay and are getting unsafe piped water.
– Segment 3: 1.15 billion people who have neither the ability to pay full tariff nor do they have access to piped water
– Segment 4: 0.55 billion people who don’t have the ability to pay full tariff but do have (unsafe) piped water
• Segment 1 represents a large area of immediate market opportunity for SWEs whereas Segment 3 represents a large area of “true need” that should receive philanthropic subsidies.
• We used the median cost-to-serve for the ventures in this study and calculated a total annual cost of $65.9 billion to cover both opex and capex at this scale. But the vast majority of this would be covered by user fees.
• The 2.16 billion people paying sustainable water tariff would cover ~78% of the total costs of water delivery through SWEs, leaving only $14.4 bn annually to be covered through government, development, and philanthropic subsidies for 1.7 billion people. This translates into a subsidy of $ 8.50 per person receiving a subsidy.
• Thus, the SWE model can be an important component of the solution by complementing or substituting the piped network depending on water quality issues, topography, water resource availability.
EXECUTIVE SUMMARY (5/6)SWEs can serve between 1.46 – 3.86 billion people and deserve greater support
Note: (1) The figure refers to the entire population that remains underserved or unserved (i.e., improved untreated and unimproved sources) - the market for SWEs will be smaller depending on the operating conditions
8
Sector influencers can play a critical role in easing the external constraints faced by SWEs. Governments, aid agencies, foundations, impact investors, the private sector, NGOs could come together to improve the attraction of the ecosystem for the SWE model through four types of initiatives.
1. Creation of a global alliance for safe drinking water. This can help bring collective action to solve some of the eco-system issues that SWEs operate under – creating a market for safe water at the BoP which SWEs are not in a position to do beyond the micro environment in which they operate, and helping position SWEs as being complementary to centralized systems to host governments to mitigate the regulatory risks they face.
2. Designing global brand umbrella. Donors and investors can also help SWEs manage their brand positioning efforts by creating an open source branding platform that participating ventures could “borrow” if they play by certain rules and adhere to quality.
3. Piloting and launching the Platform-as-a-service model. We also see an opportunity to carve out a separate platform-as-a-service business model by the more mature SWEs to provide valuable services such as quality testing, preventive maintenance, etc. to other small-scale private sector operators.
4. Developing a contractual framework for Government + SWEs. Designing an efficient and legitimized framework of collaboration between host governments and SWEs to ensure long term decision making and investments to this model.
EXECUTIVE SUMMARY (6/6)Sector influencers can drive four key ecosystem initiatives to catalyze growth and scale
9
1. Introduction: The Safe Water Challenge Facing Us And The Importance Of Understanding The Role Of Safe Water Enterprises (SWEs)
2. Overview of SWEs: Achievements and Unrealized Potential
3. The SWE Market: Opportunities and Potential Market Profiles
4. Strategies to Build a Market: Recommendations to Accelerate SWE Growth
TABLE OF CONTENTS
10
INTRODUCTION: KEY MESSAGES (1 OF 2)SWEs complement national strategies to provide access to safe drinking water
Source: Dalberg research; Dalberg analysis
Study Overview
• Aqua for All, Danone Communities, Osprey Foundation, The Stone Family Foundation and theConrad N. Hilton Foundation jointly commissioned this study to assess the potential of SafeWater Enterprises (SWEs) as a sustainable channel for providing safe water to communities,especially low-income communities, at scale. This study combines insights from theexperiences of 14 existing SWEs with an analysis of broader market trends to provide anoverview of the market and recommendations for how to accelerate its growth.
• This study is for host governments, bilateral and multilateral aid agencies, private donors, theprivate sector and academics working to enhance access to safe drinking water across theworld.
The Safe Water Challenge
• Currently, there are ~4.4 billion people without access to safe, sustainable water services asdefined under the SDGs.
• Water is a key input for human activity and lack of access to safe water drives public healthconcerns, particularly with regards to child mortality and morbidity.
• By 2030, many countries are likely to see high to extremely high water stress. We need todevelop new ways to treat and distribute safe water.
• Even in countries without water stress, governments struggle to reduce the risk of unsafewater. Providing safe drinking water through utility systems is complicated and manygovernments are either unwilling or unable to do so.
• SWEs can play a key role within a larger national framework for delivering safe, convenient andaffordable water services to all. This includes providing safe drinking water to places that don’thave piped water infrastructure (including last-mile delivery), serving lower incomecommunities, and providing last mile treatment in places with piped water.
11
INTRODUCTION: KEY MESSAGES (2 OF 2)SWEs complement national strategies to provide access to safe drinking water
Source: Dalberg research; Dalberg analysis
The decentralized water treatment and distributionsolution
• We see three different types of water delivery models across the value chain: centralizedsupply, decentralized supply, and individual (self-owned) supply.
• Different models have advantages, disadvantages and limitations depending on a range offactors related to local conditions and delivery models.
• In addition to the centralized piped water schemes that are typically run or funded bygovernment resources, one of the most commonly found models are small scaledecentralized water service providers – “mom & pop” RO operators, private tankers – whotend not be regulated and provide water that may not meet potability standards.
• With this as context, formal SWEs are a decentralized approach to providing safe waterthat complement centralized, utility-scale, providers and over the last 15 years haveestablished a footprint globally.
• These SWEs have different models of operation across the water supply value chain andmore needs to be understood about these models in order to determine optimal ways ofusing them to solve the world’s safe drinking water gap.
• This question is especially important since in many parts of the world, governments aresignificantly behind in their progress towards meeting the SDG goal for drinking water for2030 and current approaches are unlikely to take us there.
12
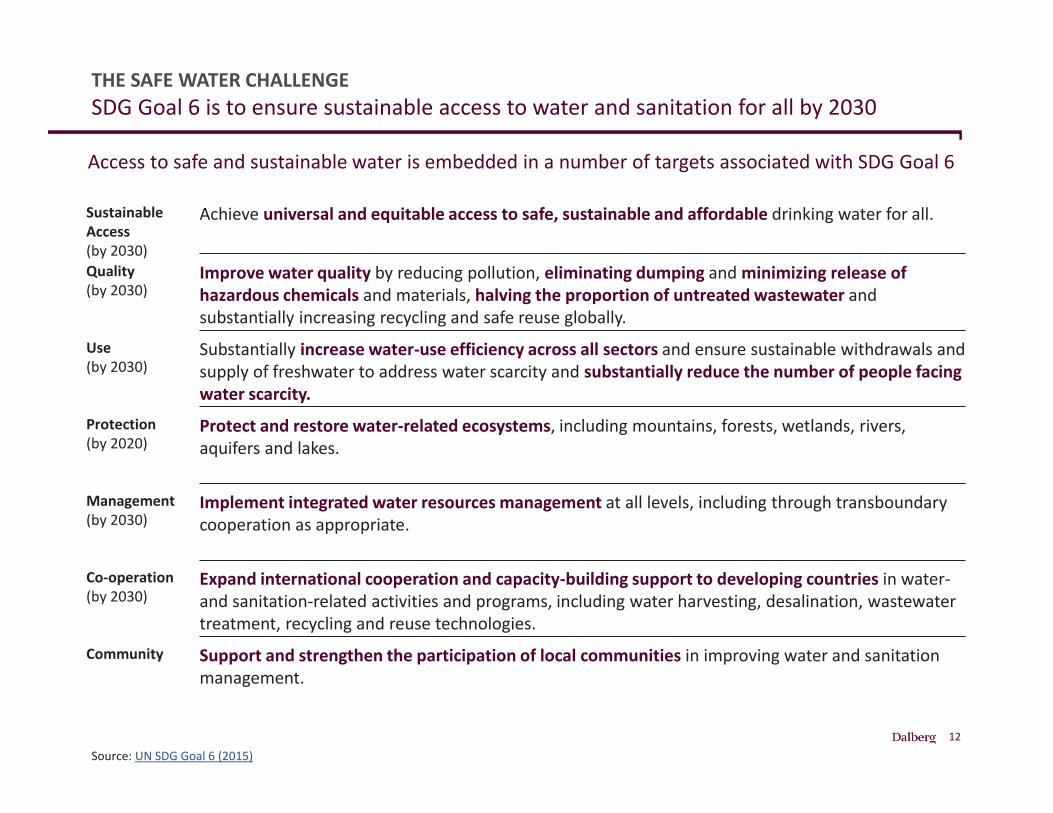
THE SAFE WATER CHALLENGESDG Goal 6 is to ensure sustainable access to water and sanitation for all by 2030
Source: UN SDG Goal 6 (2015)
Sustainable Access (by 2030)
Achieve universal and equitable access to safe, sustainable and affordable drinking water for all.
Protection (by 2020)
Protect and restore water-related ecosystems, including mountains, forests, wetlands, rivers, aquifers and lakes.
Quality (by 2030)
Improve water quality by reducing pollution, eliminating dumping and minimizing release of hazardous chemicals and materials, halving the proportion of untreated wastewater and substantially increasing recycling and safe reuse globally.
Co-operation (by 2030)
Expand international cooperation and capacity-building support to developing countries in water-and sanitation-related activities and programs, including water harvesting, desalination, wastewater treatment, recycling and reuse technologies.
Use (by 2030)
Substantially increase water-use efficiency across all sectors and ensure sustainable withdrawals and supply of freshwater to address water scarcity and substantially reduce the number of people facing water scarcity.
Community Support and strengthen the participation of local communities in improving water and sanitation management.
Management (by 2030)
Implement integrated water resources management at all levels, including through transboundary cooperation as appropriate.
Access to safe and sustainable water is embedded in a number of targets associated with SDG Goal 6
13
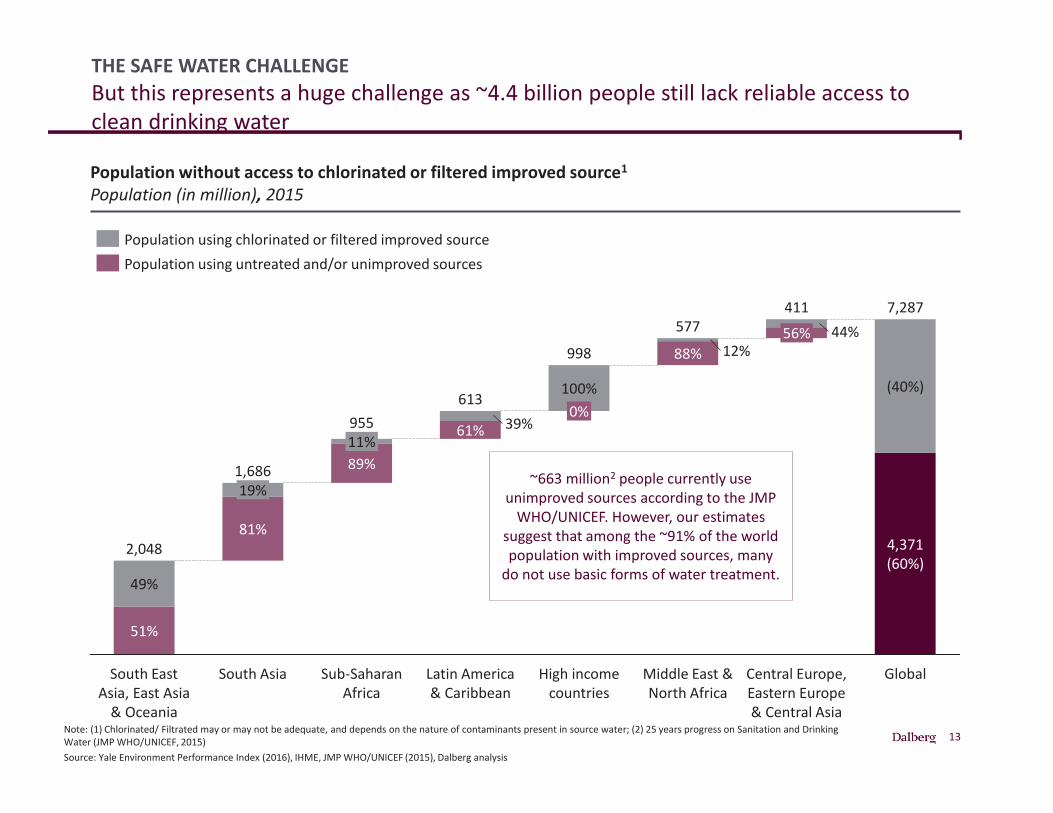
THE SAFE WATER CHALLENGEBut this represents a huge challenge as ~4.4 billion people still lack reliable access to clean drinking water
Note: (1) Chlorinated/ Filtrated may or may not be adequate, and depends on the nature of contaminants present in source water; (2) 25 years progress on Sanitation and Drinking Water (JMP WHO/UNICEF, 2015)Source: Yale Environment Performance Index (2016), IHME, JMP WHO/UNICEF (2015), Dalberg analysis
51%
955
19%1,686 89%
81%
South East Asia, East Asia
& Oceania
2,048
South Asia
49%
11%
Global
7,287
4,371(60%)
44%411
Middle East & North Africa
Central Europe, Eastern Europe & Central Asia
56%577
88%
(40%)0%
12%
61%
100%
39%
Sub-Saharan Africa
613
Latin America & Caribbean
998
High income countries
Population using chlorinated or filtered improved sourcePopulation using untreated and/or unimproved sources
Population without access to chlorinated or filtered improved source1
Population (in million), 2015
~663 million2 people currently use unimproved sources according to the JMP
WHO/UNICEF. However, our estimates suggest that among the ~91% of the world population with improved sources, many
do not use basic forms of water treatment.

14
27%11%
56%
6% 11%
11%
18%18%
47% 42% 15%
14%
5%
37% 38% 35% 33%
9%5%9% 1%
39%
23%12%
22%
66% 2%
2%5%1%
14%
8%
1% 6%
6%1%
7%
5% 11%11%
South Asia
5%
4%
North Africa and
Middle East
Sub-Saharan
Africa
60%
Global2
100%
Southeast Asia, East Asia, and Oceania
Central Europe, Eastern Europe,
and Central
Asia
Latin America
and Caribbean
THE SAFE WATER CHALLENGEMost people drink water that is at risk due to industrial, agricultural, domestic activity as well as naturally occurring chemicals
Note: (1) Regional breakdowns do not include data from high-income countries. (2) Global estimate includes data from countries in Australasia, High-income Asia Pacific, North America, and Western Europe, which are not included in regional breakdowns; (3 numbers may not sum to 100 due to rounding)Source: Yale Environment Performance Index (2016), IHME, JMP WHO/UNICEF (2015), Dalberg analysis
Treated - Unimproved and Surface
Untreated - ImprovedUntreated - Piped
Treated - PipedTreated - Improved
Untreated - Unimproved and Surface
Population across regions without access to treated water (chlorinated or filtered), by type of access1
% of population, 2015
Worldwide, 60% of the population (~4.4bn people)
drink water that is either untreated or unimproved.
15
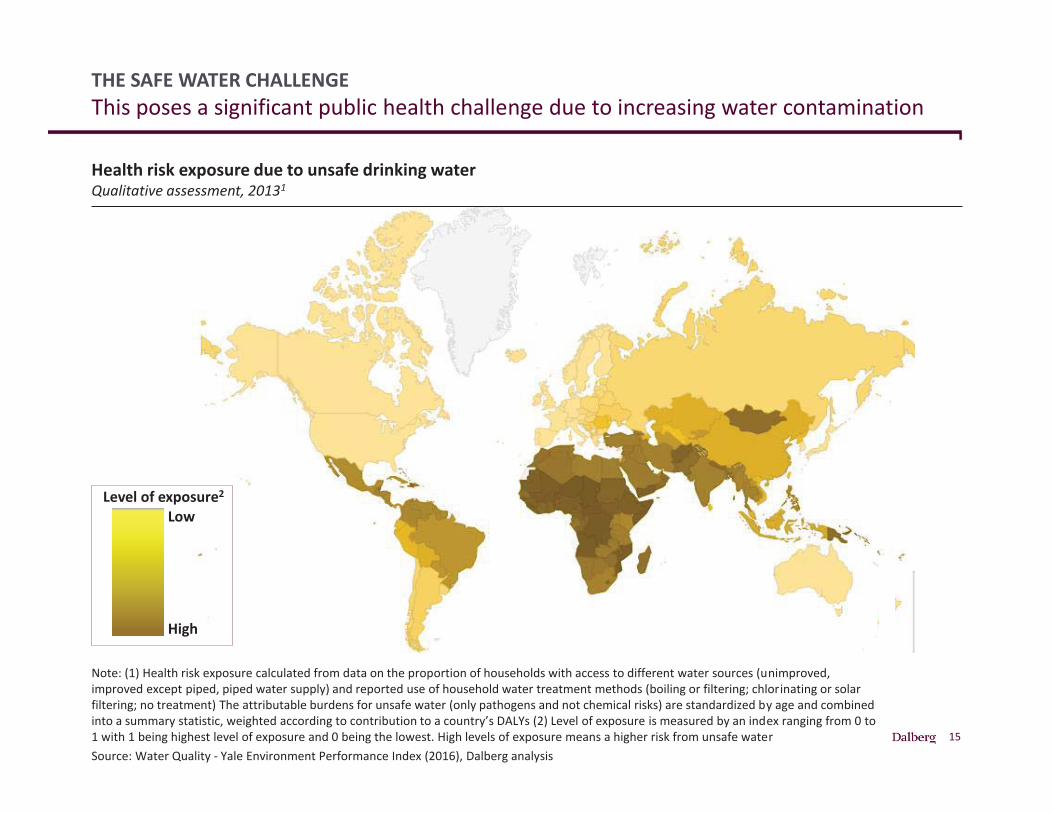
THE SAFE WATER CHALLENGEThis poses a significant public health challenge due to increasing water contamination
Note: (1) Health risk exposure calculated from data on the proportion of households with access to different water sources (unimproved, improved except piped, piped water supply) and reported use of household water treatment methods (boiling or filtering; chlorinating or solar filtering; no treatment) The attributable burdens for unsafe water (only pathogens and not chemical risks) are standardized by age and combined into a summary statistic, weighted according to contribution to a country’s DALYs (2) Level of exposure is measured by an index ranging from 0 to 1 with 1 being highest level of exposure and 0 being the lowest. High levels of exposure means a higher risk from unsafe water Source: Water Quality - Yale Environment Performance Index (2016), Dalberg analysis
High
LowLevel of exposure2
Health risk exposure due to unsafe drinking water Qualitative assessment, 20131
16
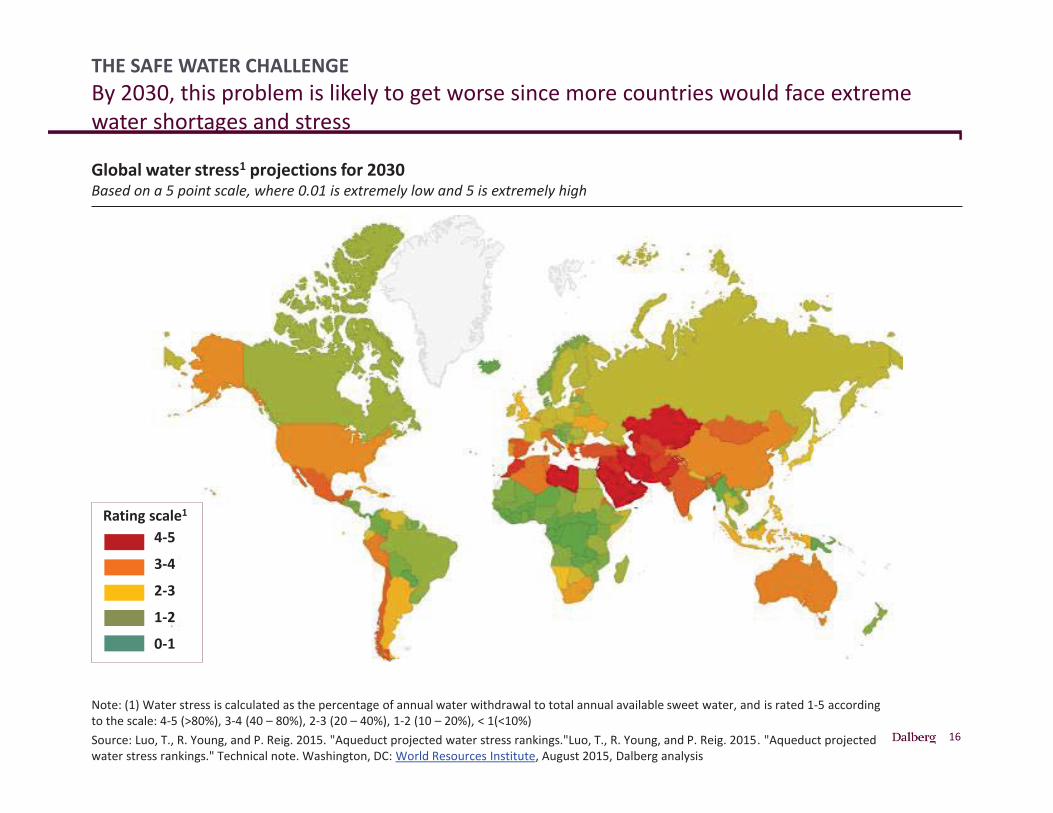
THE SAFE WATER CHALLENGEBy 2030, this problem is likely to get worse since more countries would face extreme water shortages and stress
Note: (1) Water stress is calculated as the percentage of annual water withdrawal to total annual available sweet water, and is rated 1-5 according to the scale: 4-5 (>80%), 3-4 (40 – 80%), 2-3 (20 – 40%), 1-2 (10 – 20%), < 1(<10%) Source: Luo, T., R. Young, and P. Reig. 2015. "Aqueduct projected water stress rankings."Luo, T., R. Young, and P. Reig. 2015. "Aqueduct projected water stress rankings." Technical note. Washington, DC: World Resources Institute, August 2015, Dalberg analysis
4-5
3-4
2-3
1-2
0-1
Rating scale1
Global water stress1 projections for 2030Based on a 5 point scale, where 0.01 is extremely low and 5 is extremely high
17
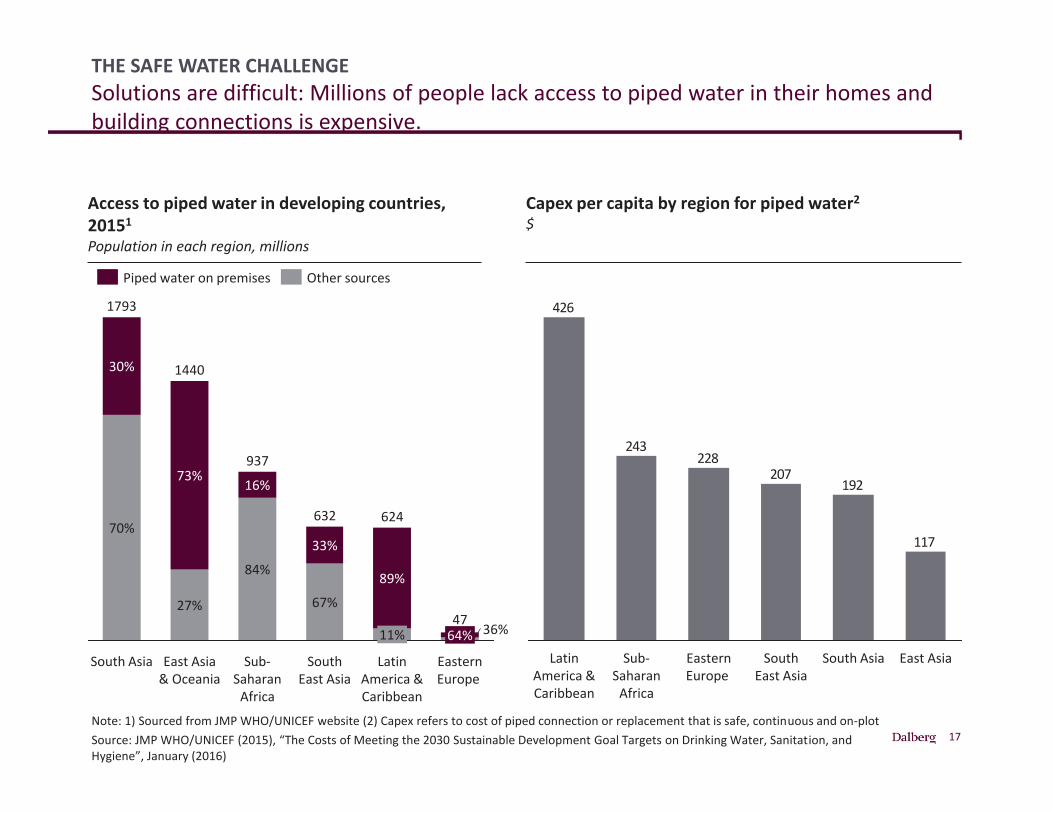
THE SAFE WATER CHALLENGESolutions are difficult: Millions of people lack access to piped water in their homes and building connections is expensive.
Note: 1) Sourced from JMP WHO/UNICEF website (2) Capex refers to cost of piped connection or replacement that is safe, continuous and on-plotSource: JMP WHO/UNICEF (2015), “The Costs of Meeting the 2030 Sustainable Development Goal Targets on Drinking Water, Sanitation, and Hygiene”, January (2016)
South East Asia
1793
67%
Sub-Saharan
Africa
11%
33%
937
1440
27%
84%
632
16%73%
South Asia
624
89%
East Asia & Oceania
70%
30%
47
Eastern Europe
36%64%
Latin America & Caribbean
Piped water on premises Other sources
117
192207
228243
426
Sub-Saharan
Africa
Latin America & Caribbean
Eastern Europe
South East Asia
East AsiaSouth Asia
Access to piped water in developing countries, 20151
Population in each region, millions
Capex per capita by region for piped water2
$
18
85%
446
63%
South Asia
4832%
45%
High-income Central Europe, Eastern Europe, and Central Asia
998
53%0%
330100%
0%
5% 30%12%
64%
Sub-Saharan Africa
22478% 16%
2%
Southeast Asia, East Asia,
and Oceania
1.036
36%
Latin America and Caribbean
8% 35%
5166%
Global
4%
56%
4.032
56%
North Africa and Middle East
2%
1.632(40%)
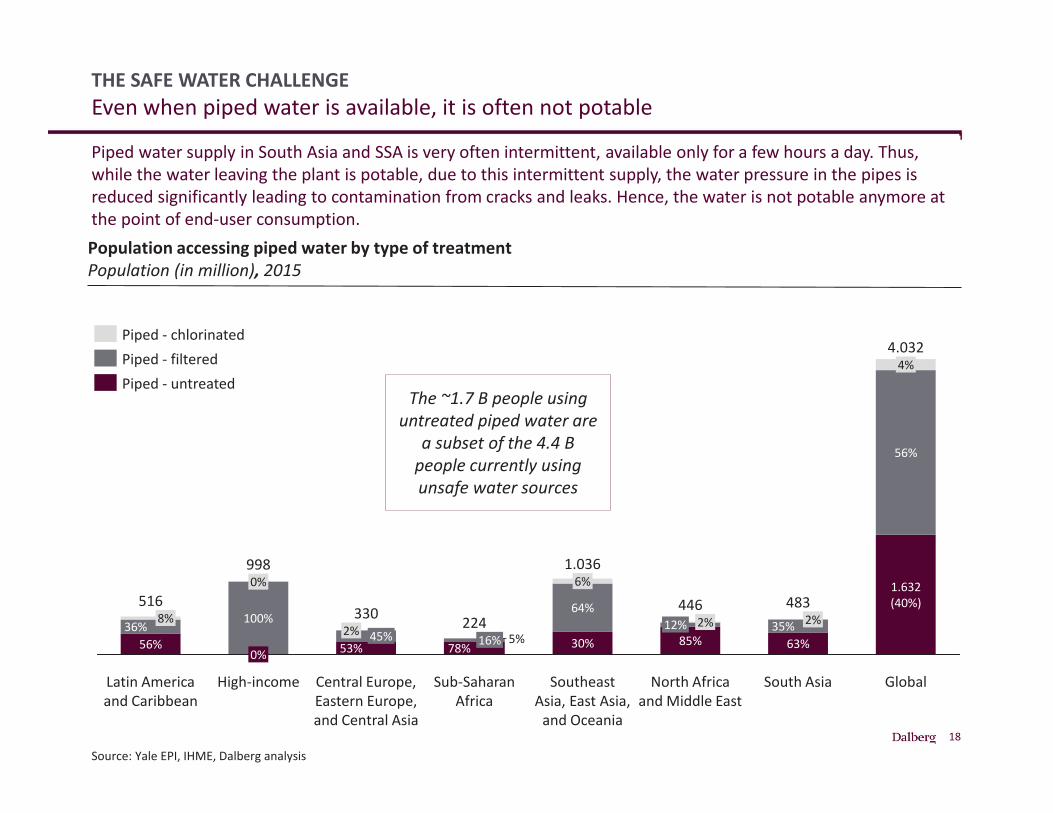
THE SAFE WATER CHALLENGEEven when piped water is available, it is often not potable
Source: Yale EPI, IHME, Dalberg analysis
Population accessing piped water by type of treatment Population (in million), 2015
Piped water supply in South Asia and SSA is very often intermittent, available only for a few hours a day. Thus, while the water leaving the plant is potable, due to this intermittent supply, the water pressure in the pipes is reduced significantly leading to contamination from cracks and leaks. Hence, the water is not potable anymore at the point of end-user consumption.
Piped - filteredPiped - untreated
Piped - chlorinated
The ~1.7 B people using untreated piped water are
a subset of the 4.4 B people currently using unsafe water sources
19
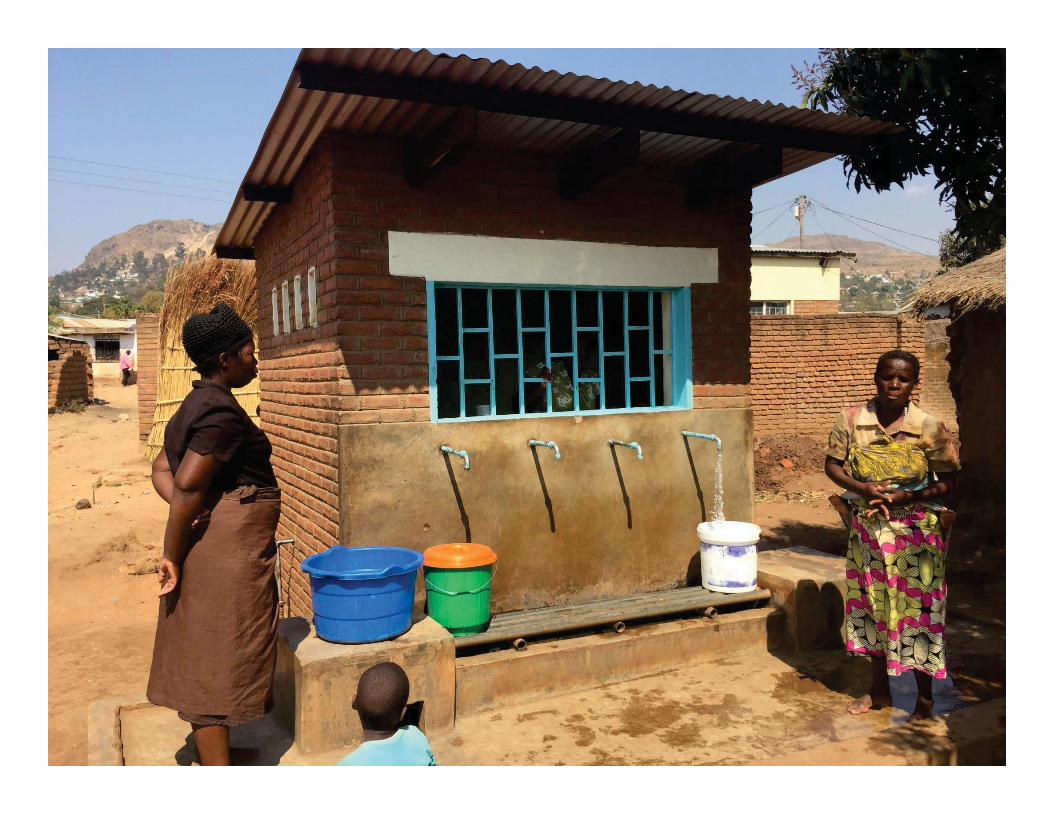
Insert a full page picture of a SWE kiosk so that people get a sense of what we are talking about
20
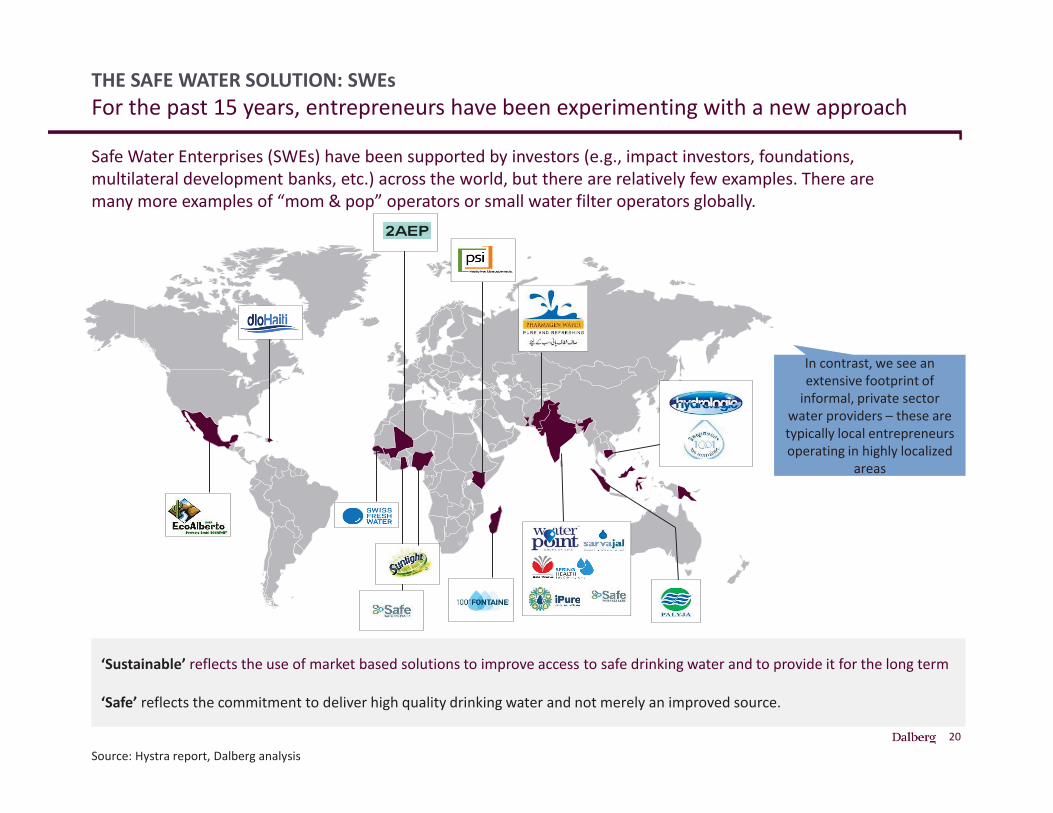
THE SAFE WATER SOLUTION: SWEs For the past 15 years, entrepreneurs have been experimenting with a new approach
Source: Hystra report, Dalberg analysis
‘Sustainable’ reflects the use of market based solutions to improve access to safe drinking water and to provide it for the long term
‘Safe’ reflects the commitment to deliver high quality drinking water and not merely an improved source.
Safe Water Enterprises (SWEs) have been supported by investors (e.g., impact investors, foundations, multilateral development banks, etc.) across the world, but there are relatively few examples. There are many more examples of “mom & pop” operators or small water filter operators globally.
In contrast, we see an extensive footprint of
informal, private sector water providers – these are typically local entrepreneurs operating in highly localized
areas
21
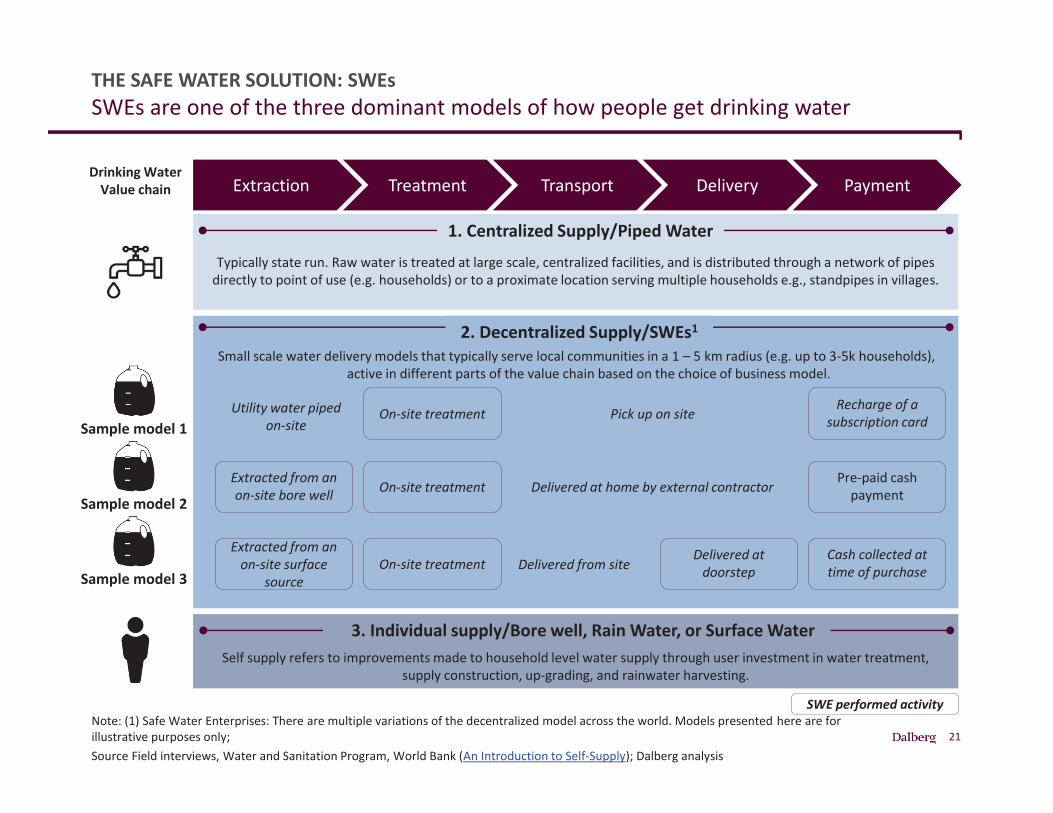
Typically state run. Raw water is treated at large scale, centralized facilities, and is distributed through a network of pipes directly to point of use (e.g. households) or to a proximate location serving multiple households e.g., standpipes in villages.
THE SAFE WATER SOLUTION: SWEsSWEs are one of the three dominant models of how people get drinking water
Note: (1) Safe Water Enterprises: There are multiple variations of the decentralized model across the world. Models presented here are for illustrative purposes only; Source Field interviews, Water and Sanitation Program, World Bank (An Introduction to Self-Supply); Dalberg analysis
Extraction Treatment Transport Delivery PaymentDrinking Water
Value chain
Self supply refers to improvements made to household level water supply through user investment in water treatment, supply construction, up-grading, and rainwater harvesting.
On-site treatment
On-site treatmentExtracted from an on-site bore well
Pre-paid cash payment
Recharge of a subscription cardPick up on site
Delivered at home by external contractor
Utility water piped on-site
Extracted from an on-site surface
sourceOn-site treatment
Delivered at doorstep
Cash collected at time of purchaseDelivered from site
Small scale water delivery models that typically serve local communities in a 1 – 5 km radius (e.g. up to 3-5k households), active in different parts of the value chain based on the choice of business model.
Sample model 1
Sample model 2
Sample model 3
1. Centralized Supply/Piped Water
2. Decentralized Supply/SWEs1
3. Individual supply/Bore well, Rain Water, or Surface Water
SWE performed activity
22
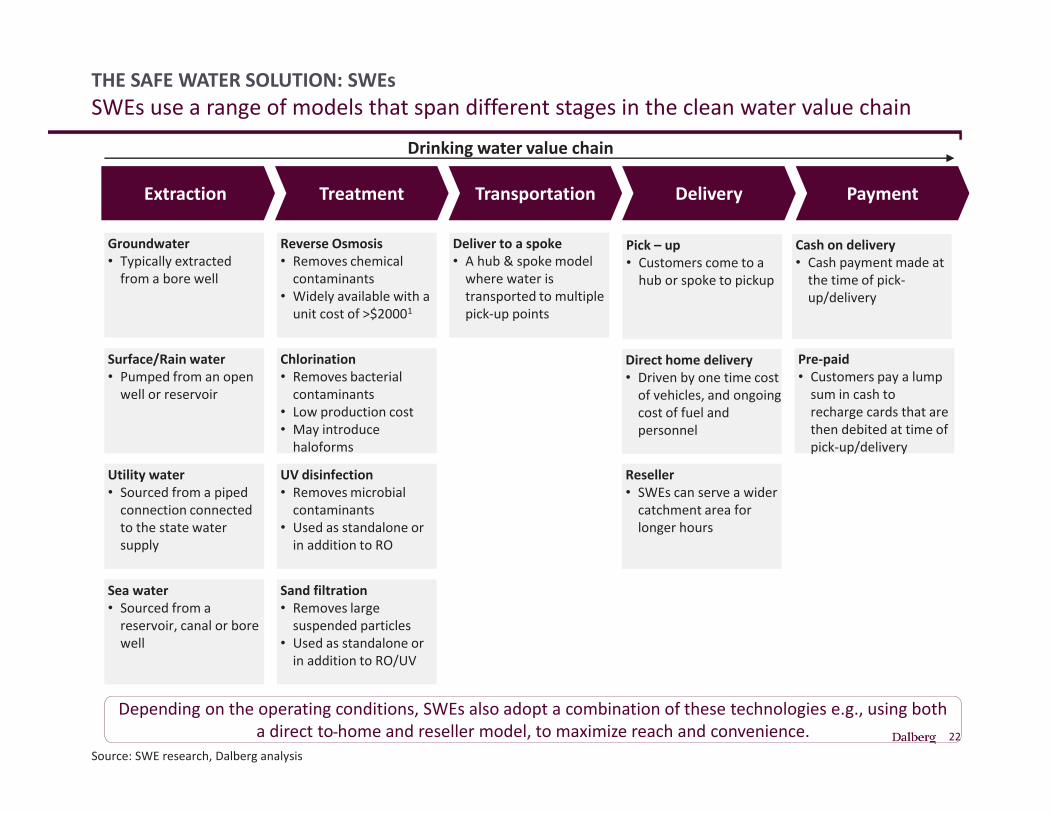
THE SAFE WATER SOLUTION: SWEsSWEs use a range of models that span different stages in the clean water value chain
Source: SWE research, Dalberg analysis
Extraction Treatment Transportation Delivery Payment
Deliver to a spoke• A hub & spoke model
where water is transported to multiple pick-up points
Reseller• SWEs can serve a wider
catchment area for longer hours
Pick – up• Customers come to a
hub or spoke to pickup
Direct home delivery• Driven by one time cost
of vehicles, and ongoing cost of fuel and personnel
Cash on delivery• Cash payment made at
the time of pick-up/delivery
Pre-paid • Customers pay a lump
sum in cash to recharge cards that are then debited at time of pick-up/delivery
Groundwater• Typically extracted
from a bore well
Reverse Osmosis• Removes chemical
contaminants• Widely available with a
unit cost of >$20001
Chlorination• Removes bacterial
contaminants• Low production cost• May introduce
haloforms
UV disinfection• Removes microbial
contaminants• Used as standalone or
in addition to RO
Sand filtration• Removes large
suspended particles• Used as standalone or
in addition to RO/UV
Surface/Rain water• Pumped from an open
well or reservoir
Utility water• Sourced from a piped
connection connected to the state water supply
Sea water• Sourced from a
reservoir, canal or bore well
Drinking water value chain
Depending on the operating conditions, SWEs also adopt a combination of these technologies e.g., using both a direct to home and reseller model, to maximize reach and convenience.
23
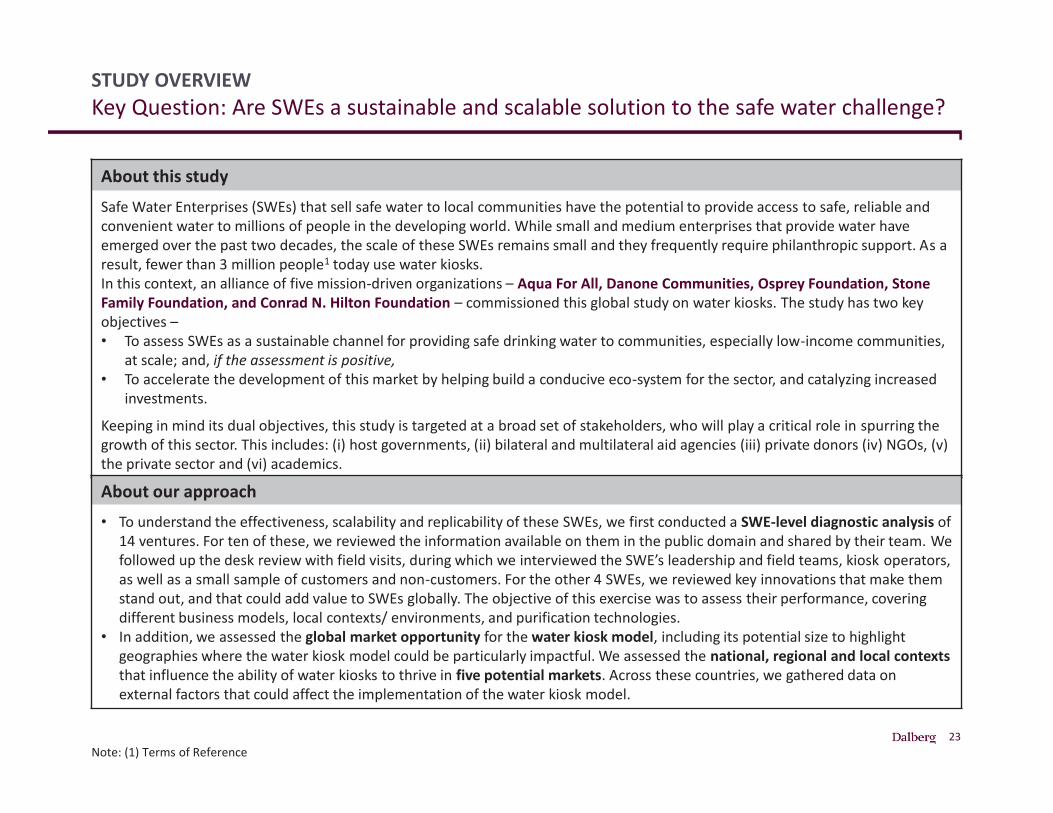
STUDY OVERVIEWKey Question: Are SWEs a sustainable and scalable solution to the safe water challenge?
About this studySafe Water Enterprises (SWEs) that sell safe water to local communities have the potential to provide access to safe, reliable and convenient water to millions of people in the developing world. While small and medium enterprises that provide water have emerged over the past two decades, the scale of these SWEs remains small and they frequently require philanthropic support. As aresult, fewer than 3 million people1 today use water kiosks. In this context, an alliance of five mission-driven organizations – Aqua For All, Danone Communities, Osprey Foundation, Stone Family Foundation, and Conrad N. Hilton Foundation – commissioned this global study on water kiosks. The study has two key objectives –• To assess SWEs as a sustainable channel for providing safe drinking water to communities, especially low-income communities,
at scale; and, if the assessment is positive,• To accelerate the development of this market by helping build a conducive eco-system for the sector, and catalyzing increased
investments.
Keeping in mind its dual objectives, this study is targeted at a broad set of stakeholders, who will play a critical role in spurring the growth of this sector. This includes: (i) host governments, (ii) bilateral and multilateral aid agencies (iii) private donors (iv) NGOs, (v) the private sector and (vi) academics.
About our approach• To understand the effectiveness, scalability and replicability of these SWEs, we first conducted a SWE-level diagnostic analysis of
14 ventures. For ten of these, we reviewed the information available on them in the public domain and shared by their team. We followed up the desk review with field visits, during which we interviewed the SWE’s leadership and field teams, kiosk operators, as well as a small sample of customers and non-customers. For the other 4 SWEs, we reviewed key innovations that make them stand out, and that could add value to SWEs globally. The objective of this exercise was to assess their performance, covering different business models, local contexts/ environments, and purification technologies.
• In addition, we assessed the global market opportunity for the water kiosk model, including its potential size to highlight geographies where the water kiosk model could be particularly impactful. We assessed the national, regional and local contextsthat influence the ability of water kiosks to thrive in five potential markets. Across these countries, we gathered data on external factors that could affect the implementation of the water kiosk model.
Note: (1) Terms of Reference
24
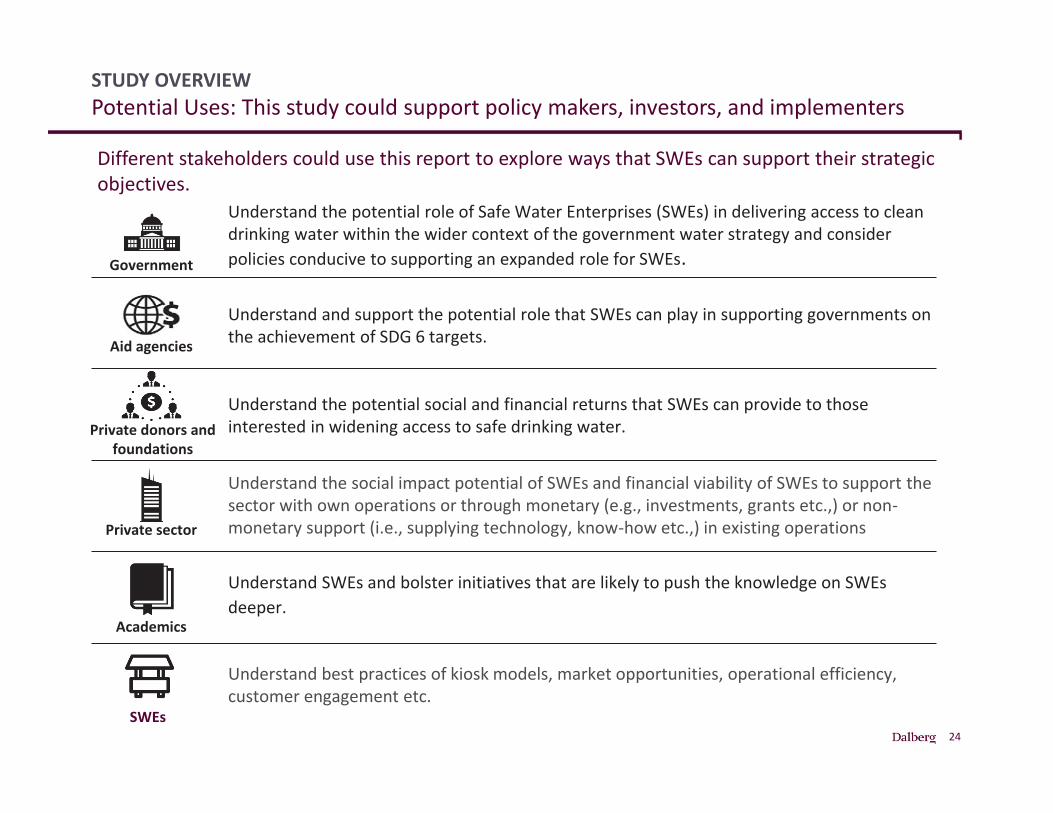
STUDY OVERVIEWPotential Uses: This study could support policy makers, investors, and implementers
Understand the potential role of Safe Water Enterprises (SWEs) in delivering access to clean drinking water within the wider context of the government water strategy and consider policies conducive to supporting an expanded role for SWEs. Government
Understand the potential social and financial returns that SWEs can provide to thoseinterested in widening access to safe drinking water. Private donors and
foundations
Understand and support the potential role that SWEs can play in supporting governments on the achievement of SDG 6 targets.Aid agencies
Understand the social impact potential of SWEs and financial viability of SWEs to support the sector with own operations or through monetary (e.g., investments, grants etc.,) or non-monetary support (i.e., supplying technology, know-how etc.,) in existing operations Private sector
Understand SWEs and bolster initiatives that are likely to push the knowledge on SWEs deeper.
Academics
Different stakeholders could use this report to explore ways that SWEs can support their strategic objectives.
Understand best practices of kiosk models, market opportunities, operational efficiency, customer engagement etc.
SWEs
25
1. Introduction: The Safe Water Challenge Facing Us And The Importance Of Understanding The Role Of Safe Water Enterprises (SWEs)
2. Overview of SWEs: Achievements and Unrealized Potential
3. The SWE Market: Opportunities and Potential Market Profiles
4. Strategies to Build a Market: Recommendations to Accelerate SWE Growth
TABLE OF CONTENTS
26
Challenges Facing SWEs
OVERVIEW OF SWEs: KEY MESSAGES (1 OF 3)SWEs are grappling with key challenges but have a compelling future
SWE Strategic Choices
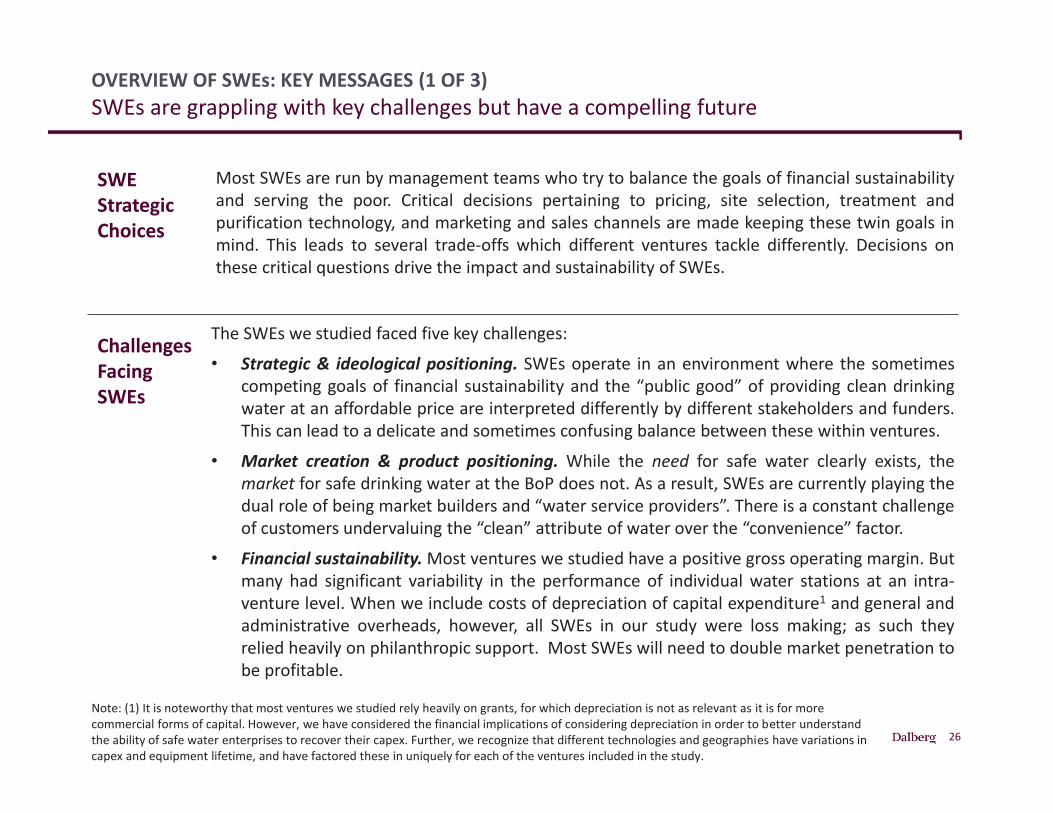
Most SWEs are run by management teams who try to balance the goals of financial sustainabilityand serving the poor. Critical decisions pertaining to pricing, site selection, treatment andpurification technology, and marketing and sales channels are made keeping these twin goals inmind. This leads to several trade-offs which different ventures tackle differently. Decisions onthese critical questions drive the impact and sustainability of SWEs.
The SWEs we studied faced five key challenges:• Strategic & ideological positioning. SWEs operate in an environment where the sometimes
competing goals of financial sustainability and the “public good” of providing clean drinkingwater at an affordable price are interpreted differently by different stakeholders and funders.This can lead to a delicate and sometimes confusing balance between these within ventures.
• Market creation & product positioning. While the need for safe water clearly exists, themarket for safe drinking water at the BoP does not. As a result, SWEs are currently playing thedual role of being market builders and “water service providers”. There is a constant challengeof customers undervaluing the “clean” attribute of water over the “convenience” factor.
• Financial sustainability. Most ventures we studied have a positive gross operating margin. Butmany had significant variability in the performance of individual water stations at an intra-venture level. When we include costs of depreciation of capital expenditure1 and general andadministrative overheads, however, all SWEs in our study were loss making; as such theyrelied heavily on philanthropic support. Most SWEs will need to double market penetration tobe profitable.
Note: (1) It is noteworthy that most ventures we studied rely heavily on grants, for which depreciation is not as relevant as it is for more commercial forms of capital. However, we have considered the financial implications of considering depreciation in order to better understand the ability of safe water enterprises to recover their capex. Further, we recognize that different technologies and geographies have variations in capex and equipment lifetime, and have factored these in uniquely for each of the ventures included in the study.
27
OVERVIEW OF SWEs: KEY MESSAGES (2 OF 3)SWEs are grappling with key challenges but have a compelling future
Challenges Facing SWEs
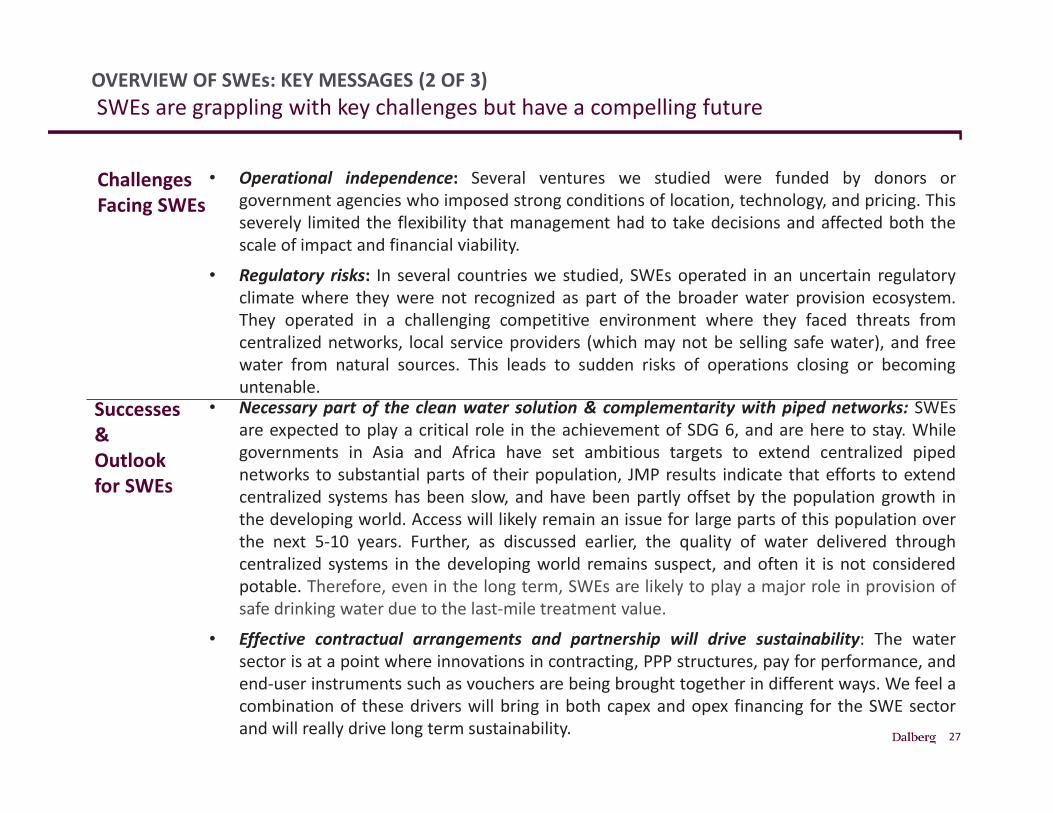
• Operational independence: Several ventures we studied were funded by donors orgovernment agencies who imposed strong conditions of location, technology, and pricing. Thisseverely limited the flexibility that management had to take decisions and affected both thescale of impact and financial viability.
• Regulatory risks: In several countries we studied, SWEs operated in an uncertain regulatoryclimate where they were not recognized as part of the broader water provision ecosystem.They operated in a challenging competitive environment where they faced threats fromcentralized networks, local service providers (which may not be selling safe water), and freewater from natural sources. This leads to sudden risks of operations closing or becominguntenable.
Successes & Outlook for SWEs
• Necessary part of the clean water solution & complementarity with piped networks: SWEsare expected to play a critical role in the achievement of SDG 6, and are here to stay. Whilegovernments in Asia and Africa have set ambitious targets to extend centralized pipednetworks to substantial parts of their population, JMP results indicate that efforts to extendcentralized systems has been slow, and have been partly offset by the population growth inthe developing world. Access will likely remain an issue for large parts of this population overthe next 5-10 years. Further, as discussed earlier, the quality of water delivered throughcentralized systems in the developing world remains suspect, and often it is not consideredpotable. Therefore, even in the long term, SWEs are likely to play a major role in provision ofsafe drinking water due to the last-mile treatment value.
• Effective contractual arrangements and partnership will drive sustainability: The watersector is at a point where innovations in contracting, PPP structures, pay for performance, andend-user instruments such as vouchers are being brought together in different ways. We feel acombination of these drivers will bring in both capex and opex financing for the SWE sectorand will really drive long term sustainability.
28
OVERVIEW OF SWEs: KEY MESSAGES (3 OF 3)SWEs are grappling with key challenges but have a compelling future
Successes & Outlook For SWEs
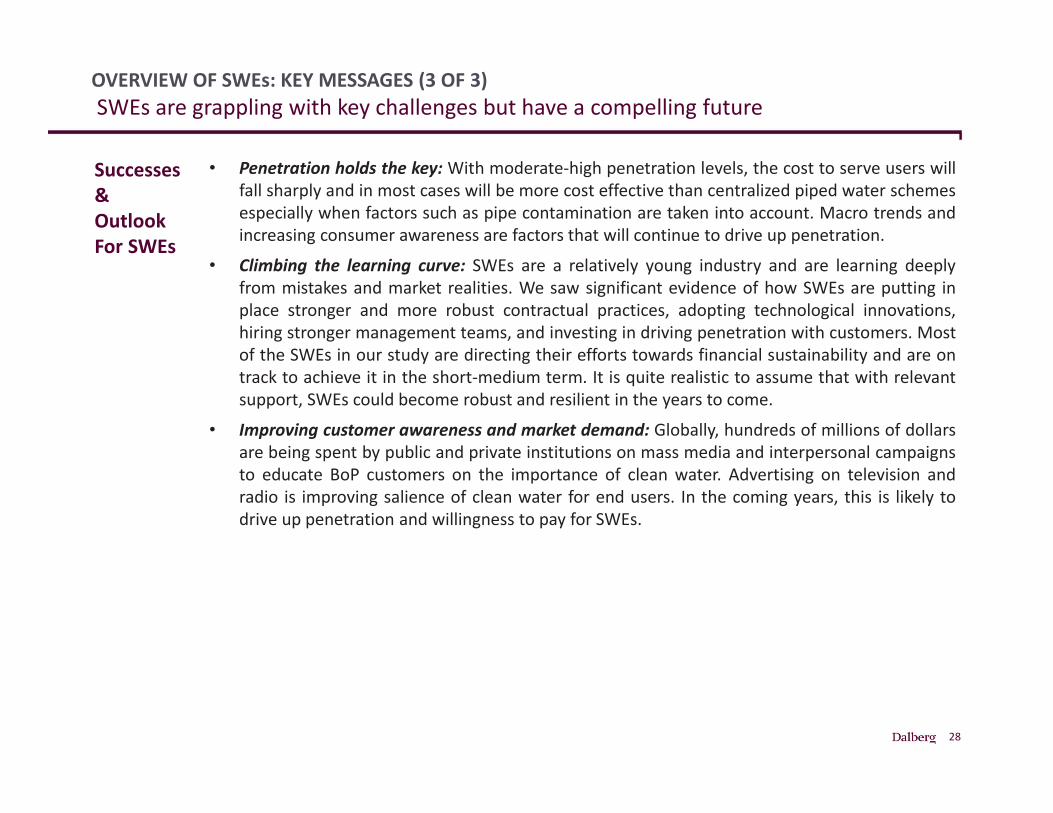
• Penetration holds the key: With moderate-high penetration levels, the cost to serve users willfall sharply and in most cases will be more cost effective than centralized piped water schemesespecially when factors such as pipe contamination are taken into account. Macro trends andincreasing consumer awareness are factors that will continue to drive up penetration.
• Climbing the learning curve: SWEs are a relatively young industry and are learning deeplyfrom mistakes and market realities. We saw significant evidence of how SWEs are putting inplace stronger and more robust contractual practices, adopting technological innovations,hiring stronger management teams, and investing in driving penetration with customers. Mostof the SWEs in our study are directing their efforts towards financial sustainability and are ontrack to achieve it in the short-medium term. It is quite realistic to assume that with relevantsupport, SWEs could become robust and resilient in the years to come.
• Improving customer awareness and market demand: Globally, hundreds of millions of dollarsare being spent by public and private institutions on mass media and interpersonal campaignsto educate BoP customers on the importance of clean water. Advertising on television andradio is improving salience of clean water for end users. In the coming years, this is likely todrive up penetration and willingness to pay for SWEs.
29
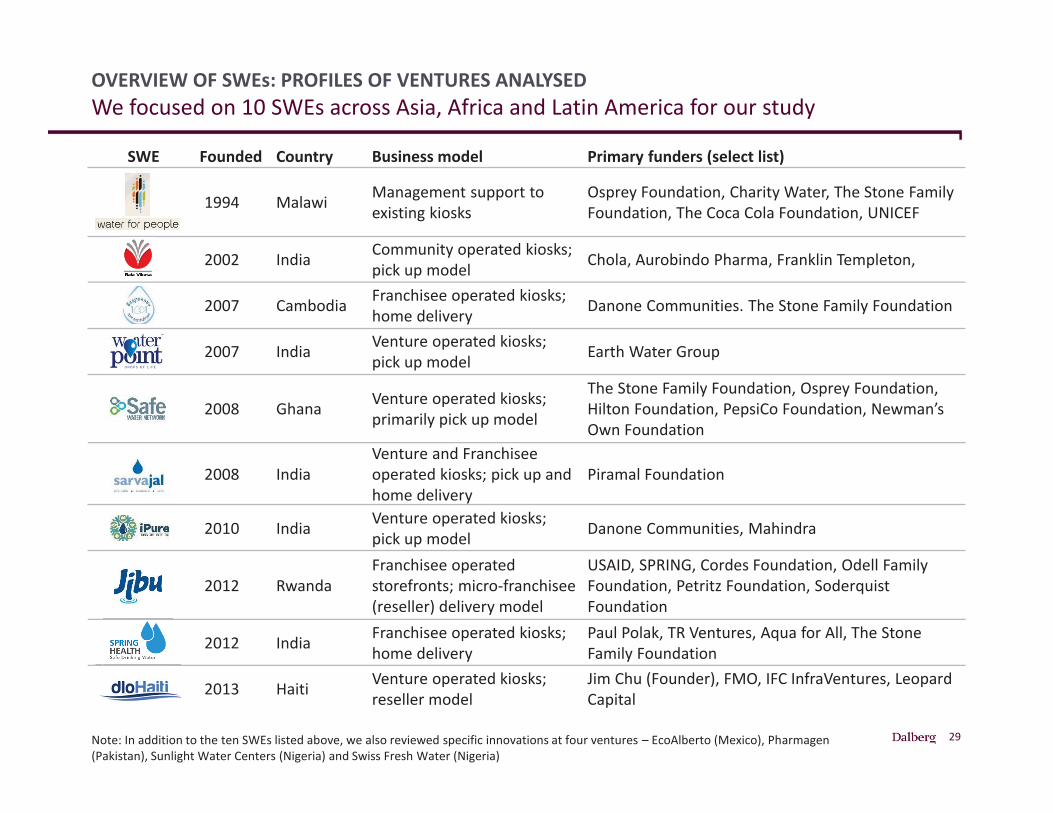
SWE Founded Country Business model Primary funders (select list)
1994 Malawi Management support to existing kiosks
Osprey Foundation, Charity Water, The Stone Family Foundation, The Coca Cola Foundation, UNICEF
2002 India Community operated kiosks; pick up model Chola, Aurobindo Pharma, Franklin Templeton,
2007 Cambodia Franchisee operated kiosks; home delivery Danone Communities. The Stone Family Foundation
2007 India Venture operated kiosks; pick up model Earth Water Group
2008 Ghana Venture operated kiosks; primarily pick up model
The Stone Family Foundation, Osprey Foundation, Hilton Foundation, PepsiCo Foundation, Newman’s Own Foundation
2008 IndiaVenture and Franchisee operated kiosks; pick up and home delivery
Piramal Foundation
2010 India Venture operated kiosks; pick up model Danone Communities, Mahindra
2012 RwandaFranchisee operated storefronts; micro-franchisee (reseller) delivery model
USAID, SPRING, Cordes Foundation, Odell Family Foundation, Petritz Foundation, Soderquist Foundation
2012 India Franchisee operated kiosks; home delivery
Paul Polak, TR Ventures, Aqua for All, The Stone Family Foundation
2013 Haiti Venture operated kiosks; reseller model
Jim Chu (Founder), FMO, IFC InfraVentures, Leopard Capital
OVERVIEW OF SWEs: PROFILES OF VENTURES ANALYSEDWe focused on 10 SWEs across Asia, Africa and Latin America for our study
Note: In addition to the ten SWEs listed above, we also reviewed specific innovations at four ventures – EcoAlberto (Mexico), Pharmagen (Pakistan), Sunlight Water Centers (Nigeria) and Swiss Fresh Water (Nigeria)
30
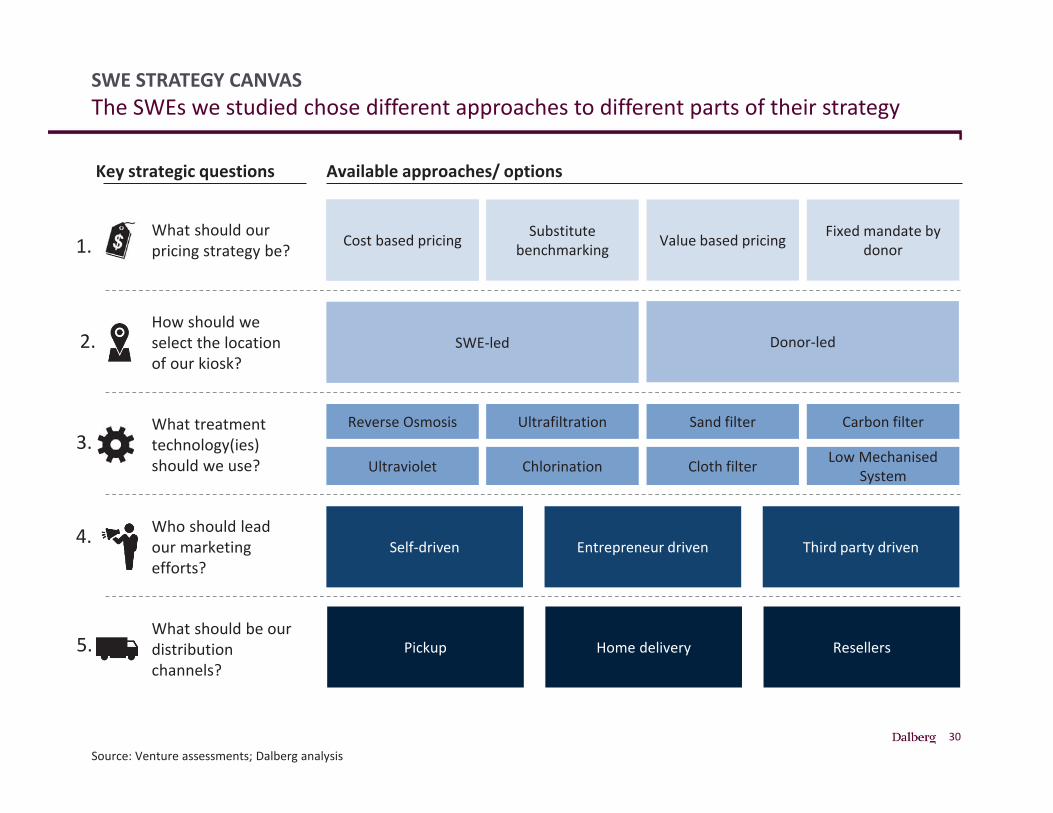
SWE STRATEGY CANVASThe SWEs we studied chose different approaches to different parts of their strategy
Source: Venture assessments; Dalberg analysis
What should our pricing strategy be?
How should we select the location of our kiosk?
What treatment technology(ies) should we use?
Who should lead our marketing efforts?
What should be our distribution channels?
Key strategic questions Available approaches/ options
Cost based pricing Substitute benchmarking Value based pricing Fixed mandate by
donor
Reverse Osmosis
Ultraviolet
Ultrafiltration
Chlorination
Sand filter
Cloth filter
Carbon filter
Low Mechanised System
Self-driven Entrepreneur driven Third party driven
Pickup Home delivery Resellers
Cost based pricing
SWE-led Donor-led
1.
2.
3.
4.
5.
31
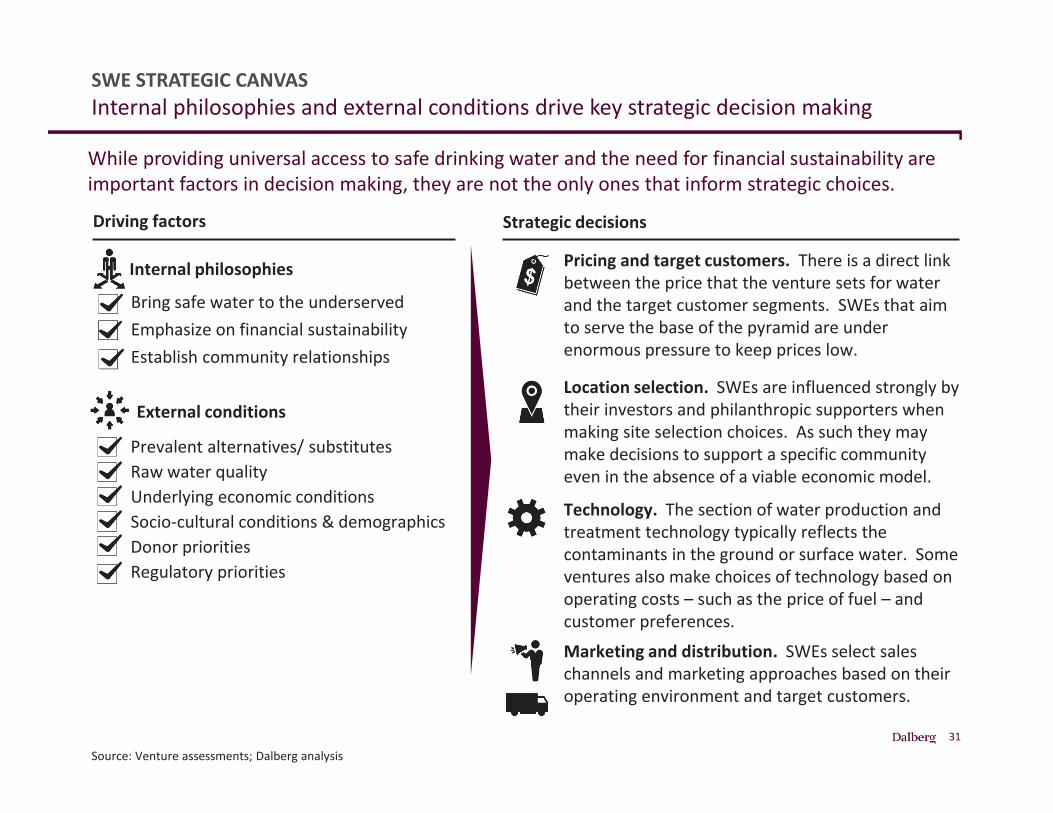
SWE STRATEGIC CANVASInternal philosophies and external conditions drive key strategic decision making
Source: Venture assessments; Dalberg analysis
Pricing and target customers. There is a direct linkbetween the price that the venture sets for water and the target customer segments. SWEs that aim to serve the base of the pyramid are under enormous pressure to keep prices low.
Location selection. SWEs are influenced strongly bytheir investors and philanthropic supporters when making site selection choices. As such they may make decisions to support a specific community even in the absence of a viable economic model.
Technology. The section of water production and treatment technology typically reflects the contaminants in the ground or surface water. Some ventures also make choices of technology based on operating costs – such as the price of fuel – and customer preferences. Marketing and distribution. SWEs select saleschannels and marketing approaches based on their operating environment and target customers.
External conditions
Prevalent alternatives/ substitutesRaw water qualityUnderlying economic conditions Socio-cultural conditions & demographicsDonor prioritiesRegulatory priorities
Internal philosophies
Emphasize on financial sustainabilityBring safe water to the underserved
Establish community relationships
Driving factors Strategic decisions
While providing universal access to safe drinking water and the need for financial sustainability are important factors in decision making, they are not the only ones that inform strategic choices.
32
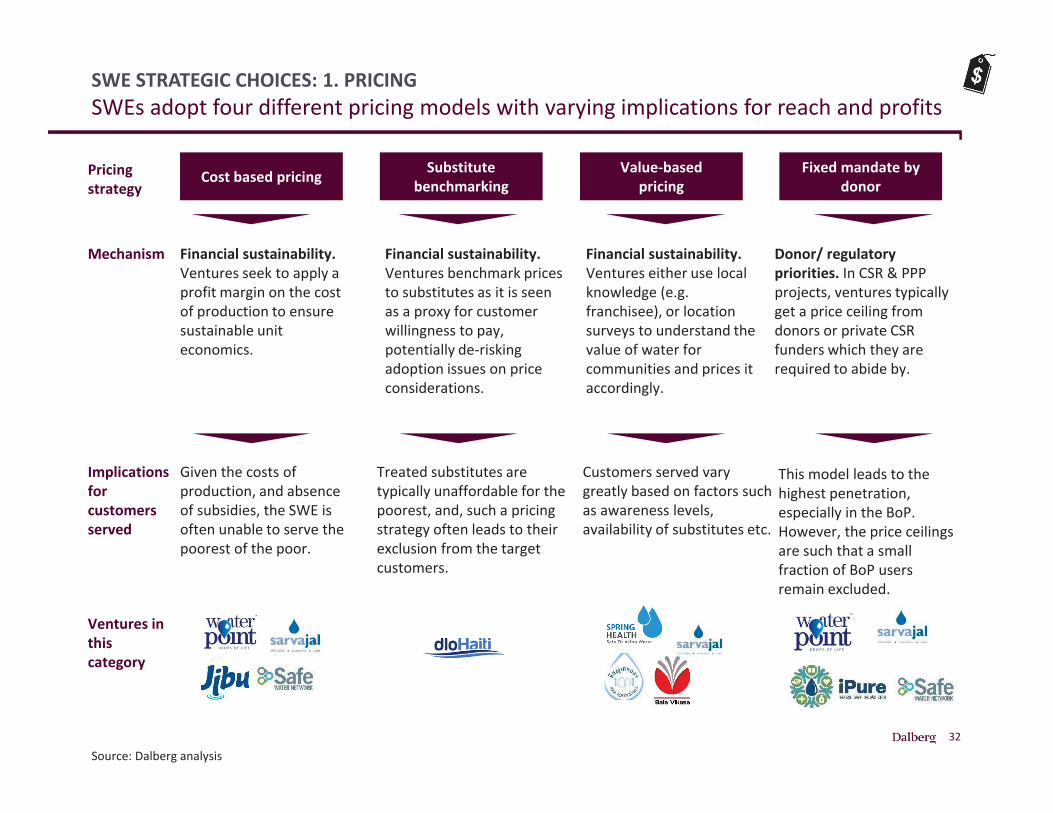
SWE STRATEGIC CHOICES: 1. PRICING SWEs adopt four different pricing models with varying implications for reach and profits
Source: Dalberg analysis
Implications for customers served
Given the costs of production, and absence of subsidies, the SWE is often unable to serve the poorest of the poor.
Treated substitutes are typically unaffordable for the poorest, and, such a pricing strategy often leads to their exclusion from the target customers.
Customers served vary greatly based on factors such as awareness levels, availability of substitutes etc.
This model leads to the highest penetration, especially in the BoP. However, the price ceilings are such that a small fraction of BoP users remain excluded.
Mechanism Financial sustainability. Ventures seek to apply a profit margin on the cost of production to ensure sustainable unit economics.
Financial sustainability.Ventures benchmark prices to substitutes as it is seen as a proxy for customer willingness to pay, potentially de-risking adoption issues on price considerations.
Financial sustainability. Ventures either use local knowledge (e.g. franchisee), or location surveys to understand the value of water for communities and prices it accordingly.
Donor/ regulatory priorities. In CSR & PPP projects, ventures typically get a price ceiling from donors or private CSR funders which they are required to abide by.
Ventures in this category
Cost based pricing Substitutebenchmarking
Value-basedpricing
Fixed mandate by donor
Pricing strategy
33
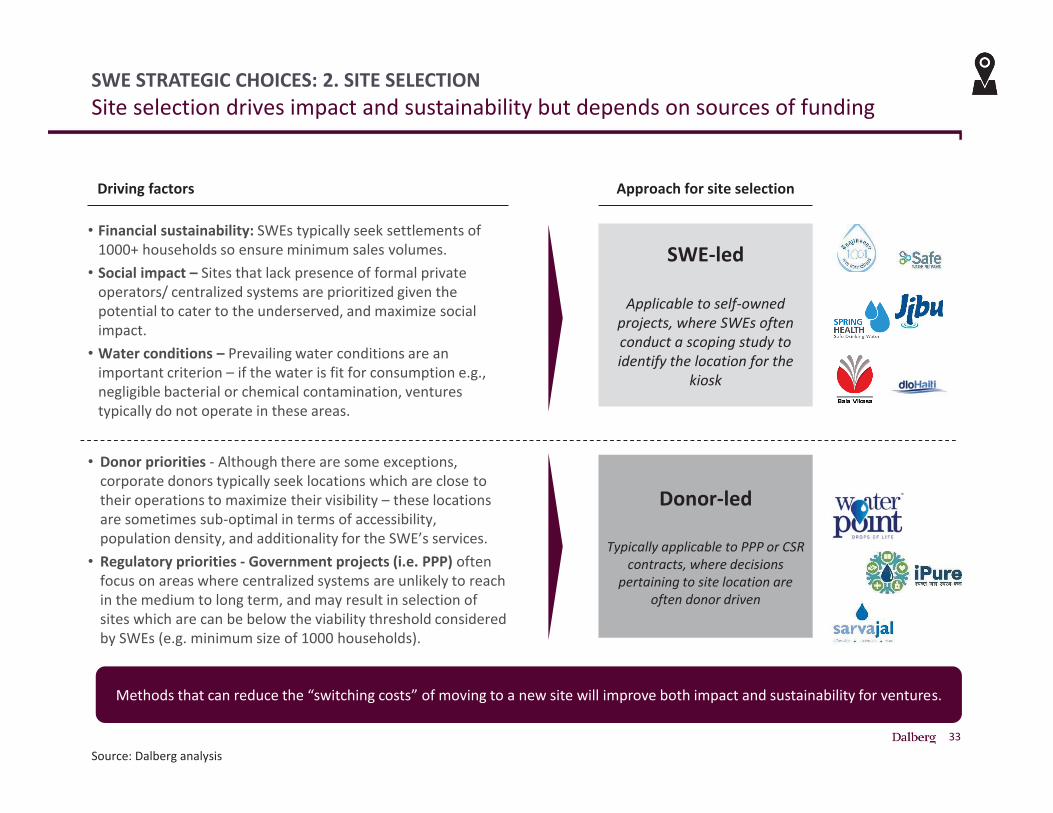
SWE STRATEGIC CHOICES: 2. SITE SELECTIONSite selection drives impact and sustainability but depends on sources of funding
Source: Dalberg analysis
Driving factors
• Donor priorities - Although there are some exceptions,corporate donors typically seek locations which are close to their operations to maximize their visibility – these locations are sometimes sub-optimal in terms of accessibility, population density, and additionality for the SWE’s services.
• Regulatory priorities - Government projects (i.e. PPP) often focus on areas where centralized systems are unlikely to reach in the medium to long term, and may result in selection of sites which are can be below the viability threshold considered by SWEs (e.g. minimum size of 1000 households).
• Financial sustainability: SWEs typically seek settlements of 1000+ households so ensure minimum sales volumes.
• Social impact – Sites that lack presence of formal private operators/ centralized systems are prioritized given the potential to cater to the underserved, and maximize social impact.
• Water conditions – Prevailing water conditions are an important criterion – if the water is fit for consumption e.g., negligible bacterial or chemical contamination, ventures typically do not operate in these areas.
Approach for site selection
Donor-led
Typically applicable to PPP or CSR contracts, where decisions
pertaining to site location are often donor driven
SWE-led
Applicable to self-owned projects, where SWEs often conduct a scoping study to identify the location for the
kiosk
Methods that can reduce the “switching costs” of moving to a new site will improve both impact and sustainability for ventures.
34
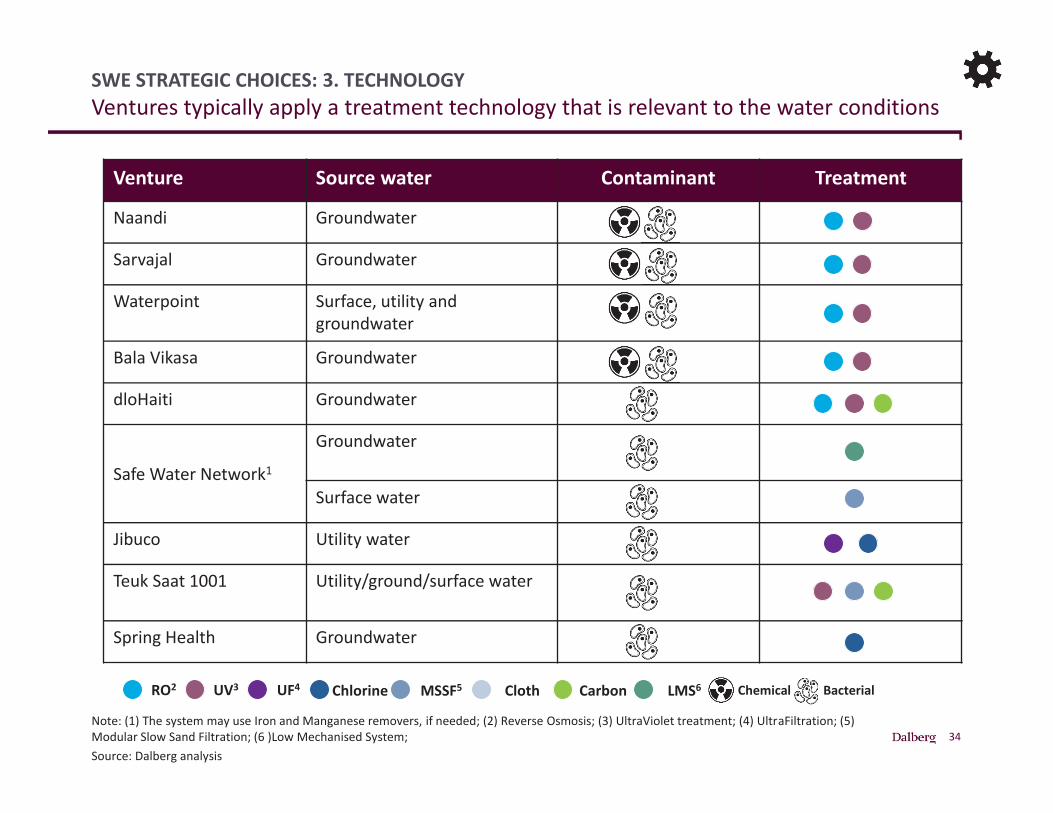
SWE STRATEGIC CHOICES: 3. TECHNOLOGYVentures typically apply a treatment technology that is relevant to the water conditions
Note: (1) The system may use Iron and Manganese removers, if needed; (2) Reverse Osmosis; (3) UltraViolet treatment; (4) UltraFiltration; (5) Modular Slow Sand Filtration; (6 )Low Mechanised System; Source: Dalberg analysis
Venture Source water Contaminant Treatment
Naandi Groundwater
Sarvajal Groundwater
Waterpoint Surface, utility and groundwater
Bala Vikasa Groundwater
dloHaiti Groundwater
Safe Water Network1
Groundwater
Surface water
Jibuco Utility water
Teuk Saat 1001 Utility/ground/surface water
Spring Health Groundwater
RO2 UV3 UF4 Chlorine MSSF5 Cloth Carbon LMS6 Chemical Bacterial
35
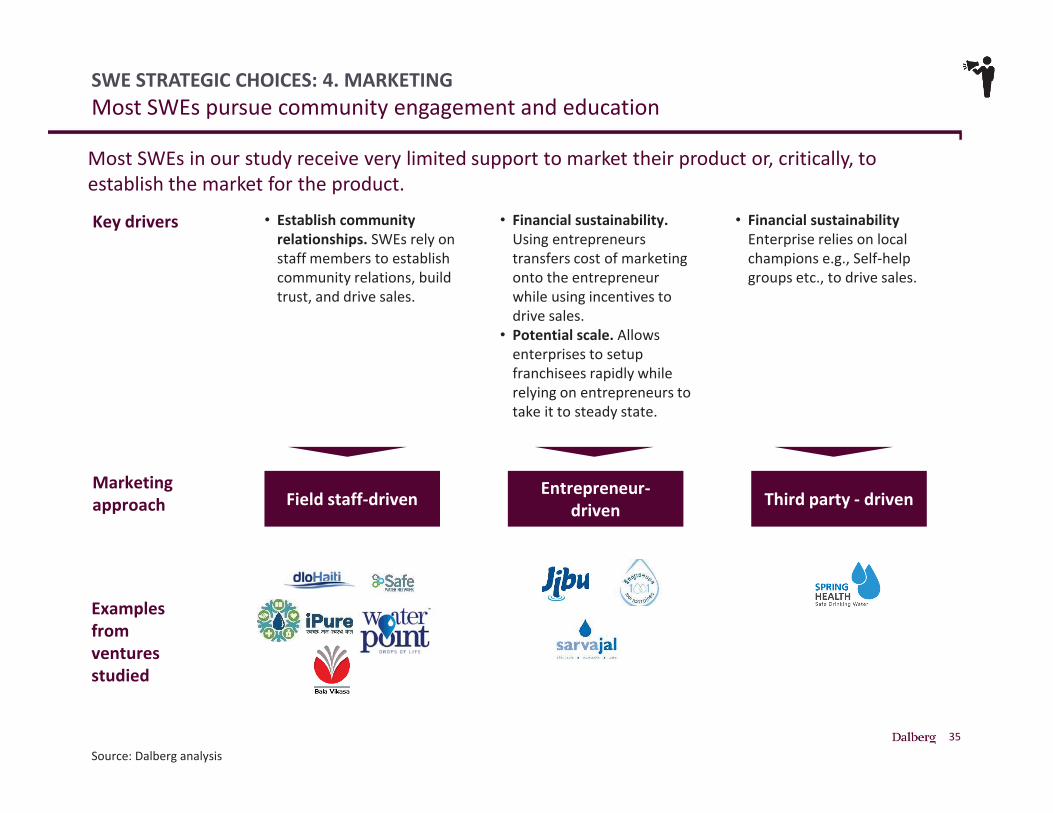
SWE STRATEGIC CHOICES: 4. MARKETINGMost SWEs pursue community engagement and education
Source: Dalberg analysis
Field staff-driven Entrepreneur-driven Third party - driven
Key drivers • Establish community relationships. SWEs rely on staff members to establish community relations, build trust, and drive sales.
• Financial sustainability. Using entrepreneurs transfers cost of marketing onto the entrepreneur while using incentives to drive sales.
• Potential scale. Allows enterprises to setup franchisees rapidly while relying on entrepreneurs to take it to steady state.
• Financial sustainability Enterprise relies on local champions e.g., Self-help groups etc., to drive sales.
Examples from ventures studied
Marketing approach
Most SWEs in our study receive very limited support to market their product or, critically, to establish the market for the product.
36
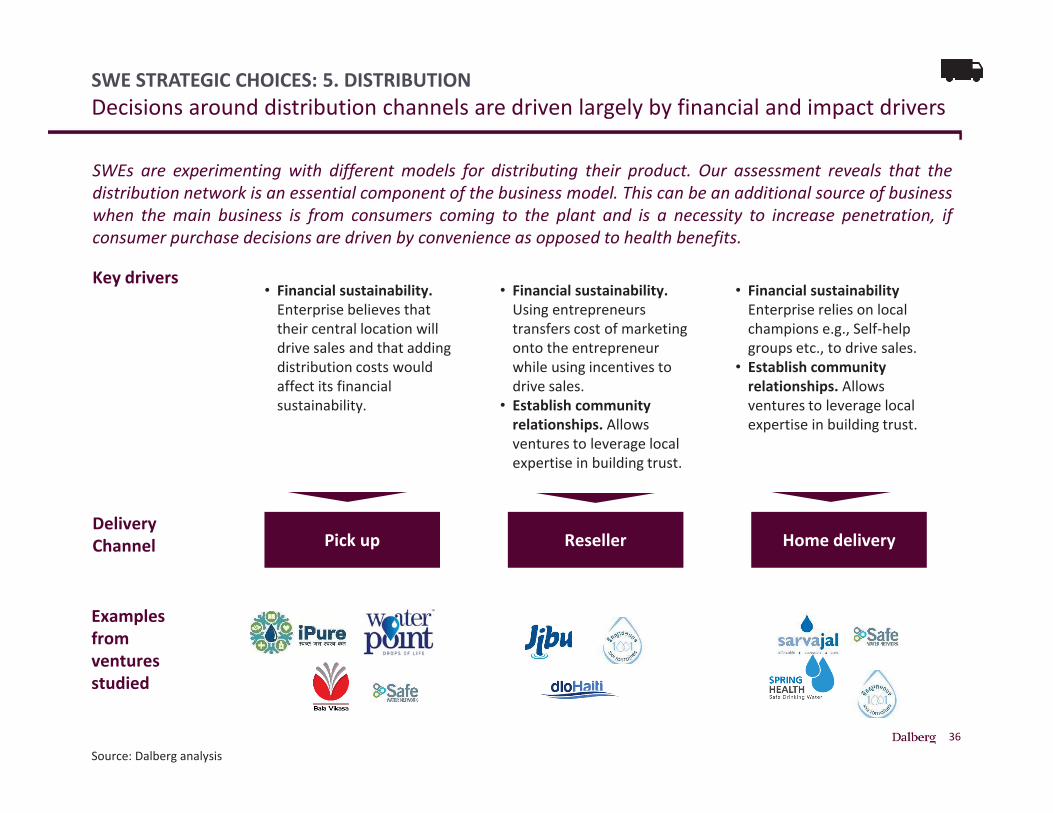
SWE STRATEGIC CHOICES: 5. DISTRIBUTIONDecisions around distribution channels are driven largely by financial and impact drivers
Source: Dalberg analysis
Pick up Reseller Home delivery
• Financial sustainability. Enterprise believes that their central location will drive sales and that adding distribution costs would affect its financial sustainability.
• Financial sustainability. Using entrepreneurs transfers cost of marketing onto the entrepreneur while using incentives to drive sales.
• Establish community relationships. Allows ventures to leverage local expertise in building trust.
• Financial sustainability Enterprise relies on local champions e.g., Self-help groups etc., to drive sales.
• Establish community relationships. Allows ventures to leverage local expertise in building trust.
SWEs are experimenting with different models for distributing their product. Our assessment reveals that thedistribution network is an essential component of the business model. This can be an additional source of businesswhen the main business is from consumers coming to the plant and is a necessity to increase penetration, ifconsumer purchase decisions are driven by convenience as opposed to health benefits.
Key drivers
Examples from ventures studied
Delivery Channel
37
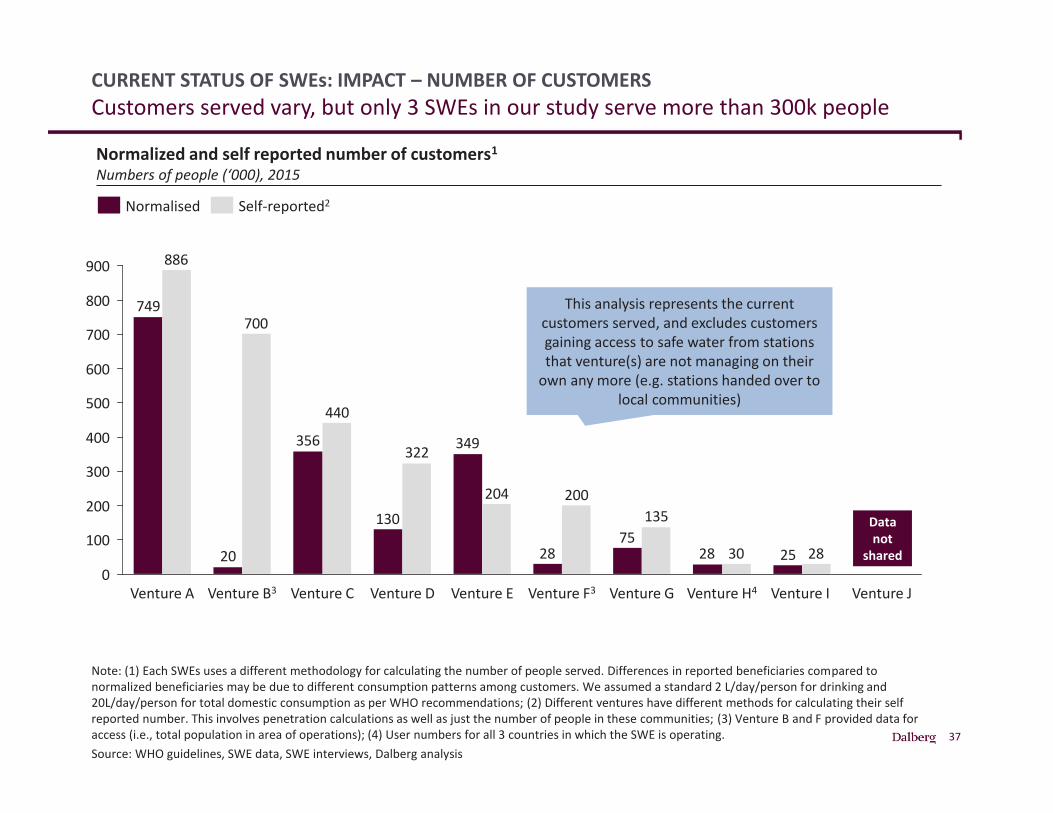
CURRENT STATUS OF SWEs: IMPACT – NUMBER OF CUSTOMERSCustomers served vary, but only 3 SWEs in our study serve more than 300k people
Note: (1) Each SWEs uses a different methodology for calculating the number of people served. Differences in reported beneficiaries compared to normalized beneficiaries may be due to different consumption patterns among customers. We assumed a standard 2 L/day/person for drinking and 20L/day/person for total domestic consumption as per WHO recommendations; (2) Different ventures have different methods for calculating their self reported number. This involves penetration calculations as well as just the number of people in these communities; (3) Venture B and F provided data for access (i.e., total population in area of operations); (4) User numbers for all 3 countries in which the SWE is operating.Source: WHO guidelines, SWE data, SWE interviews, Dalberg analysis
Normalized and self reported number of customers1
Numbers of people (‘000), 2015
252875
28
349
130
356
20
749
2830
135200204
322
440
700
886
0
100
200
300
400
500
600
700
800
900
Venture H4 Venture JVenture IVenture B3 Venture C Venture E Venture F3Venture DVenture A Venture G
Self-reported2Normalised
Data not
shared
This analysis represents the current customers served, and excludes customers gaining access to safe water from stations that venture(s) are not managing on their
own any more (e.g. stations handed over to local communities)
38
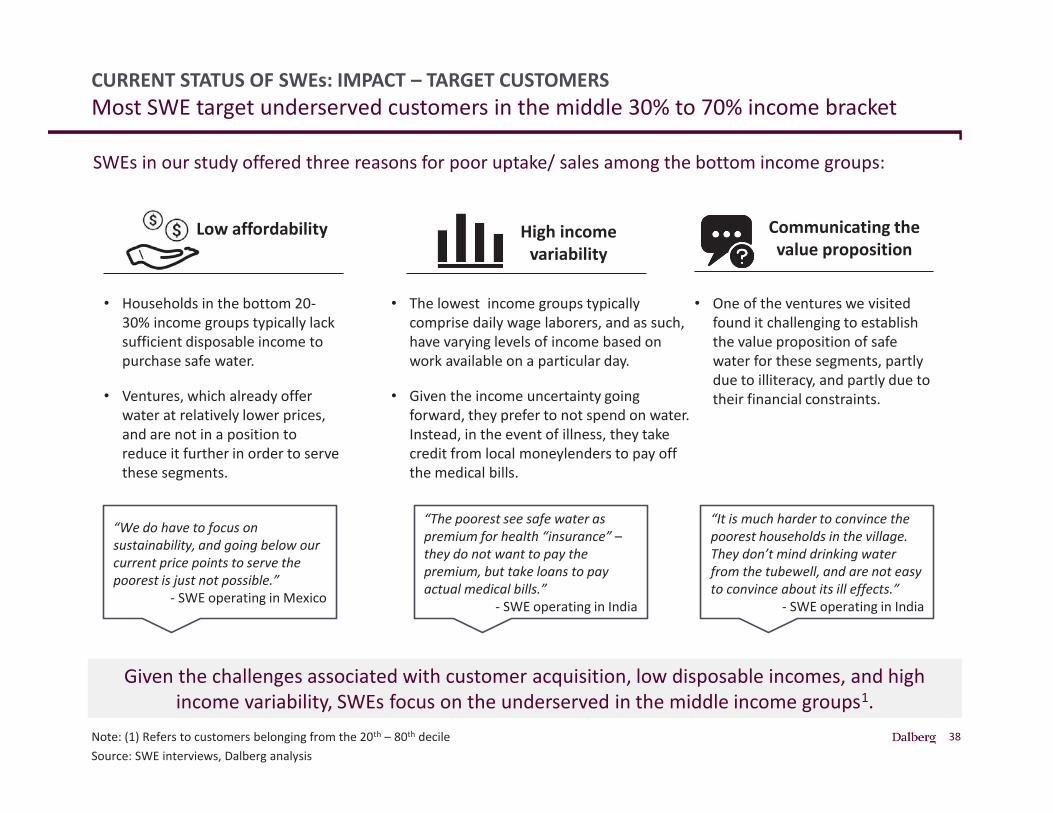
CURRENT STATUS OF SWEs: IMPACT – TARGET CUSTOMERSMost SWE target underserved customers in the middle 30% to 70% income bracket
Note: (1) Refers to customers belonging from the 20th – 80th decileSource: SWE interviews, Dalberg analysis
Low affordability High income variability
Communicating the value proposition
• Households in the bottom 20-30% income groups typically lack sufficient disposable income to purchase safe water.
• Ventures, which already offer water at relatively lower prices, and are not in a position to reduce it further in order to serve these segments.
Given the challenges associated with customer acquisition, low disposable incomes, and high income variability, SWEs focus on the underserved in the middle income groups1.
• The lowest income groups typically comprise daily wage laborers, and as such, have varying levels of income based on work available on a particular day.
• Given the income uncertainty going forward, they prefer to not spend on water. Instead, in the event of illness, they take credit from local moneylenders to pay off the medical bills.
• One of the ventures we visited found it challenging to establish the value proposition of safe water for these segments, partly due to illiteracy, and partly due to their financial constraints.
SWEs in our study offered three reasons for poor uptake/ sales among the bottom income groups:
“The poorest see safe water as premium for health “insurance” –they do not want to pay the premium, but take loans to pay actual medical bills.”
- SWE operating in India
“It is much harder to convince the poorest households in the village. They don’t mind drinking water from the tubewell, and are not easy to convince about its ill effects.”
- SWE operating in India
“We do have to focus on sustainability, and going below our current price points to serve the poorest is just not possible.”
- SWE operating in Mexico
39
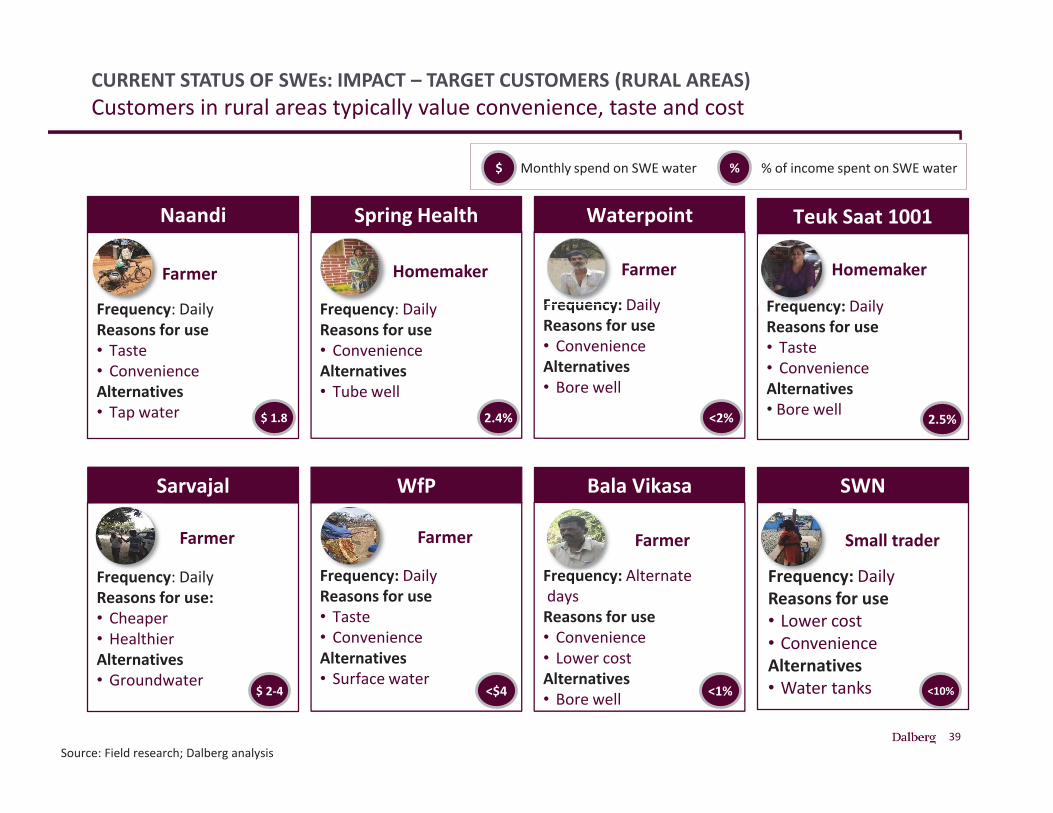
CURRENT STATUS OF SWEs: IMPACT – TARGET CUSTOMERS (RURAL AREAS)Customers in rural areas typically value convenience, taste and cost
Source: Field research; Dalberg analysis
Spring Health
Frequency: DailyReasons for use• ConvenienceAlternatives• Tube well
F
Homemaker
2.4%
Naandi
Frequency: DailyReasons for use• Taste• ConvenienceAlternatives• Tap water
F
Farmer
$ 1.8
Teuk Saat 1001
Frequency: DailyReasons for use• Taste• ConvenienceAlternatives• Bore well
Frequenc
Homemaker
2.5%
Sarvajal
Frequency: DailyReasons for use: • Cheaper • HealthierAlternatives• Groundwater
F
Farmer
$ 2-4
Small trader
Frequency: DailyReasons for use• Lower cost• ConvenienceAlternatives• Water tanks
SWN
<10%
Frequency: AlternatedaysReasons for use• Convenience• Lower costAlternatives• Bore well
Frequency
Bala Vikasa
Farmer
<1%
Waterpoint
Frequency: DailyReasons for use• ConvenienceAlternatives• Bore well
Frequency
Farmer
<2%
WfP
Frequency: DailyReasons for use• Taste• ConvenienceAlternatives• Surface water
Frequency
Farmer
<$4
$ %Monthly spend on SWE water % of income spent on SWE water
40
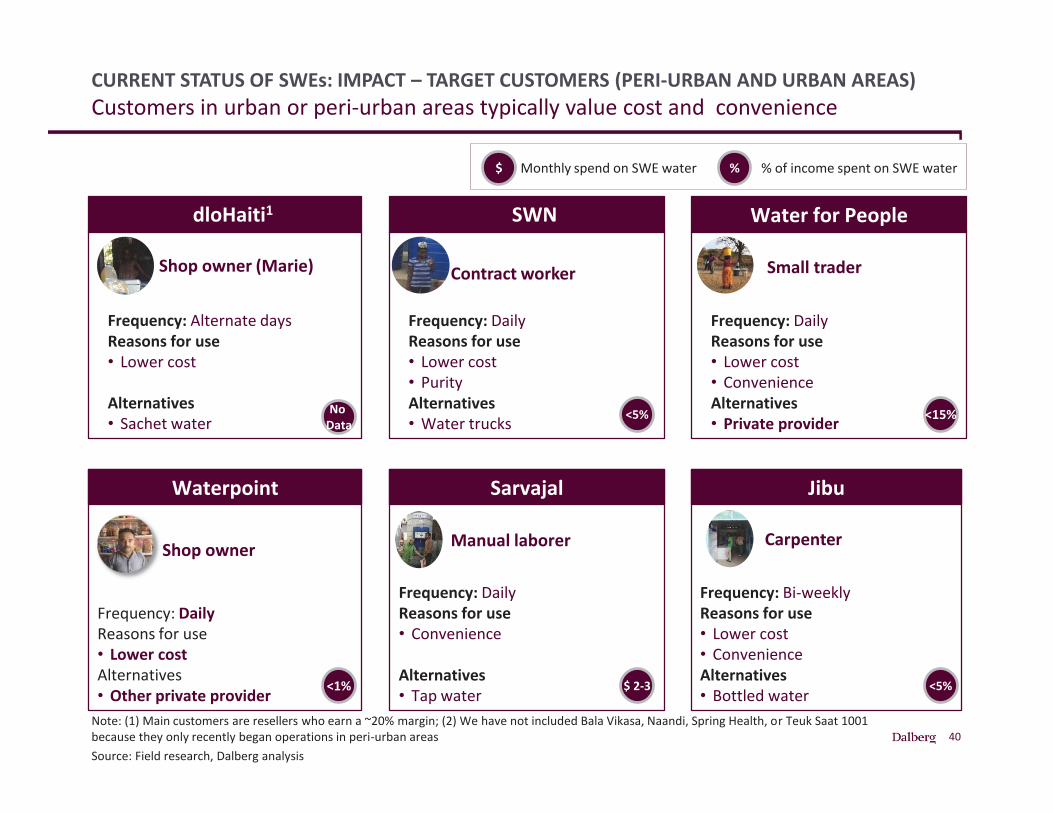
CURRENT STATUS OF SWEs: IMPACT – TARGET CUSTOMERS (PERI-URBAN AND URBAN AREAS)Customers in urban or peri-urban areas typically value cost and convenience
Note: (1) Main customers are resellers who earn a ~20% margin; (2) We have not included Bala Vikasa, Naandi, Spring Health, or Teuk Saat 1001 because they only recently began operations in peri-urban areas Source: Field research, Dalberg analysis
dloHaiti1
Frequency: Alternate daysReasons for use• Lower cost
Alternatives• Sachet water
Shop owner (Marie)
Waterpoint
Frequency: DailyReasons for use• Lower costAlternatives• Other private provider
Shop owner
Sarvajal
Frequency: DailyReasons for use• Convenience
Alternatives• Tap water
Manual laborer
Jibu
Frequency: Bi-weeklyReasons for use• Lower cost• ConvenienceAlternatives• Bottled water
Carpenter
$ 2-3
SWN
Frequency: DailyReasons for use• Lower cost• PurityAlternatives• Water trucks
Contract worker
<5%
<5%<1%
Water for People
Frequency: DailyReasons for use• Lower cost • Convenience Alternatives• Private provider
Small trader
<15%
$ %Monthly spend on SWE water % of income spent on SWE water
No Data
41
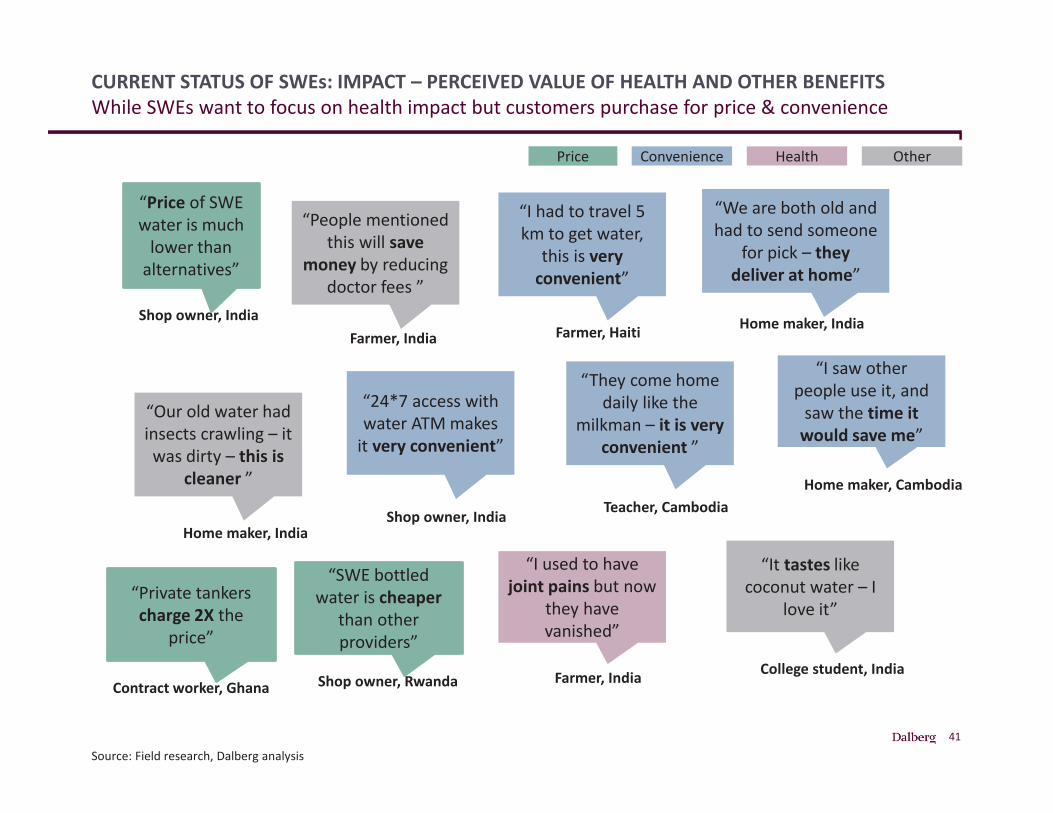
CURRENT STATUS OF SWEs: IMPACT – PERCEIVED VALUE OF HEALTH AND OTHER BENEFITSWhile SWEs want to focus on health impact but customers purchase for price & convenience
Source: Field research, Dalberg analysis
“Price of SWE water is much
lower than alternatives”
“People mentioned this will save
money by reducing doctor fees ”
Shop owner, IndiaFarmer, India
“Our old water had insects crawling – it was dirty – this is
cleaner ”
Home maker, India
“I had to travel 5 km to get water,
this is very convenient”
Farmer, Haiti
“24*7 access with water ATM makes
it very convenient”
Shop owner, India
“We are both old and had to send someone
for pick – they deliver at home”
Home maker, India
“They come home daily like the
milkman – it is very convenient ”
Teacher, Cambodia
“I used to have joint pains but now
they have vanished”
Farmer, India
“It tastes like coconut water – I
love it”
College student, India
“I saw other people use it, and
saw the time it would save me”
Home maker, Cambodia
“Private tankers charge 2X the
price”
Contract worker, Ghana
“SWE bottled water is cheaper
than other providers”
Shop owner, Rwanda
Price Convenience Health Other
42
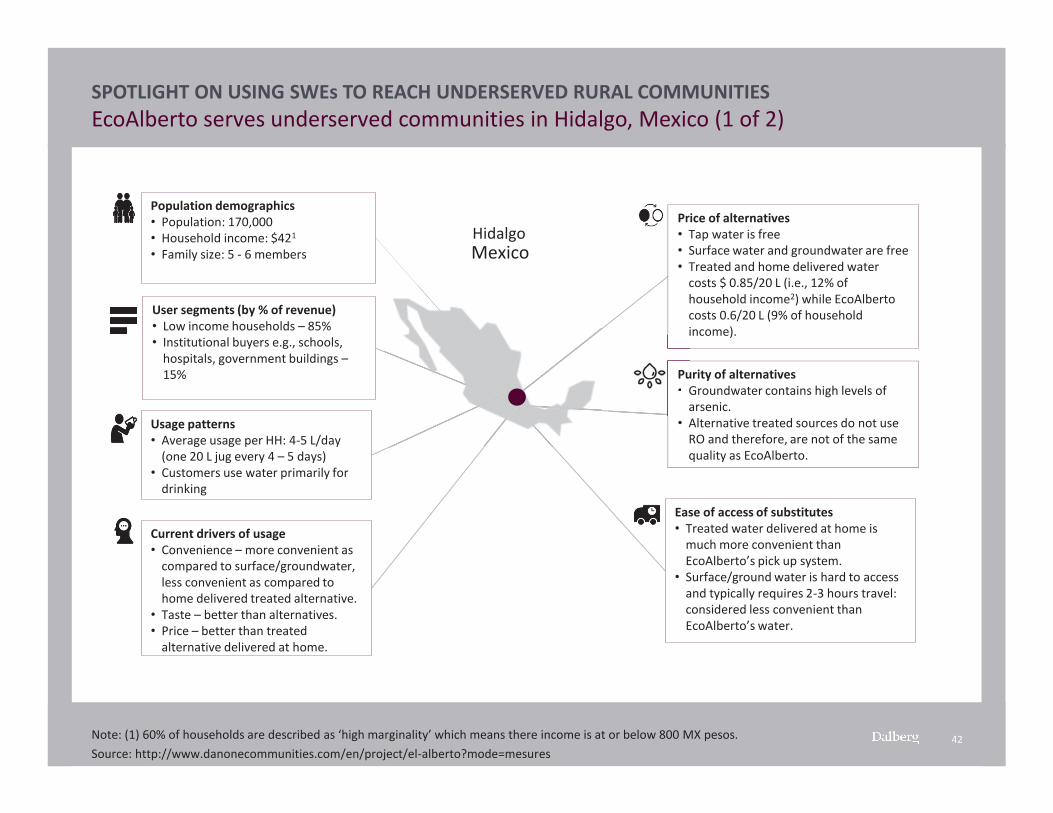
SPOTLIGHT ON USING SWEs TO REACH UNDERSERVED RURAL COMMUNITIESEcoAlberto serves underserved communities in Hidalgo, Mexico (1 of 2)
Note: (1) 60% of households are described as ‘high marginality’ which means there income is at or below 800 MX pesos.Source: http://www.danonecommunities.com/en/project/el-alberto?mode=mesures
Population demographics• Population: 170,000• Household income: $421
• Family size: 5 - 6 members
User segments (by % of revenue)• Low income households – 85%• Institutional buyers e.g., schools,
hospitals, government buildings –15%
Usage patterns• Average usage per HH: 4-5 L/day
(one 20 L jug every 4 – 5 days) • Customers use water primarily for
drinking
Current drivers of usage • Convenience – more convenient as
compared to surface/groundwater, less convenient as compared to home delivered treated alternative.
• Taste – better than alternatives.• Price – better than treated
alternative delivered at home.
Price of alternatives • Tap water is free• Surface water and groundwater are free• Treated and home delivered water
costs $ 0.85/20 L (i.e., 12% of household income2) while EcoAlberto costs 0.6/20 L (9% of household income).
Purity of alternatives • Groundwater contains high levels of
arsenic.• Alternative treated sources do not use
RO and therefore, are not of the same quality as EcoAlberto.
Ease of access of substitutes • Treated water delivered at home is
much more convenient than EcoAlberto’s pick up system.
• Surface/ground water is hard to access and typically requires 2-3 hours travel: considered less convenient than EcoAlberto’s water.
i
Pu• G
a
MexicoHidalgo
43
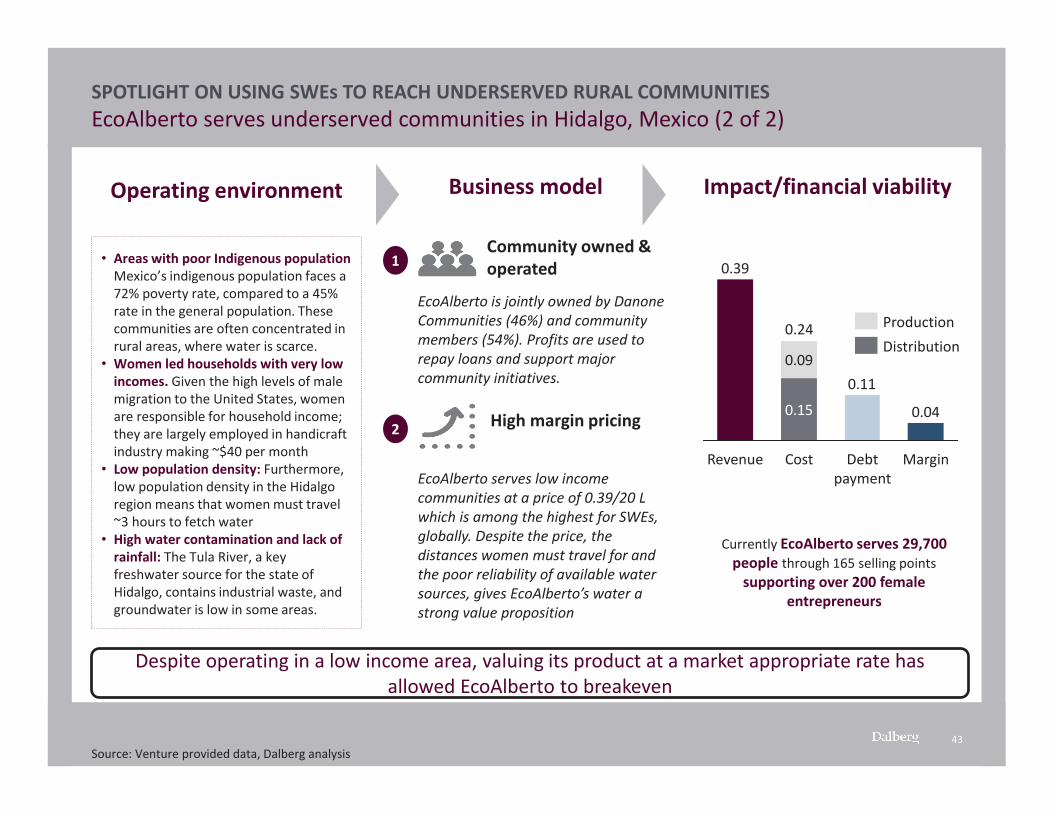
SPOTLIGHT ON USING SWEs TO REACH UNDERSERVED RURAL COMMUNITIESEcoAlberto serves underserved communities in Hidalgo, Mexico (2 of 2)
Source: Venture provided data, Dalberg analysis
Operating environment Business model Impact/financial viability
• Areas with poor Indigenous population Mexico’s indigenous population faces a 72% poverty rate, compared to a 45% rate in the general population. These communities are often concentrated in rural areas, where water is scarce.
• Women led households with very low incomes. Given the high levels of male migration to the United States, women are responsible for household income; they are largely employed in handicraft industry making ~$40 per month
• Low population density: Furthermore, low population density in the Hidalgo region means that women must travel ~3 hours to fetch water
• High water contamination and lack of rainfall: The Tula River, a key freshwater source for the state of Hidalgo, contains industrial waste, and groundwater is low in some areas.
1
2
Community owned & operated
High margin pricing
EcoAlberto is jointly owned by Danone Communities (46%) and community members (54%). Profits are used to repay loans and support major community initiatives.
EcoAlberto serves low income communities at a price of 0.39/20 L which is among the highest for SWEs, globally. Despite the price, the distances women must travel for and the poor reliability of available water sources, gives EcoAlberto’s water a strong value proposition
0.04
0.110.15
0.09
0.39
Debt payment
Cost
0.24
MarginRevenue
ProductionDistribution
Currently EcoAlberto serves 29,700 people through 165 selling points
supporting over 200 female entrepreneurs
Despite operating in a low income area, valuing its product at a market appropriate rate has allowed EcoAlberto to breakeven
44
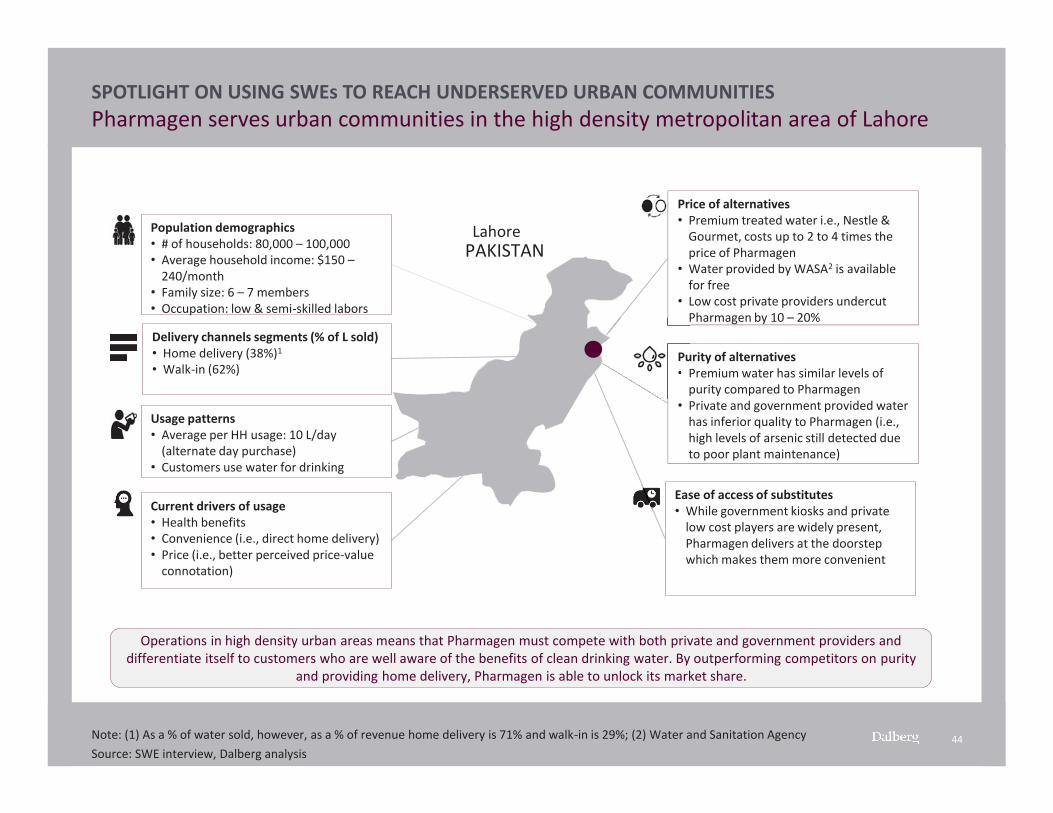
Population demographics• # of households: 80,000 – 100,000• Average household income: $150 –
240/month • Family size: 6 – 7 members • Occupation: low & semi-skilled labors
Delivery channels segments (% of L sold)• Home delivery (38%)1
• Walk-in (62%)
Usage patterns • Average per HH usage: 10 L/day
(alternate day purchase) • Customers use water for drinking
Current drivers of usage • Health benefits • Convenience (i.e., direct home delivery)• Price (i.e., better perceived price-value
connotation)
Price of alternatives • Premium treated water i.e., Nestle &
Gourmet, costs up to 2 to 4 times the price of Pharmagen
• Water provided by WASA2 is available for free
• Low cost private providers undercut Pharmagen by 10 – 20%
Purity of alternatives • Premium water has similar levels of
purity compared to Pharmagen• Private and government provided water
has inferior quality to Pharmagen (i.e., high levels of arsenic still detected due to poor plant maintenance)
Ease of access of substitutes • While government kiosks and private
low cost players are widely present, Pharmagen delivers at the doorstep which makes them more convenient
P
Pu• P
p
PAKISTANLahore
Operations in high density urban areas means that Pharmagen must compete with both private and government providers and differentiate itself to customers who are well aware of the benefits of clean drinking water. By outperforming competitors on purity
and providing home delivery, Pharmagen is able to unlock its market share.
Note: (1) As a % of water sold, however, as a % of revenue home delivery is 71% and walk-in is 29%; (2) Water and Sanitation Agency Source: SWE interview, Dalberg analysis
SPOTLIGHT ON USING SWEs TO REACH UNDERSERVED URBAN COMMUNITIESPharmagen serves urban communities in the high density metropolitan area of Lahore
45
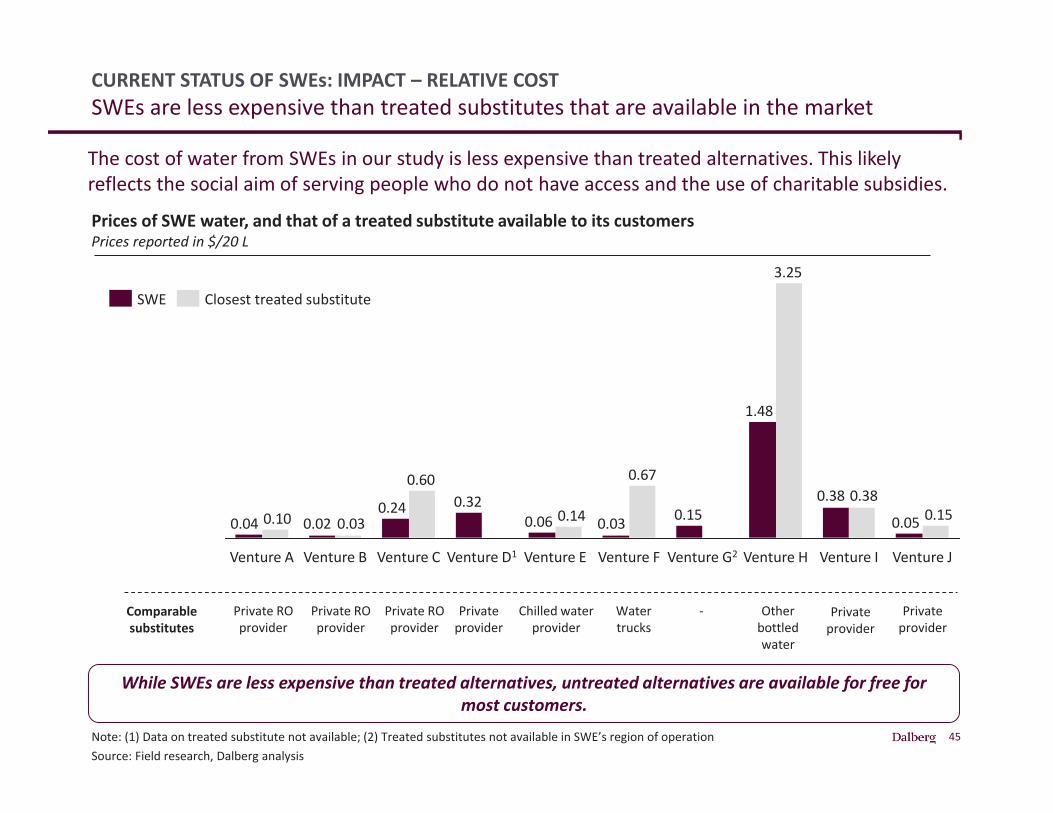
CURRENT STATUS OF SWEs: IMPACT – RELATIVE COSTSWEs are less expensive than treated substitutes that are available in the market
Note: (1) Data on treated substitute not available; (2) Treated substitutes not available in SWE’s region of operationSource: Field research, Dalberg analysis
0.05
0.38
1.48
0.150.030.060.320.24
0.020.04 0.150.38
3.25
0.67
0.14
0.60
0.030.10
Venture JVenture IVenture D1Venture CVenture B Venture E Venture G2Venture FVenture A Venture H
SWE Closest treated substitute
Prices of SWE water, and that of a treated substitute available to its customersPrices reported in $/20 L
While SWEs are less expensive than treated alternatives, untreated alternatives are available for free for most customers.
Private ROprovider
Private ROprovider
Private ROprovider
Privateprovider
Chilled waterprovider
Watertrucks
Otherbottled water
Private provider
Private provider
-Comparable substitutes
The cost of water from SWEs in our study is less expensive than treated alternatives. This likely reflects the social aim of serving people who do not have access and the use of charitable subsidies.
46
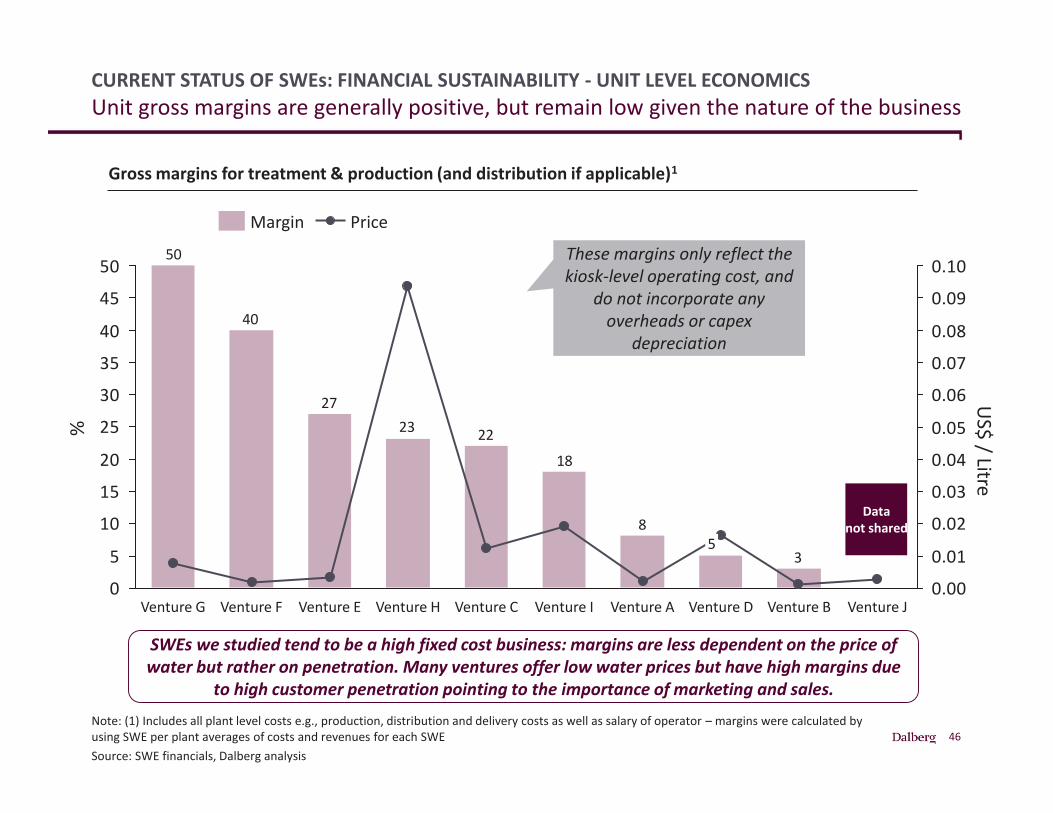
CURRENT STATUS OF SWEs: FINANCIAL SUSTAINABILITY - UNIT LEVEL ECONOMICSUnit gross margins are generally positive, but remain low given the nature of the business
Note: (1) Includes all plant level costs e.g., production, distribution and delivery costs as well as salary of operator – margins were calculated by using SWE per plant averages of costs and revenues for each SWE Source: SWE financials, Dalberg analysis
Gross margins for treatment & production (and distribution if applicable)1
Datanot shared
These margins only reflect the kiosk-level operating cost, and
do not incorporate any overheads or capex
depreciation
8
182223
40
50
3
27
0
5
10
15
20
25
30
35
40
45
50
0.00
0.01
0.02
0.03
0.04
0.05
0.06
0.07
0.08
0.09
0.10
Venture E Venture JVenture BVenture DVenture F Venture IVenture H
5
Venture AVenture CVenture G
PriceMargin
SWEs we studied tend to be a high fixed cost business: margins are less dependent on the price of water but rather on penetration. Many ventures offer low water prices but have high margins due
to high customer penetration pointing to the importance of marketing and sales.
%US$ / Litre
47
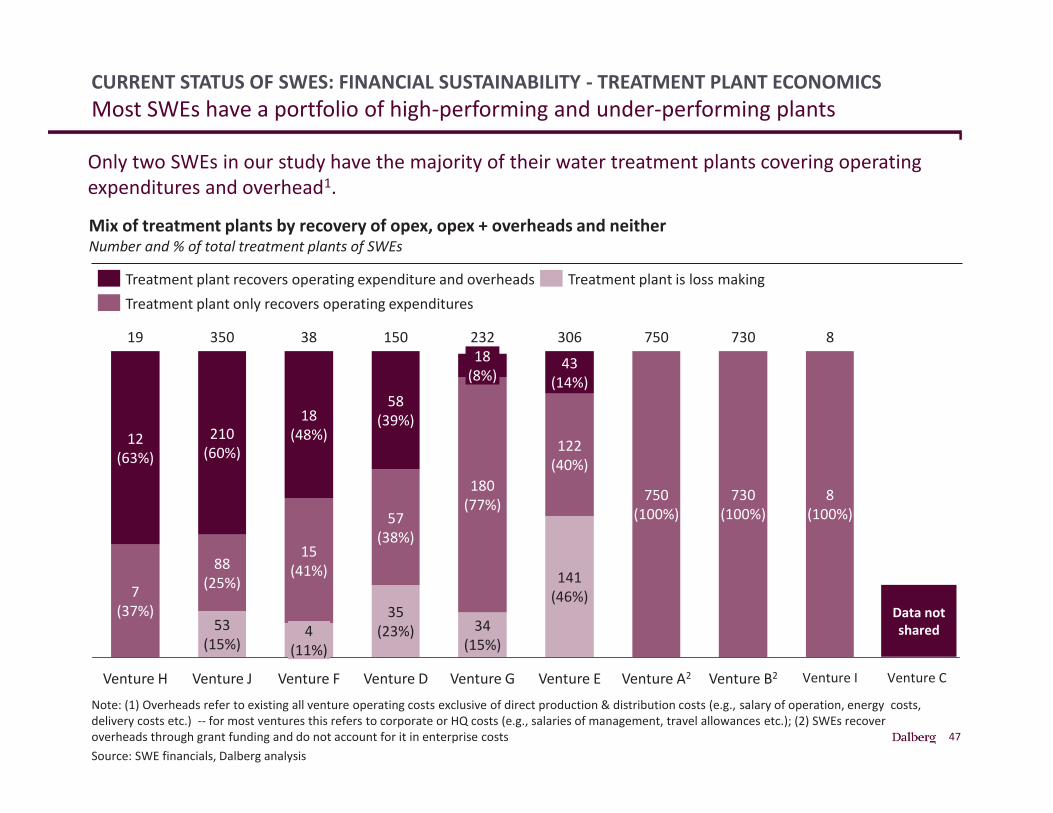
Mix of treatment plants by recovery of opex, opex + overheads and neitherNumber and % of total treatment plants of SWEs
Note: (1) Overheads refer to existing all venture operating costs exclusive of direct production & distribution costs (e.g., salary of operation, energy costs, delivery costs etc.) -- for most ventures this refers to corporate or HQ costs (e.g., salaries of management, travel allowances etc.); (2) SWEs recover overheads through grant funding and do not account for it in enterprise costsSource: SWE financials, Dalberg analysis
Venture E
122(40%)
18(8%)
750
Venture CVenture G
180(77%)
Venture I
306232
35(23%)
Venture A2Venture DVenture F
38
4(11%)
8
Venture B2
141(46%)
34(15%)
73043
(14%)
150
57(38%)
58(39%)
Venture J
7(37%)
350
15(41%)
53(15%)
19
Venture H
88(25%)
18(48%)12
(63%)210
(60%)
8(100%)
730(100%)
750(100%)
Treatment plant only recovers operating expendituresTreatment plant is loss makingTreatment plant recovers operating expenditure and overheads
Data not shared
CURRENT STATUS OF SWES: FINANCIAL SUSTAINABILITY - TREATMENT PLANT ECONOMICSMost SWEs have a portfolio of high-performing and under-performing plants
Only two SWEs in our study have the majority of their water treatment plants covering operating expenditures and overhead1.
48
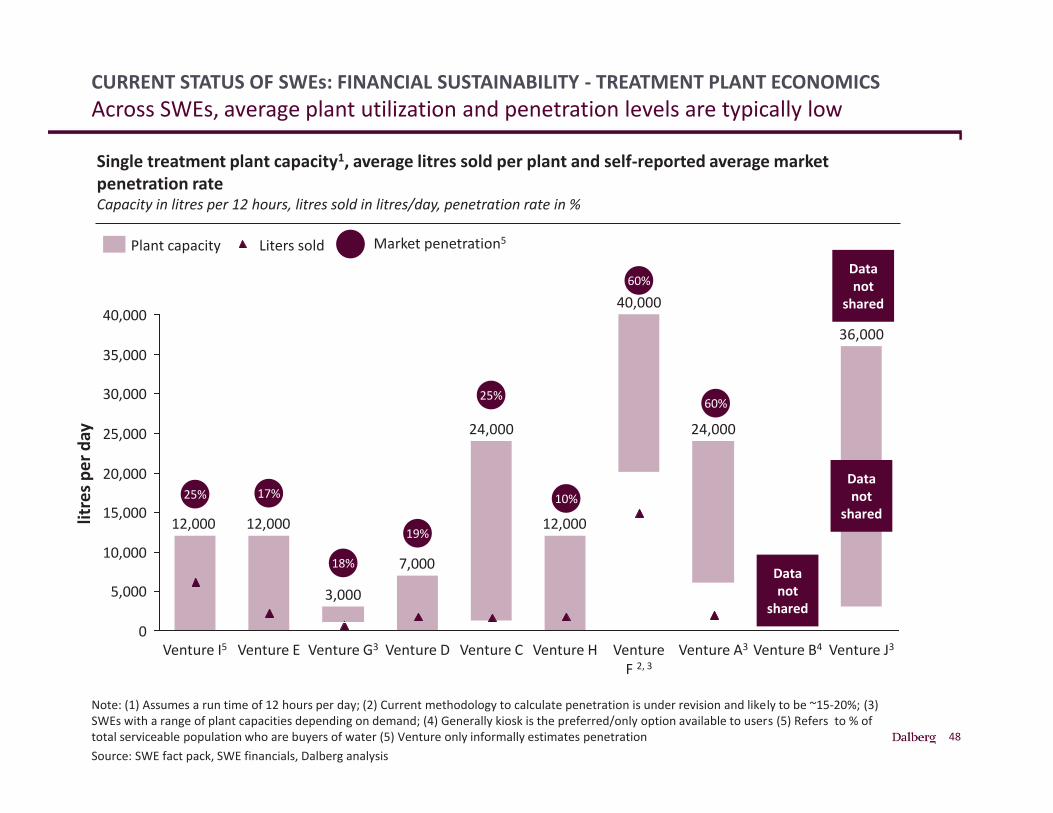
CURRENT STATUS OF SWEs: FINANCIAL SUSTAINABILITY - TREATMENT PLANT ECONOMICSAcross SWEs, average plant utilization and penetration levels are typically low
Note: (1) Assumes a run time of 12 hours per day; (2) Current methodology to calculate penetration is under revision and likely to be ~15-20%; (3) SWEs with a range of plant capacities depending on demand; (4) Generally kiosk is the preferred/only option available to users (5) Refers to % of total serviceable population who are buyers of water (5) Venture only informally estimates penetration Source: SWE fact pack, SWE financials, Dalberg analysis
12,000
7,000
12,00012,000
0
5,000
10,000
15,000
20,000
25,000
30,000
35,000
40,00040,000
Venture B4Venture G3 Venture A3 Venture J3Venture F 2, 3
36,000
24,000
Venture HVenture CVenture DVenture I5 Venture E
3,000
24,000
Plant capacity Liters sold
Single treatment plant capacity1, average litres sold per plant and self-reported average market penetration rateCapacity in litres per 12 hours, litres sold in litres/day, penetration rate in %
Data not
sharedlitre
s per
day
25% 17%
18%
19%
25%
10%
60%
60%
Market penetration5
Data not
shared
Data not
shared
49
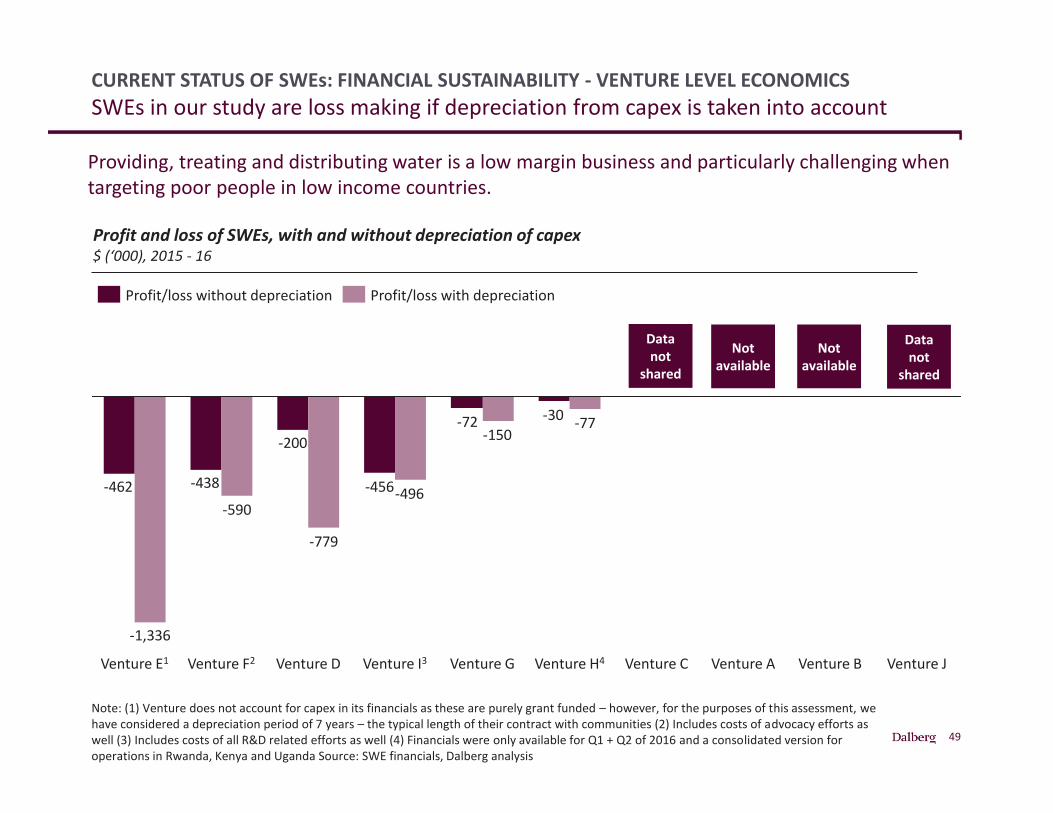
CURRENT STATUS OF SWEs: FINANCIAL SUSTAINABILITY - VENTURE LEVEL ECONOMICSSWEs in our study are loss making if depreciation from capex is taken into account
Note: (1) Venture does not account for capex in its financials as these are purely grant funded – however, for the purposes of this assessment, we have considered a depreciation period of 7 years – the typical length of their contract with communities (2) Includes costs of advocacy efforts as well (3) Includes costs of all R&D related efforts as well (4) Financials were only available for Q1 + Q2 of 2016 and a consolidated version for operations in Rwanda, Kenya and Uganda Source: SWE financials, Dalberg analysis
-30-72
-456
-200
-438-462
-77-150
-496
-779
-590
-1,336
Venture I3Venture DVenture E1 Venture G Venture H4Venture F2 Venture C Venture JVenture A Venture B
Profit/loss with depreciationProfit/loss without depreciation
Data not
shared
Notavailable
Data not
shared
Profit and loss of SWEs, with and without depreciation of capex$ (‘000), 2015 - 16
Notavailable
Providing, treating and distributing water is a low margin business and particularly challenging when targeting poor people in low income countries.
50
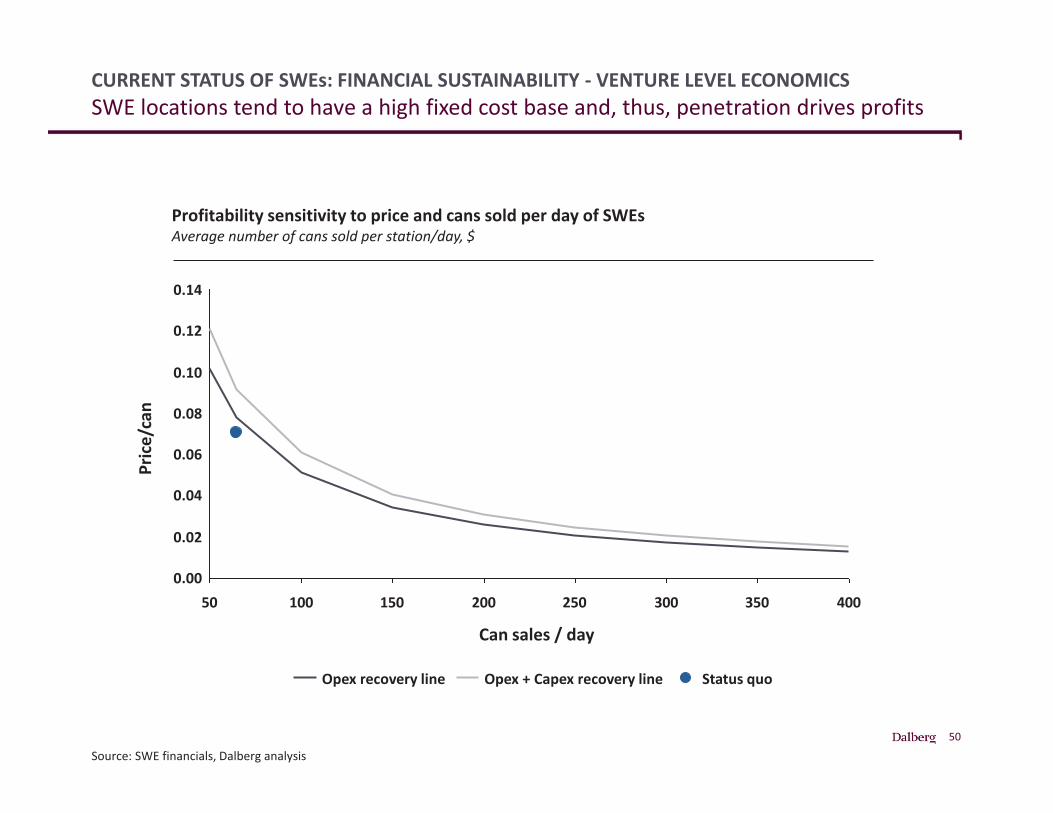
CURRENT STATUS OF SWEs: FINANCIAL SUSTAINABILITY - VENTURE LEVEL ECONOMICSSWE locations tend to have a high fixed cost base and, thus, penetration drives profits
Source: SWE financials, Dalberg analysis
Profitability sensitivity to price and cans sold per day of SWEsAverage number of cans sold per station/day, $
50 100 150 200 250 300 350 400
0.10
0.12
0.06
0.04
0.02
0.08
0.00
0.14
Status quoOpex + Capex recovery lineOpex recovery line
Pric
e/ca
n
Can sales / day
51
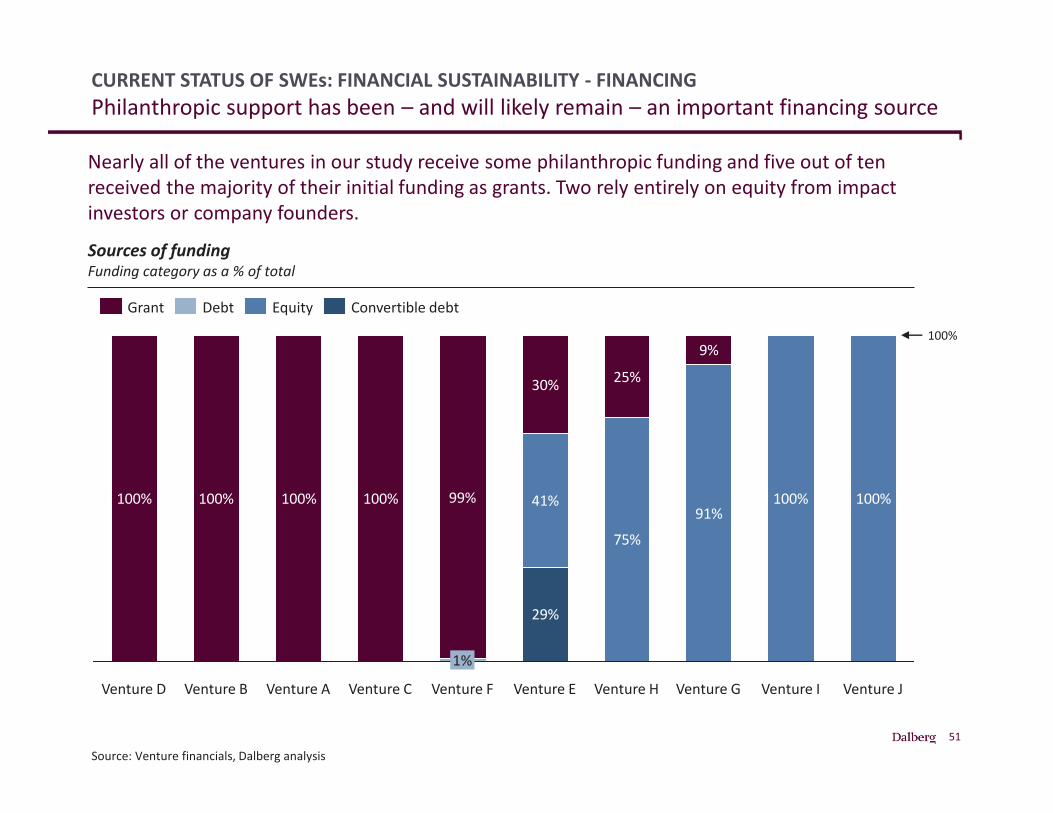
CURRENT STATUS OF SWEs: FINANCIAL SUSTAINABILITY - FINANCINGPhilanthropic support has been – and will likely remain – an important financing source
Source: Venture financials, Dalberg analysis
41%
75%91%
100% 100%100% 100% 100% 100% 99%
30% 25%
9%
29%
Venture FVenture A
1%
Venture BVenture D Venture JVenture H
100%
Venture GVenture E Venture IVenture C
Grant Debt Convertible debtEquity
Sources of funding Funding category as a % of total
Nearly all of the ventures in our study receive some philanthropic funding and five out of ten received the majority of their initial funding as grants. Two rely entirely on equity from impact investors or company founders.
52
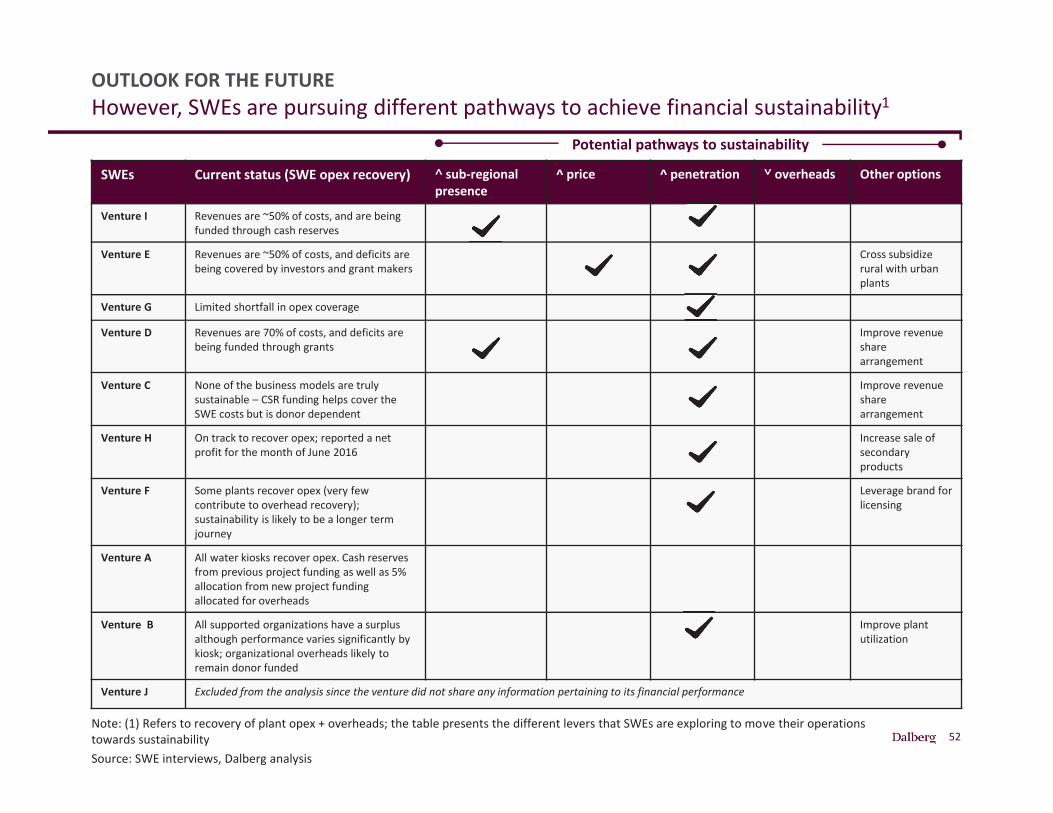
OUTLOOK FOR THE FUTUREHowever, SWEs are pursuing different pathways to achieve financial sustainability1
Note: (1) Refers to recovery of plant opex + overheads; the table presents the different levers that SWEs are exploring to move their operations towards sustainabilitySource: SWE interviews, Dalberg analysis
SWEs Current status (SWE opex recovery) ˄ sub-regional presence
^ price ^ penetration ˅ overheads Other options
Venture I Revenues are ~50% of costs, and are being funded through cash reserves
Venture E Revenues are ~50% of costs, and deficits are being covered by investors and grant makers
Cross subsidize rural with urban plants
Venture G Limited shortfall in opex coverage
Venture D Revenues are 70% of costs, and deficits are being funded through grants
Improve revenue share arrangement
Venture C None of the business models are truly sustainable – CSR funding helps cover the SWE costs but is donor dependent
Improve revenue share arrangement
Venture H On track to recover opex; reported a net profit for the month of June 2016
Increase sale of secondary products
Venture F Some plants recover opex (very few contribute to overhead recovery); sustainability is likely to be a longer term journey
Leverage brand for licensing
Venture A All water kiosks recover opex. Cash reserves from previous project funding as well as 5% allocation from new project funding allocated for overheads
Venture B All supported organizations have a surplus although performance varies significantly by kiosk; organizational overheads likely to remain donor funded
Improve plant utilization
Venture J Excluded from the analysis since the venture did not share any information pertaining to its financial performance
Potential pathways to sustainability
53
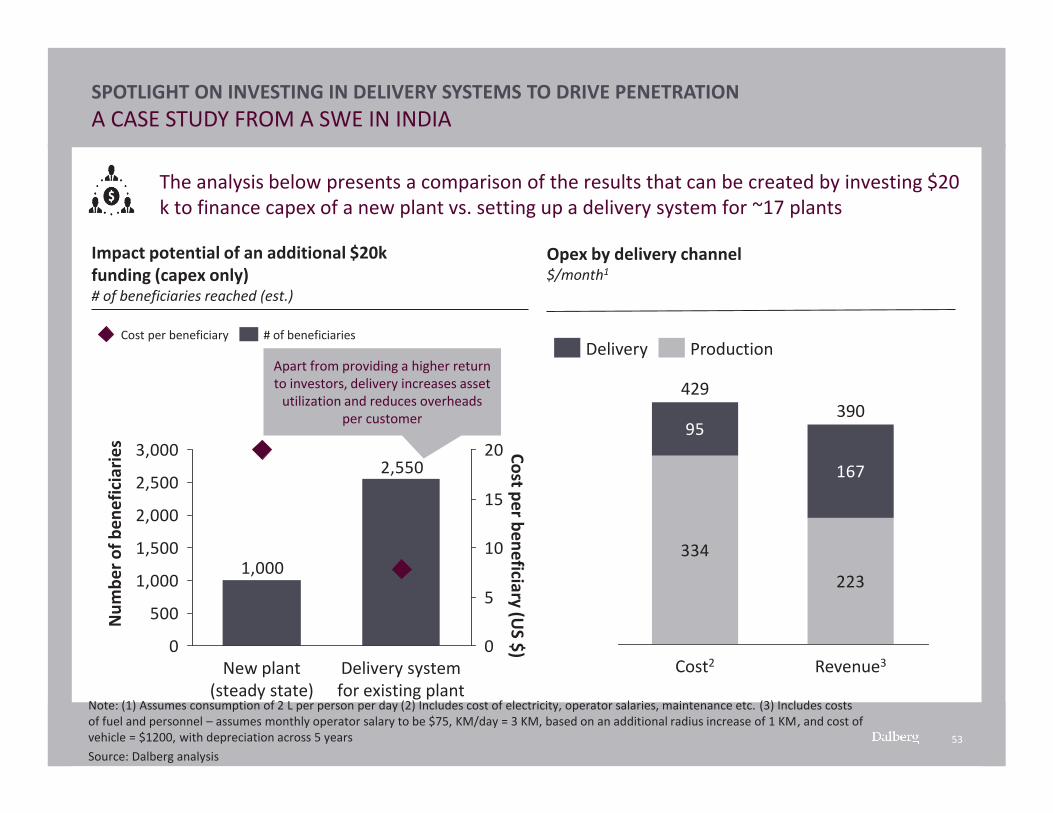
SPOTLIGHT ON INVESTING IN DELIVERY SYSTEMS TO DRIVE PENETRATIONA CASE STUDY FROM A SWE IN INDIA
Note: (1) Assumes consumption of 2 L per person per day (2) Includes cost of electricity, operator salaries, maintenance etc. (3) Includes costs of fuel and personnel – assumes monthly operator salary to be $75, KM/day = 3 KM, based on an additional radius increase of 1 KM, and cost of vehicle = $1200, with depreciation across 5 years Source: Dalberg analysis
The analysis below presents a comparison of the results that can be created by investing $20 k to finance capex of a new plant vs. setting up a delivery system for ~17 plants
Apart from providing a higher return to investors, delivery increases asset
utilization and reduces overheads per customer
Impact potential of an additional $20k funding (capex only)# of beneficiaries reached (est.)
2,550
1,000
0
500
1,000
1,500
2,000
2,500
3,000
0
5
10
15
20
New plant (steady state)
Delivery system for existing plant
# of beneficiariesCost per beneficiary
Num
ber o
f ben
efic
iarie
s Cost per beneficiary (US $)334
223
95
167
429390
Revenue3Cost2
Opex by delivery channel $/month1
ProductionDelivery
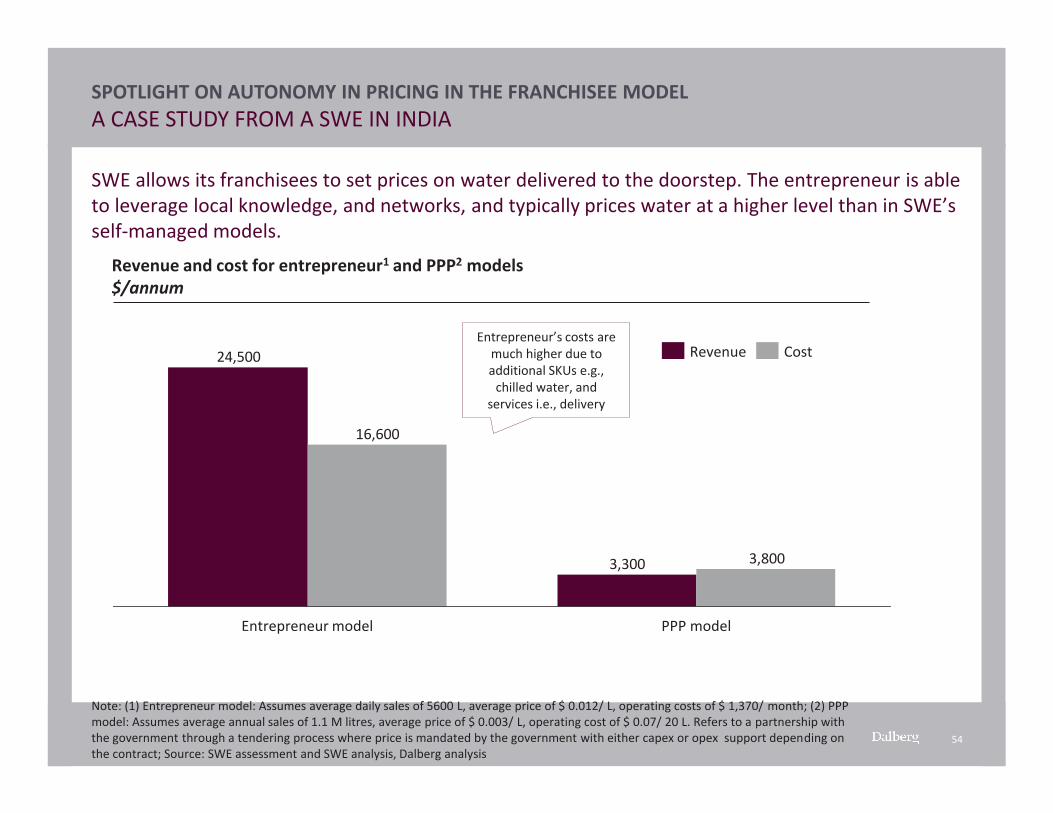
54
SPOTLIGHT ON AUTONOMY IN PRICING IN THE FRANCHISEE MODELA CASE STUDY FROM A SWE IN INDIA
Note: (1) Entrepreneur model: Assumes average daily sales of 5600 L, average price of $ 0.012/ L, operating costs of $ 1,370/ month; (2) PPP model: Assumes average annual sales of 1.1 M litres, average price of $ 0.003/ L, operating cost of $ 0.07/ 20 L. Refers to a partnership with the government through a tendering process where price is mandated by the government with either capex or opex support depending on the contract; Source: SWE assessment and SWE analysis, Dalberg analysis
SWE allows its franchisees to set prices on water delivered to the doorstep. The entrepreneur is able to leverage local knowledge, and networks, and typically prices water at a higher level than in SWE’s self-managed models.
Revenue and cost for entrepreneur1 and PPP2 models$/annum
3,300
24,500
3,800
16,600
PPP modelEntrepreneur model
CostRevenueEntrepreneur’s costs are
much higher due to additional SKUs e.g.,
chilled water, and services i.e., delivery
55
SPOTLIGHT ON EXPANDING SUB-REGIONAL PRESENCE WITHIN A GEOGRAPHYA CASE STUDY FROM A SWE IN ASIA
Source: SWE financials, Dalberg analysis
Improving existing performing plants• Focused marketing support from the
SWE to support underperforming entrepreneurs.
• External funding to support capacity building of entrepreneurs.
• Knowledge sharing through a booklet of best practices that can be shared among entrepreneurs.
Goals• Increase average penetration of SWE
and number of profit making plants.
Preparing for rapid scale• Conduct site selection early on to
prepare for rapid plans. • Focus on effectiveness of brand
signals and spreading the net wider by going national.
• Create a dedicated team to select entrepreneurs.
• Establish regional presence early even with higher overheads to ensure stability at time of scale up.
While the SWE has set ambitious plans to scale, it is working to ensure that existing plants are not left behind and future plans have a higher chance of success.
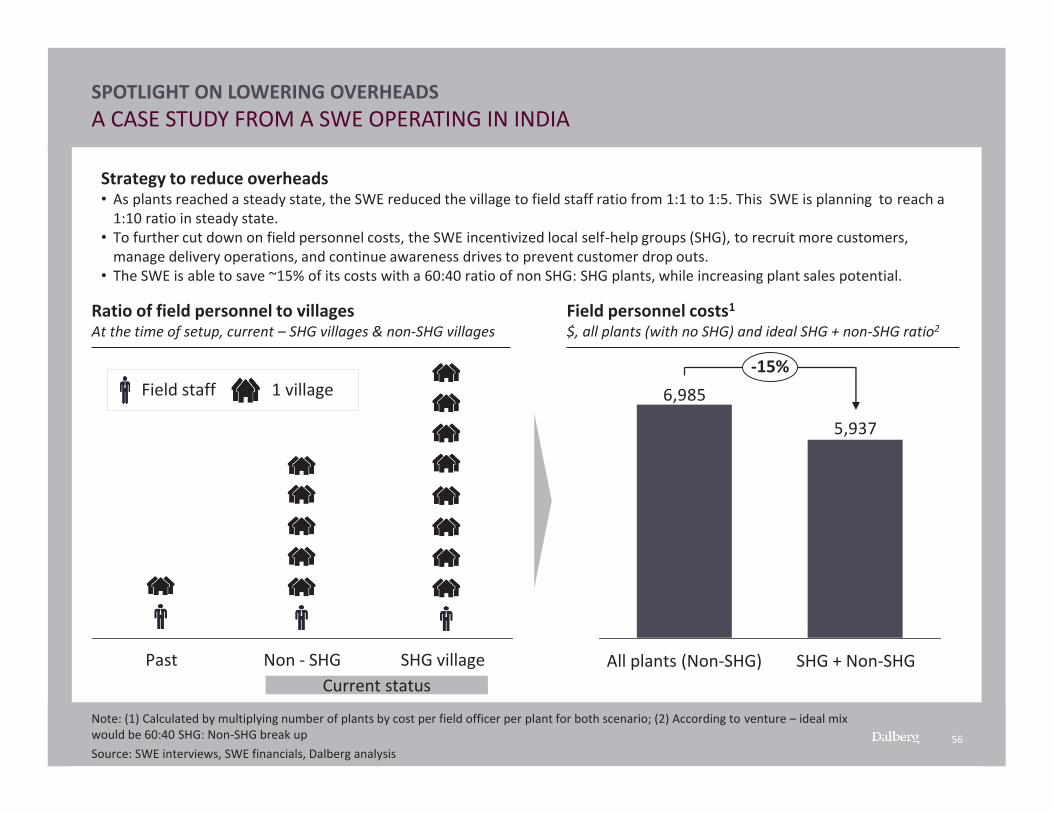
56
SPOTLIGHT ON LOWERING OVERHEADS A CASE STUDY FROM A SWE OPERATING IN INDIA
Note: (1) Calculated by multiplying number of plants by cost per field officer per plant for both scenario; (2) According to venture – ideal mix would be 60:40 SHG: Non-SHG break up Source: SWE interviews, SWE financials, Dalberg analysis
SHG villageNon - SHGPast
Strategy to reduce overheads• As plants reached a steady state, the SWE reduced the village to field staff ratio from 1:1 to 1:5. This SWE is planning to reach a
1:10 ratio in steady state. • To further cut down on field personnel costs, the SWE incentivized local self-help groups (SHG), to recruit more customers,
manage delivery operations, and continue awareness drives to prevent customer drop outs.• The SWE is able to save ~15% of its costs with a 60:40 ratio of non SHG: SHG plants, while increasing plant sales potential.
5,937
6,985-15%
SHG + Non-SHGAll plants (Non-SHG)
Field staff 1 village
Current status
Field personnel costs1
$, all plants (with no SHG) and ideal SHG + non-SHG ratio2Ratio of field personnel to villagesAt the time of setup, current – SHG villages & non-SHG villages
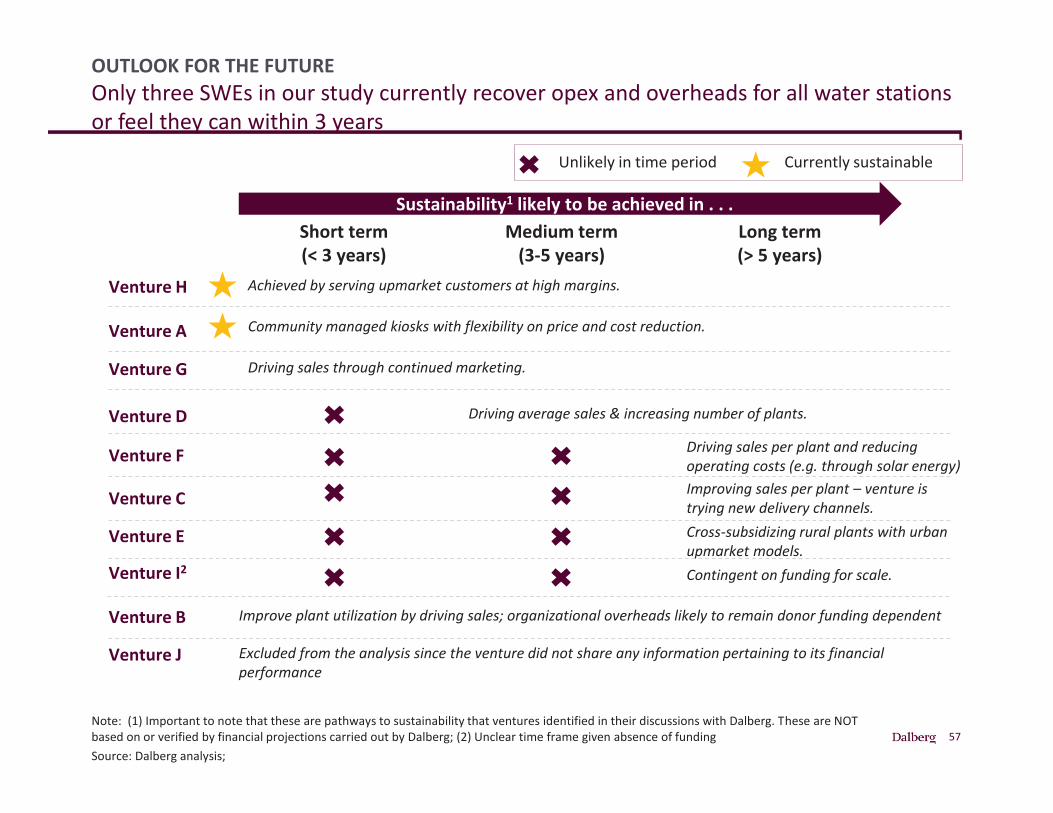
57
Sustainability1 likely to be achieved in . . .
Contingent on funding for scale.Venture I2
OUTLOOK FOR THE FUTUREOnly three SWEs in our study currently recover opex and overheads for all water stations or feel they can within 3 years
Note: (1) Important to note that these are pathways to sustainability that ventures identified in their discussions with Dalberg. These are NOT based on or verified by financial projections carried out by Dalberg; (2) Unclear time frame given absence of funding Source: Dalberg analysis;
Short term(< 3 years)
Medium term(3-5 years)
Long term(> 5 years)
Currently sustainableUnlikely in time period
Cross-subsidizing rural plants with urban upmarket models.
Venture E
Driving sales through continued marketing.Venture G
Driving average sales & increasing number of plants.Venture D
Improving sales per plant – venture is trying new delivery channels. Venture C
Achieved by serving upmarket customers at high margins. Venture H
Venture F
Community managed kiosks with flexibility on price and cost reduction.Venture A
Excluded from the analysis since the venture did not share any information pertaining to its financial performance
Venture J
Driving sales per plant and reducing operating costs (e.g. through solar energy)
Improve plant utilization by driving sales; organizational overheads likely to remain donor funding dependentVenture B
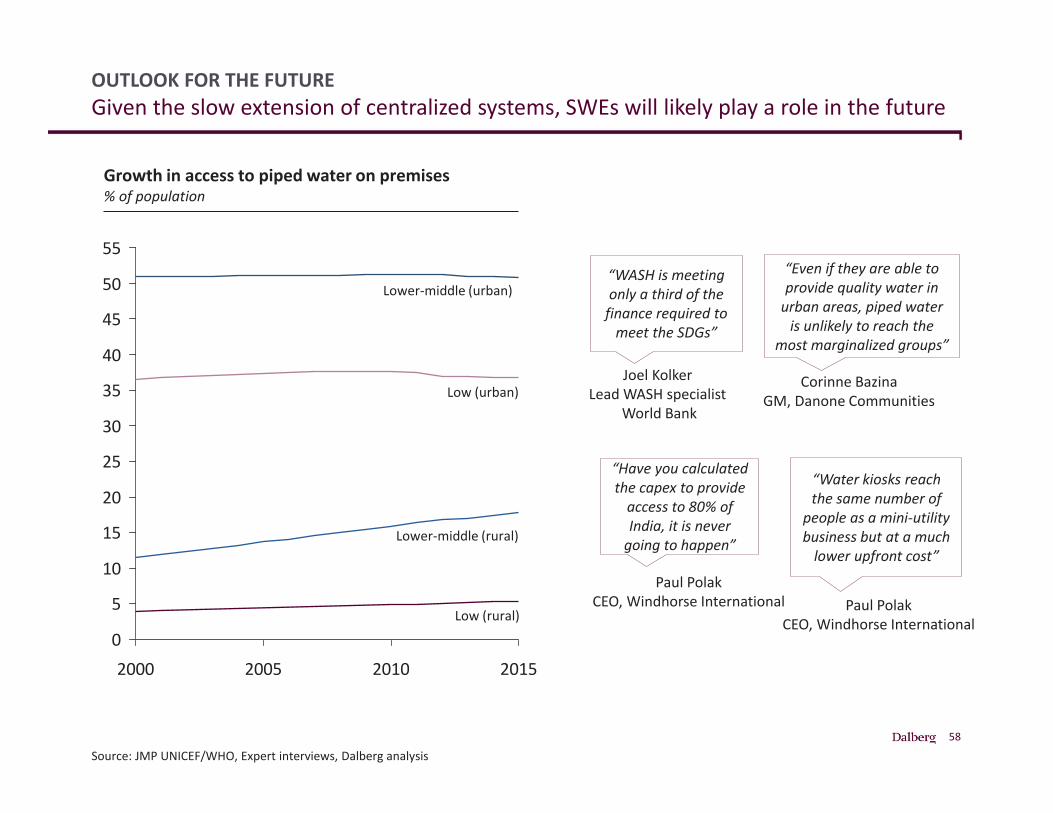
58
OUTLOOK FOR THE FUTUREGiven the slow extension of centralized systems, SWEs will likely play a role in the future
Source: JMP UNICEF/WHO, Expert interviews, Dalberg analysis
0
5
10
15
20
25
30
35
40
45
50
55
2000 2005 2010 2015
Growth in access to piped water on premises% of population
“WASH is meeting only a third of the
finance required to meet the SDGs”
Joel KolkerLead WASH specialist
World Bank
“Have you calculated the capex to provide
access to 80% of India, it is never
going to happen”
Paul PolakCEO, Windhorse International
“Even if they are able to provide quality water in
urban areas, piped water is unlikely to reach the
most marginalized groups”
Corinne BazinaGM, Danone Communities
“Water kiosks reach the same number of
people as a mini-utility business but at a much
lower upfront cost”
Paul PolakCEO, Windhorse International
Lower-middle (urban)
Low (urban)
Lower-middle (rural)
Low (rural)
59
1. Introduction: The Safe Water Challenge Facing Us And The Importance Of Understanding The Role Of Safe Water Enterprises (SWEs)
2. Overview of SWEs: Achievements and Unrealized Potential
3. The SWE Market: Opportunities and Potential Market Profiles
4. Strategies to Build a Market: Recommendations to Accelerate SWE Growth
TABLE OF CONTENTS
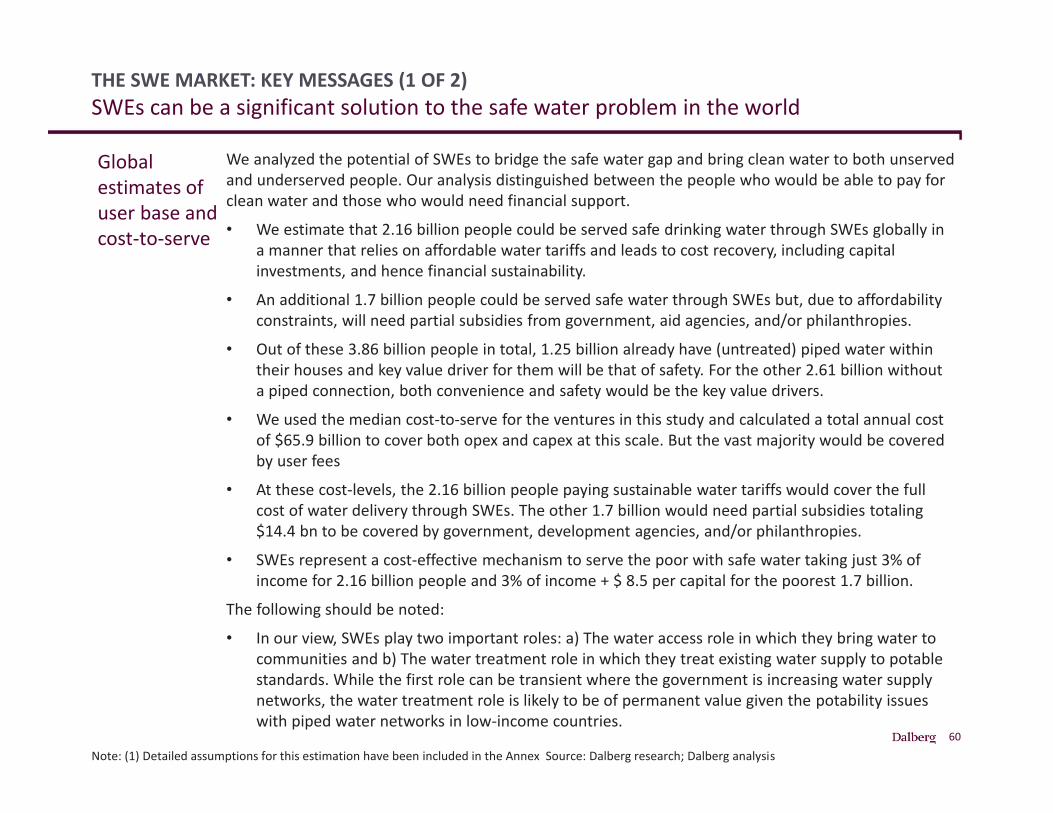
60
THE SWE MARKET: KEY MESSAGES (1 OF 2)SWEs can be a significant solution to the safe water problem in the world
Note: (1) Detailed assumptions for this estimation have been included in the Annex Source: Dalberg research; Dalberg analysis
Global estimates of user base and cost-to-serve
We analyzed the potential of SWEs to bridge the safe water gap and bring clean water to both unserved and underserved people. Our analysis distinguished between the people who would be able to pay for clean water and those who would need financial support.
• We estimate that 2.16 billion people could be served safe drinking water through SWEs globally in a manner that relies on affordable water tariffs and leads to cost recovery, including capital investments, and hence financial sustainability.
• An additional 1.7 billion people could be served safe water through SWEs but, due to affordability constraints, will need partial subsidies from government, aid agencies, and/or philanthropies.
• Out of these 3.86 billion people in total, 1.25 billion already have (untreated) piped water within their houses and key value driver for them will be that of safety. For the other 2.61 billion without a piped connection, both convenience and safety would be the key value drivers.
• We used the median cost-to-serve for the ventures in this study and calculated a total annual cost of $65.9 billion to cover both opex and capex at this scale. But the vast majority would be covered by user fees
• At these cost-levels, the 2.16 billion people paying sustainable water tariffs would cover the full cost of water delivery through SWEs. The other 1.7 billion would need partial subsidies totaling $14.4 bn to be covered by government, development agencies, and/or philanthropies.
• SWEs represent a cost-effective mechanism to serve the poor with safe water taking just 3% of income for 2.16 billion people and 3% of income + $ 8.5 per capital for the poorest 1.7 billion.
The following should be noted:
• In our view, SWEs play two important roles: a) The water access role in which they bring water to communities and b) The water treatment role in which they treat existing water supply to potable standards. While the first role can be transient where the government is increasing water supply networks, the water treatment role is likely to be of permanent value given the potability issues with piped water networks in low-income countries.
61
THE SWE MARKET: KEY MESSAGES (2 OF 2)There are significant opportunities for private capital and philanthropic investments.
Source: Dalberg research; Dalberg analysis
Dalberg looked at the capital requirements to set up SWEs and also the operational expenses to run them and evaluated the opportunity for social impact capital (~ 0-2 % expected return) and the mechanisms to fund subsidies.
Social Impact Capital
We estimate that the SWE market has an overall need for between $15 – 30 billion of social impact capital across different regions. However, the current absorptive capacity is likely to be a bottleneck and innovations in capacity building, quality assurance at scale, and automation are needed to fully unlock the investment opportunity. We believe that this investment could be absorbed over a time frame of 8-10 years in time for the 2030 SDG goals.
Unlocking Government Subsidies
Additionally, there is a need for $14.4 bn annually in government and donor subsidies. This subsidy is still significantly more than current donor commitments to safe drinking water. In 2015, OECD donors made $666M of commitments to providing basic drinking water. Consequently, a two-pronged approach needs to be taken:
- Efforts should be taken to unlock more government money for the SWE model through capital subsidies and vouchers. Advocacy and research should be funded to enable this.
- Actual water-related philanthropic investments should be made in carefully selected countries.
Global estimates of investible and public finance opportunity
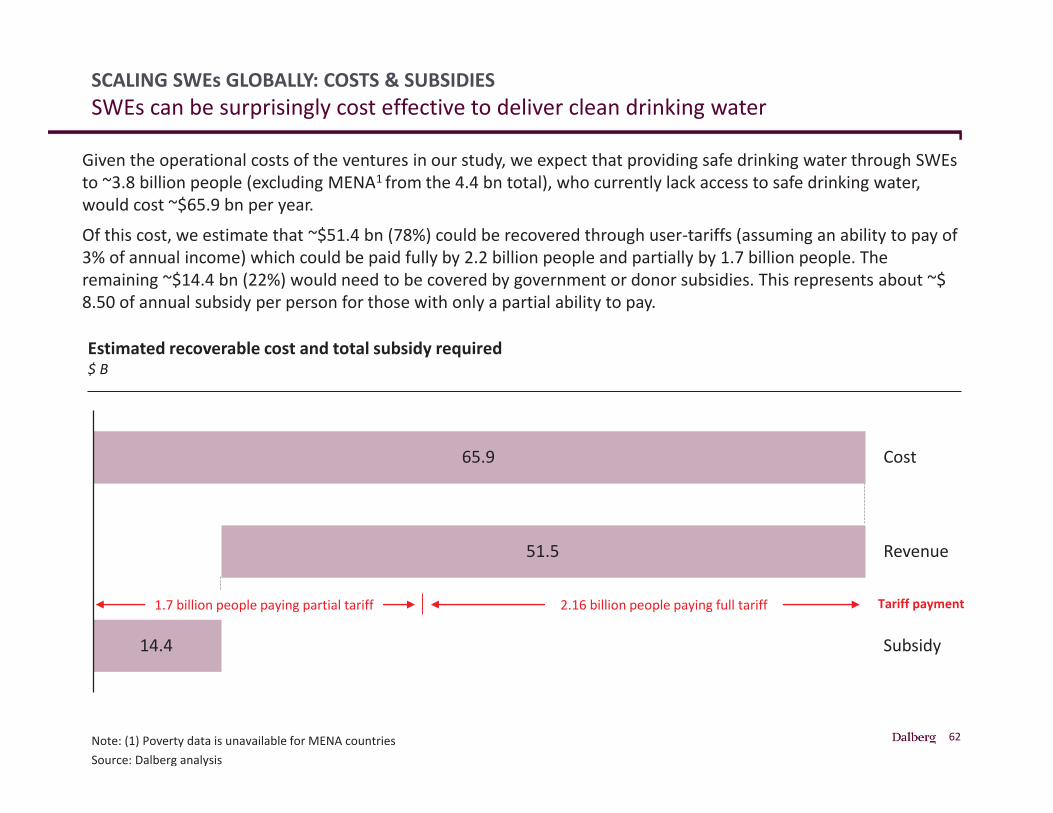
62
Revenue
Subsidy
Cost
14.4
65.9
51.5
SCALING SWEs GLOBALLY: COSTS & SUBSIDIESSWEs can be surprisingly cost effective to deliver clean drinking water
Note: (1) Poverty data is unavailable for MENA countries Source: Dalberg analysis
Estimated recoverable cost and total subsidy required $ B
Given the operational costs of the ventures in our study, we expect that providing safe drinking water through SWEs to ~3.8 billion people (excluding MENA1 from the 4.4 bn total), who currently lack access to safe drinking water, would cost ~$65.9 bn per year. Of this cost, we estimate that ~$51.4 bn (78%) could be recovered through user-tariffs (assuming an ability to pay of 3% of annual income) which could be paid fully by 2.2 billion people and partially by 1.7 billion people. The remaining ~$14.4 bn (22%) would need to be covered by government or donor subsidies. This represents about ~$ 8.50 of annual subsidy per person for those with only a partial ability to pay.
2.16 billion people paying full tariff1.7 billion people paying partial tariff Tariff payment
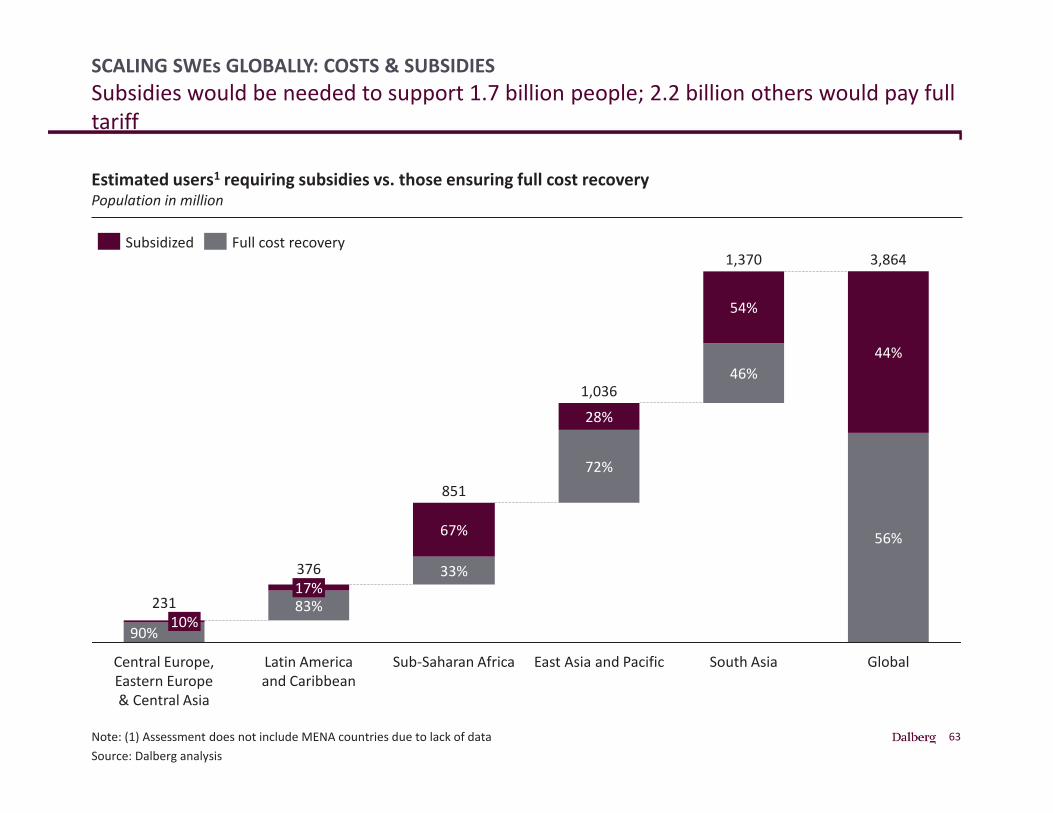
63
SCALING SWEs GLOBALLY: COSTS & SUBSIDIES Subsidies would be needed to support 1.7 billion people; 2.2 billion others would pay full tariff
Note: (1) Assessment does not include MENA countries due to lack of data Source: Dalberg analysis
South Asia
17%
1,370
46%
33%
Latin America and Caribbean
54%
28%
Sub-Saharan Africa
56%
1,036
72%
67%
3,864
East Asia and Pacific
851
Global
44%
376
83%
Central Europe, Eastern Europe & Central Asia
231
90%10%
Full cost recoverySubsidized
Estimated users1 requiring subsidies vs. those ensuring full cost recoveryPopulation in million
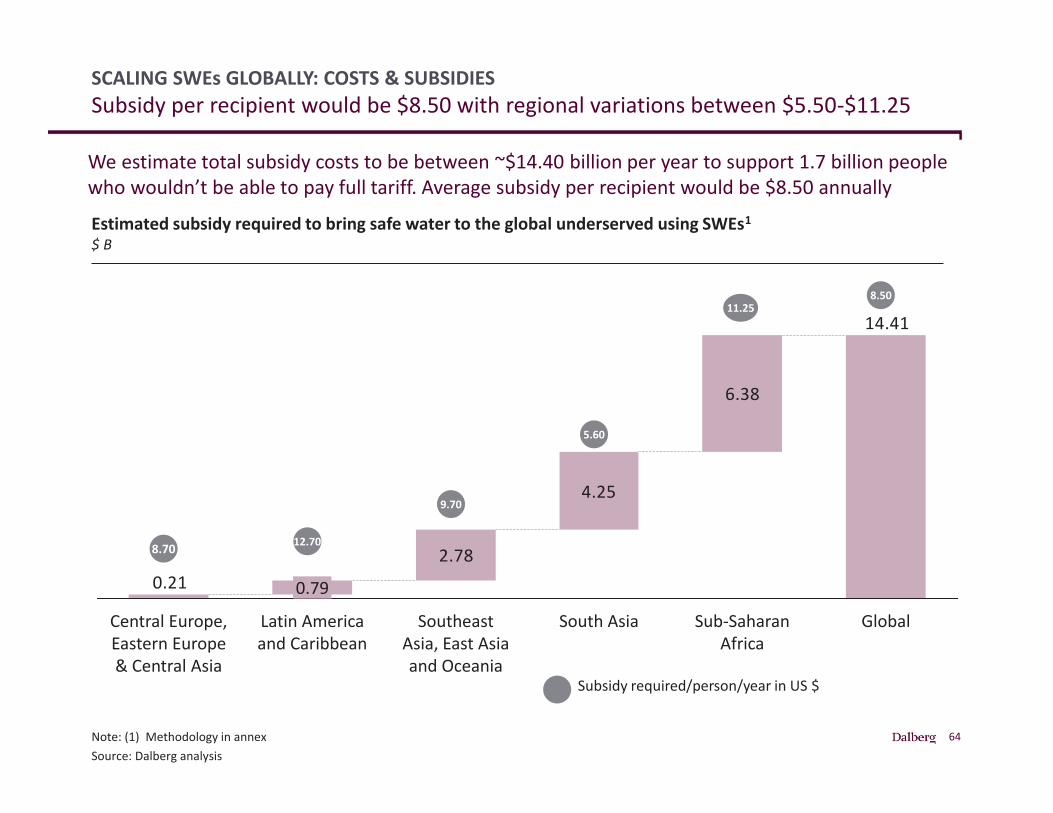
64
SCALING SWEs GLOBALLY: COSTS & SUBSIDIES Subsidy per recipient would be $8.50 with regional variations between $5.50-$11.25
Note: (1) Methodology in annex Source: Dalberg analysis
Estimated subsidy required to bring safe water to the global underserved using SWEs1
$ B
2.78
4.25
6.38
14.41
0.21
Southeast Asia, East Asia and Oceania
Latin America and Caribbean
GlobalSub-Saharan Africa
South Asia
0.79
Central Europe, Eastern Europe & Central Asia
Subsidy required/person/year in US $
We estimate total subsidy costs to be between ~$14.40 billion per year to support 1.7 billion people who wouldn’t be able to pay full tariff. Average subsidy per recipient would be $8.50 annually
8.70 12.70
9.70
5.60
11.258.50
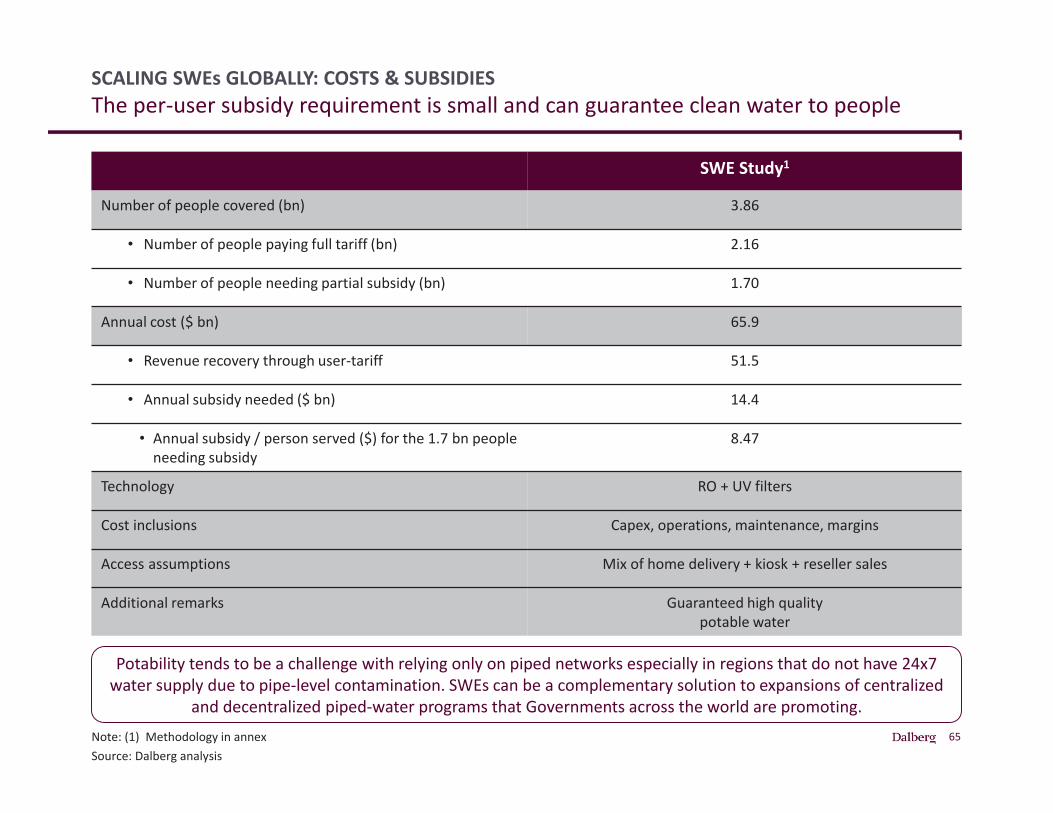
65
SCALING SWEs GLOBALLY: COSTS & SUBSIDIES The per-user subsidy requirement is small and can guarantee clean water to people
Note: (1) Methodology in annex Source: Dalberg analysis
SWE Study1
Number of people covered (bn) 3.86
• Number of people paying full tariff (bn) 2.16
• Number of people needing partial subsidy (bn) 1.70
Annual cost ($ bn) 65.9
• Revenue recovery through user-tariff 51.5
• Annual subsidy needed ($ bn) 14.4
• Annual subsidy / person served ($) for the 1.7 bn people needing subsidy
8.47
Technology RO + UV filters
Cost inclusions Capex, operations, maintenance, margins
Access assumptions Mix of home delivery + kiosk + reseller sales
Additional remarks Guaranteed high quality potable water
Potability tends to be a challenge with relying only on piped networks especially in regions that do not have 24x7 water supply due to pipe-level contamination. SWEs can be a complementary solution to expansions of centralized
and decentralized piped-water programs that Governments across the world are promoting.
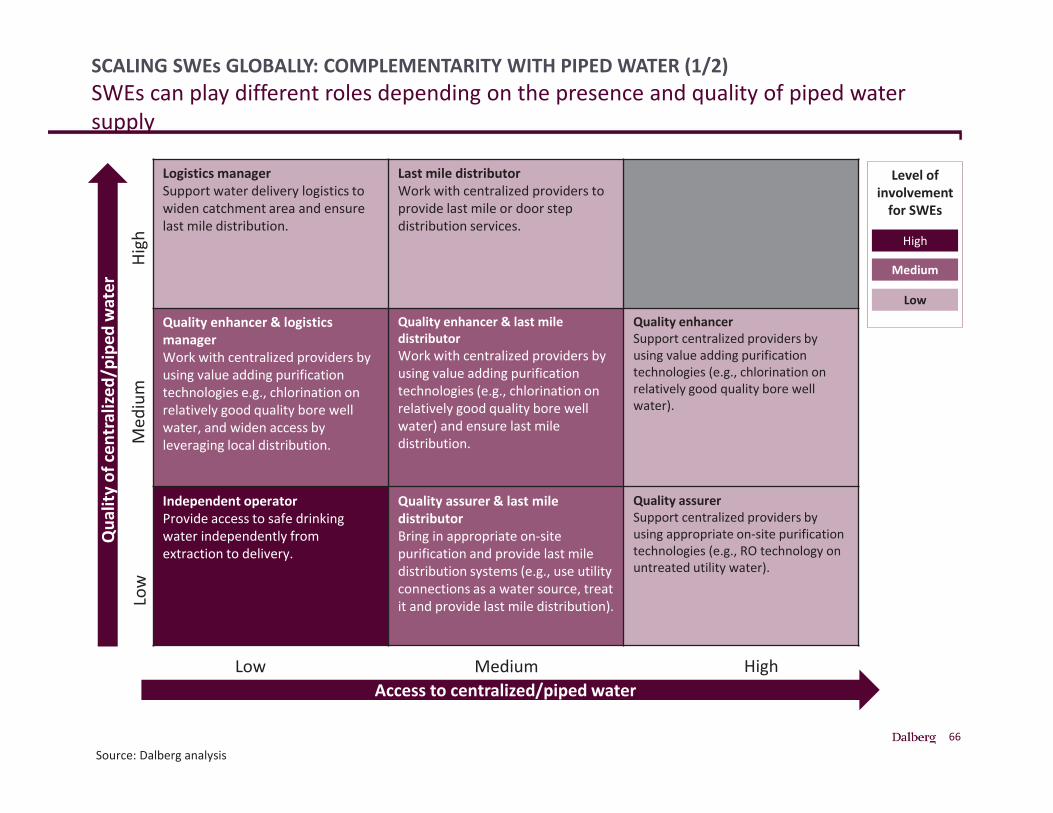
66
SCALING SWEs GLOBALLY: COMPLEMENTARITY WITH PIPED WATER (1/2)SWEs can play different roles depending on the presence and quality of piped water supply
Source: Dalberg analysis
Logistics managerSupport water delivery logistics to widen catchment area and ensure last mile distribution.
Last mile distributorWork with centralized providers to provide last mile or door step distribution services.
Quality enhancer & logistics managerWork with centralized providers by using value adding purification technologies e.g., chlorination on relatively good quality bore well water, and widen access by leveraging local distribution.
Quality enhancer & last mile distributorWork with centralized providers by using value adding purification technologies (e.g., chlorination on relatively good quality bore well water) and ensure last mile distribution.
Quality enhancer Support centralized providers by using value adding purification technologies (e.g., chlorination on relatively good quality bore well water).
Independent operatorProvide access to safe drinking water independently from extraction to delivery.
Quality assurer & last mile distributorBring in appropriate on-site purification and provide last mile distribution systems (e.g., use utility connections as a water source, treat it and provide last mile distribution).
Quality assurerSupport centralized providers by using appropriate on-site purification technologies (e.g., RO technology on untreated utility water).
High
Med
ium
Low
Low Medium HighAccess to centralized/piped water
Qua
lity
of ce
ntra
lized
/pip
ed w
ater
High
Medium
Low
Level of involvement
for SWEs
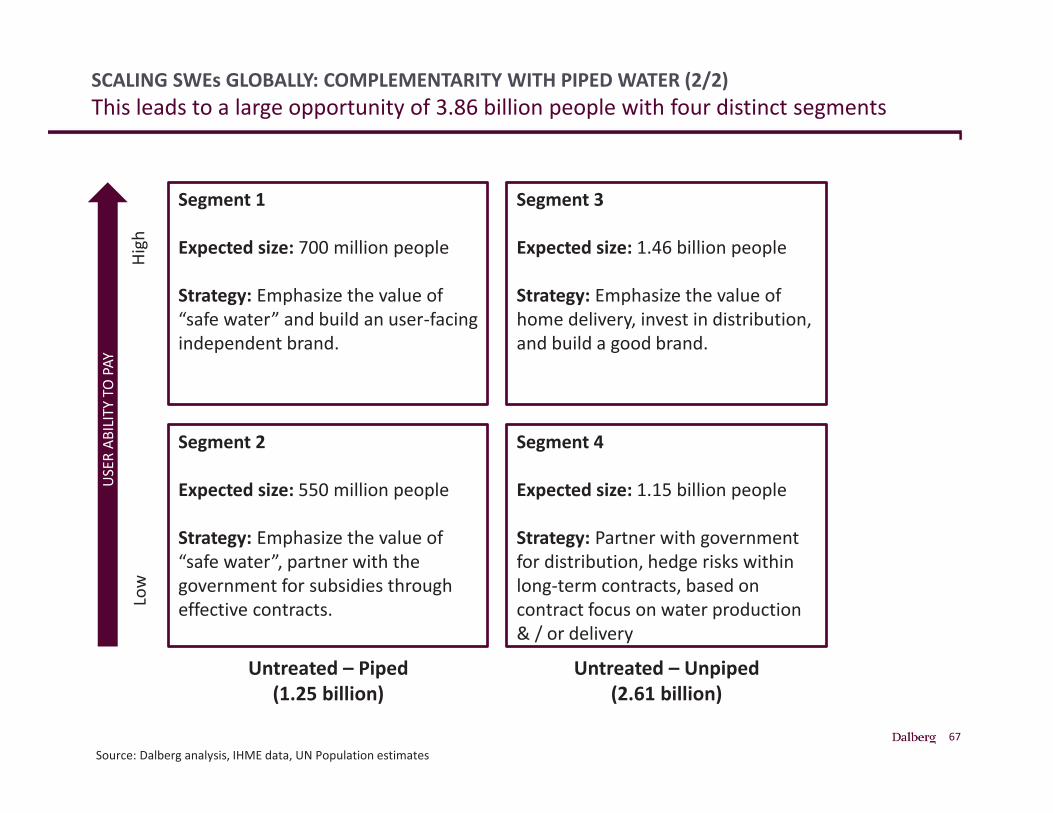
67
SCALING SWEs GLOBALLY: COMPLEMENTARITY WITH PIPED WATER (2/2)This leads to a large opportunity of 3.86 billion people with four distinct segments
Source: Dalberg analysis, IHME data, UN Population estimates
High
Low
Untreated – Piped(1.25 billion)
Untreated – Unpiped(2.61 billion)
USER
ABI
LITY
TO
PAY
Segment 1
Expected size: 700 million people
Strategy: Emphasize the value of “safe water” and build an user-facing independent brand.
Segment 2
Expected size: 550 million people
Strategy: Emphasize the value of “safe water”, partner with the government for subsidies through effective contracts.
Segment 3
Expected size: 1.46 billion people
Strategy: Emphasize the value of home delivery, invest in distribution, and build a good brand.
Segment 4
Expected size: 1.15 billion people
Strategy: Partner with government for distribution, hedge risks within long-term contracts, based on contract focus on water production & / or delivery
68
THE SWE MARKET: COUNTRY SNAPSHOTSThere are a few countries that are attractive for SWE activity.
Source: Dalberg research; Dalberg analysis
Profiles of select potential SWE market
We profiled five countries in Asia and Sub-Saharan Africa in terms of their potential for SWEs: (i) India, (ii) Bangladesh, (iii) Indonesia, (iv) Kenya, and (v) TanzaniaFor each of these countries, we have included a high level view of the need and opportunities for SWEs to bring safe water to the underserved and an overview of sub-regions where SWEs may be a potential solution by reviewing the arsenic and fluoride contamination, and population densitiesThe country profiles are not developed as comprehensive market analyses, and are meant to provide a high level view of each of the countries selected. These should be used as starting points for a more critical analysis of specific local context that is relevant for a potential SWE business.
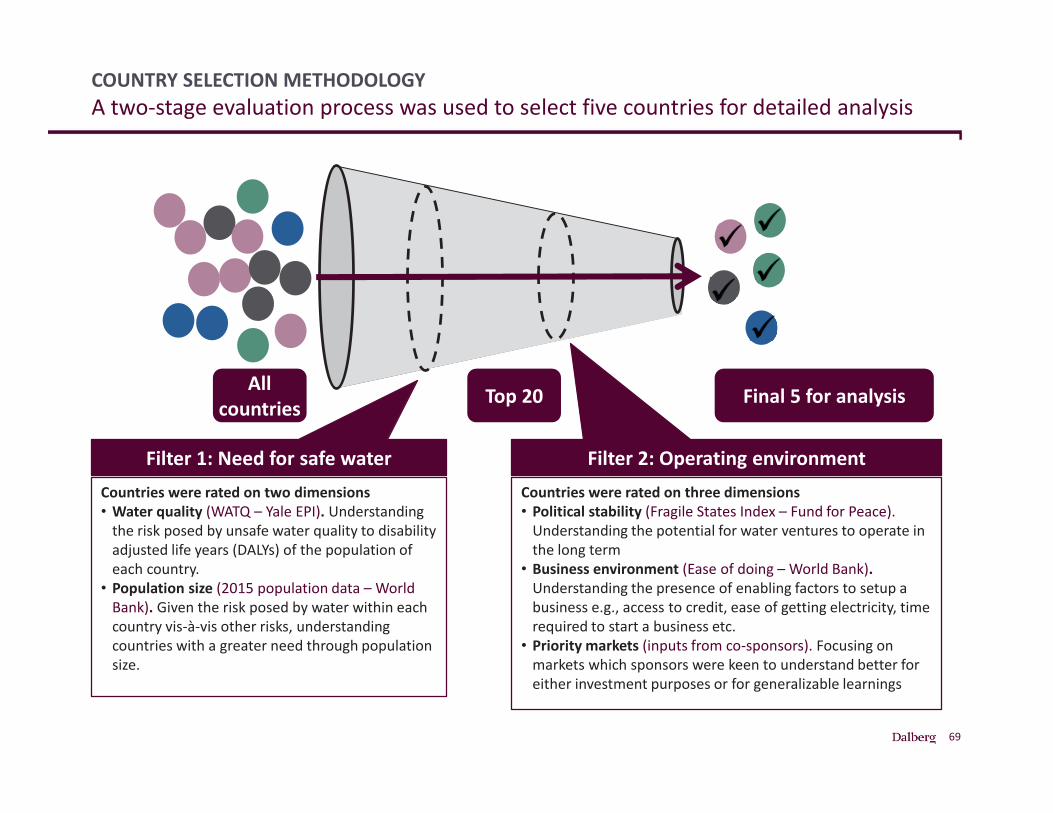
69
COUNTRY SELECTION METHODOLOGYA two-stage evaluation process was used to select five countries for detailed analysis
Countries were rated on two dimensions• Water quality (WATQ – Yale EPI). Understanding
the risk posed by unsafe water quality to disability adjusted life years (DALYs) of the population of each country.
• Population size (2015 population data – World Bank). Given the risk posed by water within each country vis-à-vis other risks, understanding countries with a greater need through population size.
Countries were rated on three dimensions• Political stability (Fragile States Index – Fund for Peace).
Understanding the potential for water ventures to operate in the long term
• Business environment (Ease of doing – World Bank). Understanding the presence of enabling factors to setup a business e.g., access to credit, ease of getting electricity, time required to start a business etc.
• Priority markets (inputs from co-sponsors). Focusing on markets which sponsors were keen to understand better for either investment purposes or for generalizable learnings
Filter 1: Need for safe water Filter 2: Operating environment
All countries Final 5 for analysisTop 20
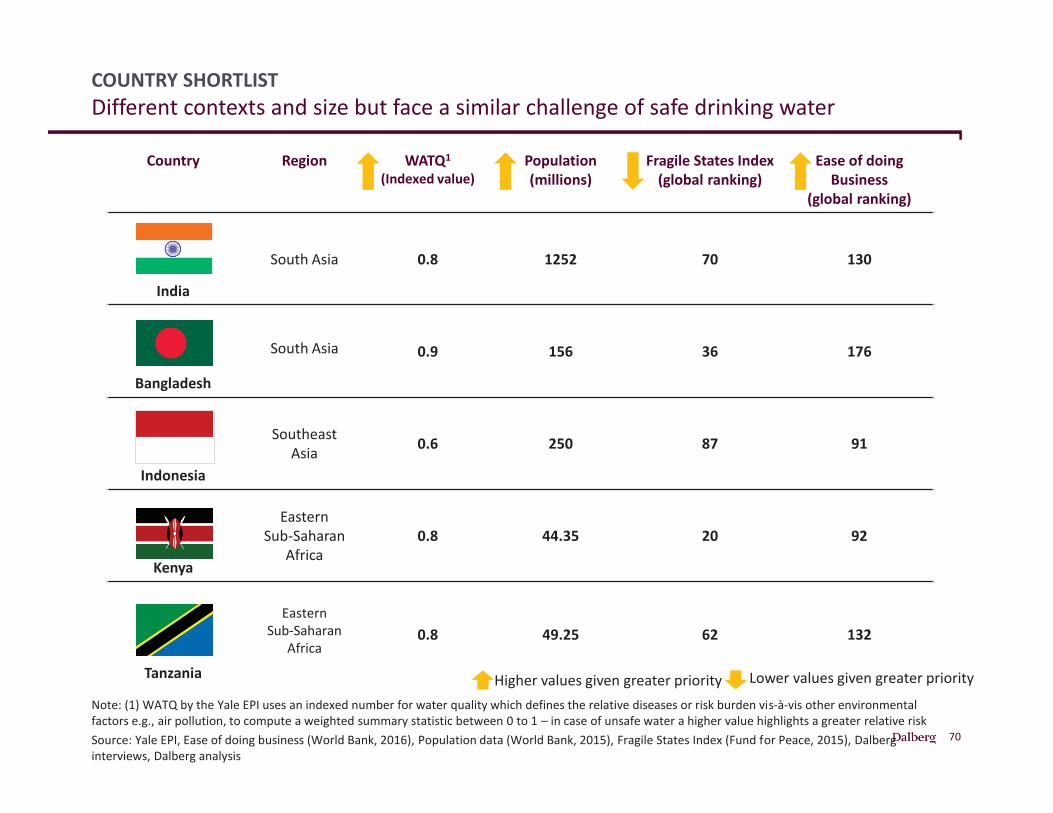
70
COUNTRY SHORTLISTDifferent contexts and size but face a similar challenge of safe drinking water
Note: (1) WATQ by the Yale EPI uses an indexed number for water quality which defines the relative diseases or risk burden vis-à-vis other environmental factors e.g., air pollution, to compute a weighted summary statistic between 0 to 1 – in case of unsafe water a higher value highlights a greater relative riskSource: Yale EPI, Ease of doing business (World Bank, 2016), Population data (World Bank, 2015), Fragile States Index (Fund for Peace, 2015), Dalberg interviews, Dalberg analysis
Country Region WATQ1
(Indexed value)Population (millions)
Fragile States Index(global ranking)
Ease of doing Business
(global ranking)
India
South Asia 0.8 1252 70 130
Bangladesh
South Asia 0.9 156 36 176
Indonesia
SoutheastAsia 0.6 250 87 91
Kenya
EasternSub-Saharan
Africa0.8 44.35 20 92
Tanzania
EasternSub-Saharan
Africa0.8 49.25 62 132
Higher values given greater priority Lower values given greater priority
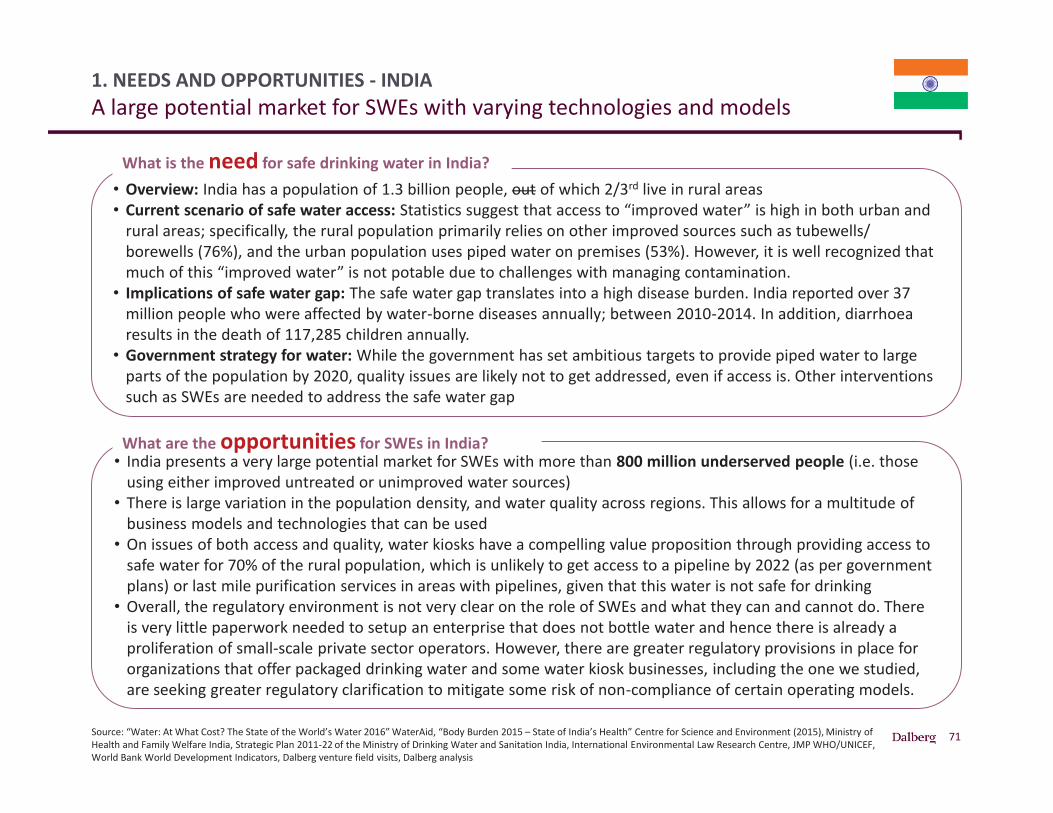
71
1. NEEDS AND OPPORTUNITIES - INDIAA large potential market for SWEs with varying technologies and models
Source: “Water: At What Cost? The State of the World’s Water 2016” WaterAid, “Body Burden 2015 – State of India’s Health” Centre for Science and Environment (2015), Ministry of Health and Family Welfare India, Strategic Plan 2011-22 of the Ministry of Drinking Water and Sanitation India, International Environmental Law Research Centre, JMP WHO/UNICEF, World Bank World Development Indicators, Dalberg venture field visits, Dalberg analysis
• Overview: India has a population of 1.3 billion people, out of which 2/3rd live in rural areas• Current scenario of safe water access: Statistics suggest that access to “improved water” is high in both urban and
rural areas; specifically, the rural population primarily relies on other improved sources such as tubewells/ borewells (76%), and the urban population uses piped water on premises (53%). However, it is well recognized that much of this “improved water” is not potable due to challenges with managing contamination.
• Implications of safe water gap: The safe water gap translates into a high disease burden. India reported over 37 million people who were affected by water-borne diseases annually; between 2010-2014. In addition, diarrhoea results in the death of 117,285 children annually.
• Government strategy for water: While the government has set ambitious targets to provide piped water to large parts of the population by 2020, quality issues are likely not to get addressed, even if access is. Other interventions such as SWEs are needed to address the safe water gap
What is the need for safe drinking water in India?
• India presents a very large potential market for SWEs with more than 800 million underserved people (i.e. those using either improved untreated or unimproved water sources)
• There is large variation in the population density, and water quality across regions. This allows for a multitude of business models and technologies that can be used
• On issues of both access and quality, water kiosks have a compelling value proposition through providing access to safe water for 70% of the rural population, which is unlikely to get access to a pipeline by 2022 (as per government plans) or last mile purification services in areas with pipelines, given that this water is not safe for drinking
• Overall, the regulatory environment is not very clear on the role of SWEs and what they can and cannot do. There is very little paperwork needed to setup an enterprise that does not bottle water and hence there is already a proliferation of small-scale private sector operators. However, there are greater regulatory provisions in place for organizations that offer packaged drinking water and some water kiosk businesses, including the one we studied, are seeking greater regulatory clarification to mitigate some risk of non-compliance of certain operating models.
What are the opportunities for SWEs in India?
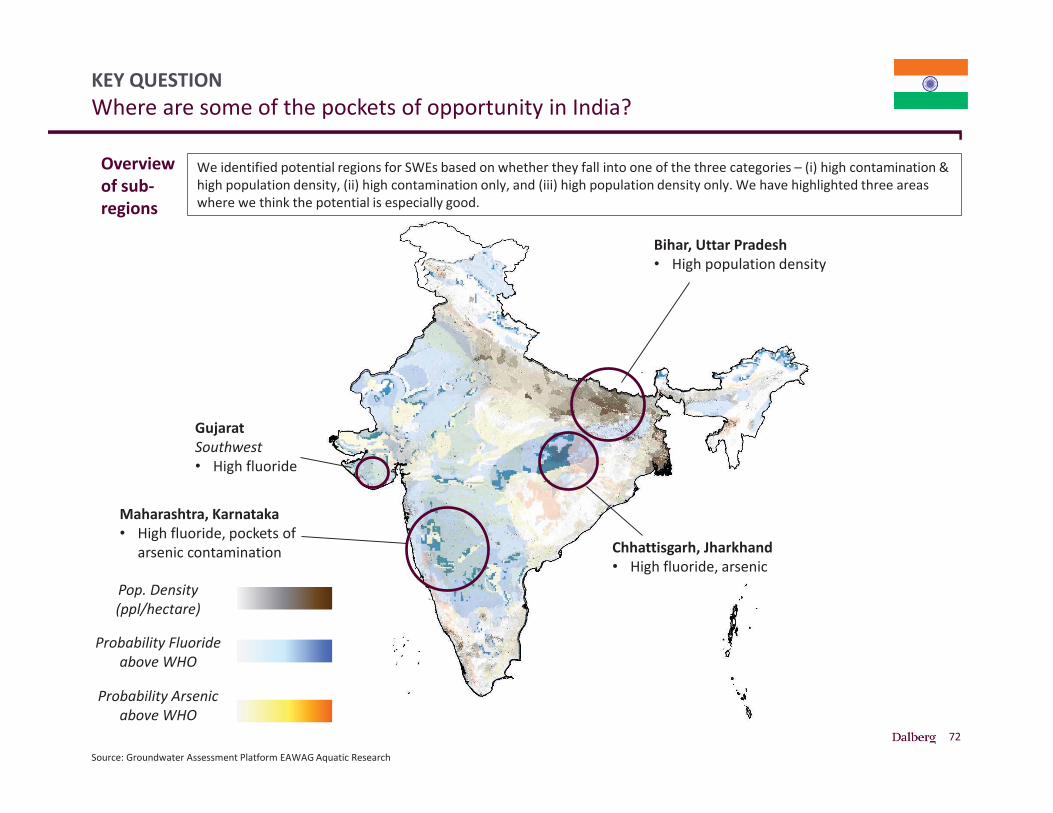
72
KEY QUESTIONWhere are some of the pockets of opportunity in India?
Source: Groundwater Assessment Platform EAWAG Aquatic Research
We identified potential regions for SWEs based on whether they fall into one of the three categories – (i) high contamination & high population density, (ii) high contamination only, and (iii) high population density only. We have highlighted three areas where we think the potential is especially good.
Overview of sub-regions
Pop. Density (ppl/hectare)
Probability Fluoride above WHO
Probability Arsenic above WHO
Bihar, Uttar Pradesh• High population density
Chhattisgarh, Jharkhand • High fluoride, arsenic
Maharashtra, Karnataka• High fluoride, pockets of
arsenic contamination
GujaratSouthwest• High fluoride
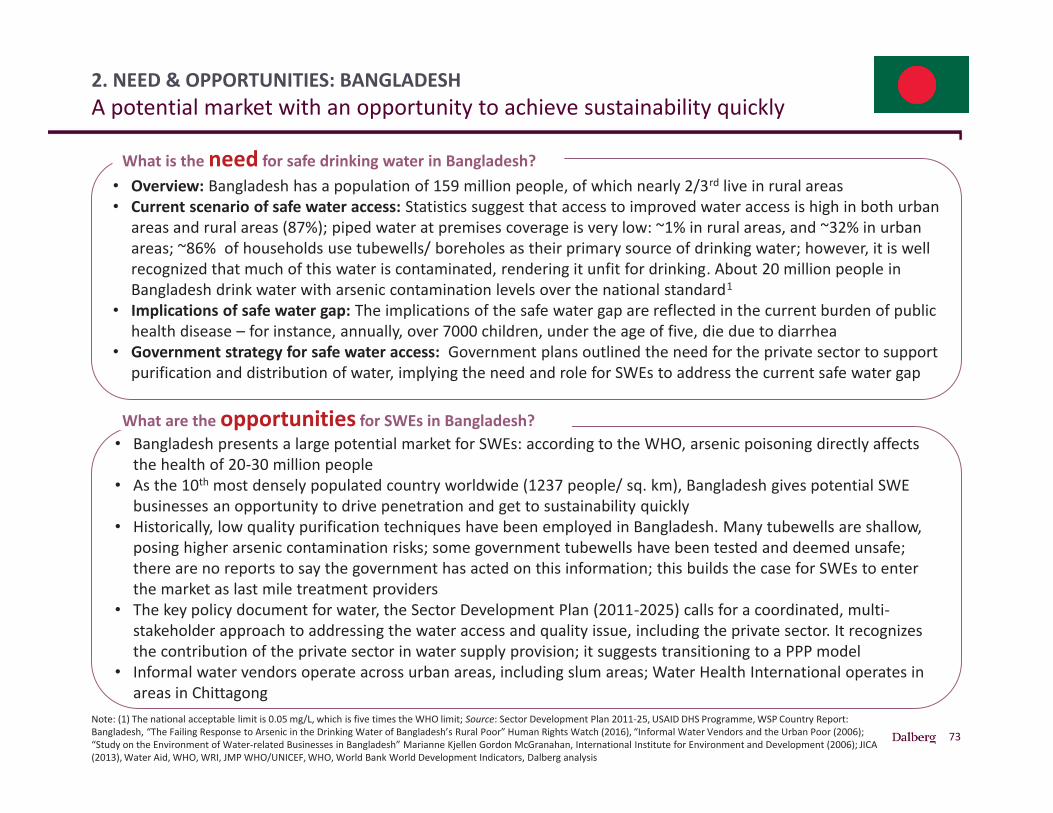
73
2. NEED & OPPORTUNITIES: BANGLADESHA potential market with an opportunity to achieve sustainability quickly
Note: (1) The national acceptable limit is 0.05 mg/L, which is five times the WHO limit; Source: Sector Development Plan 2011-25, USAID DHS Programme, WSP Country Report: Bangladesh, “The Failing Response to Arsenic in the Drinking Water of Bangladesh’s Rural Poor” Human Rights Watch (2016), “Informal Water Vendors and the Urban Poor (2006); “Study on the Environment of Water-related Businesses in Bangladesh” Marianne Kjellen Gordon McGranahan, International Institute for Environment and Development (2006); JICA (2013), Water Aid, WHO, WRI, JMP WHO/UNICEF, WHO, World Bank World Development Indicators, Dalberg analysis
• Overview: Bangladesh has a population of 159 million people, of which nearly 2/3rd live in rural areas• Current scenario of safe water access: Statistics suggest that access to improved water access is high in both urban
areas and rural areas (87%); piped water at premises coverage is very low: ~1% in rural areas, and ~32% in urban areas; ~86% of households use tubewells/ boreholes as their primary source of drinking water; however, it is well recognized that much of this water is contaminated, rendering it unfit for drinking. About 20 million people in Bangladesh drink water with arsenic contamination levels over the national standard1
• Implications of safe water gap: The implications of the safe water gap are reflected in the current burden of public health disease – for instance, annually, over 7000 children, under the age of five, die due to diarrhea
• Government strategy for safe water access: Government plans outlined the need for the private sector to support purification and distribution of water, implying the need and role for SWEs to address the current safe water gap
What is the need for safe drinking water in Bangladesh?
• Bangladesh presents a large potential market for SWEs: according to the WHO, arsenic poisoning directly affects the health of 20-30 million people
• As the 10th most densely populated country worldwide (1237 people/ sq. km), Bangladesh gives potential SWE businesses an opportunity to drive penetration and get to sustainability quickly
• Historically, low quality purification techniques have been employed in Bangladesh. Many tubewells are shallow, posing higher arsenic contamination risks; some government tubewells have been tested and deemed unsafe; there are no reports to say the government has acted on this information; this builds the case for SWEs to enter the market as last mile treatment providers
• The key policy document for water, the Sector Development Plan (2011-2025) calls for a coordinated, multi-stakeholder approach to addressing the water access and quality issue, including the private sector. It recognizes the contribution of the private sector in water supply provision; it suggests transitioning to a PPP model
• Informal water vendors operate across urban areas, including slum areas; Water Health International operates in areas in Chittagong
What are the opportunities for SWEs in Bangladesh?
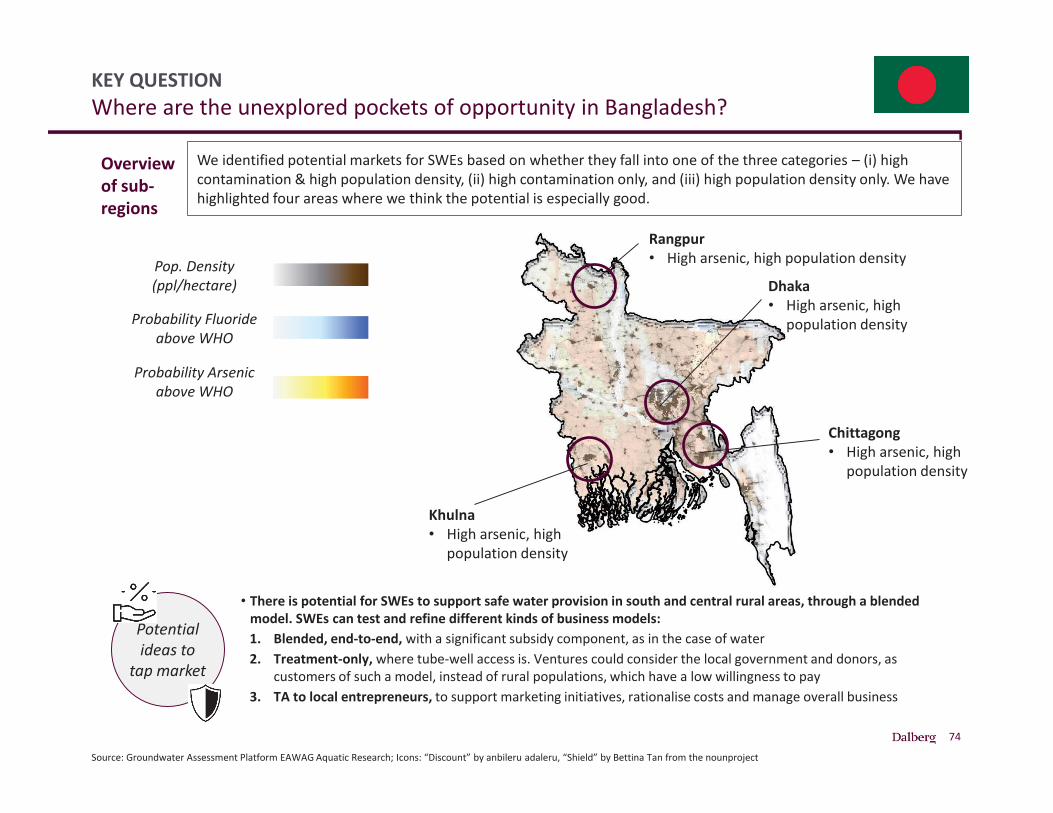
74
KEY QUESTIONWhere are the unexplored pockets of opportunity in Bangladesh?
Source: Groundwater Assessment Platform EAWAG Aquatic Research; Icons: “Discount” by anbileru adaleru, “Shield” by Bettina Tan from the nounproject
Pop. Density (ppl/hectare)
Probability Fluoride above WHO
Probability Arsenic above WHO
We identified potential markets for SWEs based on whether they fall into one of the three categories – (i) high contamination & high population density, (ii) high contamination only, and (iii) high population density only. We have highlighted four areas where we think the potential is especially good.
Overview of sub-regions
Dhaka• High arsenic, high
population density
Khulna• High arsenic, high
population density
Rangpur• High arsenic, high population density
Chittagong• High arsenic, high
population density
• There is potential for SWEs to support safe water provision in south and central rural areas, through a blended model. SWEs can test and refine different kinds of business models:1. Blended, end-to-end, with a significant subsidy component, as in the case of water2. Treatment-only, where tube-well access is. Ventures could consider the local government and donors, as
customers of such a model, instead of rural populations, which have a low willingness to pay3. TA to local entrepreneurs, to support marketing initiatives, rationalise costs and manage overall business
Potential ideas to
tap market
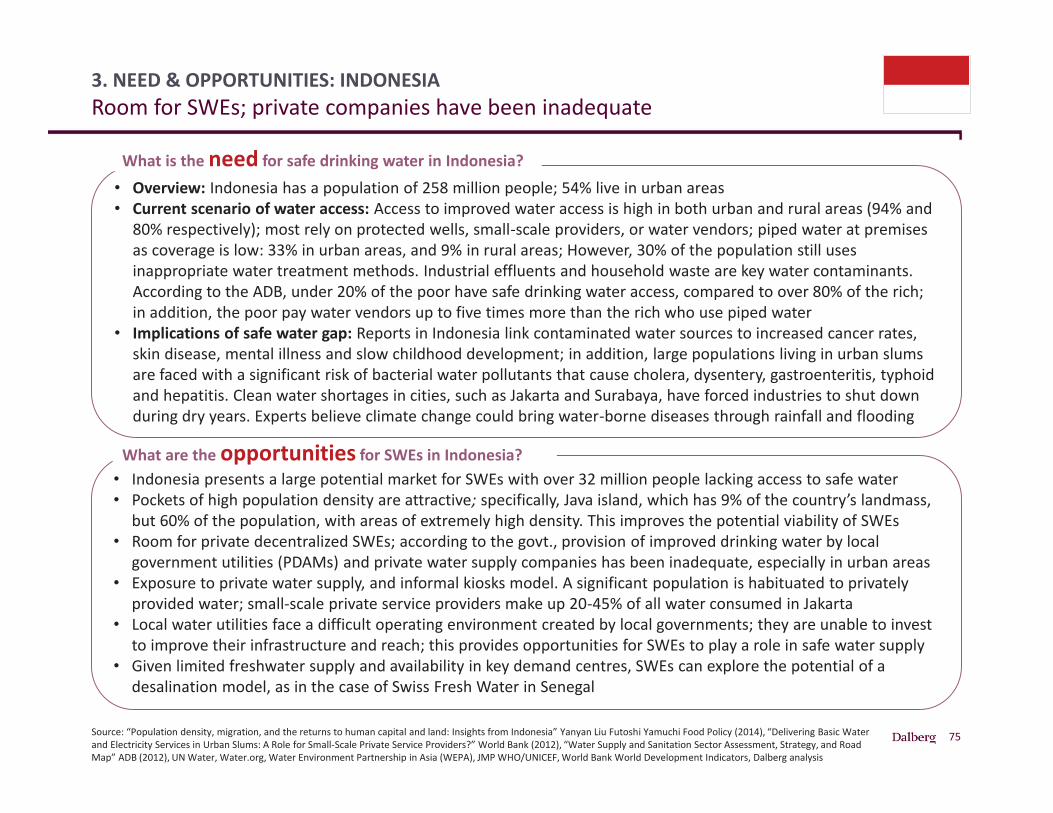
75
• Indonesia presents a large potential market for SWEs with over 32 million people lacking access to safe water• Pockets of high population density are attractive; specifically, Java island, which has 9% of the country’s landmass,
but 60% of the population, with areas of extremely high density. This improves the potential viability of SWEs• Room for private decentralized SWEs; according to the govt., provision of improved drinking water by local
government utilities (PDAMs) and private water supply companies has been inadequate, especially in urban areas• Exposure to private water supply, and informal kiosks model. A significant population is habituated to privately
provided water; small-scale private service providers make up 20-45% of all water consumed in Jakarta• Local water utilities face a difficult operating environment created by local governments; they are unable to invest
to improve their infrastructure and reach; this provides opportunities for SWEs to play a role in safe water supply• Given limited freshwater supply and availability in key demand centres, SWEs can explore the potential of a
desalination model, as in the case of Swiss Fresh Water in Senegal
3. NEED & OPPORTUNITIES: INDONESIARoom for SWEs; private companies have been inadequate
Source: “Population density, migration, and the returns to human capital and land: Insights from Indonesia” Yanyan Liu Futoshi Yamuchi Food Policy (2014), “Delivering Basic Water and Electricity Services in Urban Slums: A Role for Small-Scale Private Service Providers?” World Bank (2012), “Water Supply and Sanitation Sector Assessment, Strategy, and Road Map” ADB (2012), UN Water, Water.org, Water Environment Partnership in Asia (WEPA), JMP WHO/UNICEF, World Bank World Development Indicators, Dalberg analysis
• Overview: Indonesia has a population of 258 million people; 54% live in urban areas• Current scenario of water access: Access to improved water access is high in both urban and rural areas (94% and
80% respectively); most rely on protected wells, small-scale providers, or water vendors; piped water at premises as coverage is low: 33% in urban areas, and 9% in rural areas; However, 30% of the population still uses inappropriate water treatment methods. Industrial effluents and household waste are key water contaminants. According to the ADB, under 20% of the poor have safe drinking water access, compared to over 80% of the rich; in addition, the poor pay water vendors up to five times more than the rich who use piped water
• Implications of safe water gap: Reports in Indonesia link contaminated water sources to increased cancer rates, skin disease, mental illness and slow childhood development; in addition, large populations living in urban slums are faced with a significant risk of bacterial water pollutants that cause cholera, dysentery, gastroenteritis, typhoid and hepatitis. Clean water shortages in cities, such as Jakarta and Surabaya, have forced industries to shut down during dry years. Experts believe climate change could bring water-borne diseases through rainfall and flooding
What is the need for safe drinking water in Indonesia?
What are the opportunities for SWEs in Indonesia?
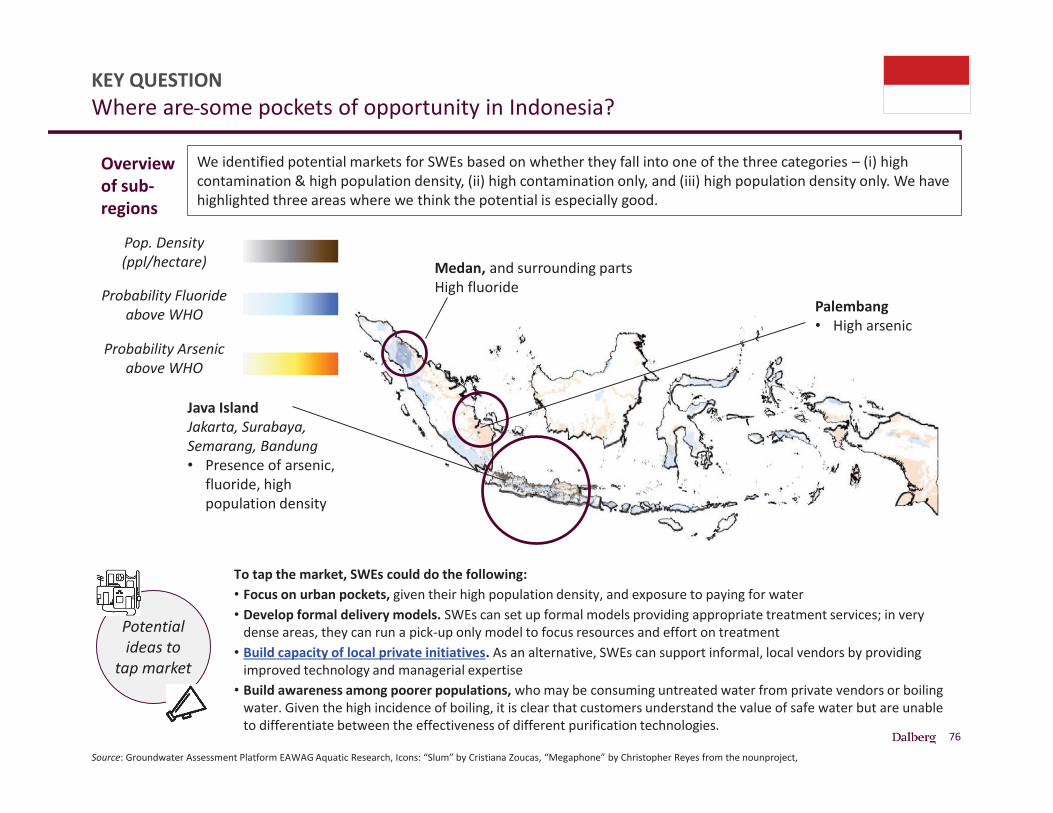
76
KEY QUESTIONWhere are some pockets of opportunity in Indonesia?
Source: Groundwater Assessment Platform EAWAG Aquatic Research, Icons: “Slum” by Cristiana Zoucas, “Megaphone” by Christopher Reyes from the nounproject,
Pop. Density (ppl/hectare)
Probability Fluoride above WHO
Probability Arsenic above WHO
Java IslandJakarta, Surabaya, Semarang, Bandung • Presence of arsenic,
fluoride, high population density
Palembang• High arsenic
To tap the market, SWEs could do the following:• Focus on urban pockets, given their high population density, and exposure to paying for water• Develop formal delivery models. SWEs can set up formal models providing appropriate treatment services; in very
dense areas, they can run a pick-up only model to focus resources and effort on treatment• Build capacity of local private initiatives. As an alternative, SWEs can support informal, local vendors by providing
improved technology and managerial expertise• Build awareness among poorer populations, who may be consuming untreated water from private vendors or boiling
water. Given the high incidence of boiling, it is clear that customers understand the value of safe water but are unable to differentiate between the effectiveness of different purification technologies.
Potential ideas to
tap market
We identified potential markets for SWEs based on whether they fall into one of the three categories – (i) high contamination & high population density, (ii) high contamination only, and (iii) high population density only. We have highlighted three areas where we think the potential is especially good.
Overview of sub-regions
Medan, and surrounding partsHigh fluoride
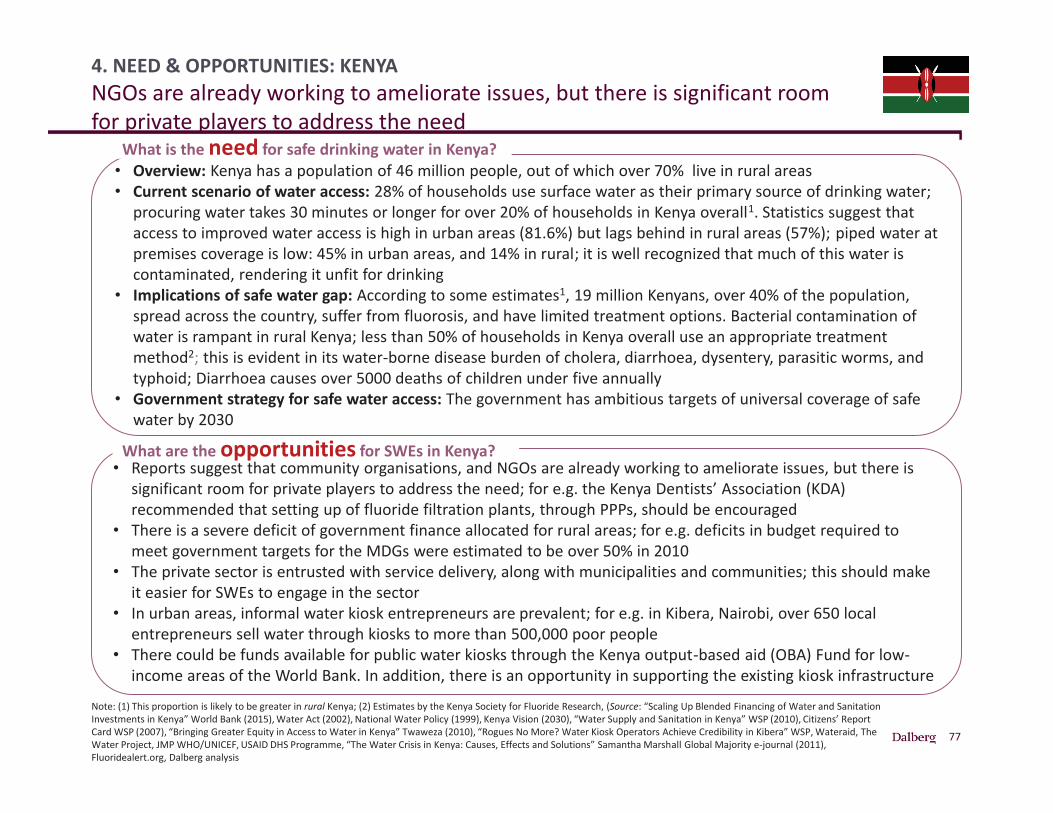
77
• Reports suggest that community organisations, and NGOs are already working to ameliorate issues, but there is significant room for private players to address the need; for e.g. the Kenya Dentists’ Association (KDA) recommended that setting up of fluoride filtration plants, through PPPs, should be encouraged
• There is a severe deficit of government finance allocated for rural areas; for e.g. deficits in budget required to meet government targets for the MDGs were estimated to be over 50% in 2010
• The private sector is entrusted with service delivery, along with municipalities and communities; this should make it easier for SWEs to engage in the sector
• In urban areas, informal water kiosk entrepreneurs are prevalent; for e.g. in Kibera, Nairobi, over 650 local entrepreneurs sell water through kiosks to more than 500,000 poor people
• There could be funds available for public water kiosks through the Kenya output-based aid (OBA) Fund for low-income areas of the World Bank. In addition, there is an opportunity in supporting the existing kiosk infrastructure
4. NEED & OPPORTUNITIES: KENYANGOs are already working to ameliorate issues, but there is significant room for private players to address the need
Note: (1) This proportion is likely to be greater in rural Kenya; (2) Estimates by the Kenya Society for Fluoride Research, (Source: “Scaling Up Blended Financing of Water and Sanitation Investments in Kenya” World Bank (2015), Water Act (2002), National Water Policy (1999), Kenya Vision (2030), “Water Supply and Sanitation in Kenya” WSP (2010), Citizens’ Report Card WSP (2007), “Bringing Greater Equity in Access to Water in Kenya” Twaweza (2010), “Rogues No More? Water Kiosk Operators Achieve Credibility in Kibera” WSP, Wateraid, The Water Project, JMP WHO/UNICEF, USAID DHS Programme, “The Water Crisis in Kenya: Causes, Effects and Solutions” Samantha Marshall Global Majority e-journal (2011), Fluoridealert.org, Dalberg analysis
• Overview: Kenya has a population of 46 million people, out of which over 70% live in rural areas• Current scenario of water access: 28% of households use surface water as their primary source of drinking water;
procuring water takes 30 minutes or longer for over 20% of households in Kenya overall1. Statistics suggest that access to improved water access is high in urban areas (81.6%) but lags behind in rural areas (57%); piped water at premises coverage is low: 45% in urban areas, and 14% in rural; it is well recognized that much of this water is contaminated, rendering it unfit for drinking
• Implications of safe water gap: According to some estimates1, 19 million Kenyans, over 40% of the population, spread across the country, suffer from fluorosis, and have limited treatment options. Bacterial contamination of water is rampant in rural Kenya; less than 50% of households in Kenya overall use an appropriate treatment method2; this is evident in its water-borne disease burden of cholera, diarrhoea, dysentery, parasitic worms, and typhoid; Diarrhoea causes over 5000 deaths of children under five annually
• Government strategy for safe water access: The government has ambitious targets of universal coverage of safe water by 2030
What is the need for safe drinking water in Kenya?
What are the opportunities for SWEs in Kenya?
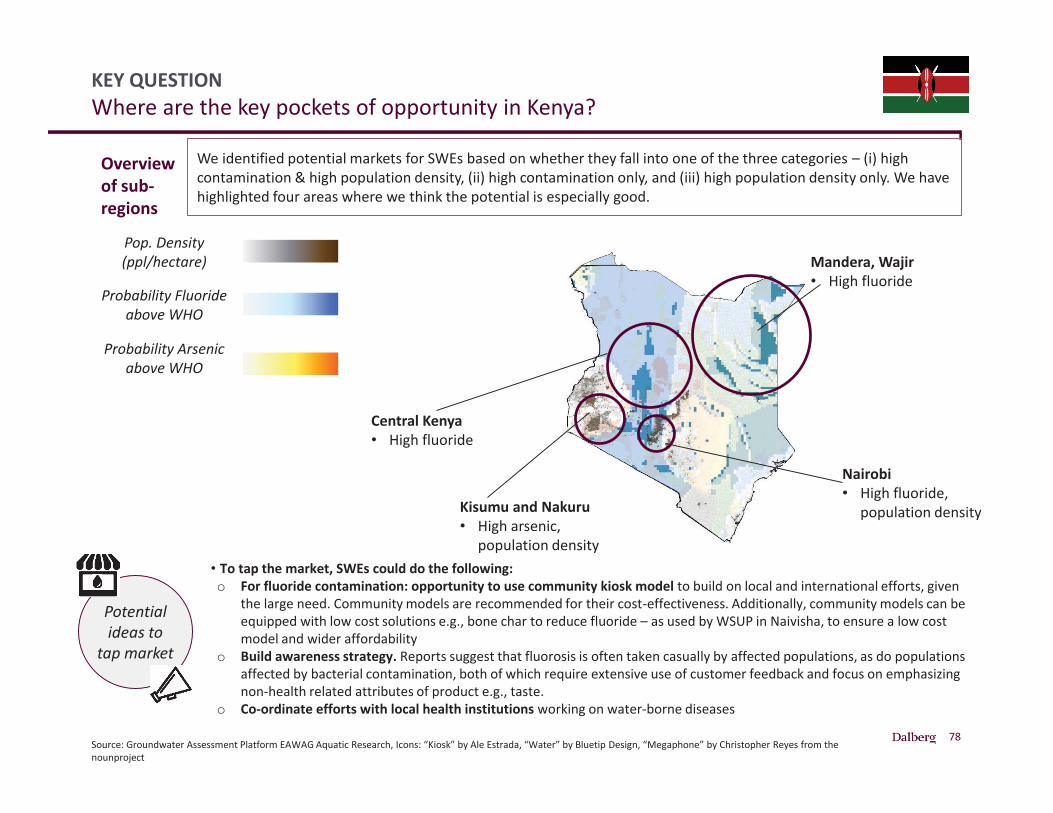
78
KEY QUESTIONWhere are the key pockets of opportunity in Kenya?
Source: Groundwater Assessment Platform EAWAG Aquatic Research, Icons: “Kiosk” by Ale Estrada, “Water” by Bluetip Design, “Megaphone” by Christopher Reyes from the nounproject
We identified potential markets for SWEs based on whether they fall into one of the three categories – (i) high contamination & high population density, (ii) high contamination only, and (iii) high population density only. We have highlighted four areas where we think the potential is especially good.
Overview of sub-regions
Kisumu and Nakuru• High arsenic,
population density
Nairobi• High fluoride,
population density
Mandera, Wajir• High fluoride
Central Kenya• High fluoride
Pop. Density (ppl/hectare)
Probability Fluoride above WHO
Probability Arsenic above WHO
• To tap the market, SWEs could do the following:o For fluoride contamination: opportunity to use community kiosk model to build on local and international efforts, given
the large need. Community models are recommended for their cost-effectiveness. Additionally, community models can be equipped with low cost solutions e.g., bone char to reduce fluoride – as used by WSUP in Naivisha, to ensure a low cost model and wider affordability
o Build awareness strategy. Reports suggest that fluorosis is often taken casually by affected populations, as do populations affected by bacterial contamination, both of which require extensive use of customer feedback and focus on emphasizing non-health related attributes of product e.g., taste.
o Co-ordinate efforts with local health institutions working on water-borne diseases
Potential ideas to
tap market
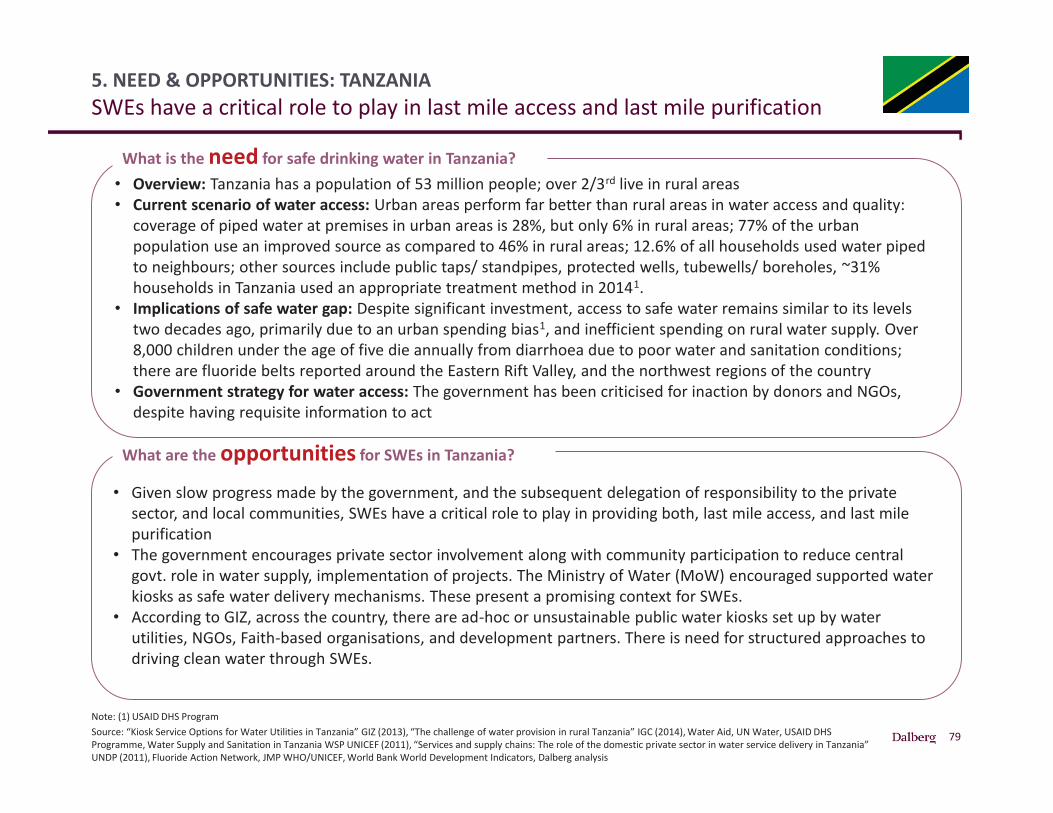
79
• Given slow progress made by the government, and the subsequent delegation of responsibility to the private sector, and local communities, SWEs have a critical role to play in providing both, last mile access, and last mile purification
• The government encourages private sector involvement along with community participation to reduce central govt. role in water supply, implementation of projects. The Ministry of Water (MoW) encouraged supported water kiosks as safe water delivery mechanisms. These present a promising context for SWEs.
• According to GIZ, across the country, there are ad-hoc or unsustainable public water kiosks set up by water utilities, NGOs, Faith-based organisations, and development partners. There is need for structured approaches to driving clean water through SWEs.
5. NEED & OPPORTUNITIES: TANZANIASWEs have a critical role to play in last mile access and last mile purification
Note: (1) USAID DHS ProgramSource: “Kiosk Service Options for Water Utilities in Tanzania” GIZ (2013), “The challenge of water provision in rural Tanzania” IGC (2014), Water Aid, UN Water, USAID DHS Programme, Water Supply and Sanitation in Tanzania WSP UNICEF (2011), “Services and supply chains: The role of the domestic private sector in water service delivery in Tanzania” UNDP (2011), Fluoride Action Network, JMP WHO/UNICEF, World Bank World Development Indicators, Dalberg analysis
• Overview: Tanzania has a population of 53 million people; over 2/3rd live in rural areas • Current scenario of water access: Urban areas perform far better than rural areas in water access and quality:
coverage of piped water at premises in urban areas is 28%, but only 6% in rural areas; 77% of the urban population use an improved source as compared to 46% in rural areas; 12.6% of all households used water piped to neighbours; other sources include public taps/ standpipes, protected wells, tubewells/ boreholes, ~31% households in Tanzania used an appropriate treatment method in 20141.
• Implications of safe water gap: Despite significant investment, access to safe water remains similar to its levels two decades ago, primarily due to an urban spending bias1, and inefficient spending on rural water supply. Over8,000 children under the age of five die annually from diarrhoea due to poor water and sanitation conditions; there are fluoride belts reported around the Eastern Rift Valley, and the northwest regions of the country
• Government strategy for water access: The government has been criticised for inaction by donors and NGOs, despite having requisite information to act
What is the need for safe drinking water in Tanzania?
What are the opportunities for SWEs in Tanzania?
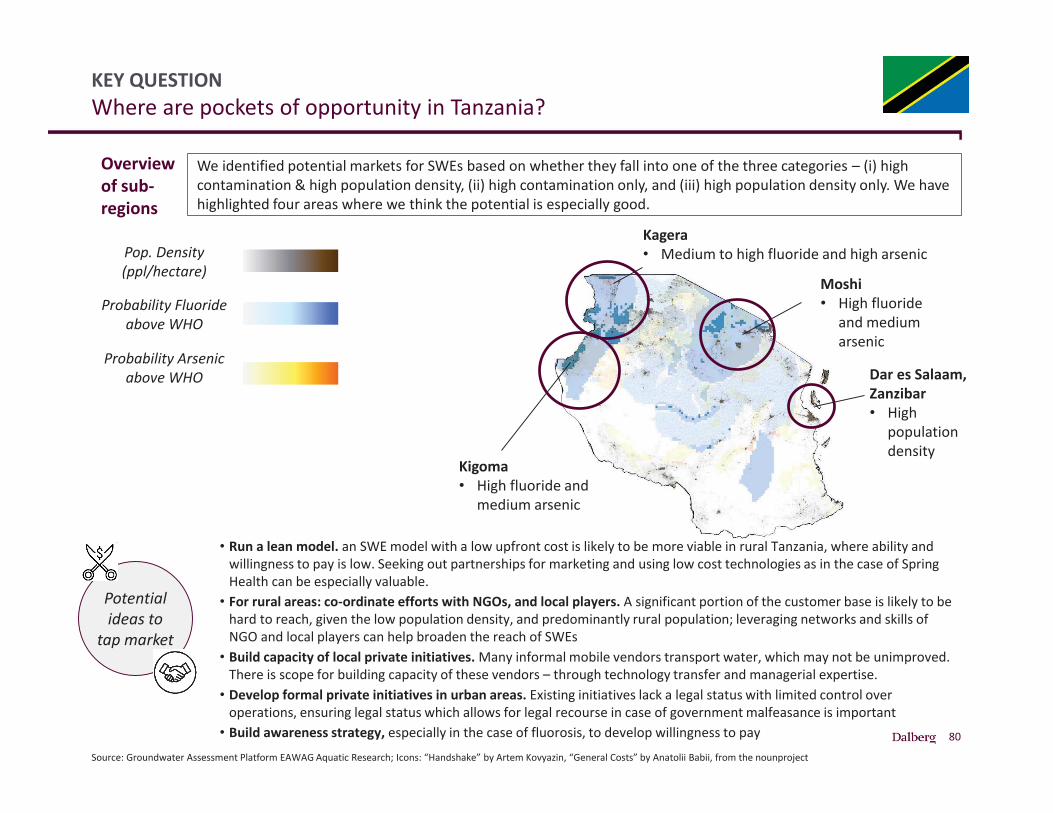
80
KEY QUESTIONWhere are pockets of opportunity in Tanzania?
Source: Groundwater Assessment Platform EAWAG Aquatic Research; Icons: “Handshake” by Artem Kovyazin, “General Costs” by Anatolii Babii, from the nounproject
Pop. Density (ppl/hectare)
Probability Fluoride above WHO
Probability Arsenic above WHO
We identified potential markets for SWEs based on whether they fall into one of the three categories – (i) high contamination & high population density, (ii) high contamination only, and (iii) high population density only. We have highlighted four areas where we think the potential is especially good.
Overview of sub-regions
Moshi• High fluoride
and medium arsenic
Kagera• Medium to high fluoride and high arsenic
Kigoma• High fluoride and
medium arsenic
Dar es Salaam, Zanzibar• High
population density
• Run a lean model. an SWE model with a low upfront cost is likely to be more viable in rural Tanzania, where ability and willingness to pay is low. Seeking out partnerships for marketing and using low cost technologies as in the case of Spring Health can be especially valuable.
• For rural areas: co-ordinate efforts with NGOs, and local players. A significant portion of the customer base is likely to be hard to reach, given the low population density, and predominantly rural population; leveraging networks and skills of NGO and local players can help broaden the reach of SWEs
• Build capacity of local private initiatives. Many informal mobile vendors transport water, which may not be unimproved. There is scope for building capacity of these vendors – through technology transfer and managerial expertise.
• Develop formal private initiatives in urban areas. Existing initiatives lack a legal status with limited control over operations, ensuring legal status which allows for legal recourse in case of government malfeasance is important
• Build awareness strategy, especially in the case of fluorosis, to develop willingness to pay
Potential ideas to
tap market
81
1. Introduction: The Safe Water Challenge Facing Us And The Importance Of Understanding The Role Of Safe Water Enterprises (SWEs)
2. Overview of SWEs: Achievements and Unrealized Potential
3. The SWE Market: Opportunities and Potential Market Profiles
4. Strategies to Build a Market: Recommendations to Accelerate SWE Growth
TABLE OF CONTENTS
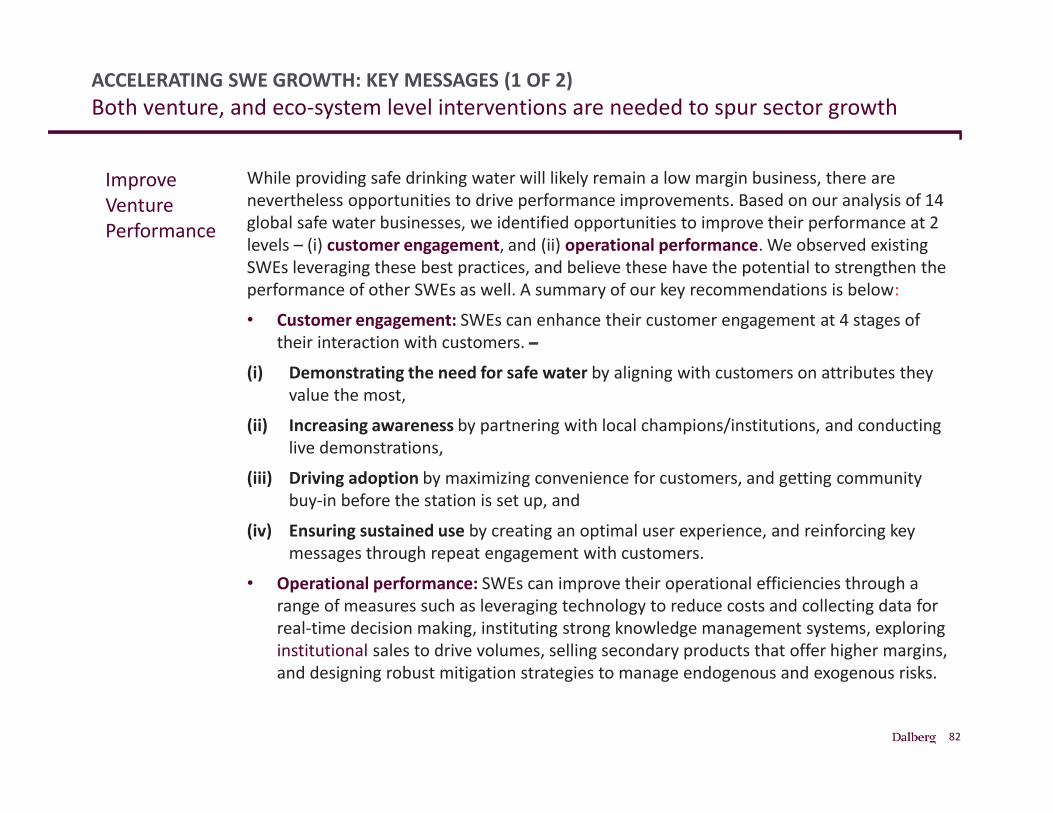
82
ACCELERATING SWE GROWTH: KEY MESSAGES (1 OF 2)Both venture, and eco-system level interventions are needed to spur sector growth
Improve Venture Performance
While providing safe drinking water will likely remain a low margin business, there are nevertheless opportunities to drive performance improvements. Based on our analysis of 14 global safe water businesses, we identified opportunities to improve their performance at 2 levels – (i) customer engagement, and (ii) operational performance. We observed existing SWEs leveraging these best practices, and believe these have the potential to strengthen the performance of other SWEs as well. A summary of our key recommendations is below: • Customer engagement: SWEs can enhance their customer engagement at 4 stages of
their interaction with customers. –(i) Demonstrating the need for safe water by aligning with customers on attributes they
value the most, (ii) Increasing awareness by partnering with local champions/institutions, and conducting
live demonstrations, (iii) Driving adoption by maximizing convenience for customers, and getting community
buy-in before the station is set up, and (iv) Ensuring sustained use by creating an optimal user experience, and reinforcing key
messages through repeat engagement with customers. • Operational performance: SWEs can improve their operational efficiencies through a
range of measures such as leveraging technology to reduce costs and collecting data for real-time decision making, instituting strong knowledge management systems, exploring institutional sales to drive volumes, selling secondary products that offer higher margins, and designing robust mitigation strategies to manage endogenous and exogenous risks.
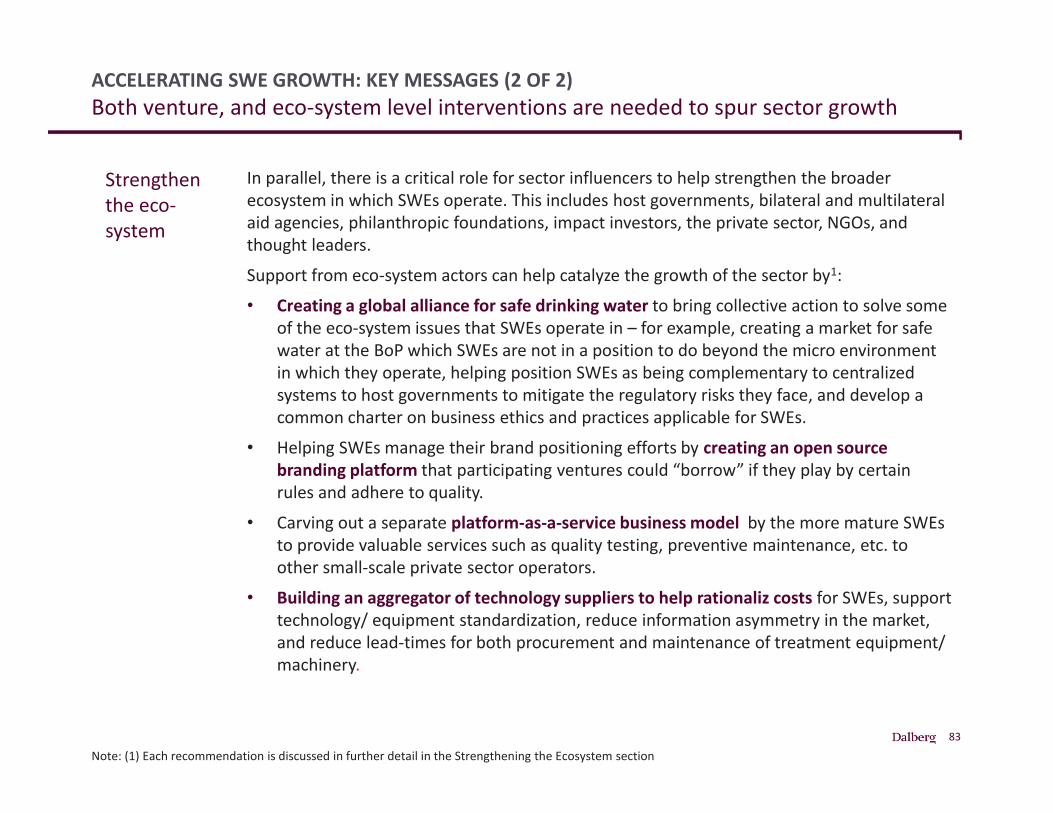
83
ACCELERATING SWE GROWTH: KEY MESSAGES (2 OF 2)Both venture, and eco-system level interventions are needed to spur sector growth
Note: (1) Each recommendation is discussed in further detail in the Strengthening the Ecosystem section
Strengthen the eco-system
In parallel, there is a critical role for sector influencers to help strengthen the broader ecosystem in which SWEs operate. This includes host governments, bilateral and multilateral aid agencies, philanthropic foundations, impact investors, the private sector, NGOs, and thought leaders.Support from eco-system actors can help catalyze the growth of the sector by1: • Creating a global alliance for safe drinking water to bring collective action to solve some
of the eco-system issues that SWEs operate in – for example, creating a market for safe water at the BoP which SWEs are not in a position to do beyond the micro environment in which they operate, helping position SWEs as being complementary to centralized systems to host governments to mitigate the regulatory risks they face, and develop a common charter on business ethics and practices applicable for SWEs.
• Helping SWEs manage their brand positioning efforts by creating an open source branding platform that participating ventures could “borrow” if they play by certain rules and adhere to quality.
• Carving out a separate platform-as-a-service business model by the more mature SWEs to provide valuable services such as quality testing, preventive maintenance, etc. to other small-scale private sector operators.
• Building an aggregator of technology suppliers to help rationaliz costs for SWEs, support technology/ equipment standardization, reduce information asymmetry in the market, and reduce lead-times for both procurement and maintenance of treatment equipment/ machinery.
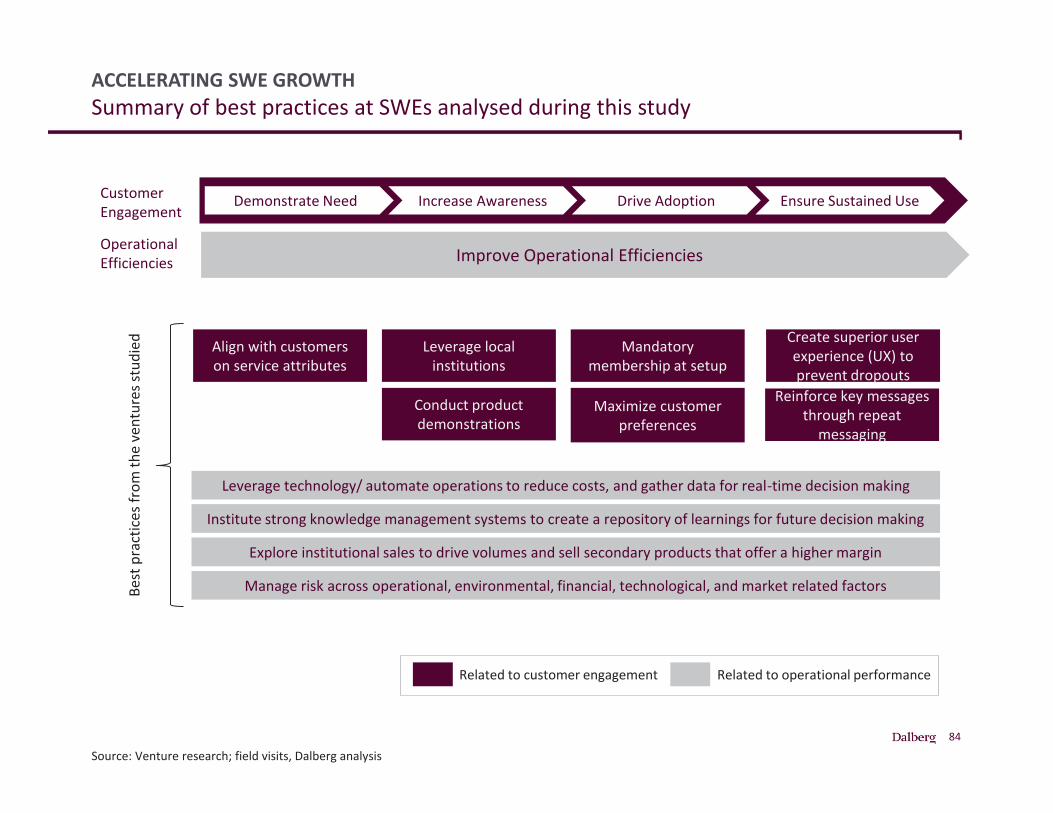
84
Improve Operational Efficiencies
ACCELERATING SWE GROWTHSummary of best practices at SWEs analysed during this study
Source: Venture research; field visits, Dalberg analysis
Demonstrate Need Increase Awareness Drive Adoption Ensure Sustained Use
Improve Operational Efficiencies
Align with customers on service attributes
Leverage local institutions
Conduct product demonstrations
Mandatory membership at setup
Maximize customer preferences
Manage risk across operational, environmental, financial, technological, and market related factors
Explore institutional sales to drive volumes and sell secondary products that offer a higher margin
Institute strong knowledge management systems to create a repository of learnings for future decision making
Leverage technology/ automate operations to reduce costs, and gather data for real-time decision making
Create superior user experience (UX) to prevent dropouts
Reinforce key messages through repeat
messaging
Best
pra
ctice
s fro
m th
e ve
ntur
es st
udie
d
Related to operational performanceRelated to customer engagement
Customer Engagement
Operational Efficiencies
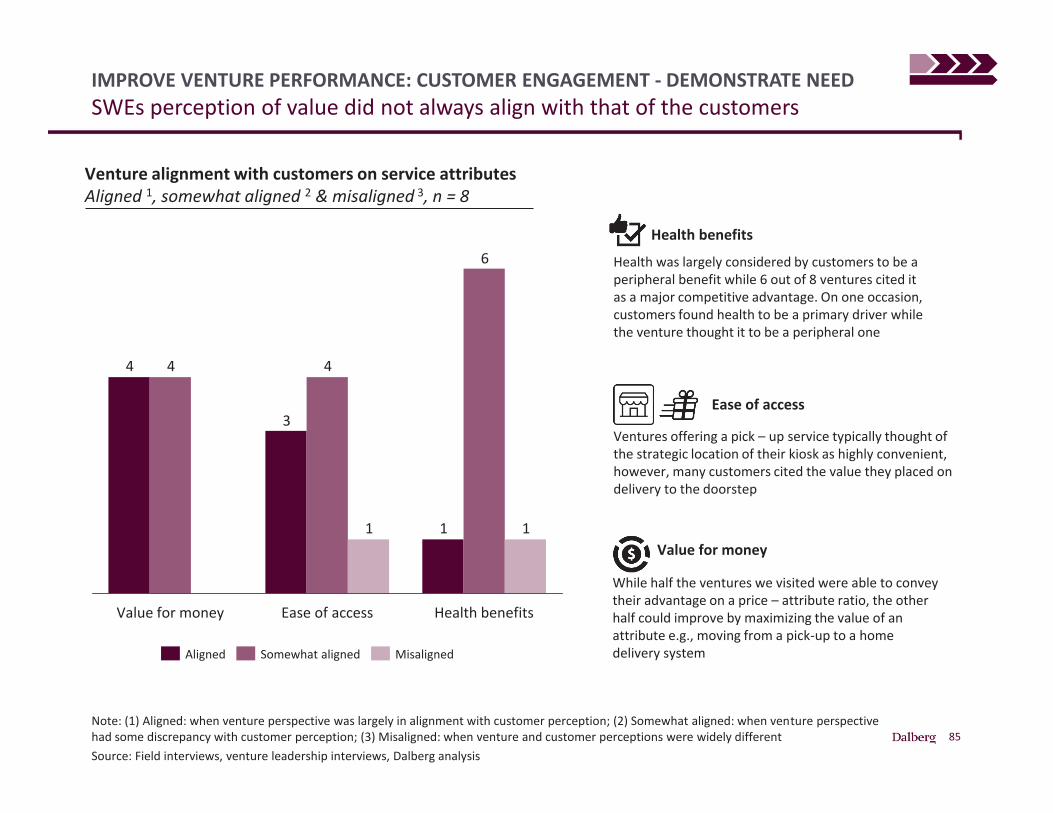
85
IMPROVE VENTURE PERFORMANCE: CUSTOMER ENGAGEMENT - DEMONSTRATE NEEDSWEs perception of value did not always align with that of the customers
Note: (1) Aligned: when venture perspective was largely in alignment with customer perception; (2) Somewhat aligned: when venture perspective had some discrepancy with customer perception; (3) Misaligned: when venture and customer perceptions were widely different Source: Field interviews, venture leadership interviews, Dalberg analysis
1
3
4
6
44
11
Ease of access Health benefitsValue for money
MisalignedSomewhat alignedAligned
Venture alignment with customers on service attributesAligned 1, somewhat aligned 2 & misaligned 3, n = 8
Ease of access
Ventures offering a pick – up service typically thought of the strategic location of their kiosk as highly convenient, however, many customers cited the value they placed on delivery to the doorstep
Health benefits
Health was largely considered by customers to be a peripheral benefit while 6 out of 8 ventures cited it as a major competitive advantage. On one occasion, customers found health to be a primary driver while the venture thought it to be a peripheral one
Value for money
While half the ventures we visited were able to convey their advantage on a price – attribute ratio, the other half could improve by maximizing the value of an attribute e.g., moving from a pick-up to a home delivery system
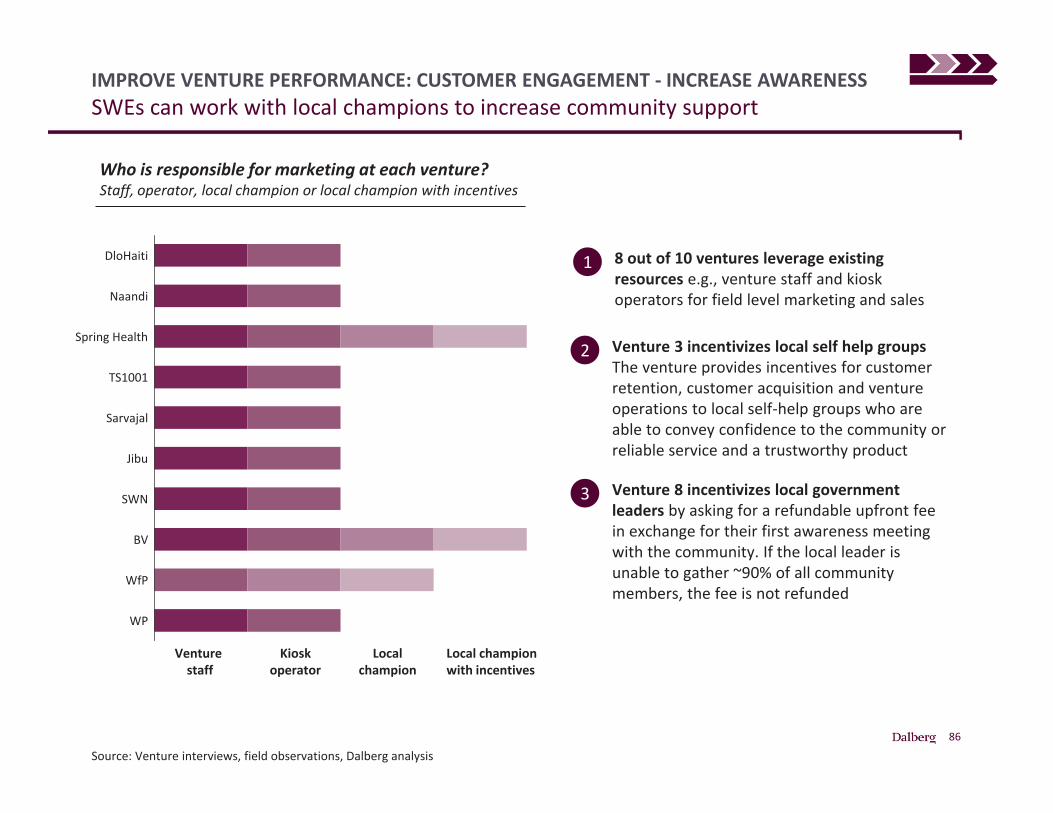
86
IMPROVE VENTURE PERFORMANCE: CUSTOMER ENGAGEMENT - INCREASE AWARENESSSWEs can work with local champions to increase community support
Source: Venture interviews, field observations, Dalberg analysis
BV
SWN
WP
WfP
Jibu
TS1001
Sarvajal
Spring Health
Naandi
DloHaiti 1 8 out of 10 ventures leverage existing resources e.g., venture staff and kiosk operators for field level marketing and sales
2 Venture 3 incentivizes local self help groupsThe venture provides incentives for customer retention, customer acquisition and venture operations to local self-help groups who are able to convey confidence to the community or reliable service and a trustworthy product
3 Venture 8 incentivizes local government leaders by asking for a refundable upfront fee in exchange for their first awareness meeting with the community. If the local leader is unable to gather ~90% of all community members, the fee is not refunded
Venturestaff
Kiosk operator
Local champion
Local champion with incentives
Who is responsible for marketing at each venture?Staff, operator, local champion or local champion with incentives
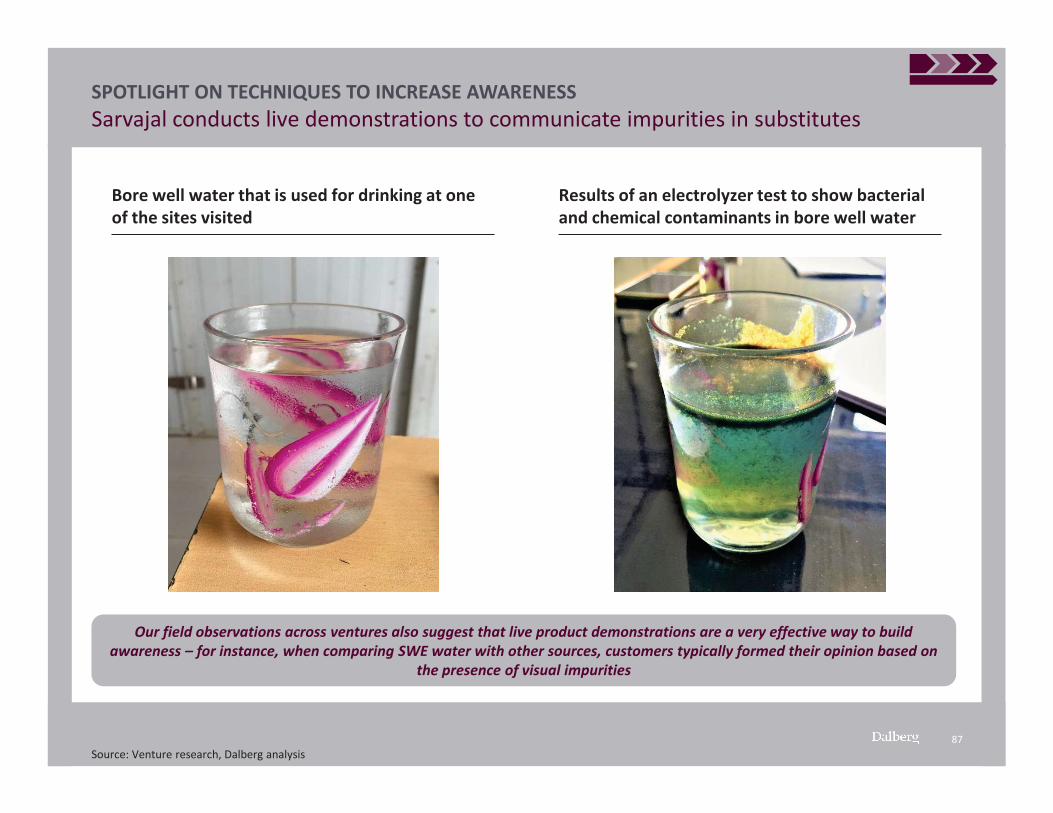
87
SPOTLIGHT ON TECHNIQUES TO INCREASE AWARENESS Sarvajal conducts live demonstrations to communicate impurities in substitutes
Source: Venture research, Dalberg analysis
Our field observations across ventures also suggest that live product demonstrations are a very effective way to build awareness – for instance, when comparing SWE water with other sources, customers typically formed their opinion based on
the presence of visual impurities
Bore well water that is used for drinking at one of the sites visited
Results of an electrolyzer test to show bacterial and chemical contaminants in bore well water
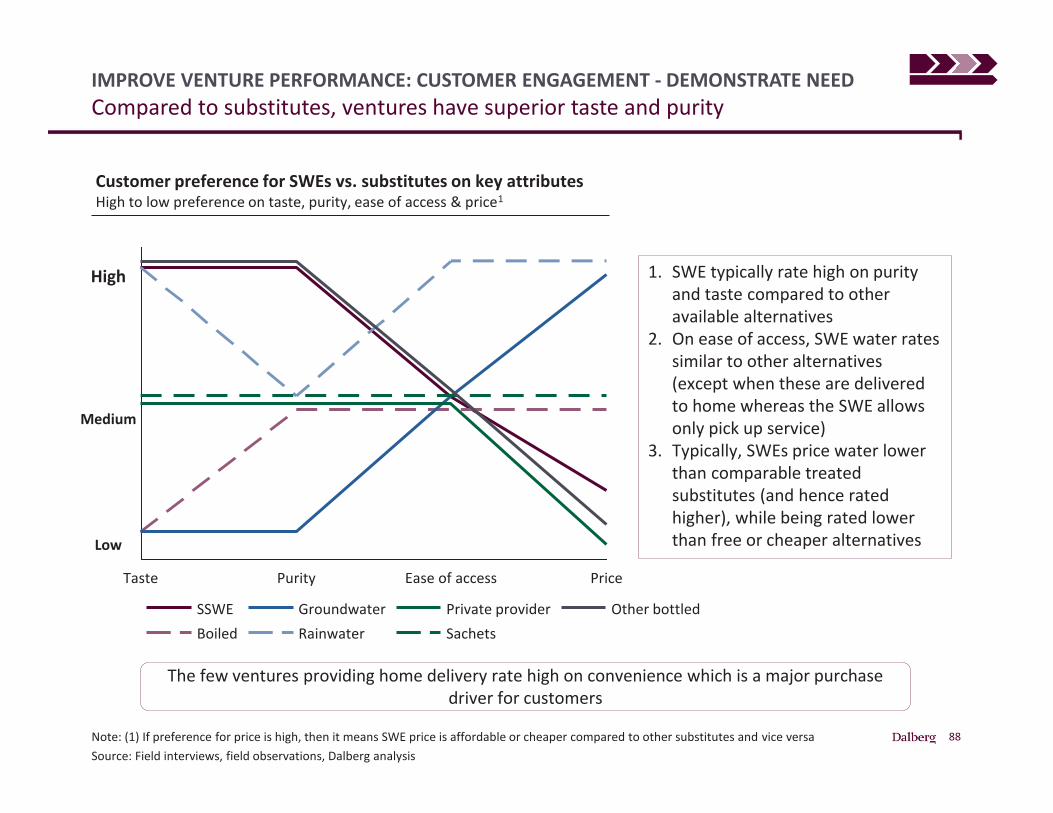
88
IMPROVE VENTURE PERFORMANCE: CUSTOMER ENGAGEMENT - DEMONSTRATE NEEDCompared to substitutes, ventures have superior taste and purity
Note: (1) If preference for price is high, then it means SWE price is affordable or cheaper compared to other substitutes and vice versa Source: Field interviews, field observations, Dalberg analysis
PriceEase of accessPurityTaste
Private provider Other bottledSachets
GroundwaterBoiledSSWE
Rainwater
Customer preference for SWEs vs. substitutes on key attributesHigh to low preference on taste, purity, ease of access & price1
High
Medium
Low
The few ventures providing home delivery rate high on convenience which is a major purchase driver for customers
1. SWE typically rate high on purity and taste compared to other available alternatives
2. On ease of access, SWE water rates similar to other alternatives (except when these are delivered to home whereas the SWE allows only pick up service)
3. Typically, SWEs price water lower than comparable treated substitutes (and hence rated higher), while being rated lower than free or cheaper alternatives
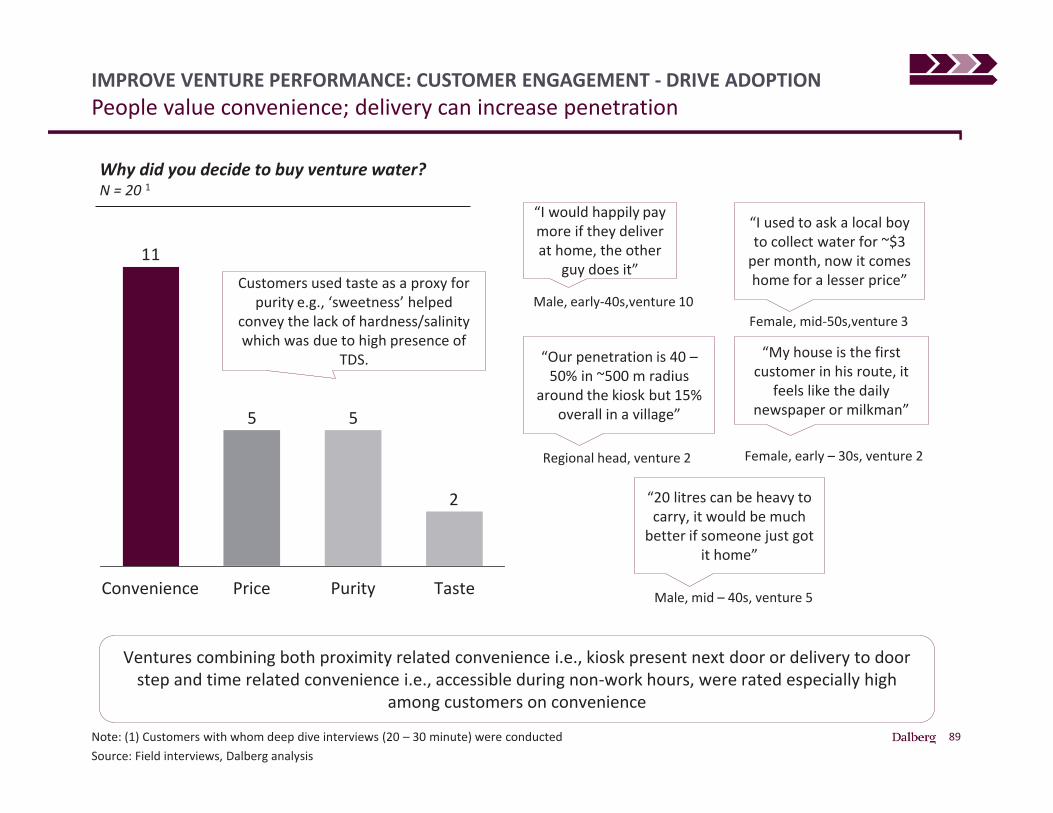
89
IMPROVE VENTURE PERFORMANCE: CUSTOMER ENGAGEMENT - DRIVE ADOPTIONPeople value convenience; delivery can increase penetration
Note: (1) Customers with whom deep dive interviews (20 – 30 minute) were conducted Source: Field interviews, Dalberg analysis
Why did you decide to buy venture water? N = 20 1
2
55
11
Price PurityConvenience Taste
Customers used taste as a proxy for purity e.g., ‘sweetness’ helped
convey the lack of hardness/salinity which was due to high presence of
TDS.
“I would happily pay more if they deliver at home, the other
guy does it”
Male, early-40s,venture 10
“I used to ask a local boy to collect water for ~$3
per month, now it comes home for a lesser price”
Female, mid-50s,venture 3
“Our penetration is 40 –50% in ~500 m radius
around the kiosk but 15% overall in a village”
Regional head, venture 2
“My house is the first customer in his route, it
feels like the daily newspaper or milkman”
Female, early – 30s, venture 2
“20 litres can be heavy to carry, it would be much
better if someone just got it home”
Male, mid – 40s, venture 5
Ventures combining both proximity related convenience i.e., kiosk present next door or delivery to door step and time related convenience i.e., accessible during non-work hours, were rated especially high
among customers on convenience
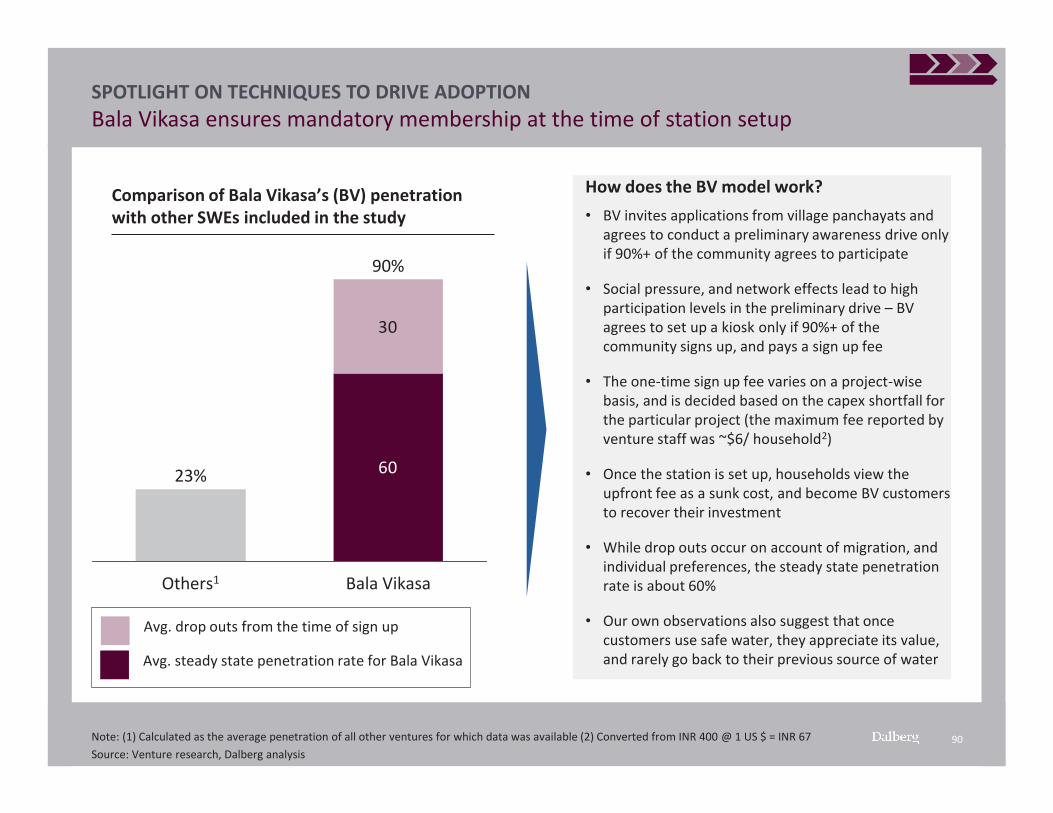
90
SPOTLIGHT ON TECHNIQUES TO DRIVE ADOPTIONBala Vikasa ensures mandatory membership at the time of station setup
Note: (1) Calculated as the average penetration of all other ventures for which data was available (2) Converted from INR 400 @ 1 US $ = INR 67 Source: Venture research, Dalberg analysis
60
30
Bala VikasaOthers1
90%
23%
Comparison of Bala Vikasa’s (BV) penetration with other SWEs included in the study
Avg. drop outs from the time of sign up
Avg. steady state penetration rate for Bala Vikasa
How does the BV model work?• BV invites applications from village panchayats and
agrees to conduct a preliminary awareness drive only if 90%+ of the community agrees to participate
• Social pressure, and network effects lead to high participation levels in the preliminary drive – BV agrees to set up a kiosk only if 90%+ of the community signs up, and pays a sign up fee
• The one-time sign up fee varies on a project-wise basis, and is decided based on the capex shortfall for the particular project (the maximum fee reported by venture staff was ~$6/ household2)
• Once the station is set up, households view the upfront fee as a sunk cost, and become BV customers to recover their investment
• While drop outs occur on account of migration, and individual preferences, the steady state penetration rate is about 60%
• Our own observations also suggest that once customers use safe water, they appreciate its value, and rarely go back to their previous source of water
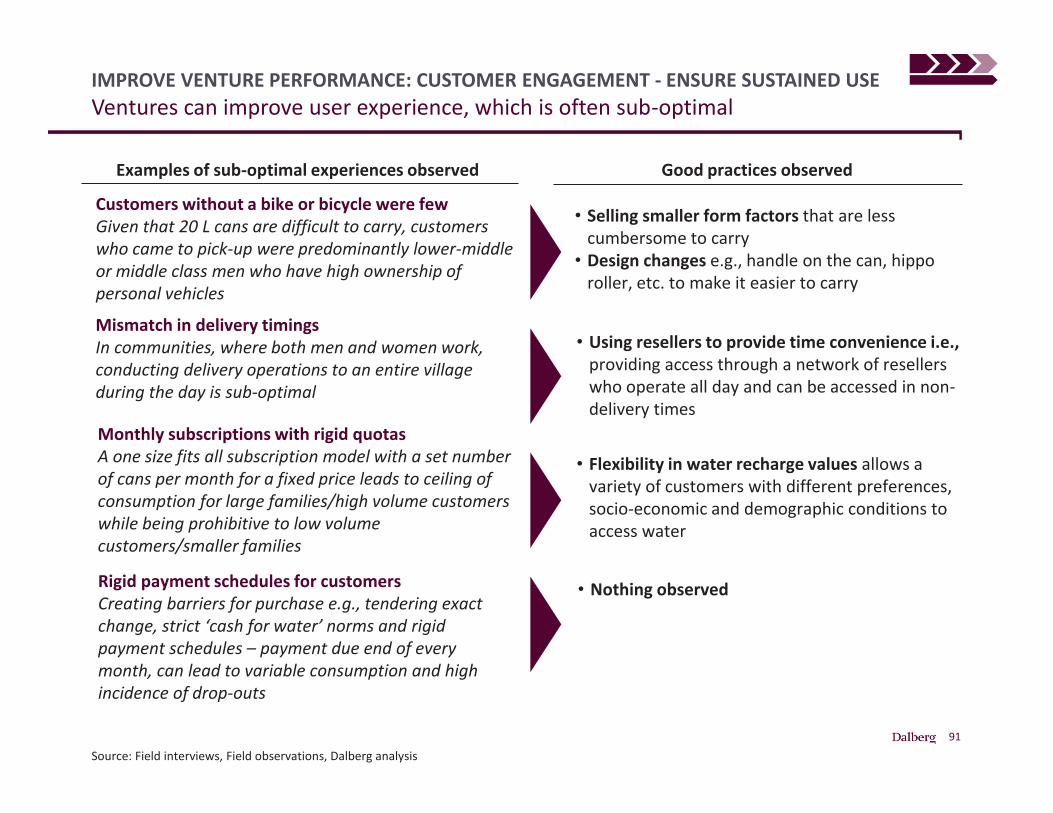
91
IMPROVE VENTURE PERFORMANCE: CUSTOMER ENGAGEMENT - ENSURE SUSTAINED USEVentures can improve user experience, which is often sub-optimal
Source: Field interviews, Field observations, Dalberg analysis
Customers without a bike or bicycle were fewGiven that 20 L cans are difficult to carry, customers who came to pick-up were predominantly lower-middle or middle class men who have high ownership of personal vehicles
Mismatch in delivery timingsIn communities, where both men and women work, conducting delivery operations to an entire village during the day is sub-optimal
Monthly subscriptions with rigid quotasA one size fits all subscription model with a set number of cans per month for a fixed price leads to ceiling of consumption for large families/high volume customers while being prohibitive to low volume customers/smaller families
Rigid payment schedules for customersCreating barriers for purchase e.g., tendering exact change, strict ‘cash for water’ norms and rigid payment schedules – payment due end of every month, can lead to variable consumption and high incidence of drop-outs
Examples of sub-optimal experiences observed Good practices observed
• Selling smaller form factors that are less cumbersome to carry
• Design changes e.g., handle on the can, hippo roller, etc. to make it easier to carry
• Using resellers to provide time convenience i.e., providing access through a network of resellers who operate all day and can be accessed in non-delivery times
• Flexibility in water recharge values allows a variety of customers with different preferences, socio-economic and demographic conditions to access water
• Nothing observed
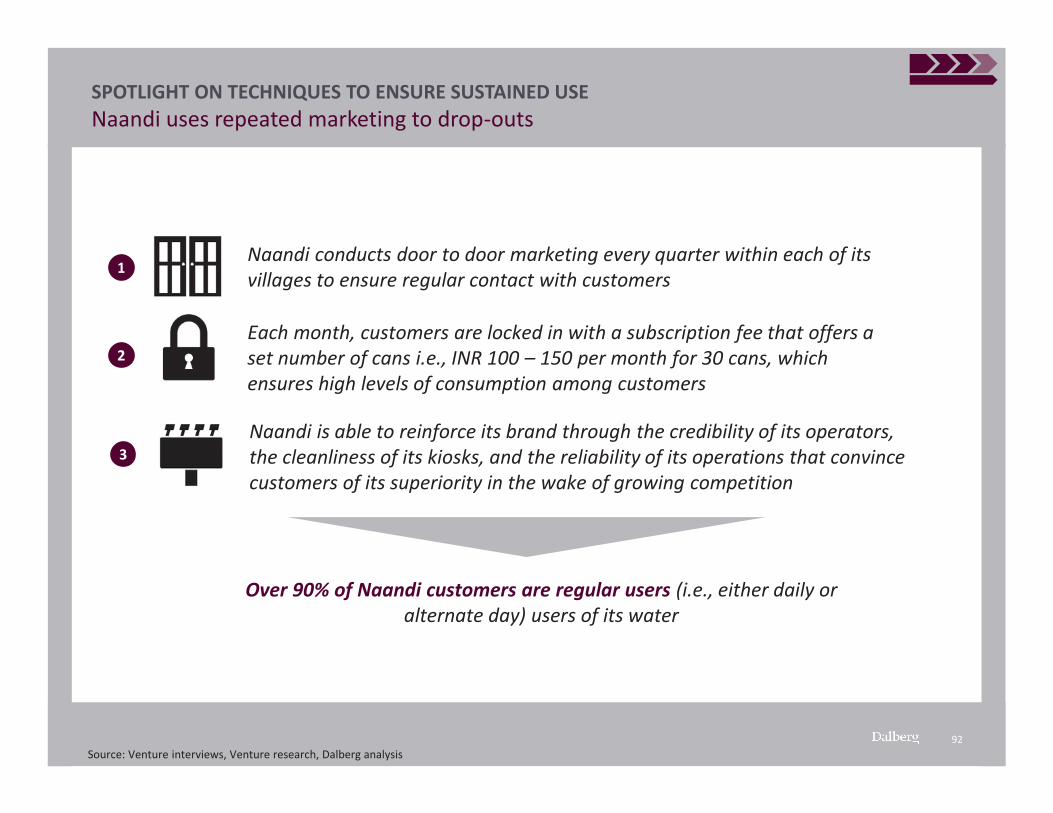
92
SPOTLIGHT ON TECHNIQUES TO ENSURE SUSTAINED USENaandi uses repeated marketing to drop-outs
Source: Venture interviews, Venture research, Dalberg analysis
1Naandi conducts door to door marketing every quarter within each of its villages to ensure regular contact with customers
2Each month, customers are locked in with a subscription fee that offers a set number of cans i.e., INR 100 – 150 per month for 30 cans, which ensures high levels of consumption among customers
3Naandi is able to reinforce its brand through the credibility of its operators, the cleanliness of its kiosks, and the reliability of its operations that convince customers of its superiority in the wake of growing competition
Over 90% of Naandi customers are regular users (i.e., either daily or alternate day) users of its water
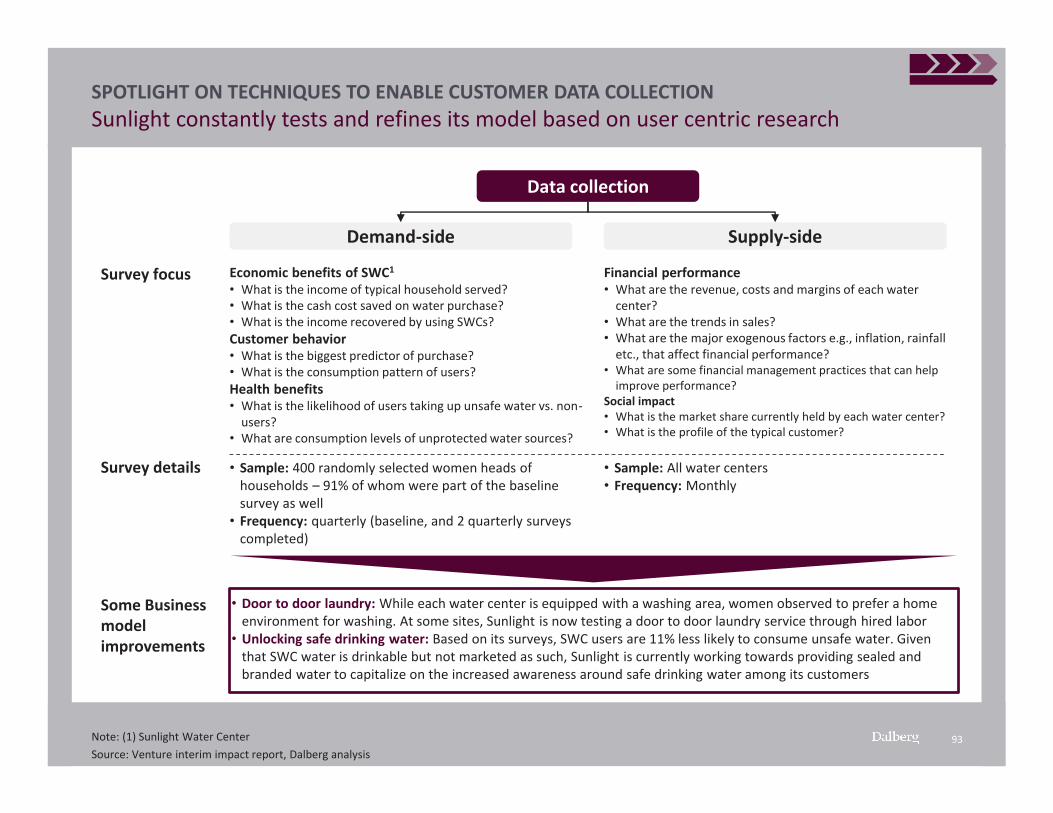
93
SPOTLIGHT ON TECHNIQUES TO ENABLE CUSTOMER DATA COLLECTIONSunlight constantly tests and refines its model based on user centric research
Note: (1) Sunlight Water CenterSource: Venture interim impact report, Dalberg analysis
Some Business model improvements
• Door to door laundry: While each water center is equipped with a washing area, women observed to prefer a home environment for washing. At some sites, Sunlight is now testing a door to door laundry service through hired labor
• Unlocking safe drinking water: Based on its surveys, SWC users are 11% less likely to consume unsafe water. Given that SWC water is drinkable but not marketed as such, Sunlight is currently working towards providing sealed and branded water to capitalize on the increased awareness around safe drinking water among its customers
Data collection
Demand-side Supply-side
Survey focus Economic benefits of SWC1
• What is the income of typical household served?• What is the cash cost saved on water purchase?• What is the income recovered by using SWCs?Customer behavior • What is the biggest predictor of purchase?• What is the consumption pattern of users? Health benefits• What is the likelihood of users taking up unsafe water vs. non-
users?• What are consumption levels of unprotected water sources?
Financial performance• What are the revenue, costs and margins of each water
center? • What are the trends in sales?• What are the major exogenous factors e.g., inflation, rainfall
etc., that affect financial performance? • What are some financial management practices that can help
improve performance? Social impact• What is the market share currently held by each water center?• What is the profile of the typical customer?
Survey details • Sample: 400 randomly selected women heads of households – 91% of whom were part of the baseline survey as well
• Frequency: quarterly (baseline, and 2 quarterly surveys completed)
• Sample: All water centers • Frequency: Monthly
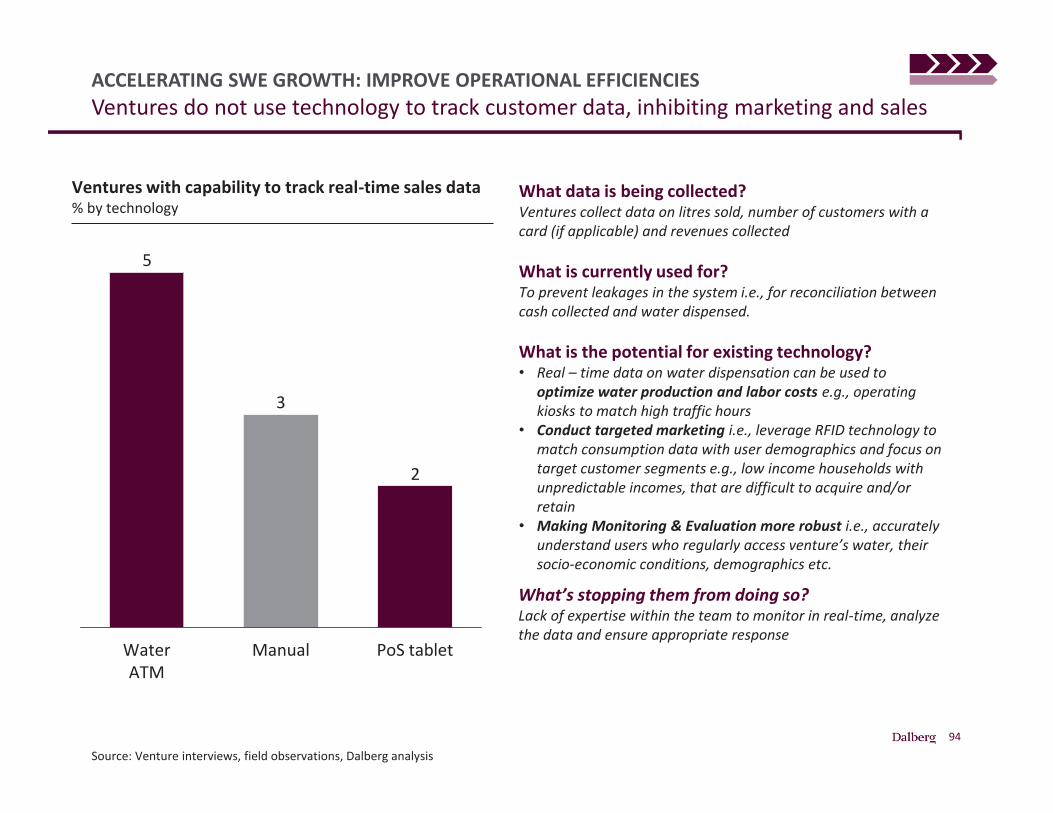
94
ACCELERATING SWE GROWTH: IMPROVE OPERATIONAL EFFICIENCIESVentures do not use technology to track customer data, inhibiting marketing and sales
Source: Venture interviews, field observations, Dalberg analysis
Ventures with capability to track real-time sales data% by technology
3
2
5
Water ATM
Manual PoS tablet
What data is being collected? Ventures collect data on litres sold, number of customers with a card (if applicable) and revenues collected
What is currently used for? To prevent leakages in the system i.e., for reconciliation between cash collected and water dispensed.
What is the potential for existing technology? • Real – time data on water dispensation can be used to
optimize water production and labor costs e.g., operating kiosks to match high traffic hours
• Conduct targeted marketing i.e., leverage RFID technology to match consumption data with user demographics and focus on target customer segments e.g., low income households with unpredictable incomes, that are difficult to acquire and/or retain
• Making Monitoring & Evaluation more robust i.e., accurately understand users who regularly access venture’s water, their socio-economic conditions, demographics etc.
What’s stopping them from doing so? Lack of expertise within the team to monitor in real-time, analyze the data and ensure appropriate response
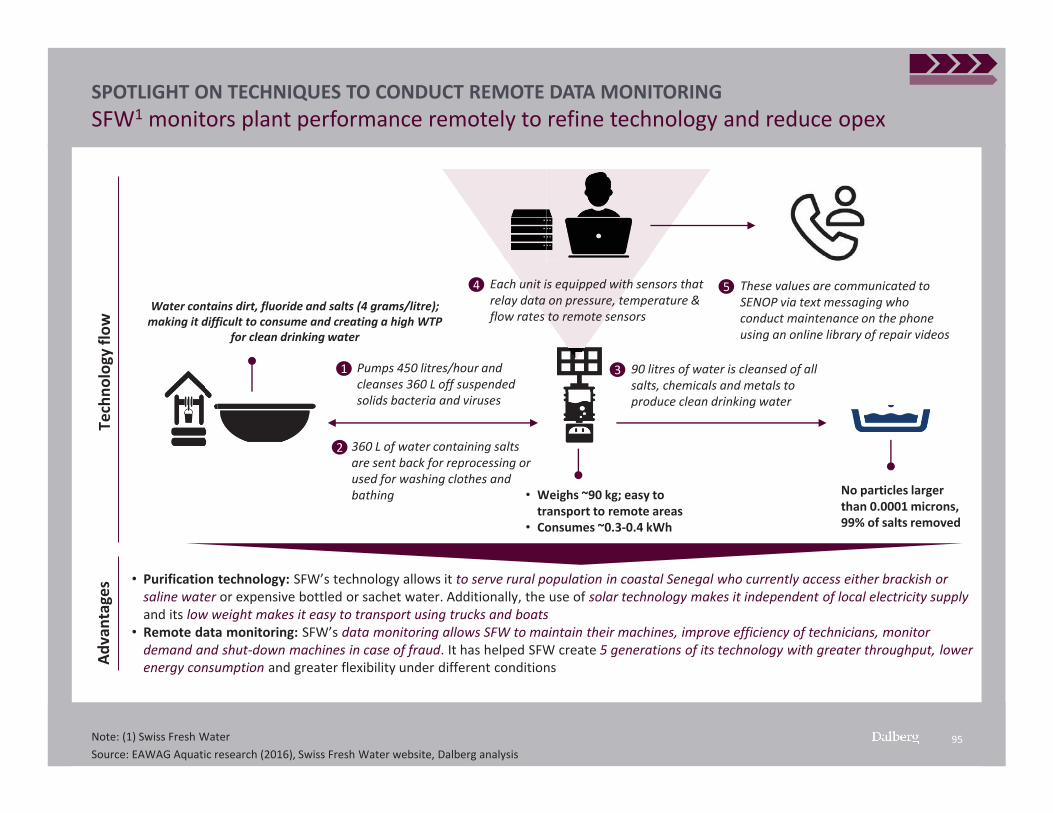
95
SPOTLIGHT ON TECHNIQUES TO CONDUCT REMOTE DATA MONITORINGSFW1 monitors plant performance remotely to refine technology and reduce opex
Note: (1) Swiss Fresh WaterSource: EAWAG Aquatic research (2016), Swiss Fresh Water website, Dalberg analysis
1 Pumps 450 litres/hour and cleanses 360 L off suspended solids bacteria and viruses
2 360 L of water containing salts are sent back for reprocessing or used for washing clothes and bathing
3 90 litres of water is cleansed of all salts, chemicals and metals to produce clean drinking water
No particles larger than 0.0001 microns, 99% of salts removed
• Weighs ~90 kg; easy to transport to remote areas
• Consumes ~0.3-0.4 kWh
4 Each unit is equipped with sensors that relay data on pressure, temperature & flow rates to remote sensors
5 These values are communicated to SENOP via text messaging who conduct maintenance on the phone using an online library of repair videos
Adva
ntag
esTe
chno
logy
flow
• Purification technology: SFW’s technology allows it to serve rural population in coastal Senegal who currently access either brackish or saline water or expensive bottled or sachet water. Additionally, the use of solar technology makes it independent of local electricity supply and its low weight makes it easy to transport using trucks and boats
• Remote data monitoring: SFW’s data monitoring allows SFW to maintain their machines, improve efficiency of technicians, monitor demand and shut-down machines in case of fraud. It has helped SFW create 5 generations of its technology with greater throughput, lower energy consumption and greater flexibility under different conditions
Water contains dirt, fluoride and salts (4 grams/litre); making it difficult to consume and creating a high WTP
for clean drinking water
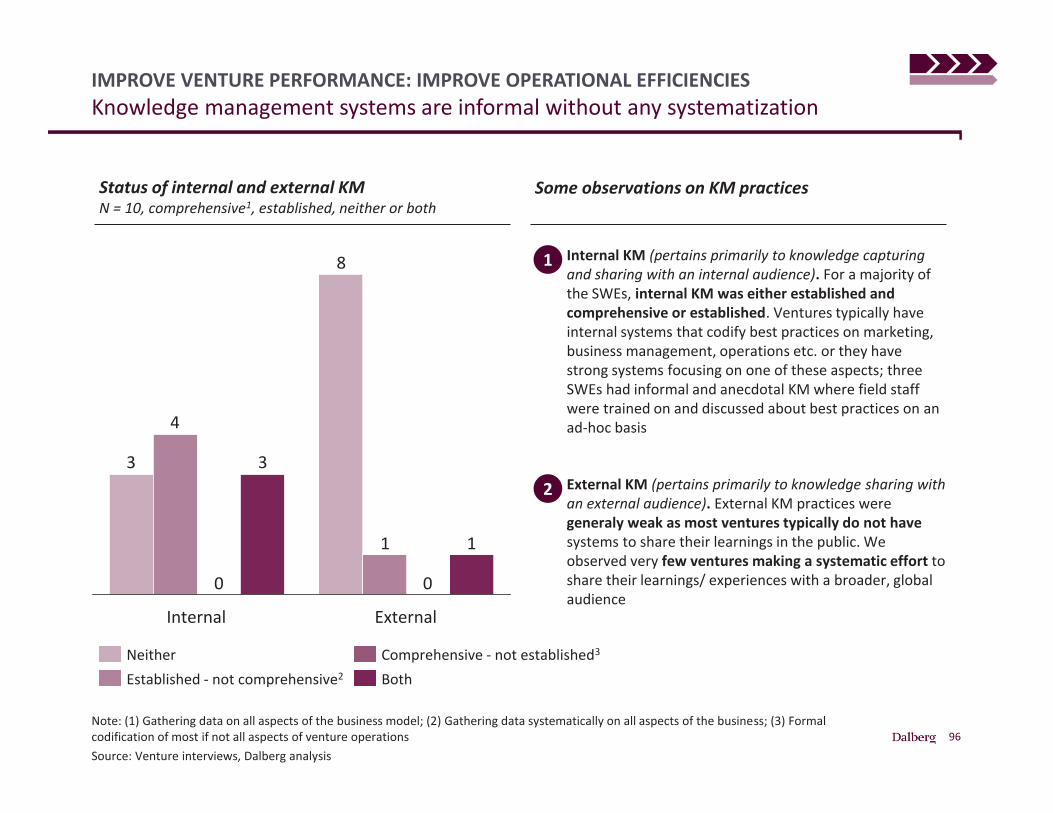
96
IMPROVE VENTURE PERFORMANCE: IMPROVE OPERATIONAL EFFICIENCIESKnowledge management systems are informal without any systematization
Note: (1) Gathering data on all aspects of the business model; (2) Gathering data systematically on all aspects of the business; (3) Formal codification of most if not all aspects of venture operations Source: Venture interviews, Dalberg analysis
8
3
1
4
00
1
3
Internal External
Neither Comprehensive - not established3
Established - not comprehensive2 Both
Status of internal and external KM N = 10, comprehensive1, established, neither or both
Some observations on KM practices
1 Internal KM (pertains primarily to knowledge capturing and sharing with an internal audience). For a majority of the SWEs, internal KM was either established and comprehensive or established. Ventures typically have internal systems that codify best practices on marketing, business management, operations etc. or they have strong systems focusing on one of these aspects; three SWEs had informal and anecdotal KM where field staff were trained on and discussed about best practices on an ad-hoc basis
2 External KM (pertains primarily to knowledge sharing with an external audience). External KM practices were generaly weak as most ventures typically do not have systems to share their learnings in the public. We observed very few ventures making a systematic effort to share their learnings/ experiences with a broader, global audience
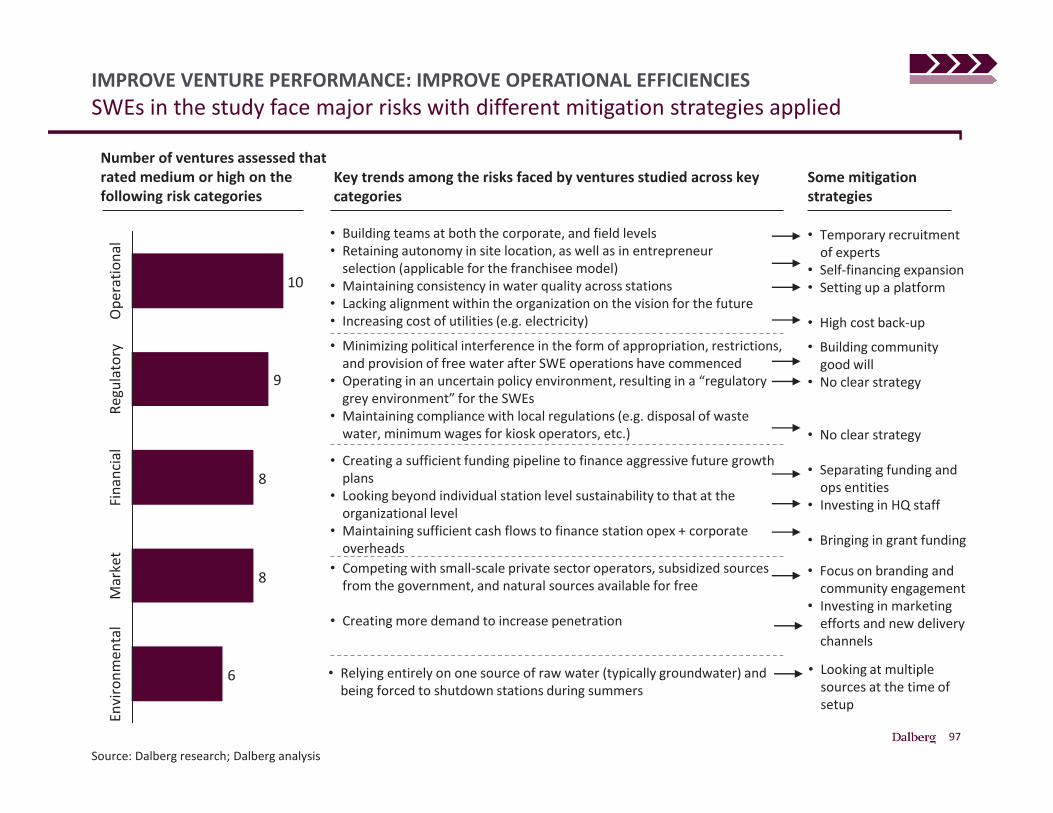
97
IMPROVE VENTURE PERFORMANCE: IMPROVE OPERATIONAL EFFICIENCIESSWEs in the study face major risks with different mitigation strategies applied
Source: Dalberg research; Dalberg analysis
6
8
8
9
10
Ope
ratio
nal
Envi
ronm
enta
lRe
gula
tory
Mar
ket
Fina
ncia
l
Number of ventures assessed that rated medium or high on the following risk categories
Key trends among the risks faced by ventures studied across key categories
• Building teams at both the corporate, and field levels• Retaining autonomy in site location, as well as in entrepreneur
selection (applicable for the franchisee model)• Maintaining consistency in water quality across stations• Lacking alignment within the organization on the vision for the future• Increasing cost of utilities (e.g. electricity)
• Minimizing political interference in the form of appropriation, restrictions, and provision of free water after SWE operations have commenced
• Operating in an uncertain policy environment, resulting in a “regulatory grey environment” for the SWEs
• Maintaining compliance with local regulations (e.g. disposal of waste water, minimum wages for kiosk operators, etc.)
• Creating a sufficient funding pipeline to finance aggressive future growth plans
• Looking beyond individual station level sustainability to that at the organizational level
• Maintaining sufficient cash flows to finance station opex + corporate overheads
• Competing with small-scale private sector operators, subsidized sources from the government, and natural sources available for free
• Creating more demand to increase penetration
• Relying entirely on one source of raw water (typically groundwater) and being forced to shutdown stations during summers
Some mitigation strategies
• Temporary recruitment of experts
• Self-financing expansion• Setting up a platform
• High cost back-up
• Building community good will
• No clear strategy
• No clear strategy
• Separating funding and ops entities
• Investing in HQ staff
• Bringing in grant funding
• Focus on branding and community engagement
• Investing in marketing efforts and new delivery channels
• Looking at multiple sources at the time of setup
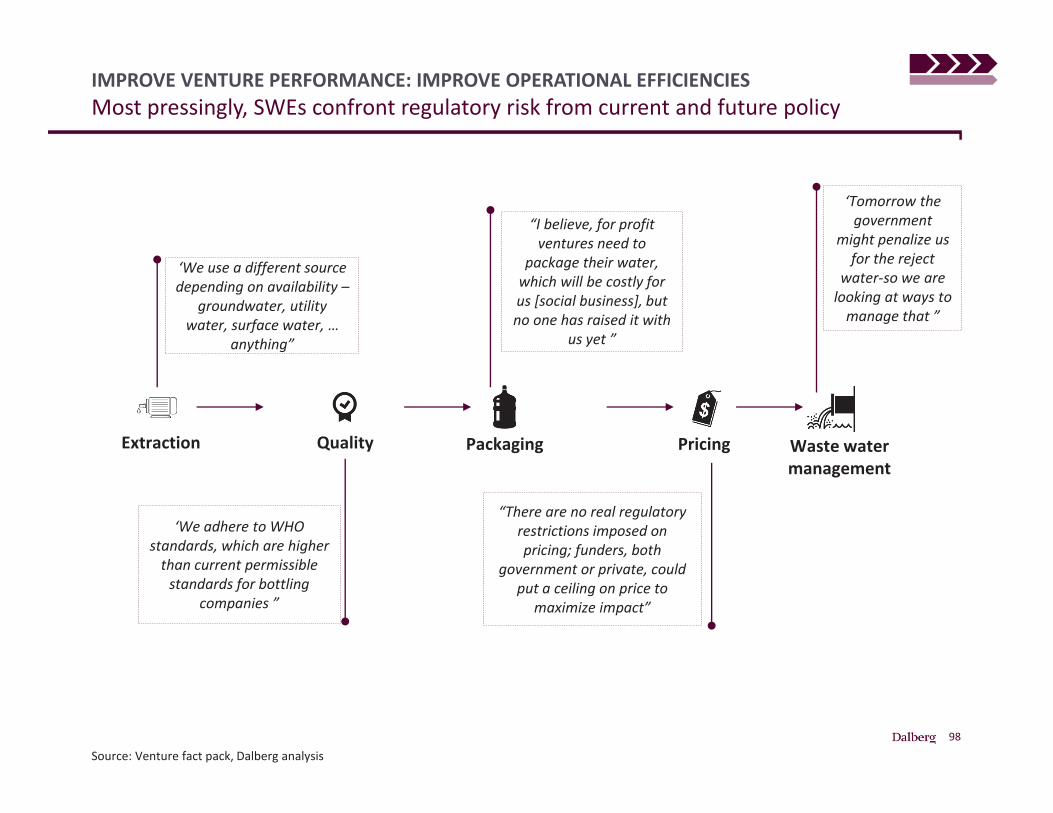
98
IMPROVE VENTURE PERFORMANCE: IMPROVE OPERATIONAL EFFICIENCIESMost pressingly, SWEs confront regulatory risk from current and future policy
Source: Venture fact pack, Dalberg analysis
Extraction Packaging Pricing Waste watermanagement
‘We use a different source depending on availability –
groundwater, utility water, surface water, …
anything”
‘Tomorrow the government
might penalize us for the reject
water-so we are looking at ways to
manage that ”
“I believe, for profit ventures need to
package their water, which will be costly for us [social business], but no one has raised it with
us yet ”
Quality
‘We adhere to WHO standards, which are higher
than current permissible standards for bottling
companies ”
“There are no real regulatory restrictions imposed on pricing; funders, both
government or private, could put a ceiling on price to
maximize impact”
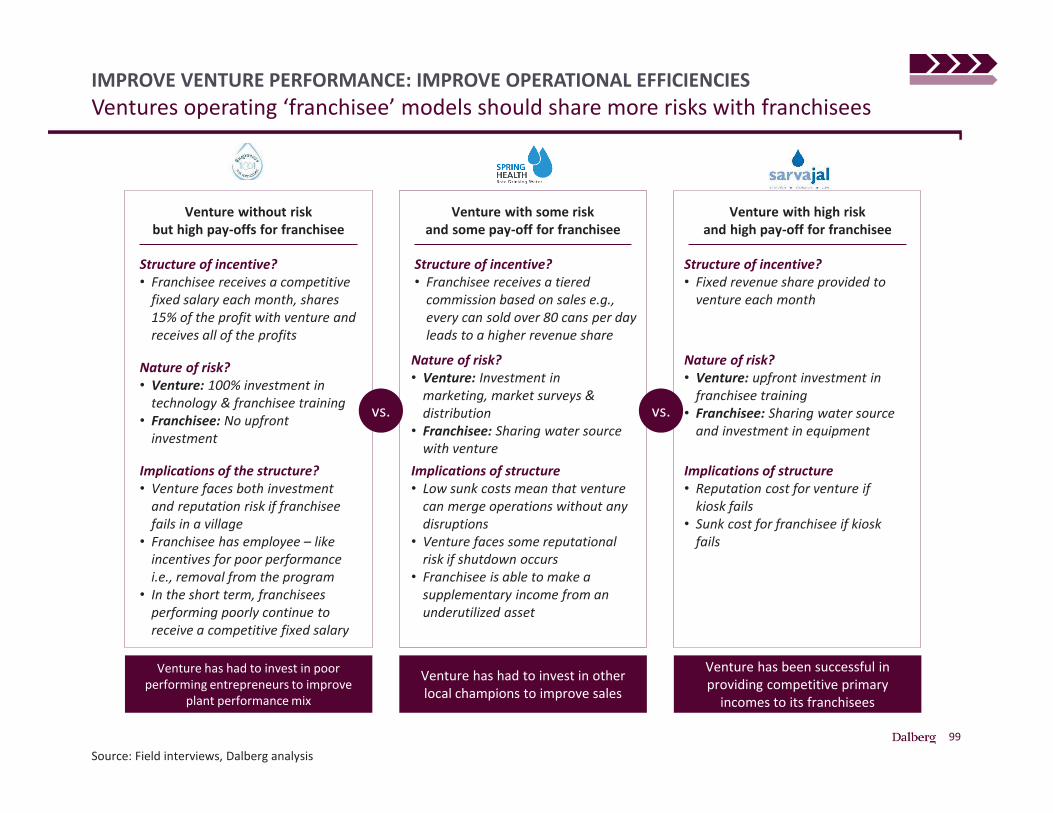
99
IMPROVE VENTURE PERFORMANCE: IMPROVE OPERATIONAL EFFICIENCIESVentures operating ‘franchisee’ models should share more risks with franchisees
Source: Field interviews, Dalberg analysis
Venture without risk but high pay-offs for franchisee
Venture with some risk and some pay-off for franchisee
Venture with high risk and high pay-off for franchisee
Structure of incentive?• Franchisee receives a competitive
fixed salary each month, shares 15% of the profit with venture and receives all of the profits
Structure of incentive?• Franchisee receives a tiered
commission based on sales e.g., every can sold over 80 cans per day leads to a higher revenue share
Structure of incentive?• Fixed revenue share provided to
venture each month
Nature of risk?• Venture: 100% investment in
technology & franchisee training • Franchisee: No upfront
investment
Implications of the structure? • Venture faces both investment
and reputation risk if franchisee fails in a village
• Franchisee has employee – like incentives for poor performance i.e., removal from the program
• In the short term, franchisees performing poorly continue to receive a competitive fixed salary
Implications of structure• Low sunk costs mean that venture
can merge operations without any disruptions
• Venture faces some reputational risk if shutdown occurs
• Franchisee is able to make a supplementary income from an underutilized asset
Nature of risk?• Venture: upfront investment in
franchisee training• Franchisee: Sharing water source
and investment in equipment
Implications of structure• Reputation cost for venture if
kiosk fails • Sunk cost for franchisee if kiosk
fails
vs. vs.
Venture has had to invest in poor performing entrepreneurs to improve
plant performance mix
Venture has had to invest in other local champions to improve sales
Venture has been successful in providing competitive primary
incomes to its franchisees
Nature of risk?• Venture: Investment in
marketing, market surveys & distribution
• Franchisee: Sharing water source with venture
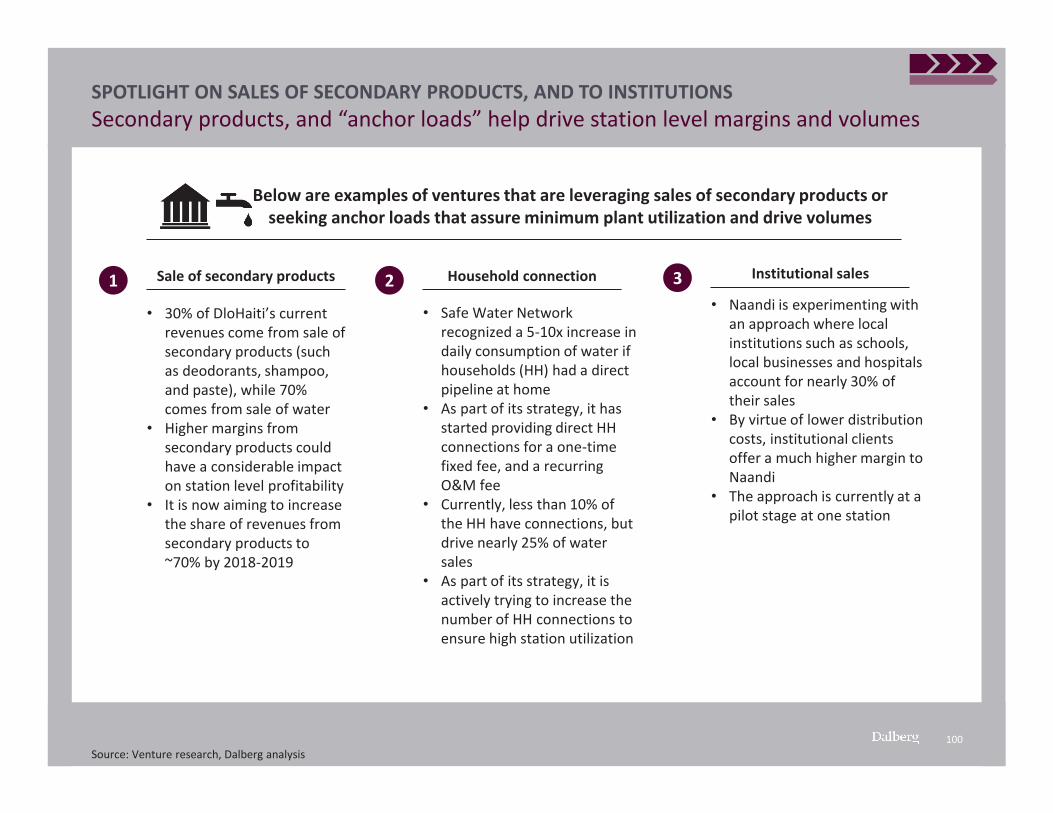
100
SPOTLIGHT ON SALES OF SECONDARY PRODUCTS, AND TO INSTITUTIONSSecondary products, and “anchor loads” help drive station level margins and volumes
Source: Venture research, Dalberg analysis
Below are examples of ventures that are leveraging sales of secondary products or seeking anchor loads that assure minimum plant utilization and drive volumes
1 Sale of secondary products 2 Household connection 3 Institutional sales
• 30% of DloHaiti’s current revenues come from sale of secondary products (such as deodorants, shampoo, and paste), while 70% comes from sale of water
• Higher margins from secondary products could have a considerable impact on station level profitability
• It is now aiming to increase the share of revenues from secondary products to ~70% by 2018-2019
• Safe Water Network recognized a 5-10x increase in daily consumption of water if households (HH) had a direct pipeline at home
• As part of its strategy, it has started providing direct HH connections for a one-time fixed fee, and a recurring O&M fee
• Currently, less than 10% of the HH have connections, but drive nearly 25% of water sales
• As part of its strategy, it is actively trying to increase the number of HH connections to ensure high station utilization
• Naandi is experimenting with an approach where local institutions such as schools, local businesses and hospitals account for nearly 30% of their sales
• By virtue of lower distribution costs, institutional clients offer a much higher margin to Naandi
• The approach is currently at a pilot stage at one station
101
STRENGTHENING THE ECOSYSTEMEcosystem actors have a critical role in helping SWEs achieve their true potential
Governments, bilateral/ multilateral aid agencies, philanthropic foundations, impact investors, the private sector, NGOs, and sector thought leaders can help strengthen the broader eco-system in which SWEs operate through the following potential measures:
• Create a global alliance to support the creation for a market for safe water at the BoP. A global alliance for safe water comprising of the aforementioned sector influencers can help bring global recognition to the potential of SWEs in addressing thesafe water gap, and undertake activities such as mobilizing funding to support SWEs in their market creation efforts, helping SWEs leverage their existing knowledge and experiences and sharing them with the broader sector, and providing Technical Assistance to SWEs on the operational and financial aspects of the safe water business. This will also help align global stakeholders in the safe water space on a common vision for SWEs, and develop a collective theory of change
• Create an open source branding platform that participating ventures could “borrow”, if they play by certain rules and adhere to quality. This platform can help in the long-term “consolidation” of safe water brands available in developing markets, helping SWEs navigate the “brand noise” created due to a surge of small-scale private sector operators, and help customers develop a longer-term association of the brand with quality, which may be a key differentiator for customers in a crowded water market going forward
• Encourage mature SWEs to carve out a platform-as-a-service business model targeted towards local private water providers that presently do not have access to these services. This will allow the more established ventures that have strong capabilities in services such as quality assurance, preventive maintenance, staff training, etc. to leverage this to bolster their own sustainability, and scale their impact. These services have a greater competitive advantage as compared to operating individual kiosks, have a high entry barrier, distinct economies of scale, and potentially higher margins than do water sales. This platform can also be set up as a non-profit ‘backbone’ institution or cooperative - this entity would still charge fees (to make sure clients are serious) but likely would still need a subsidy
• Advocate for SWEs as being complementary to centralized systems, and help develop long-term partnerships with local governments. Multilateral/ bilateral agencies can undertake advocacy efforts to clarify the positioning of SWEs as the last mile access and/ or purification service provider to key government institutions/ decision makers. This will help mitigate the high regulatory risk that SWEs currently operate under. Support from these agencies can entail drafting national policies for SWEs that provide an overall governing framework for SWEs, and supporting the development of a PPP toolkit, and standardized performance based models that encourage long-term partnerships between SWEs and local governments
• Build a aggregator of technology suppliers to help lower capex, and opex for SWEs. Entrepreneurs, foundations, and investors can help identify in-country technology suppliers that cover a broad range of treatment technologies and equipment. A roster of such suppliers, and bulk placement of orders will help SWEs to negotiate on price, lead times, and maintenance support.
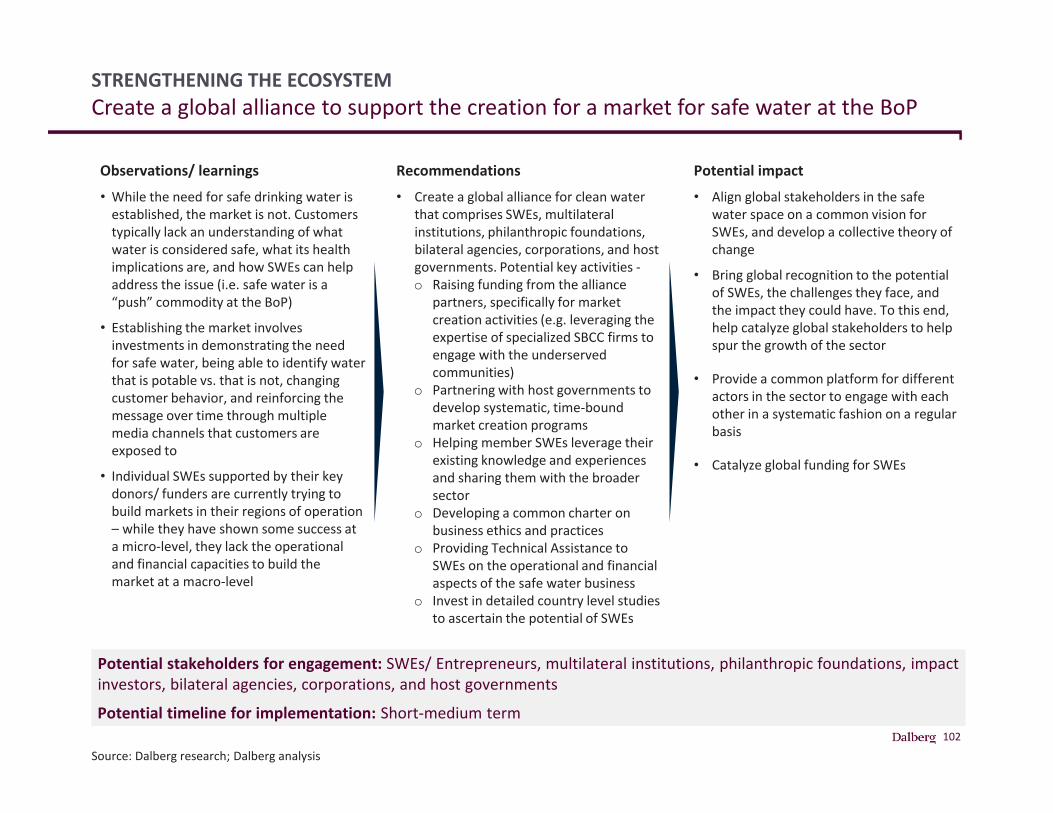
102
STRENGTHENING THE ECOSYSTEMCreate a global alliance to support the creation for a market for safe water at the BoP
Source: Dalberg research; Dalberg analysis
Observations/ learnings• While the need for safe drinking water is
established, the market is not. Customers typically lack an understanding of what water is considered safe, what its health implications are, and how SWEs can help address the issue (i.e. safe water is a “push” commodity at the BoP)
• Establishing the market involves investments in demonstrating the need for safe water, being able to identify water that is potable vs. that is not, changing customer behavior, and reinforcing the message over time through multiple media channels that customers are exposed to
• Individual SWEs supported by their key donors/ funders are currently trying to build markets in their regions of operation – while they have shown some success at a micro-level, they lack the operational and financial capacities to build the market at a macro-level
Recommendations• Create a global alliance for clean water
that comprises SWEs, multilateral institutions, philanthropic foundations, bilateral agencies, corporations, and host governments. Potential key activities -o Raising funding from the alliance
partners, specifically for market creation activities (e.g. leveraging the expertise of specialized SBCC firms to engage with the underserved communities)
o Partnering with host governments to develop systematic, time-bound market creation programs
o Helping member SWEs leverage their existing knowledge and experiences and sharing them with the broader sector
o Developing a common charter on business ethics and practices
o Providing Technical Assistance to SWEs on the operational and financial aspects of the safe water business
o Invest in detailed country level studies to ascertain the potential of SWEs
Potential impact• Align global stakeholders in the safe
water space on a common vision for SWEs, and develop a collective theory of change
• Bring global recognition to the potential of SWEs, the challenges they face, and the impact they could have. To this end, help catalyze global stakeholders to help spur the growth of the sector
• Provide a common platform for different actors in the sector to engage with each other in a systematic fashion on a regular basis
• Catalyze global funding for SWEs
Potential stakeholders for engagement: SWEs/ Entrepreneurs, multilateral institutions, philanthropic foundations, impact investors, bilateral agencies, corporations, and host governments
Potential timeline for implementation: Short-medium term
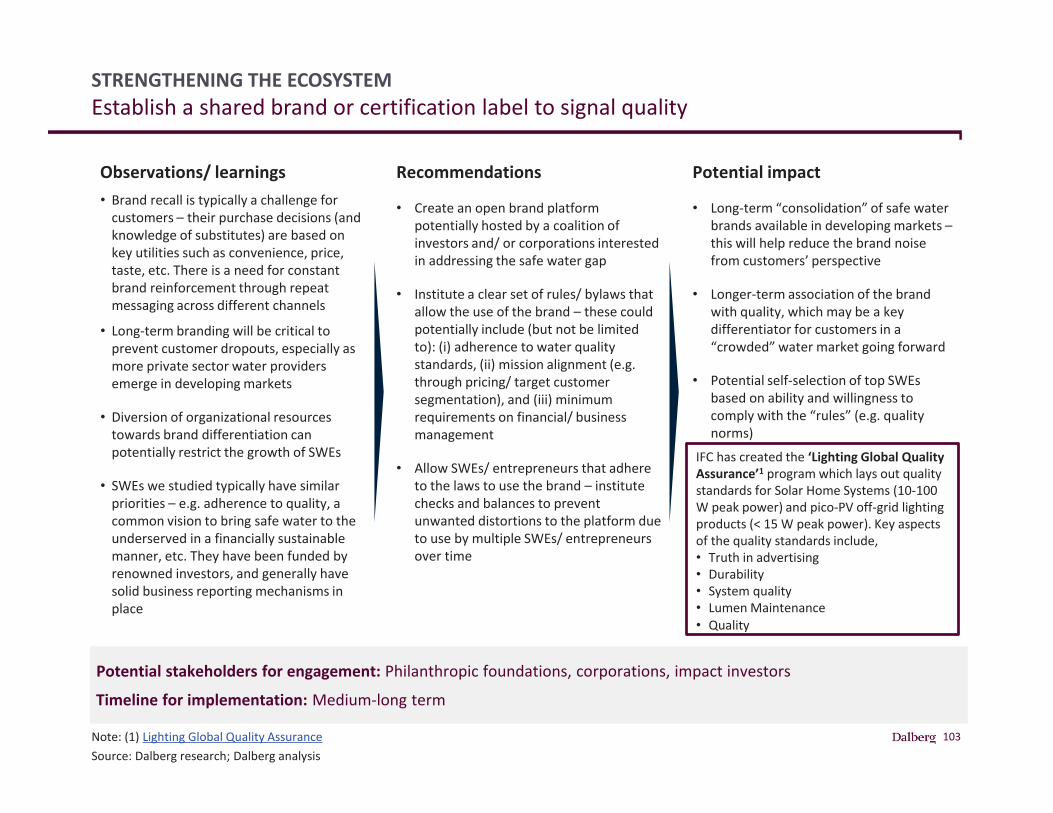
103
STRENGTHENING THE ECOSYSTEMEstablish a shared brand or certification label to signal quality
Note: (1) Lighting Global Quality AssuranceSource: Dalberg research; Dalberg analysis
Observations/ learnings• Brand recall is typically a challenge for
customers – their purchase decisions (and knowledge of substitutes) are based on key utilities such as convenience, price, taste, etc. There is a need for constant brand reinforcement through repeat messaging across different channels
• Long-term branding will be critical to prevent customer dropouts, especially as more private sector water providers emerge in developing markets
• Diversion of organizational resources towards brand differentiation can potentially restrict the growth of SWEs
• SWEs we studied typically have similar priorities – e.g. adherence to quality, a common vision to bring safe water to the underserved in a financially sustainable manner, etc. They have been funded by renowned investors, and generally have solid business reporting mechanisms in place
Recommendations
• Create an open brand platform potentially hosted by a coalition of investors and/ or corporations interested in addressing the safe water gap
• Institute a clear set of rules/ bylaws that allow the use of the brand – these could potentially include (but not be limited to): (i) adherence to water quality standards, (ii) mission alignment (e.g. through pricing/ target customer segmentation), and (iii) minimum requirements on financial/ business management
• Allow SWEs/ entrepreneurs that adhere to the laws to use the brand – institute checks and balances to prevent unwanted distortions to the platform due to use by multiple SWEs/ entrepreneurs over time
Potential stakeholders for engagement: Philanthropic foundations, corporations, impact investors
Timeline for implementation: Medium-long term
Potential impact
• Long-term “consolidation” of safe water brands available in developing markets –this will help reduce the brand noise from customers’ perspective
• Longer-term association of the brand with quality, which may be a key differentiator for customers in a “crowded” water market going forward
• Potential self-selection of top SWEs based on ability and willingness to comply with the “rules” (e.g. quality norms)
IFC has created the ‘Lighting Global Quality Assurance’1 program which lays out quality standards for Solar Home Systems (10-100 W peak power) and pico-PV off-grid lighting products (< 15 W peak power). Key aspects of the quality standards include, • Truth in advertising • Durability • System quality • Lumen Maintenance • Quality
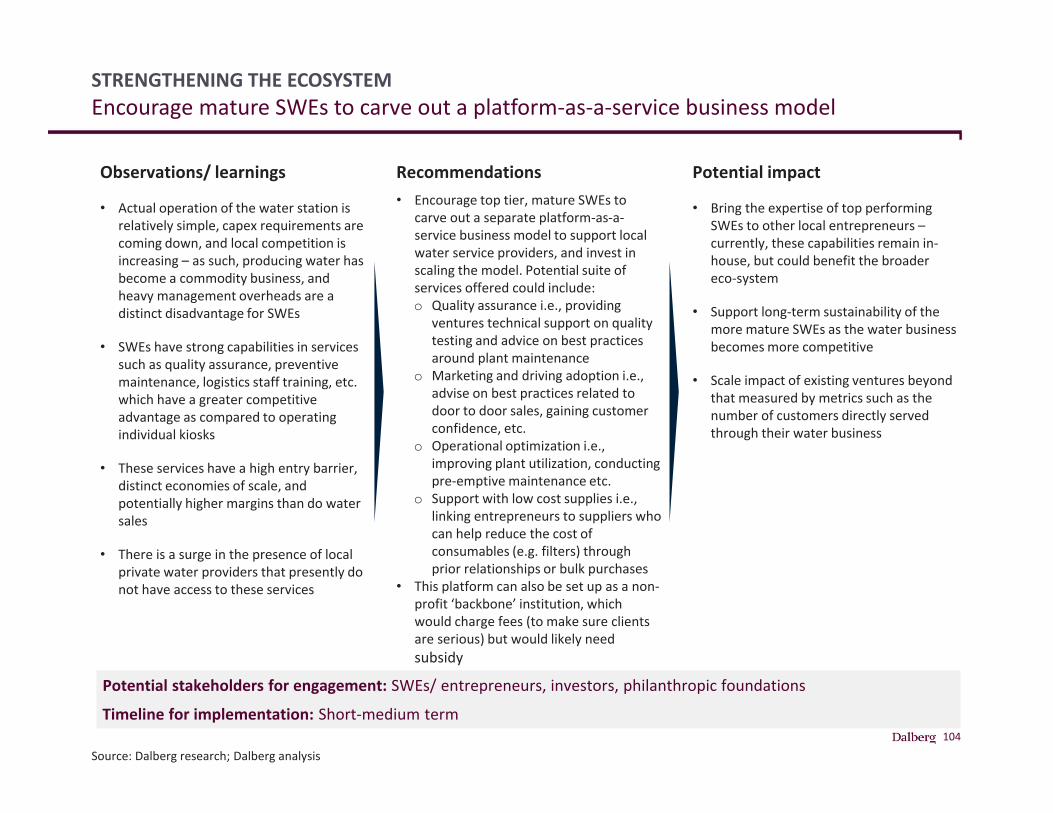
104
STRENGTHENING THE ECOSYSTEMEncourage mature SWEs to carve out a platform-as-a-service business model
Source: Dalberg research; Dalberg analysis
Observations/ learnings
• Actual operation of the water station is relatively simple, capex requirements are coming down, and local competition is increasing – as such, producing water has become a commodity business, and heavy management overheads are a distinct disadvantage for SWEs
• SWEs have strong capabilities in services such as quality assurance, preventive maintenance, logistics staff training, etc. which have a greater competitive advantage as compared to operating individual kiosks
• These services have a high entry barrier, distinct economies of scale, and potentially higher margins than do water sales
• There is a surge in the presence of local private water providers that presently do not have access to these services
Recommendations• Encourage top tier, mature SWEs to
carve out a separate platform-as-a-service business model to support local water service providers, and invest in scaling the model. Potential suite of services offered could include:o Quality assurance i.e., providing
ventures technical support on quality testing and advice on best practices around plant maintenance
o Marketing and driving adoption i.e., advise on best practices related to door to door sales, gaining customer confidence, etc.
o Operational optimization i.e., improving plant utilization, conducting pre-emptive maintenance etc.
o Support with low cost supplies i.e., linking entrepreneurs to suppliers who can help reduce the cost of consumables (e.g. filters) through prior relationships or bulk purchases
• This platform can also be set up as a non-profit ‘backbone’ institution, which would charge fees (to make sure clients are serious) but would likely need subsidy
Potential stakeholders for engagement: SWEs/ entrepreneurs, investors, philanthropic foundations
Timeline for implementation: Short-medium term
Potential impact
• Bring the expertise of top performing SWEs to other local entrepreneurs –currently, these capabilities remain in-house, but could benefit the broader eco-system
• Support long-term sustainability of the more mature SWEs as the water business becomes more competitive
• Scale impact of existing ventures beyond that measured by metrics such as the number of customers directly served through their water business
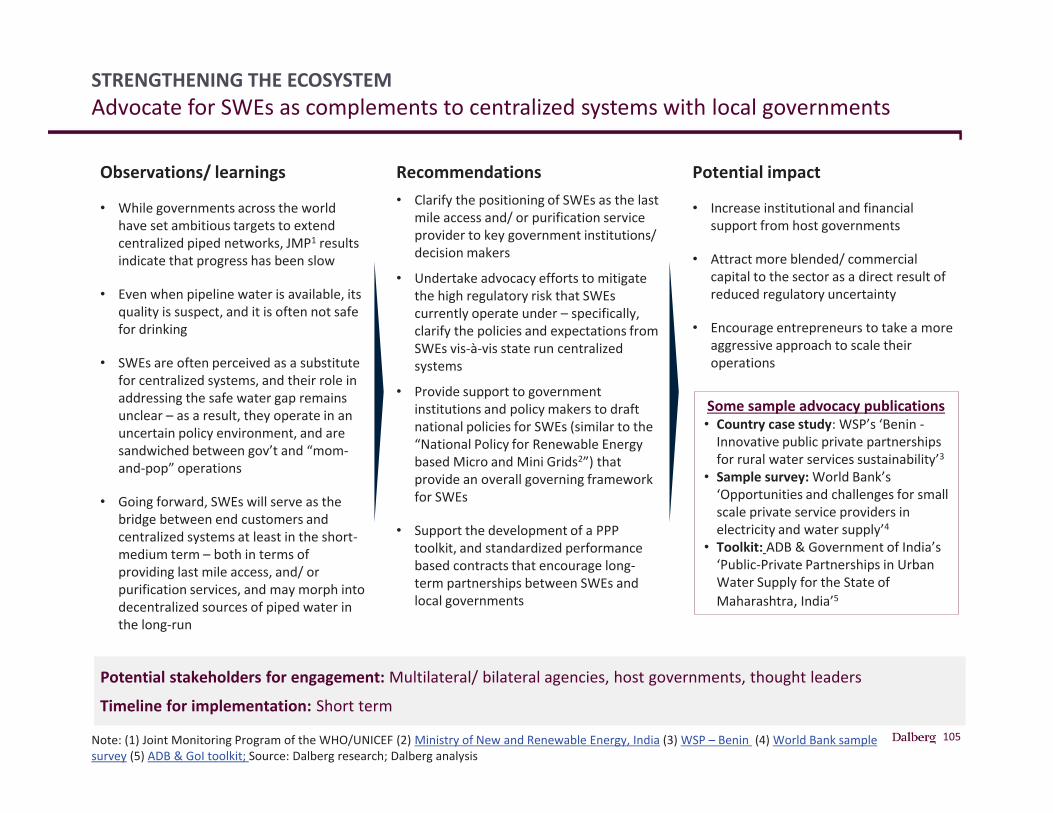
105
STRENGTHENING THE ECOSYSTEMAdvocate for SWEs as complements to centralized systems with local governments
Note: (1) Joint Monitoring Program of the WHO/UNICEF (2) Ministry of New and Renewable Energy, India (3) WSP – Benin (4) World Bank sample survey (5) ADB & GoI toolkit; Source: Dalberg research; Dalberg analysis
Observations/ learnings
• While governments across the world have set ambitious targets to extend centralized piped networks, JMP1 results indicate that progress has been slow
• Even when pipeline water is available, its quality is suspect, and it is often not safe for drinking
• SWEs are often perceived as a substitute for centralized systems, and their role in addressing the safe water gap remains unclear – as a result, they operate in an uncertain policy environment, and are sandwiched between gov’t and “mom-and-pop” operations
• Going forward, SWEs will serve as the bridge between end customers and centralized systems at least in the short-medium term – both in terms of providing last mile access, and/ or purification services, and may morph into decentralized sources of piped water in the long-run
Recommendations• Clarify the positioning of SWEs as the last
mile access and/ or purification service provider to key government institutions/ decision makers
• Undertake advocacy efforts to mitigate the high regulatory risk that SWEs currently operate under – specifically, clarify the policies and expectations from SWEs vis-à-vis state run centralized systems
• Provide support to government institutions and policy makers to draft national policies for SWEs (similar to the “National Policy for Renewable Energy based Micro and Mini Grids2”) that provide an overall governing framework for SWEs
• Support the development of a PPP toolkit, and standardized performance based contracts that encourage long-term partnerships between SWEs and local governments
Potential stakeholders for engagement: Multilateral/ bilateral agencies, host governments, thought leaders
Timeline for implementation: Short term
Potential impact
• Increase institutional and financial support from host governments
• Attract more blended/ commercial capital to the sector as a direct result of reduced regulatory uncertainty
• Encourage entrepreneurs to take a more aggressive approach to scale their operations
Some sample advocacy publications • Country case study: WSP’s ‘Benin -
Innovative public private partnerships for rural water services sustainability’3
• Sample survey: World Bank’s ‘Opportunities and challenges for small scale private service providers in electricity and water supply’4
• Toolkit: ADB & Government of India’s ‘Public-Private Partnerships in Urban Water Supply for the State of Maharashtra, India’5
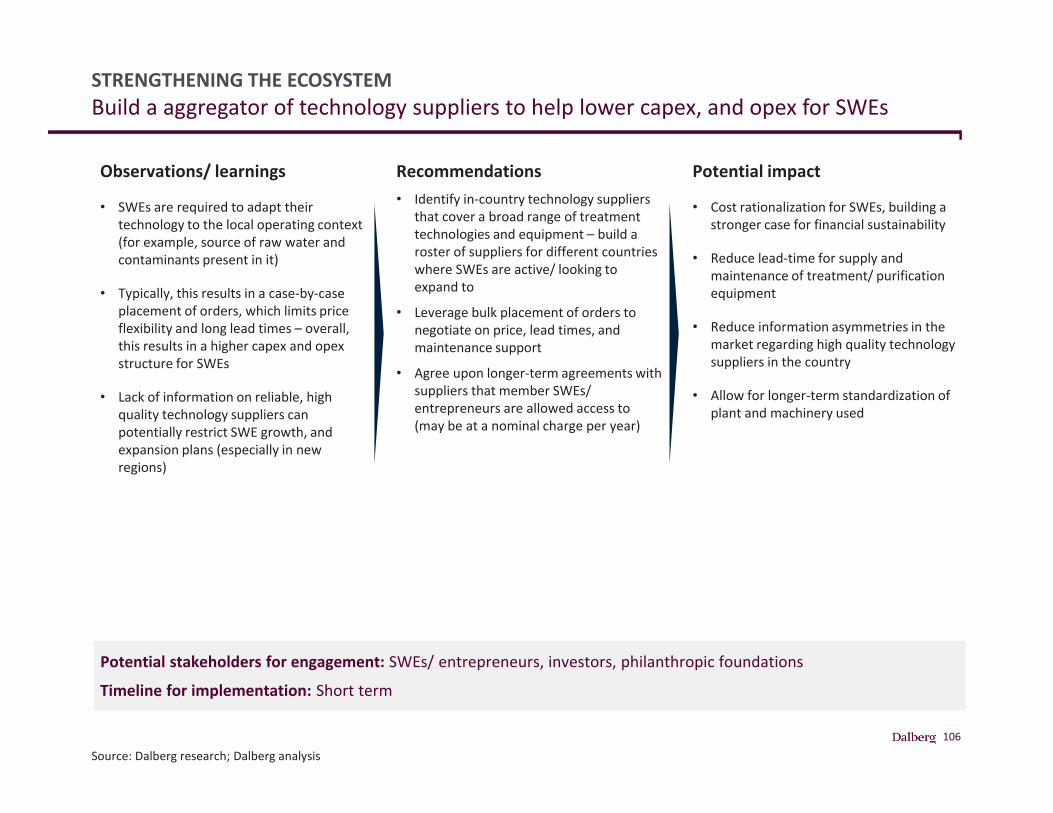
106
STRENGTHENING THE ECOSYSTEMBuild a aggregator of technology suppliers to help lower capex, and opex for SWEs
Source: Dalberg research; Dalberg analysis
Observations/ learnings
• SWEs are required to adapt their technology to the local operating context (for example, source of raw water and contaminants present in it)
• Typically, this results in a case-by-case placement of orders, which limits price flexibility and long lead times – overall, this results in a higher capex and opex structure for SWEs
• Lack of information on reliable, high quality technology suppliers can potentially restrict SWE growth, and expansion plans (especially in new regions)
Recommendations• Identify in-country technology suppliers
that cover a broad range of treatment technologies and equipment – build a roster of suppliers for different countries where SWEs are active/ looking to expand to
• Leverage bulk placement of orders to negotiate on price, lead times, and maintenance support
• Agree upon longer-term agreements with suppliers that member SWEs/ entrepreneurs are allowed access to (may be at a nominal charge per year)
Potential stakeholders for engagement: SWEs/ entrepreneurs, investors, philanthropic foundations
Timeline for implementation: Short term
Potential impact
• Cost rationalization for SWEs, building a stronger case for financial sustainability
• Reduce lead-time for supply and maintenance of treatment/ purification equipment
• Reduce information asymmetries in the market regarding high quality technology suppliers in the country
• Allow for longer-term standardization of plant and machinery used
107
Annex
108
THE SAFE WATER GAPWe used IHME data to estimate the number of people lacking access to “safe” water
• The estimate was calculated using data provided by Institute for Health Metrics and Evaluation which estimated these values to understand the risk exposure in each country to unsafe water. The data main sources used to compile a global database include the DHS (USAID) and MICS (UNICEF). More information on the methodology and assumptions can be found in the supplementary appendix of well-known paper on global risk exposure levels published in the Lancet.
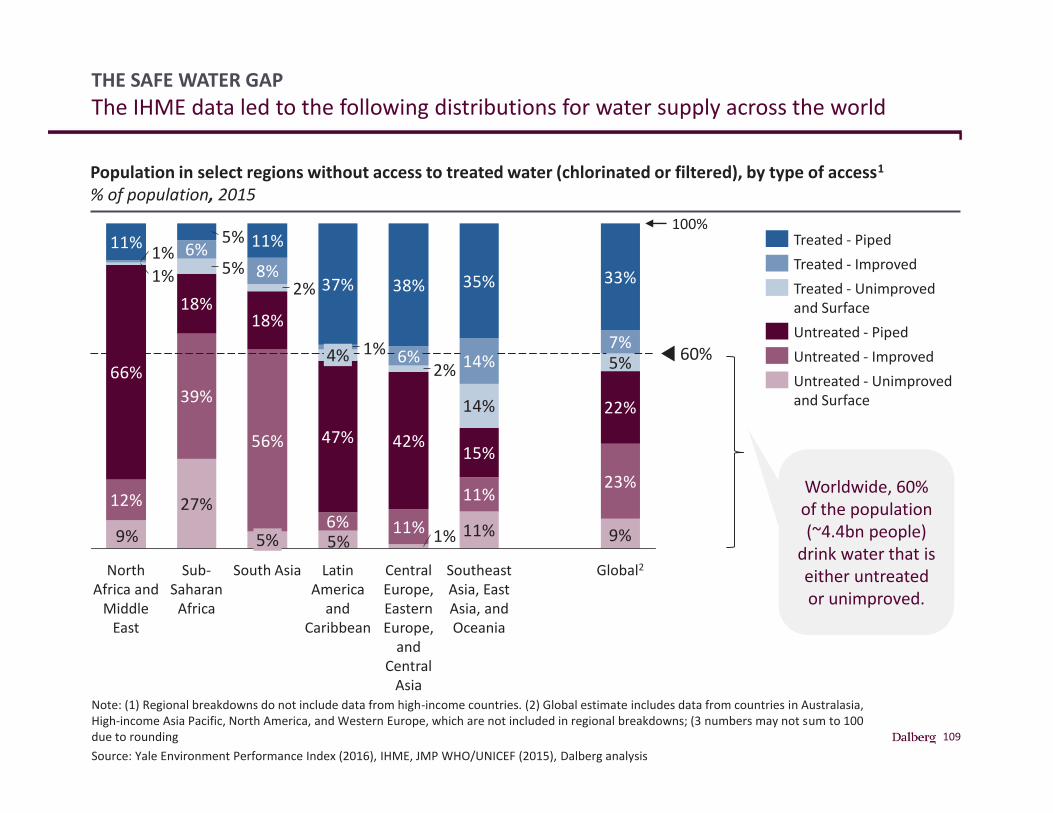
109
27%11%
56%
6% 11%
11%
18%18%
47% 42% 15%
14%
5%
37% 38% 35% 33%
9%5%9% 1%
39%
23%12%
22%
66% 2%
2%5%1%
14%
8%
1% 6%
6%1%
7%
5% 11%11%
South Asia
5%
4%
North Africa and
Middle East
Sub-Saharan
Africa
60%
Global2
100%
Southeast Asia, East Asia, and Oceania
Central Europe, Eastern Europe,
and Central
Asia
Latin America
and Caribbean
THE SAFE WATER GAPThe IHME data led to the following distributions for water supply across the world
Note: (1) Regional breakdowns do not include data from high-income countries. (2) Global estimate includes data from countries in Australasia, High-income Asia Pacific, North America, and Western Europe, which are not included in regional breakdowns; (3 numbers may not sum to 100 due to roundingSource: Yale Environment Performance Index (2016), IHME, JMP WHO/UNICEF (2015), Dalberg analysis
Treated - Unimproved and Surface
Untreated - ImprovedUntreated - Piped
Treated - PipedTreated - Improved
Untreated - Unimproved and Surface
Population in select regions without access to treated water (chlorinated or filtered), by type of access1
% of population, 2015
Worldwide, 60% of the population (~4.4bn people)
drink water that is either untreated or unimproved.
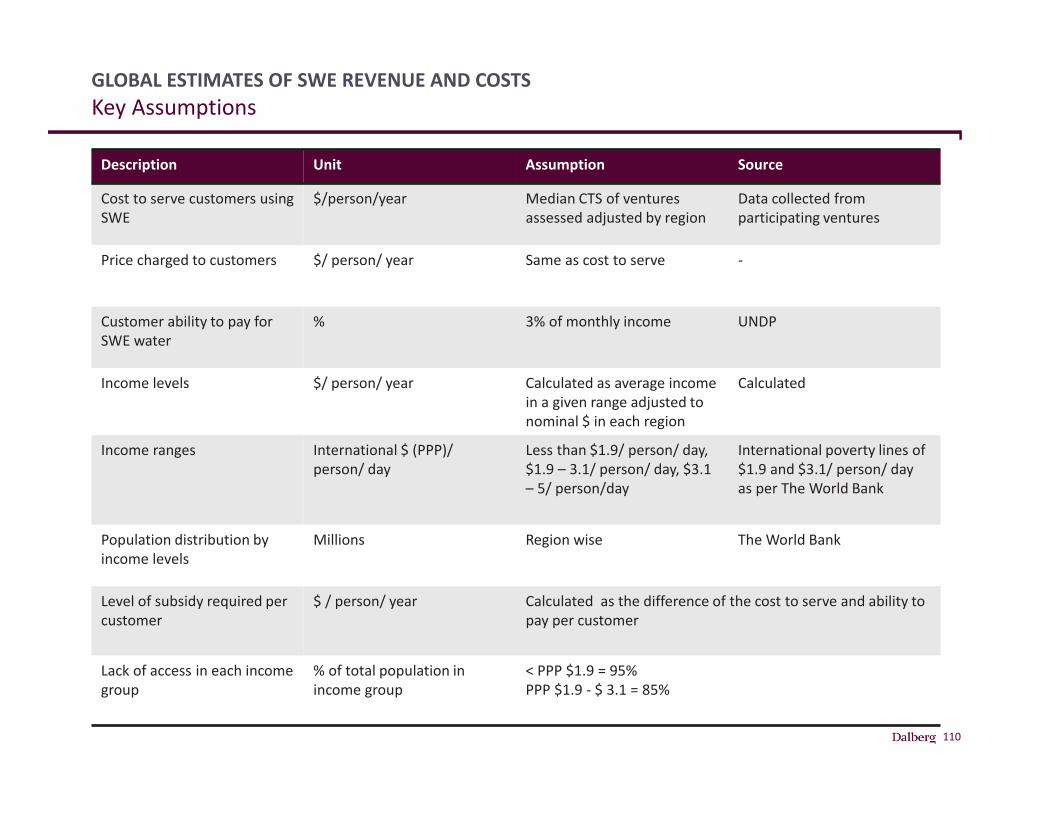
110
GLOBAL ESTIMATES OF SWE REVENUE AND COSTSKey Assumptions
Description Unit Assumption Source
Cost to serve customers using SWE
$/person/year Median CTS of ventures assessed adjusted by region
Data collected from participating ventures
Price charged to customers $/ person/ year Same as cost to serve -
Customer ability to pay forSWE water
% 3% of monthly income UNDP
Income levels $/ person/ year Calculated as average income in a given range adjusted to nominal $ in each region
Calculated
Income ranges International $ (PPP)/ person/ day
Less than $1.9/ person/ day, $1.9 – 3.1/ person/ day, $3.1 – 5/ person/day
International poverty lines of $1.9 and $3.1/ person/ day as per The World Bank
Population distribution by income levels
Millions Region wise The World Bank
Level of subsidy required per customer
$ / person/ year Calculated as the difference of the cost to serve and ability to pay per customer
Lack of access in each income group
% of total population in income group
< PPP $1.9 = 95%PPP $1.9 - $ 3.1 = 85%
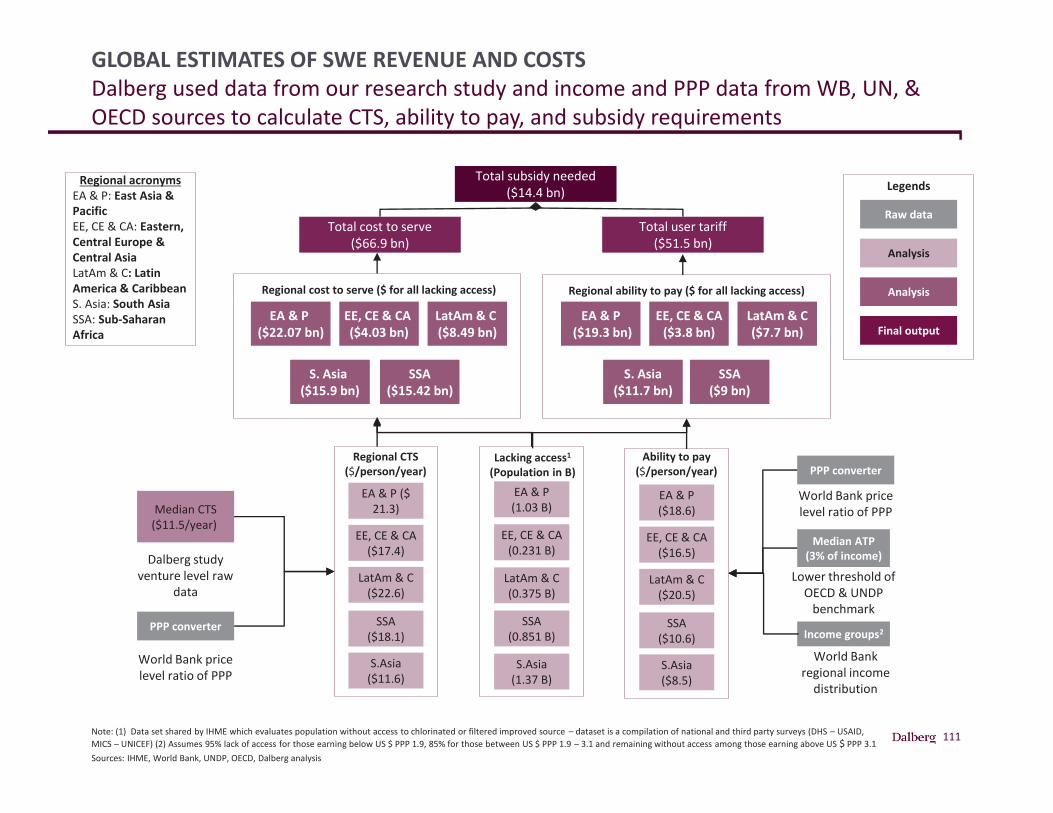
111
GLOBAL ESTIMATES OF SWE REVENUE AND COSTSDalberg used data from our research study and income and PPP data from WB, UN, & OECD sources to calculate CTS, ability to pay, and subsidy requirements
Note: (1) Data set shared by IHME which evaluates population without access to chlorinated or filtered improved source – dataset is a compilation of national and third party surveys (DHS – USAID, MICS – UNICEF) (2) Assumes 95% lack of access for those earning below US $ PPP 1.9, 85% for those between US $ PPP 1.9 – 3.1 and remaining without access among those earning above US $ PPP 3.1Sources: IHME, World Bank, UNDP, OECD, Dalberg analysis
Total subsidy needed ($14.4 bn)
Total user tariff ($51.5 bn)
Total cost to serve ($66.9 bn)
EA & P ($22.07 bn)
EE, CE & CA ($4.03 bn)
LatAm & C ($8.49 bn)
S. Asia ($15.9 bn)
SSA($15.42 bn)
EA & P($19.3 bn)
EE, CE & CA($3.8 bn)
LatAm & C($7.7 bn)
S. Asia($11.7 bn)
SSA($9 bn)
EA & P (1.03 B)Median CTS
($11.5/year)
Dalberg study venture level raw
data
EA & P ($ 21.3)
EE, CE & CA($17.4)
LatAm & C($22.6)
SSA($18.1)
S.Asia($11.6)
EE, CE & CA(0.231 B)
LatAm & C(0.375 B)
SSA(0.851 B)
S.Asia(1.37 B)
EA & P ($18.6)
EE, CE & CA($16.5)
LatAm & C($20.5)
SSA($10.6)
S.Asia($8.5)
Median ATP(3% of income)
PPP converter
World Bank price level ratio of PPP
Income groups2
World Bank regional income
distribution
Lacking access1
(Population in B)Regional CTS
($/person/year)Ability to pay
($/person/year)
Lower threshold of OECD & UNDP
benchmark
Regional cost to serve ($ for all lacking access) Regional ability to pay ($ for all lacking access)
PPP converter
World Bank price level ratio of PPP
Regional acronymsEA & P: East Asia & PacificEE, CE & CA: Eastern, Central Europe & Central AsiaLatAm & C: Latin America & CaribbeanS. Asia: South AsiaSSA: Sub-Saharan Africa
Legends
Raw data
Analysis
Analysis
Final output
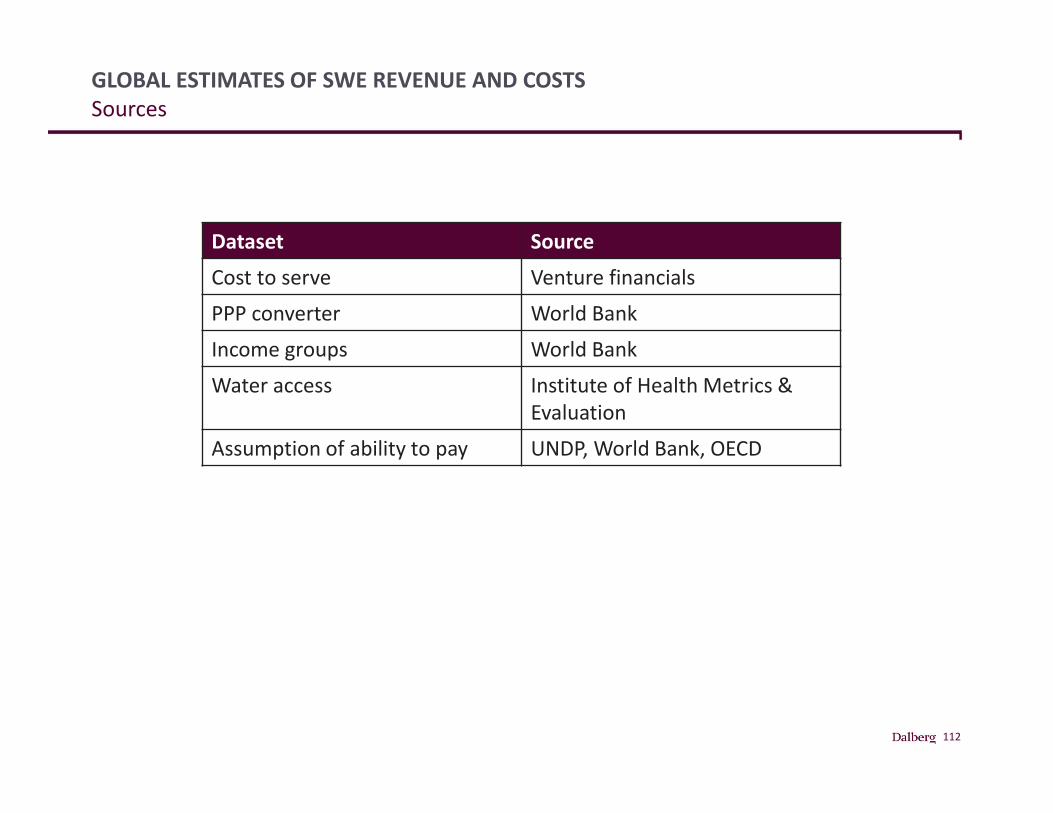
112
GLOBAL ESTIMATES OF SWE REVENUE AND COSTSSources
Dataset SourceCost to serve Venture financialsPPP converter World Bank Income groups World BankWater access Institute of Health Metrics &
EvaluationAssumption of ability to pay UNDP, World Bank, OECD