Embed Size (px)
Citation preview
8THE UNIVERSITY OF THE STATE OF NEW YORK
GRADE 8INTERMEDIATE-LEVEL TEST
SCIENCE
WRITTEN TESTJUNE 2002
Name
School
The questions on this test measure your knowledge and understanding of science. The test has two parts. Both parts are contained in this test booklet.
Part I consists of 45 multiple-choice questions. Record your answers to these ques-tions on the separate answer sheet. Use only a No. 2 pencil on your answer sheet.
Part II consists of 25 open-ended questions. Write your answers to Part II in thespace provided in this test booklet.
You may use a calculator to answer the questions on the test if you wish.
You will have two hours to answer the questions on this test.
DO NOT OPEN THIS TEST BOOKLET UNTIL YOU ARE TOLD TO DO SO.
THE UNIVERSITY OF THE STATE OF NEW YORKTHE STATE EDUCATION DEPARTMENT
ALBANY, NEW YORK 12234

Inter.-Level Science — June ’02 [3] [OVER]
Part I
DIRECTIONS
There are 45 questions on Part I of the test. Each question is followed by four choices,numbered 1 through 4. Read each question carefully. Decide which choice is the correctanswer. On the separate answer sheet, mark your answer in the row of circles for eachquestion by filling in the circle that has the same number as the answer you have cho-sen.
Read the sample question below:
Sample Question
Earth gets most of its light from
(1) the stars(2) the Sun(3) the Moon(4) other planets
The correct answer is the Sun, which is choice number 2. On your answer sheet, lookat the box showing the row of answer circles for the sample question. Since choice num-ber 2 is the correct answer for the sample question, the circle with the number 2 hasbeen filled in.
Answer all of the questions in Part I in the same way. Mark only one answer for eachquestion. If you want to change an answer, be sure to erase your first mark completely.Then mark the answer you want.
You will not need scrap paper. You may use the pages of this test booklet to work outyour answers to the questions.
You may use a calculator if needed.
When you are told to start working, turn the page and begin with question 1. Work care-fully and answer all of the questions in Part I.
When you have finished Part I, go right on to Part II.
Inter.-Level Science — June ’02 [4]
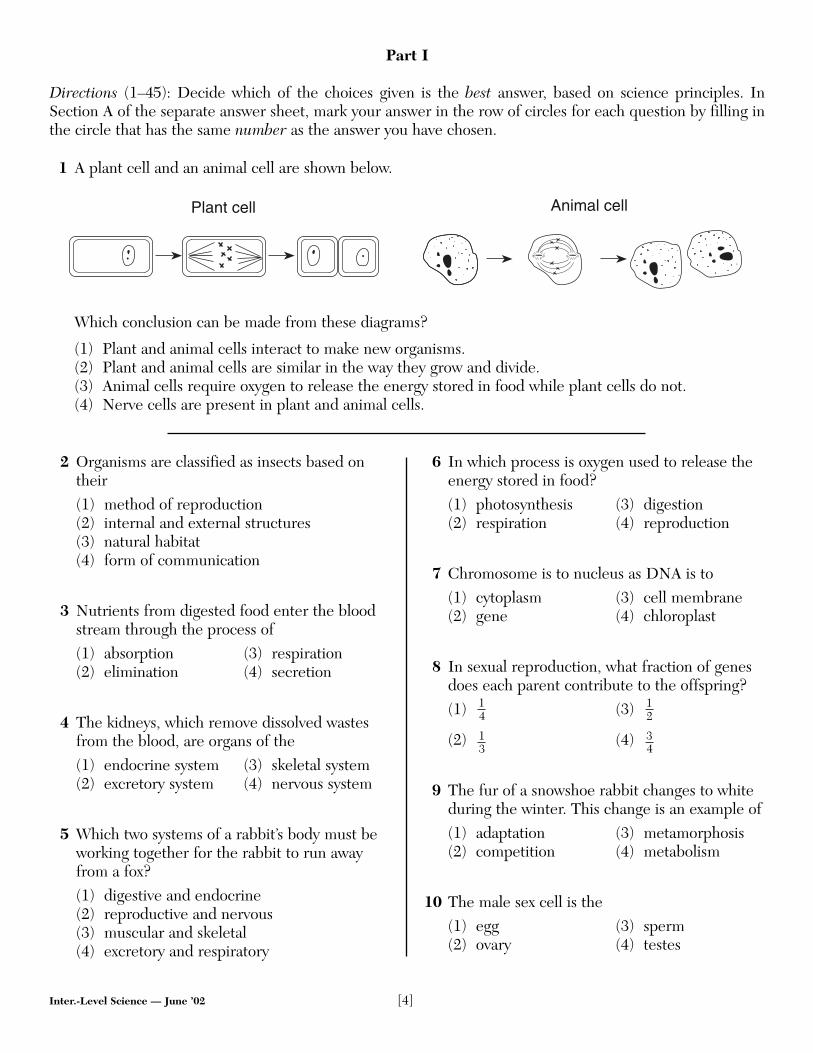
1 A plant cell and an animal cell are shown below.
Which conclusion can be made from these diagrams?
(1) Plant and animal cells interact to make new organisms.(2) Plant and animal cells are similar in the way they grow and divide.(3) Animal cells require oxygen to release the energy stored in food while plant cells do not.(4) Nerve cells are present in plant and animal cells.
Plant cell Animal cell
Part I
Directions (1–45): Decide which of the choices given is the best answer, based on science principles. InSection A of the separate answer sheet, mark your answer in the row of circles for each question by filling inthe circle that has the same number as the answer you have chosen.
2 Organisms are classified as insects based ontheir(1) method of reproduction(2) internal and external structures(3) natural habitat(4) form of communication
3 Nutrients from digested food enter the bloodstream through the process of(1) absorption (3) respiration(2) elimination (4) secretion
4 The kidneys, which remove dissolved wastesfrom the blood, are organs of the(1) endocrine system (3) skeletal system(2) excretory system (4) nervous system
5 Which two systems of a rabbit’s body must beworking together for the rabbit to run awayfrom a fox? (1) digestive and endocrine(2) reproductive and nervous(3) muscular and skeletal(4) excretory and respiratory
6 In which process is oxygen used to release theenergy stored in food?(1) photosynthesis (3) digestion(2) respiration (4) reproduction
7 Chromosome is to nucleus as DNA is to(1) cytoplasm (3) cell membrane(2) gene (4) chloroplast
8 In sexual reproduction, what fraction of genesdoes each parent contribute to the offspring?(1) (3)
(2) (4)
9 The fur of a snowshoe rabbit changes to whiteduring the winter. This change is an example of(1) adaptation (3) metamorphosis(2) competition (4) metabolism
10 The male sex cell is the(1) egg (3) sperm(2) ovary (4) testes
34
13
12
14
Inter.-Level Science — June ’02 [5] [OVER]
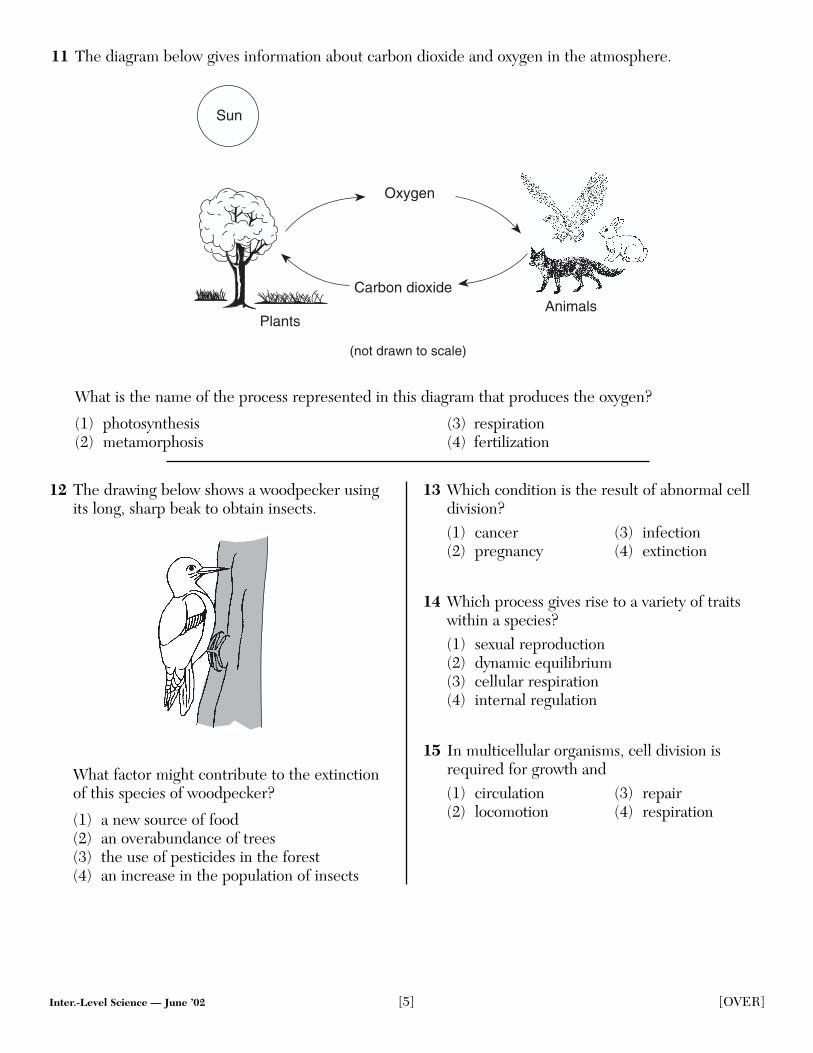
12 The drawing below shows a woodpecker usingits long, sharp beak to obtain insects.
What factor might contribute to the extinctionof this species of woodpecker?
(1) a new source of food(2) an overabundance of trees(3) the use of pesticides in the forest(4) an increase in the population of insects
13 Which condition is the result of abnormal celldivision?(1) cancer (3) infection(2) pregnancy (4) extinction
14 Which process gives rise to a variety of traitswithin a species?(1) sexual reproduction(2) dynamic equilibrium(3) cellular respiration(4) internal regulation
15 In multicellular organisms, cell division isrequired for growth and(1) circulation (3) repair(2) locomotion (4) respiration
11 The diagram below gives information about carbon dioxide and oxygen in the atmosphere.
What is the name of the process represented in this diagram that produces the oxygen?
(1) photosynthesis (3) respiration(2) metamorphosis (4) fertilization
Oxygen
Carbon dioxideAnimals
Plants
Sun
(not drawn to scale)
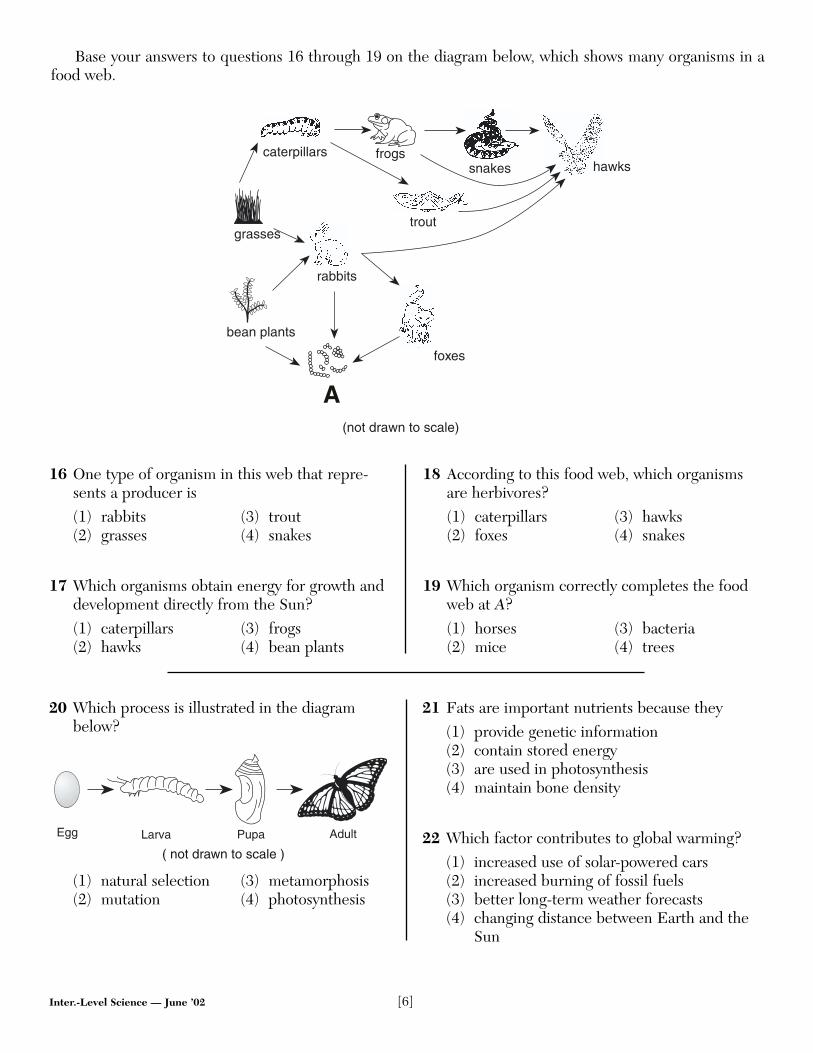
16 One type of organism in this web that repre-sents a producer is(1) rabbits (3) trout(2) grasses (4) snakes
17 Which organisms obtain energy for growth anddevelopment directly from the Sun?(1) caterpillars (3) frogs(2) hawks (4) bean plants
18 According to this food web, which organismsare herbivores?(1) caterpillars (3) hawks(2) foxes (4) snakes
19 Which organism correctly completes the foodweb at A?(1) horses (3) bacteria(2) mice (4) trees
Inter.-Level Science — June ’02 [6]
Base your answers to questions 16 through 19 on the diagram below, which shows many organisms in afood web.
caterpillars frogssnakes
trout
rabbits
bean plants
grasses
foxes
hawks
(not drawn to scale)
A
20 Which process is illustrated in the diagrambelow?
(1) natural selection (3) metamorphosis(2) mutation (4) photosynthesis
21 Fats are important nutrients because they(1) provide genetic information(2) contain stored energy(3) are used in photosynthesis(4) maintain bone density
22 Which factor contributes to global warming?(1) increased use of solar-powered cars(2) increased burning of fossil fuels(3) better long-term weather forecasts(4) changing distance between Earth and the
Sun
Egg Larva Pupa Adult
( not drawn to scale )
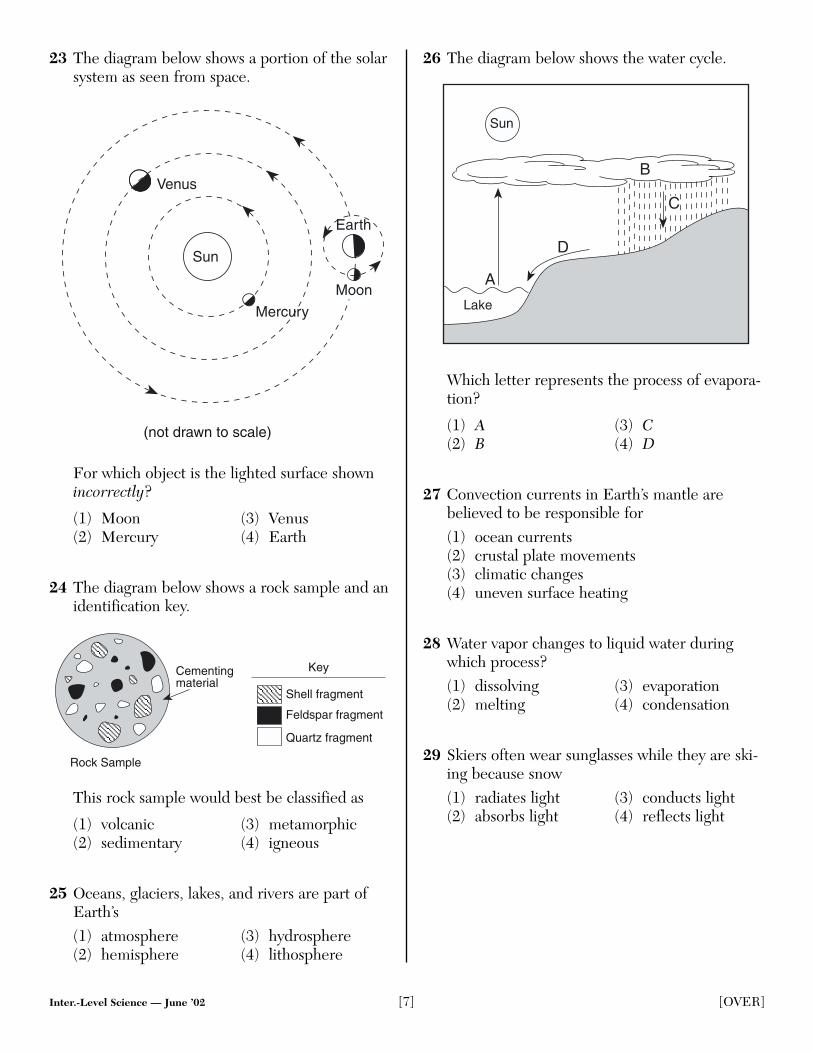
23 The diagram below shows a portion of the solarsystem as seen from space.
For which object is the lighted surface shownincorrectly?
(1) Moon (3) Venus(2) Mercury (4) Earth
24 The diagram below shows a rock sample and anidentification key.
This rock sample would best be classified as
(1) volcanic (3) metamorphic(2) sedimentary (4) igneous
25 Oceans, glaciers, lakes, and rivers are part ofEarth’s(1) atmosphere (3) hydrosphere(2) hemisphere (4) lithosphere
26 The diagram below shows the water cycle.
Which letter represents the process of evapora-tion?
(1) A (3) C(2) B (4) D
27 Convection currents in Earth’s mantle arebelieved to be responsible for(1) ocean currents(2) crustal plate movements(3) climatic changes(4) uneven surface heating
28 Water vapor changes to liquid water duringwhich process?(1) dissolving (3) evaporation(2) melting (4) condensation
29 Skiers often wear sunglasses while they are ski-ing because snow(1) radiates light (3) conducts light(2) absorbs light (4) reflects light
A
B
C
D
Lake
Sun
Feldspar fragment
Shell fragment
Quartz fragment
Key
Rock Sample
Cementingmaterial
Sun
Moon
Earth
(not drawn to scale)
Venus
Mercury
Inter.-Level Science — June ’02 [7] [OVER]
Inter.-Level Science — June ’02 [8]
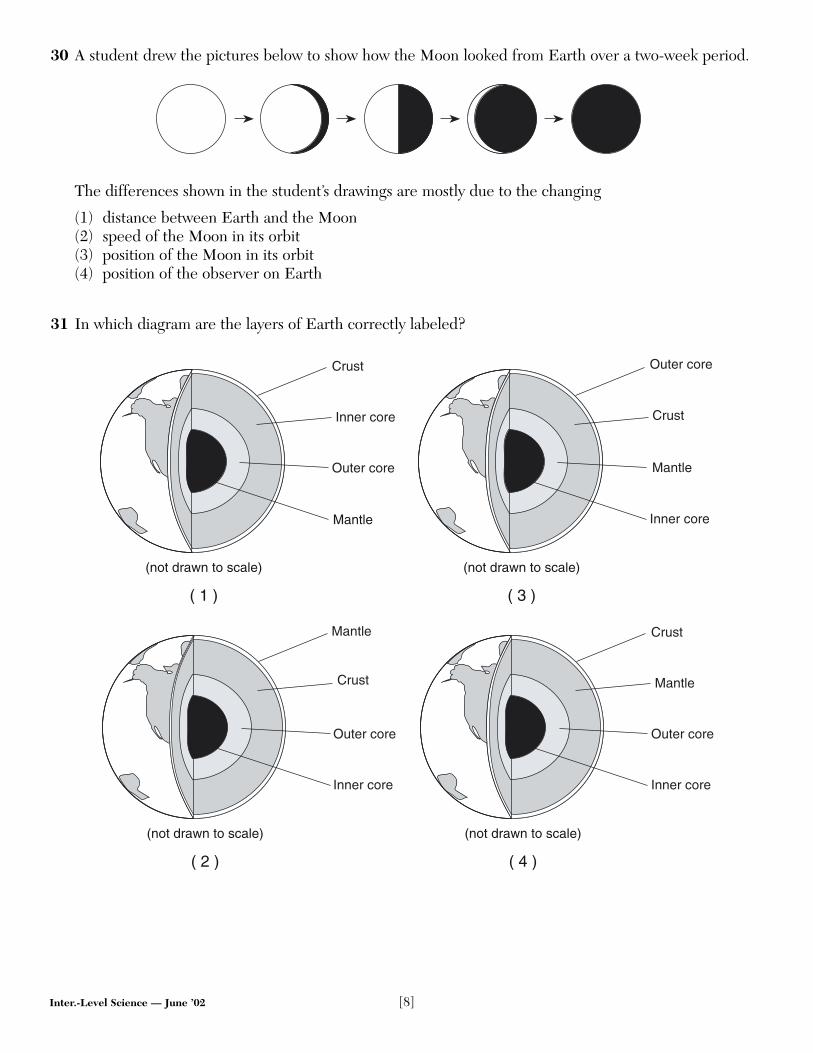
30 A student drew the pictures below to show how the Moon looked from Earth over a two-week period.
The differences shown in the student’s drawings are mostly due to the changing
(1) distance between Earth and the Moon(2) speed of the Moon in its orbit(3) position of the Moon in its orbit(4) position of the observer on Earth
31 In which diagram are the layers of Earth correctly labeled?
Crust
Inner core
Outer core
Crust
Mantle
Outer core
Inner core
Crust
Mantle
Outer core
Inner core
Crust
Mantle
Outer core
Inner core
(not drawn to scale)
( 1 )
(not drawn to scale)
( 3 )
(not drawn to scale)
( 2 )
(not drawn to scale)
( 4 )
Mantle
Inter.-Level Science — June ’02 [9] [OVER]
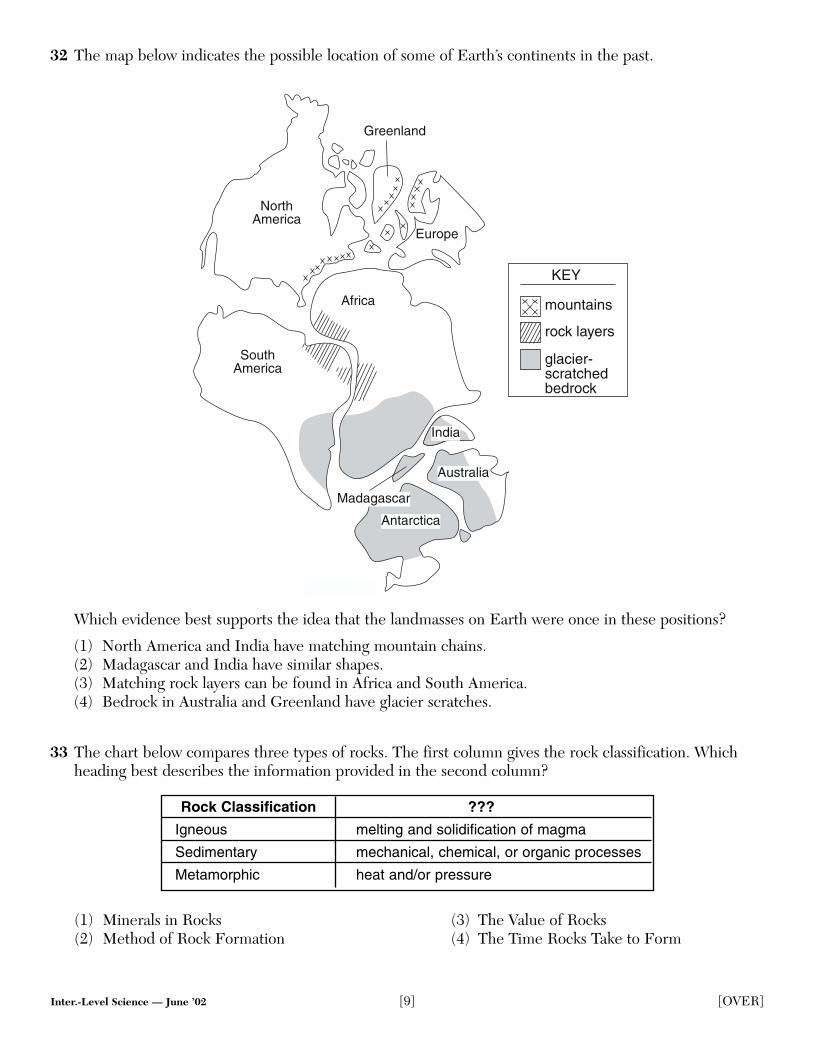
32 The map below indicates the possible location of some of Earth’s continents in the past.
Which evidence best supports the idea that the landmasses on Earth were once in these positions?
(1) North America and India have matching mountain chains.(2) Madagascar and India have similar shapes.(3) Matching rock layers can be found in Africa and South America.(4) Bedrock in Australia and Greenland have glacier scratches.
33 The chart below compares three types of rocks. The first column gives the rock classification. Whichheading best describes the information provided in the second column?
Rock Classification ???
Igneous melting and solidification of magma
Sedimentary mechanical, chemical, or organic processes
Metamorphic heat and/or pressure
Greenland
NorthAmerica
Europe
Africa
SouthAmerica
India
Australia
Antarctica
Madagascar
KEY
mountains
rock layers
glacier-scratchedbedrock
(1) Minerals in Rocks (3) The Value of Rocks(2) Method of Rock Formation (4) The Time Rocks Take to Form
Inter.-Level Science — June ’02 [10]
34 Earth’s weather is primarily caused by the(1) drifting of Earth’s crustal plates(2) gravitational attraction of the Moon(3) uneven heating of Earth’s surface(4) changing distance between Earth and the
Sun
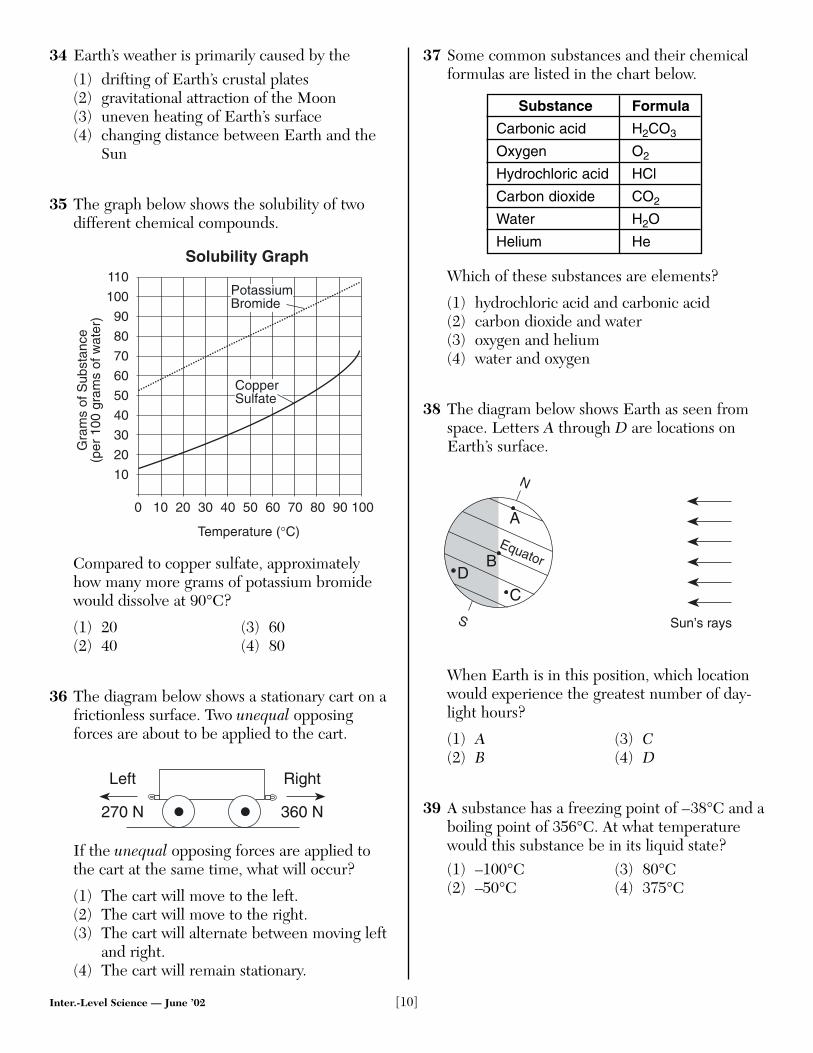
35 The graph below shows the solubility of twodifferent chemical compounds.
Compared to copper sulfate, approximatelyhow many more grams of potassium bromidewould dissolve at 90°C?
(1) 20 (3) 60(2) 40 (4) 80
36 The diagram below shows a stationary cart on africtionless surface. Two unequal opposingforces are about to be applied to the cart.
If the unequal opposing forces are applied tothe cart at the same time, what will occur?
(1) The cart will move to the left.(2) The cart will move to the right.(3) The cart will alternate between moving left
and right.(4) The cart will remain stationary.
37 Some common substances and their chemicalformulas are listed in the chart below.
Substance Formula
Carbonic acid H2CO3
Oxygen O2
Hydrochloric acid HCl
Carbon dioxide CO2
Water H2O
Helium He
Which of these substances are elements?
(1) hydrochloric acid and carbonic acid(2) carbon dioxide and water(3) oxygen and helium(4) water and oxygen
38 The diagram below shows Earth as seen fromspace. Letters A through D are locations onEarth’s surface.
When Earth is in this position, which locationwould experience the greatest number of day-light hours?
(1) A (3) C(2) B (4) D
39 A substance has a freezing point of –38°C and aboiling point of 356°C. At what temperaturewould this substance be in its liquid state?(1) –100°C (3) 80°C(2) –50°C (4) 375°C
N
S
Equator
A
B
CD
Sun’s rays
270 N 360 N
Left Right
Solubility Graph
Temperature (°C)
Gra
ms
of S
ubst
ance
(per
100
gra
ms
of w
ater
)
110
100
90
80
70
30
50
60
40
0
20
10
10090807030 50 60402010
PotassiumBromide
CopperSulfate
Inter.-Level Science — June ’02 [11] [OVER]
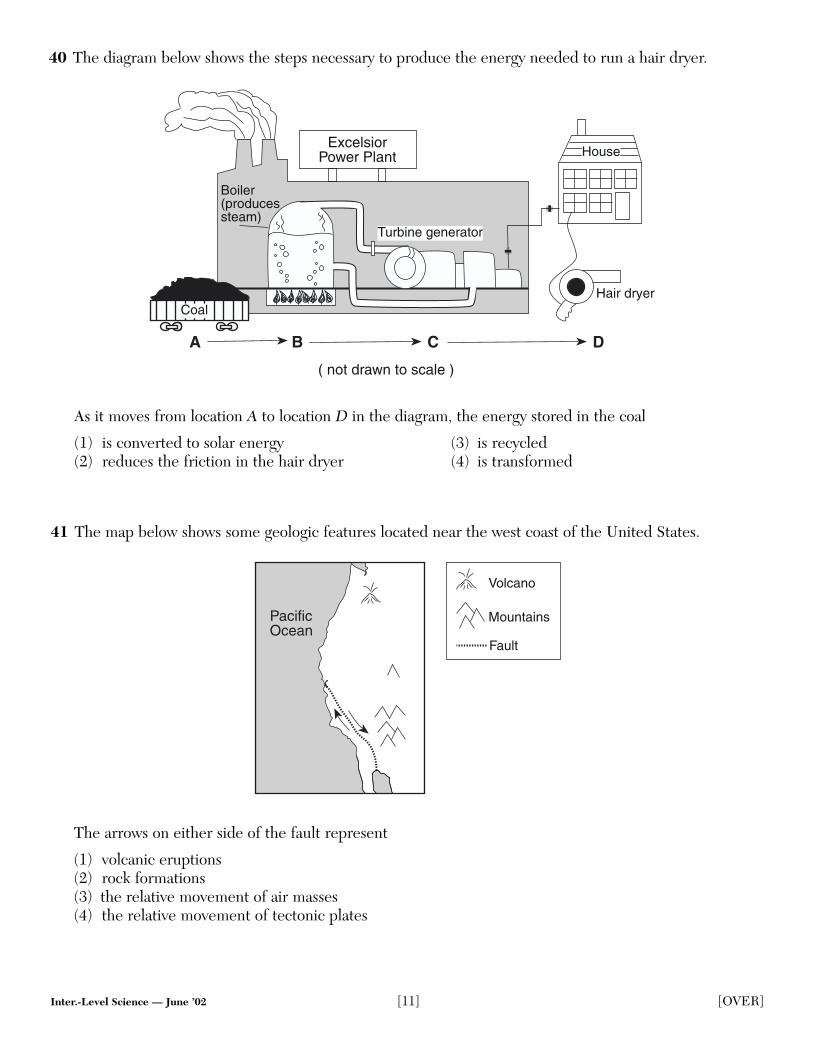
40 The diagram below shows the steps necessary to produce the energy needed to run a hair dryer.
Boiler(producessteam)
ExcelsiorPower Plant
Turbine generator
Hair dryer
A B C D
Coal
House
( not drawn to scale )
As it moves from location A to location D in the diagram, the energy stored in the coal
(1) is converted to solar energy (3) is recycled (2) reduces the friction in the hair dryer (4) is transformed
41 The map below shows some geologic features located near the west coast of the United States.
PacificOcean
Volcano
Mountains
Fault
The arrows on either side of the fault represent
(1) volcanic eruptions(2) rock formations(3) the relative movement of air masses(4) the relative movement of tectonic plates
Inter.-Level Science — June ’02 [12]
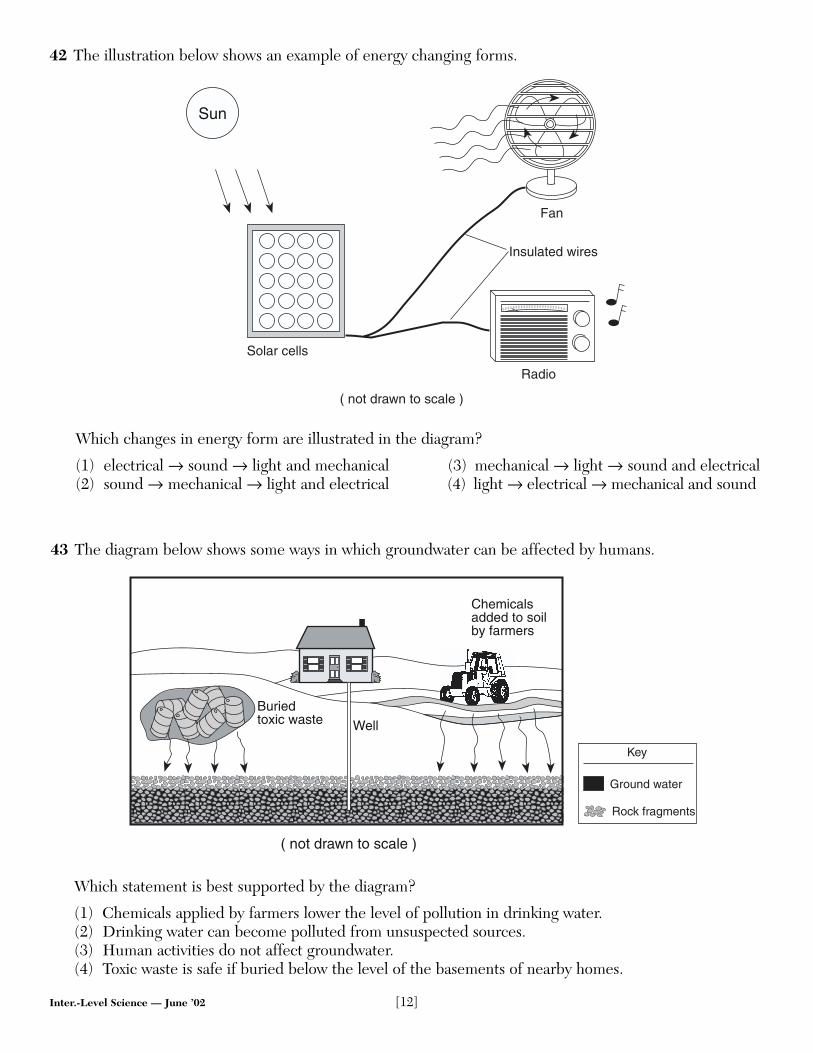
42 The illustration below shows an example of energy changing forms.
SUN
Solar cells
Radio
Fan
Insulated wires
( not drawn to scale )
Sun
Which changes in energy form are illustrated in the diagram?
(1) electrical → sound → light and mechanical (3) mechanical → light → sound and electrical (2) sound → mechanical → light and electrical (4) light → electrical → mechanical and sound
43 The diagram below shows some ways in which groundwater can be affected by humans.
Chemicalsadded to soilby farmers
Well
Buriedtoxic waste
( not drawn to scale )
Key
Ground water
Rock fragments
Which statement is best supported by the diagram?
(1) Chemicals applied by farmers lower the level of pollution in drinking water.(2) Drinking water can become polluted from unsuspected sources.(3) Human activities do not affect groundwater.(4) Toxic waste is safe if buried below the level of the basements of nearby homes.
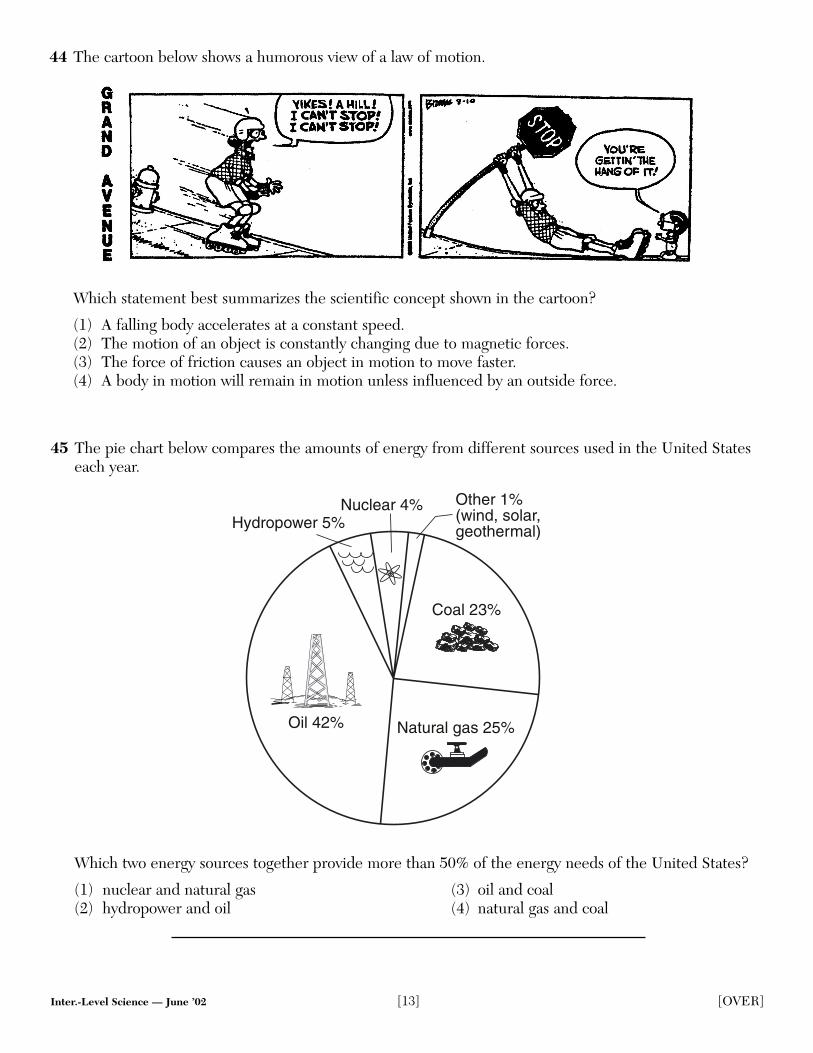
44 The cartoon below shows a humorous view of a law of motion.
Inter.-Level Science — June ’02 [13] [OVER]
Which statement best summarizes the scientific concept shown in the cartoon?
(1) A falling body accelerates at a constant speed.(2) The motion of an object is constantly changing due to magnetic forces.(3) The force of friction causes an object in motion to move faster.(4) A body in motion will remain in motion unless influenced by an outside force.
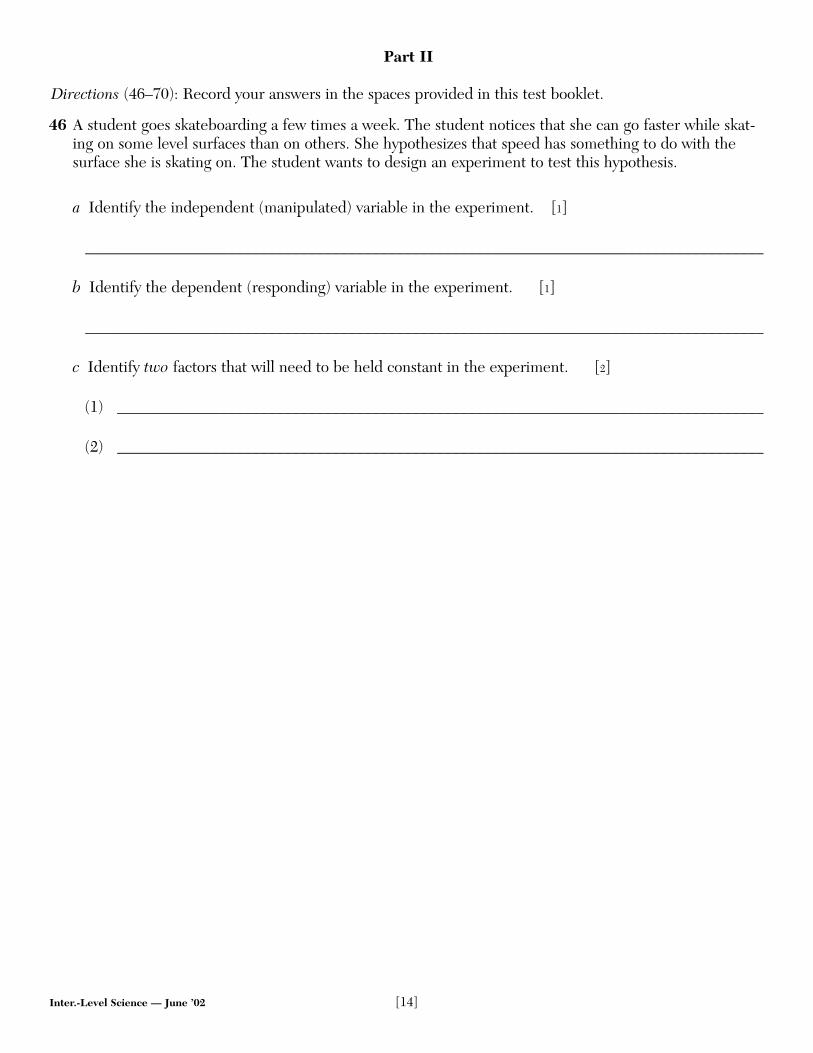
45 The pie chart below compares the amounts of energy from different sources used in the United Stateseach year.
Hydropower 5%Nuclear 4% Other 1%
(wind, solar,geothermal)
Coal 23%
Natural gas 25%Oil 42%
Which two energy sources together provide more than 50% of the energy needs of the United States?
(1) nuclear and natural gas (3) oil and coal(2) hydropower and oil (4) natural gas and coal
46 A student goes skateboarding a few times a week. The student notices that she can go faster while skat-ing on some level surfaces than on others. She hypothesizes that speed has something to do with thesurface she is skating on. The student wants to design an experiment to test this hypothesis.
a Identify the independent (manipulated) variable in the experiment. [1]
_____________________________________________________________________________________
b Identify the dependent (responding) variable in the experiment. [1]
_____________________________________________________________________________________
c Identify two factors that will need to be held constant in the experiment. [2]
(1) _________________________________________________________________________________
(2) _________________________________________________________________________________
Inter.-Level Science — June ’02 [14]
Part II
Directions (46–70): Record your answers in the spaces provided in this test booklet.
Inter.-Level Science — June ’02 [15] [OVER]
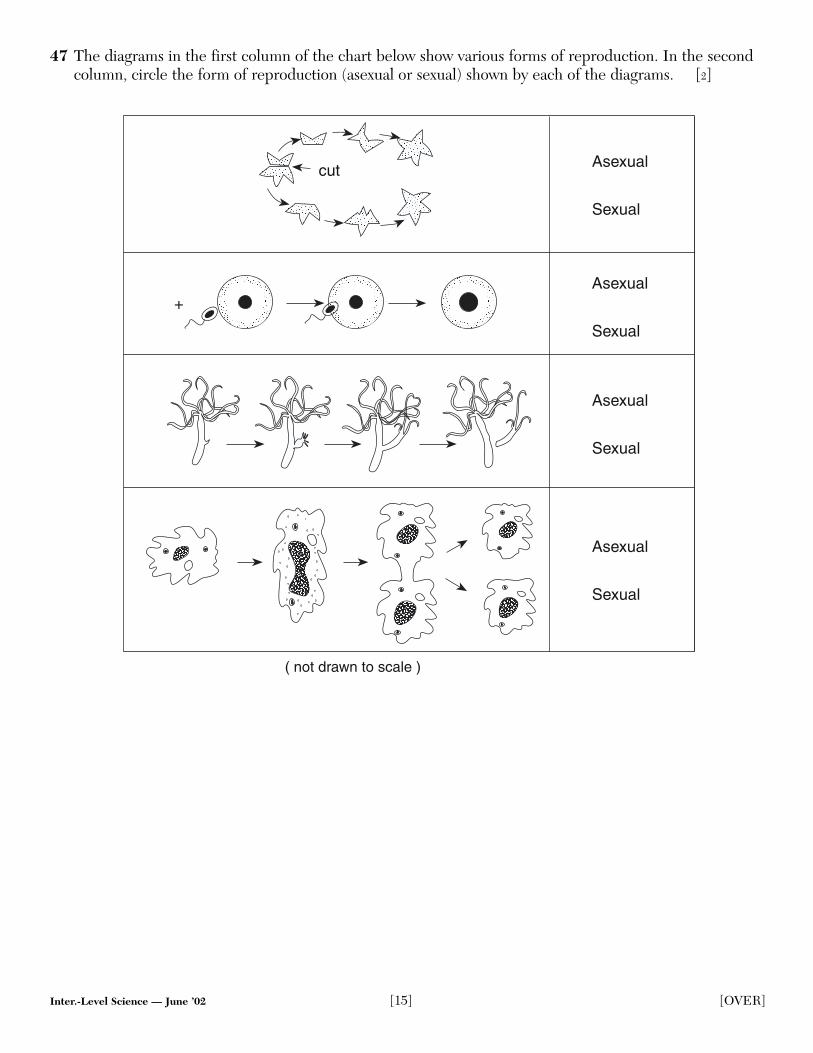
47 The diagrams in the first column of the chart below show various forms of reproduction. In the secondcolumn, circle the form of reproduction (asexual or sexual) shown by each of the diagrams. [2]
( not drawn to scale )
Asexual
Sexual
Asexual
Sexual
Asexual
Sexual
Asexual
Sexual
cut
+
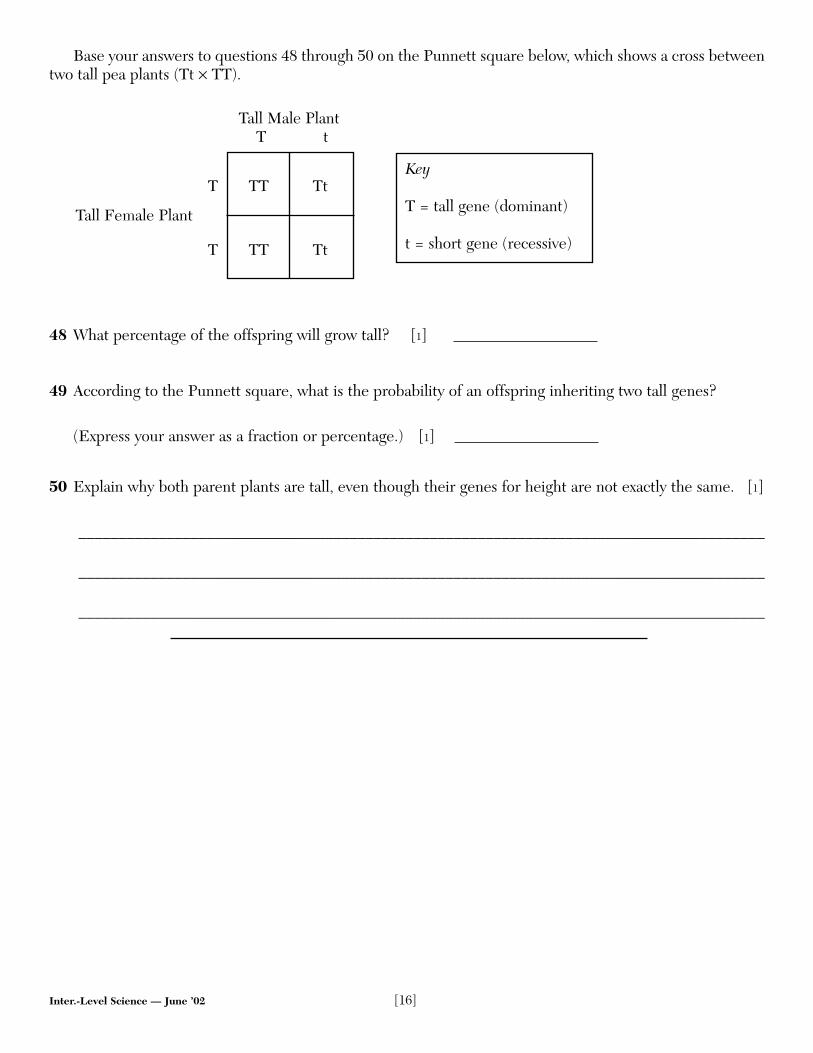
Base your answers to questions 48 through 50 on the Punnett square below, which shows a cross betweentwo tall pea plants (Tt × TT).
Tall Male PlantT t
T TT Tt
Tall Female Plant
T TT Tt
48 What percentage of the offspring will grow tall? [1]
49 According to the Punnett square, what is the probability of an offspring inheriting two tall genes?
(Express your answer as a fraction or percentage.) [1]
50 Explain why both parent plants are tall, even though their genes for height are not exactly the same. [1]
______________________________________________________________________________________
______________________________________________________________________________________
______________________________________________________________________________________
Inter.-Level Science — June ’02 [16]
Key
T = tall gene (dominant)
t = short gene (recessive)
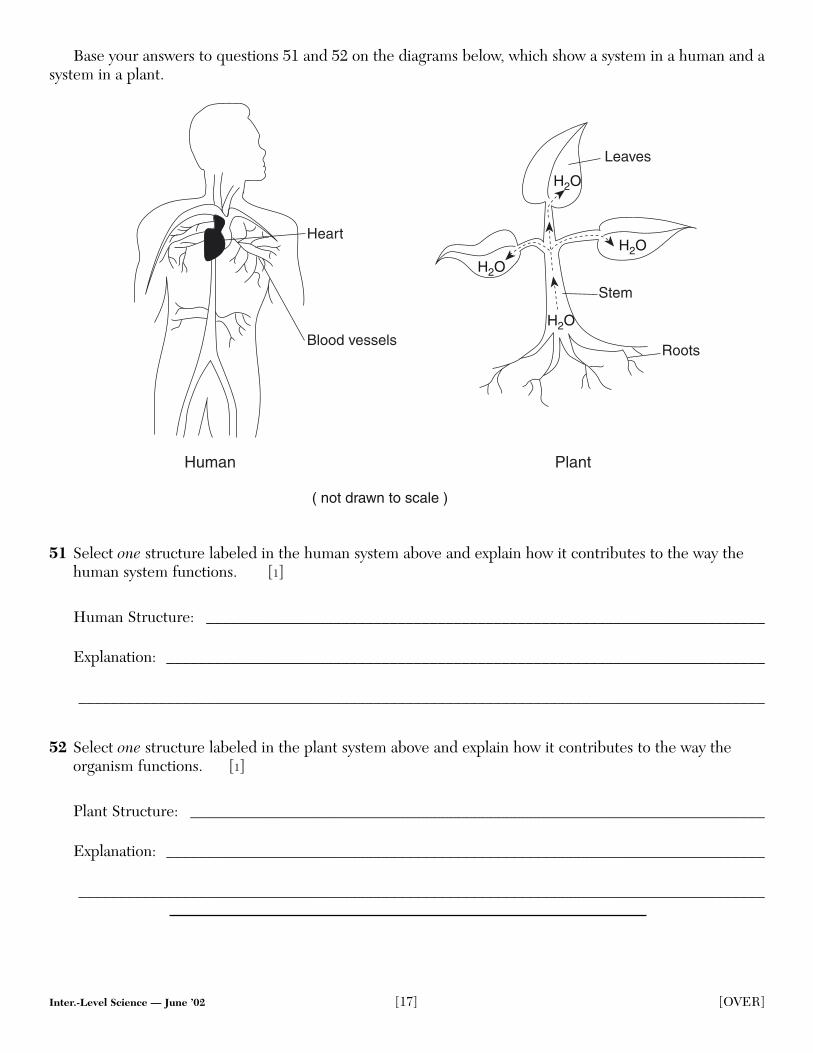
Base your answers to questions 51 and 52 on the diagrams below, which show a system in a human and asystem in a plant.
51 Select one structure labeled in the human system above and explain how it contributes to the way thehuman system functions. [1]
Human Structure: ______________________________________________________________________
Explanation: ___________________________________________________________________________
______________________________________________________________________________________
52 Select one structure labeled in the plant system above and explain how it contributes to the way theorganism functions. [1]
Plant Structure: ________________________________________________________________________
Explanation: ___________________________________________________________________________
______________________________________________________________________________________
H2O
H2O
H2O
H2O
Human Plant
Heart
Blood vessels
Leaves
Stem
Roots
( not drawn to scale )
Inter.-Level Science — June ’02 [17] [OVER]
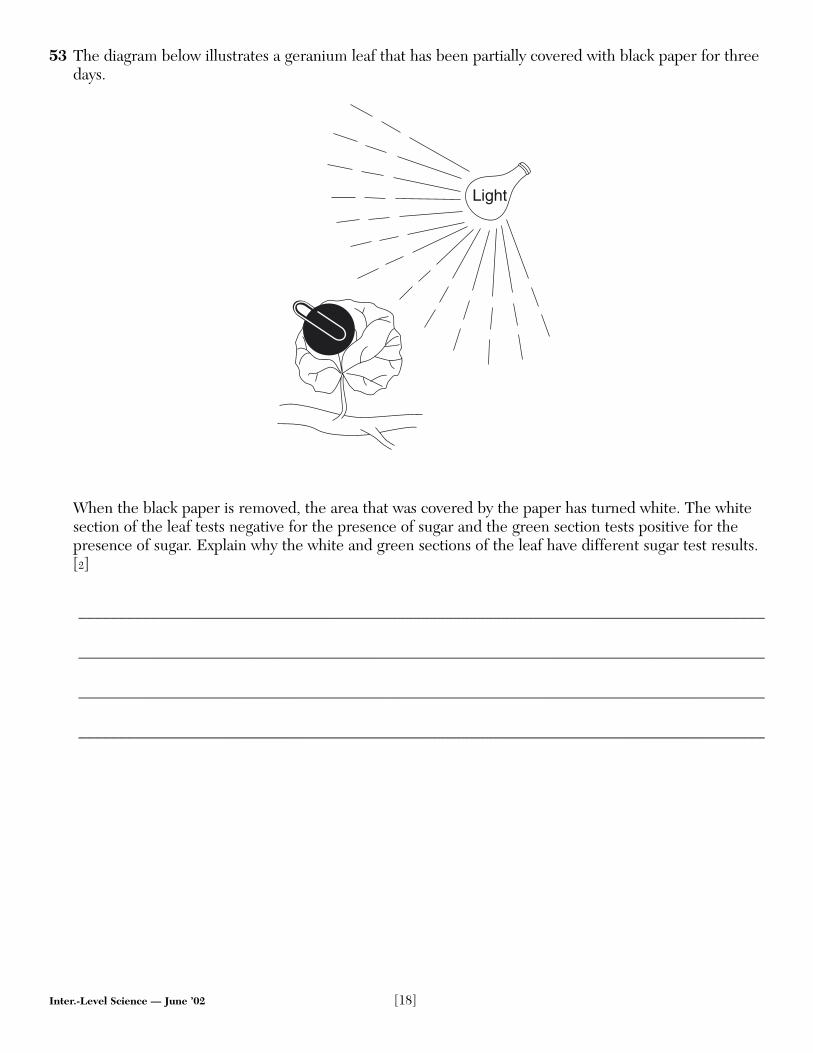
53 The diagram below illustrates a geranium leaf that has been partially covered with black paper for threedays.
When the black paper is removed, the area that was covered by the paper has turned white. The whitesection of the leaf tests negative for the presence of sugar and the green section tests positive for thepresence of sugar. Explain why the white and green sections of the leaf have different sugar test results.[2]
______________________________________________________________________________________
______________________________________________________________________________________
______________________________________________________________________________________
______________________________________________________________________________________
Light
Inter.-Level Science — June ’02 [18]
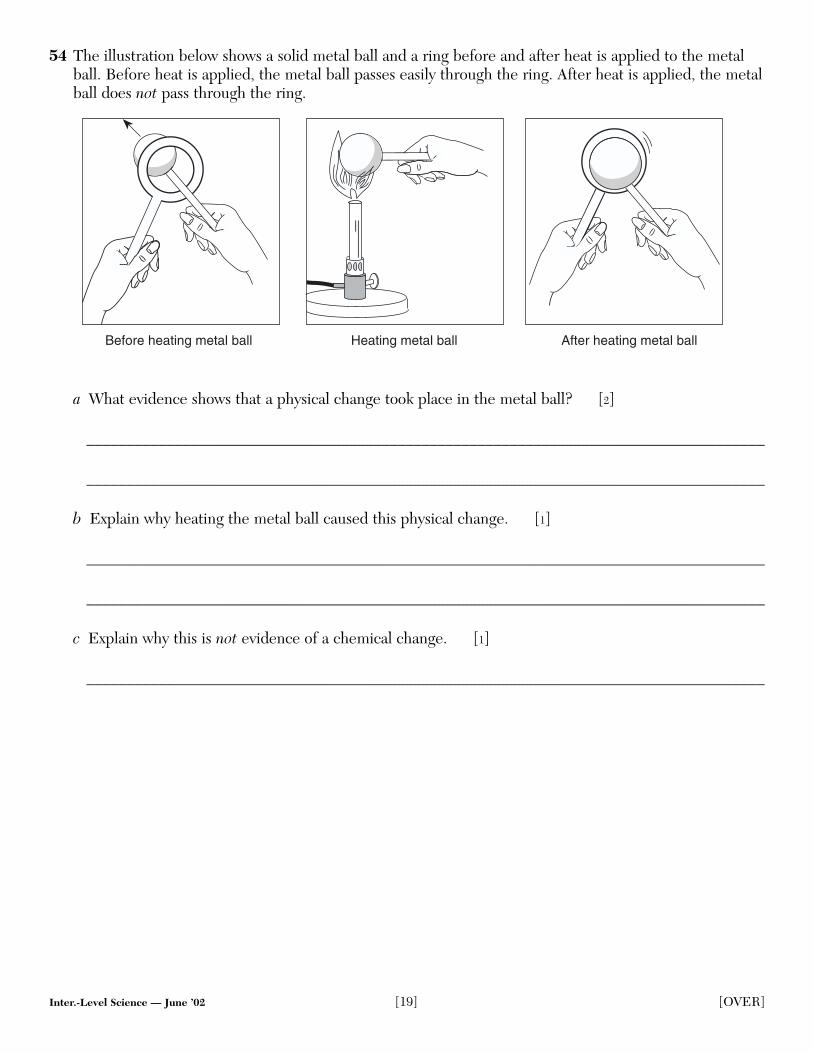
54 The illustration below shows a solid metal ball and a ring before and after heat is applied to the metalball. Before heat is applied, the metal ball passes easily through the ring. After heat is applied, the metalball does not pass through the ring.
a What evidence shows that a physical change took place in the metal ball? [2]
_____________________________________________________________________________________
_____________________________________________________________________________________
b Explain why heating the metal ball caused this physical change. [1]
_____________________________________________________________________________________
_____________________________________________________________________________________
c Explain why this is not evidence of a chemical change. [1]
_____________________________________________________________________________________
Before heating metal ball Heating metal ball After heating metal ball
Inter.-Level Science — June ’02 [19] [OVER]
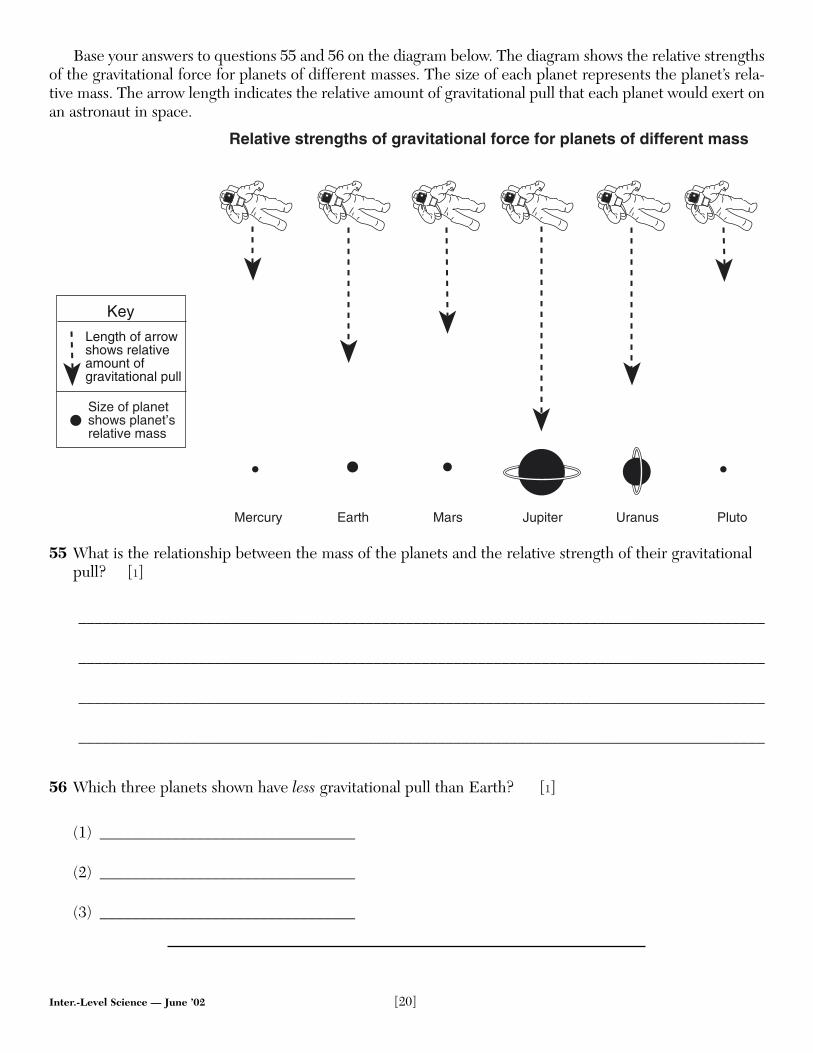
Base your answers to questions 55 and 56 on the diagram below. The diagram shows the relative strengthsof the gravitational force for planets of different masses. The size of each planet represents the planet’s rela-tive mass. The arrow length indicates the relative amount of gravitational pull that each planet would exert onan astronaut in space.
55 What is the relationship between the mass of the planets and the relative strength of their gravitationalpull? [1]
______________________________________________________________________________________
______________________________________________________________________________________
______________________________________________________________________________________
______________________________________________________________________________________
56 Which three planets shown have less gravitational pull than Earth? [1]
(1) ________________________________
(2) ________________________________
(3) ________________________________
Relative strengths of gravitational force for planets of different mass
Size of planetshows planet’srelative mass
Mercury Earth Mars Jupiter Uranus Pluto
Length of arrowshows relativeamount ofgravitational pull
Key
Inter.-Level Science — June ’02 [20]
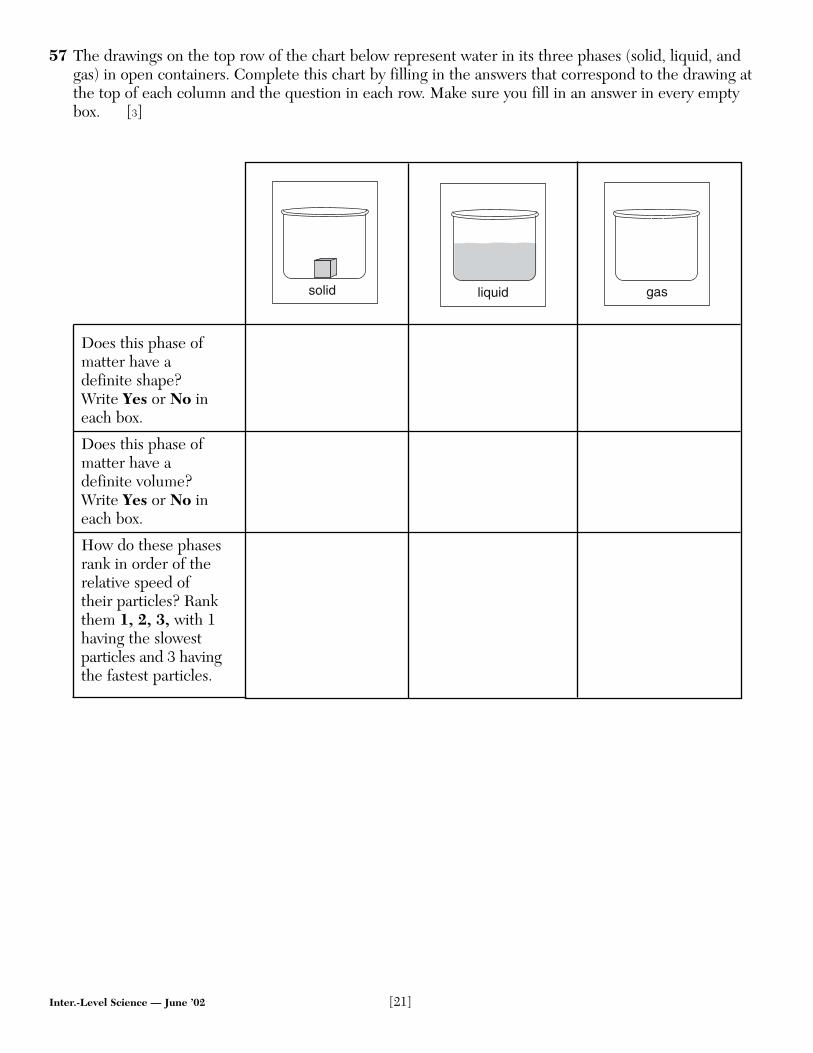
57 The drawings on the top row of the chart below represent water in its three phases (solid, liquid, andgas) in open containers. Complete this chart by filling in the answers that correspond to the drawing atthe top of each column and the question in each row. Make sure you fill in an answer in every emptybox. [3]
Does this phase of matter have a definite shape? Write Yes or No in each box.
Does this phase of matter have a definite volume? Write Yes or No in each box.
How do these phases rank in order of the relative speed of their particles? Rank them 1, 2, 3, with 1 having the slowest particles and 3 having the fastest particles.
Inter.-Level Science — June ’02 [21]
gasliquidsolid
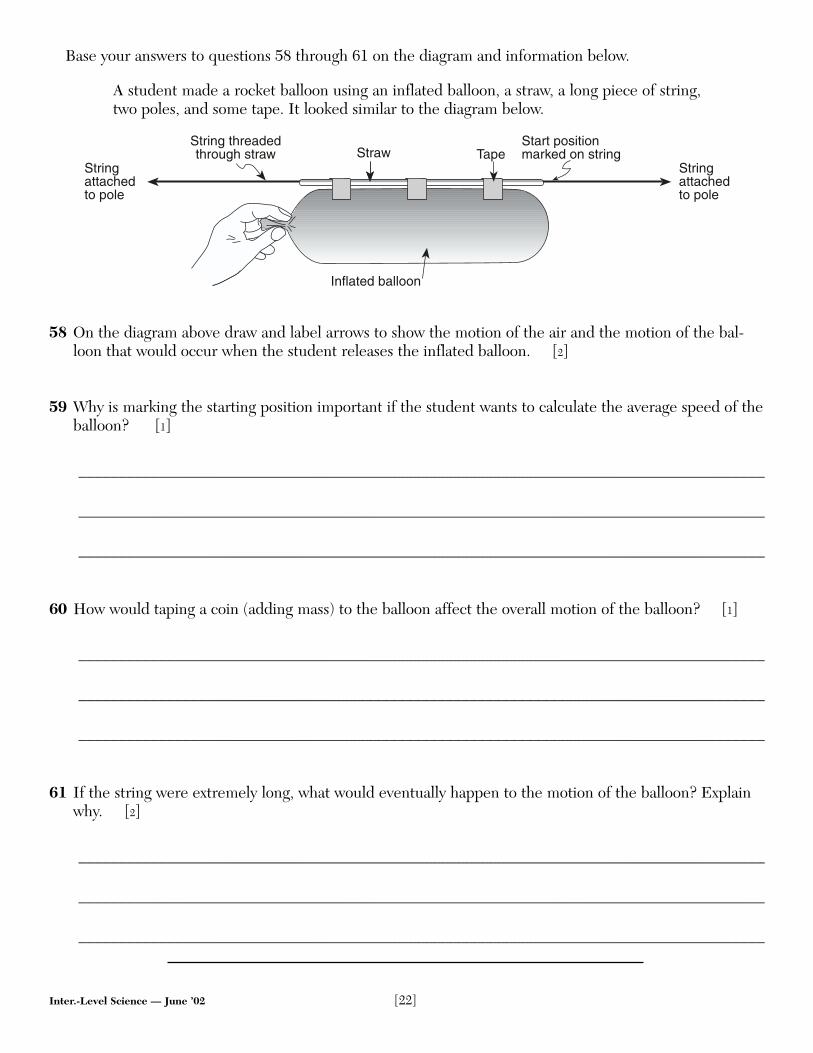
Base your answers to questions 58 through 61 on the diagram and information below.
A student made a rocket balloon using an inflated balloon, a straw, a long piece of string,two poles, and some tape. It looked similar to the diagram below.
58 On the diagram above draw and label arrows to show the motion of the air and the motion of the bal-loon that would occur when the student releases the inflated balloon. [2]
59 Why is marking the starting position important if the student wants to calculate the average speed of theballoon? [1]
______________________________________________________________________________________
______________________________________________________________________________________
______________________________________________________________________________________
60 How would taping a coin (adding mass) to the balloon affect the overall motion of the balloon? [1]
______________________________________________________________________________________
______________________________________________________________________________________
______________________________________________________________________________________
61 If the string were extremely long, what would eventually happen to the motion of the balloon? Explainwhy. [2]
______________________________________________________________________________________
______________________________________________________________________________________
______________________________________________________________________________________
Inflated balloon
StrawStart positionmarked on string
String threadedthrough straw Tape
Stringattachedto pole
Stringattachedto pole
Inter.-Level Science — June ’02 [22]
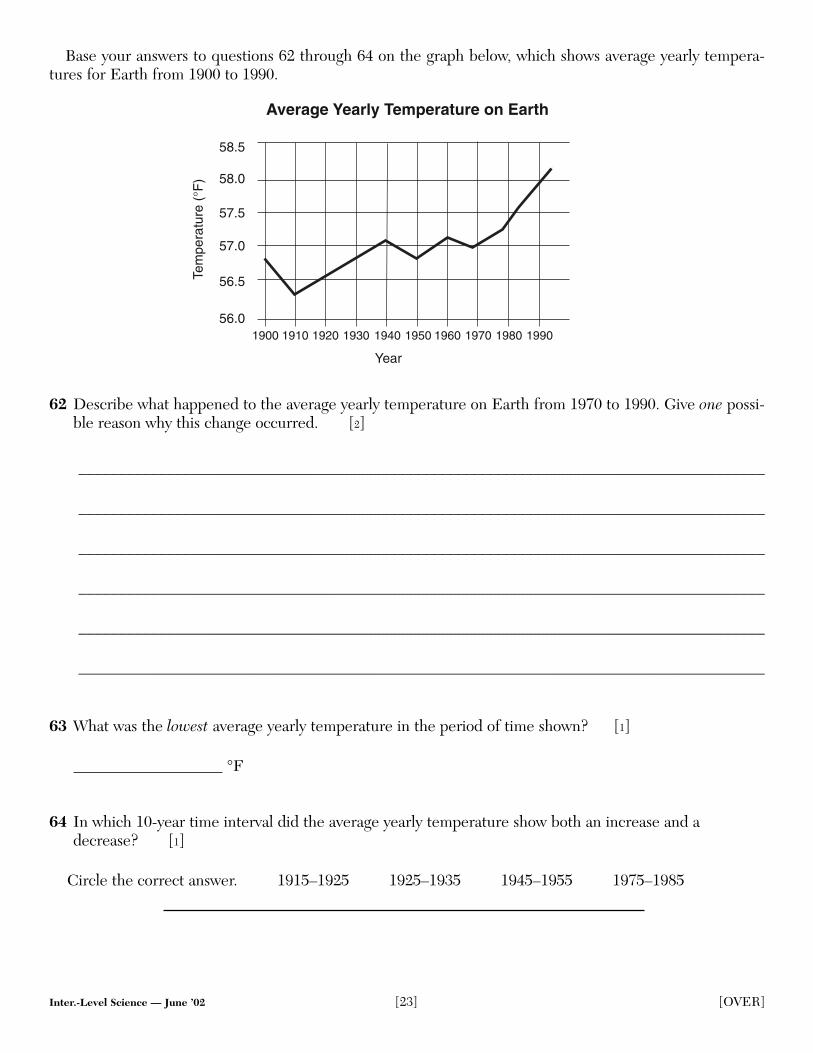
Base your answers to questions 62 through 64 on the graph below, which shows average yearly tempera-tures for Earth from 1900 to 1990.
62 Describe what happened to the average yearly temperature on Earth from 1970 to 1990. Give one possi-ble reason why this change occurred. [2]
______________________________________________________________________________________
______________________________________________________________________________________
______________________________________________________________________________________
______________________________________________________________________________________
______________________________________________________________________________________
______________________________________________________________________________________
63 What was the lowest average yearly temperature in the period of time shown? [1]
°F
64 In which 10-year time interval did the average yearly temperature show both an increase and adecrease? [1]
Circle the correct answer. 1915–1925 1925–1935 1945–1955 1975–1985
58.5
58.0
57.5
57.0
56.5
56.01900 1910 1920 1930 1940 1950 1960 1970 1980 1990
Average Yearly Temperature on Earth
Year
Tem
pera
ture
(°F
)
Inter.-Level Science — June ’02 [23] [OVER]
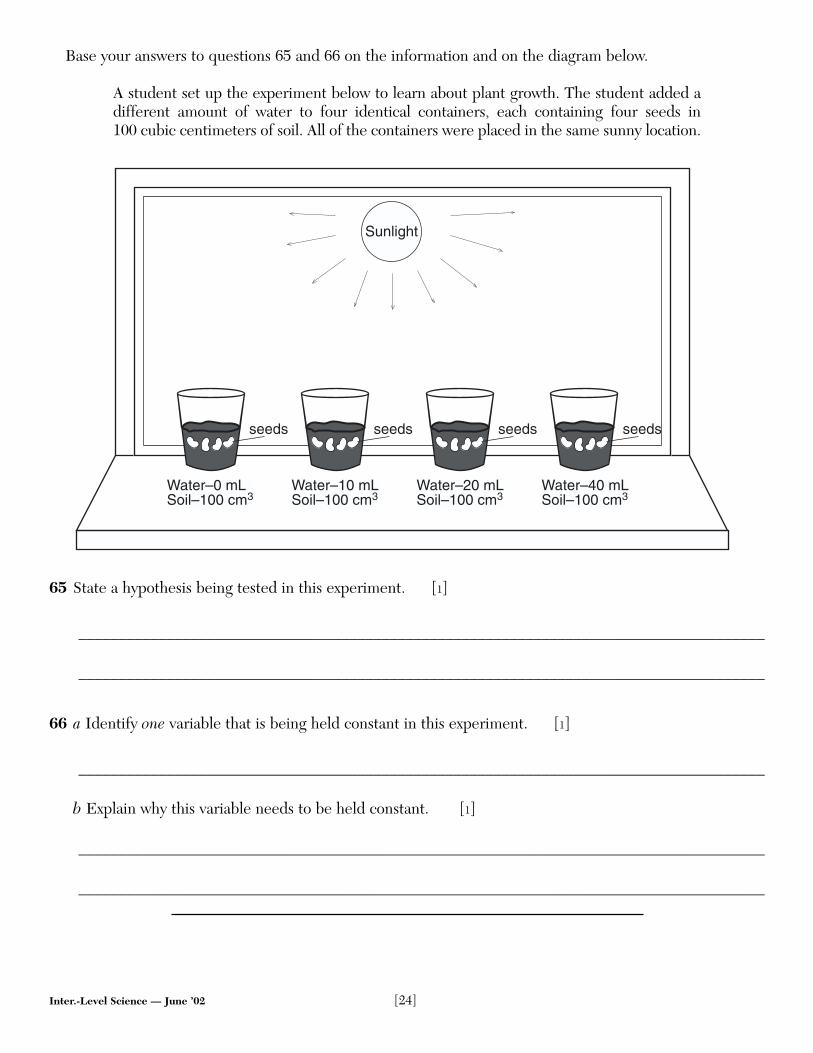
Base your answers to questions 65 and 66 on the information and on the diagram below.
A student set up the experiment below to learn about plant growth. The student added adifferent amount of water to four identical containers, each containing four seeds in 100 cubic centimeters of soil. All of the containers were placed in the same sunny location.
65 State a hypothesis being tested in this experiment. [1]
______________________________________________________________________________________
______________________________________________________________________________________
66 a Identify one variable that is being held constant in this experiment. [1]
______________________________________________________________________________________
b Explain why this variable needs to be held constant. [1]
______________________________________________________________________________________
______________________________________________________________________________________
Sunlight
seeds
Water–0 mLSoil–100 cm3
seeds seeds seeds
Water–10 mLSoil–100 cm3
Water–20 mLSoil–100 cm3
Water–40 mLSoil–100 cm3
Inter.-Level Science — June ’02 [24]
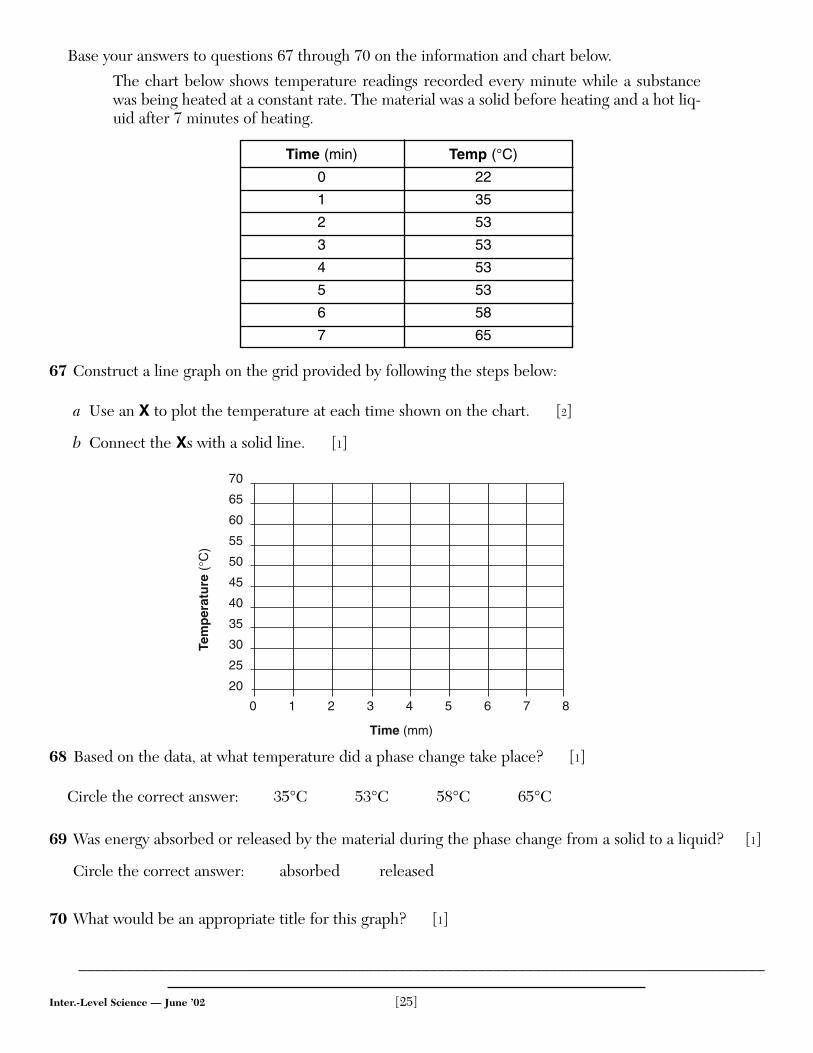
Base your answers to questions 67 through 70 on the information and chart below.
The chart below shows temperature readings recorded every minute while a substancewas being heated at a constant rate. The material was a solid before heating and a hot liq-uid after 7 minutes of heating.
Time (min) Temp (°C)
0 22
1 35
2 53
3 53
4 53
5 53
6 58
7 65
67 Construct a line graph on the grid provided by following the steps below:
a Use an X to plot the temperature at each time shown on the chart. [2]
b Connect the Xs with a solid line. [1]
68 Based on the data, at what temperature did a phase change take place? [1]
Circle the correct answer: 35°C 53°C 58°C 65°C
69 Was energy absorbed or released by the material during the phase change from a solid to a liquid? [1]
Circle the correct answer: absorbed released
70 What would be an appropriate title for this graph? [1]
______________________________________________________________________________________
Tem
per
atu
re (
°C)
Time (mm)
0 1 2 3 4 5 6 7 8
20
25
30
35
40
45
50
55
60
65
70
Inter.-Level Science — June ’02 [25]


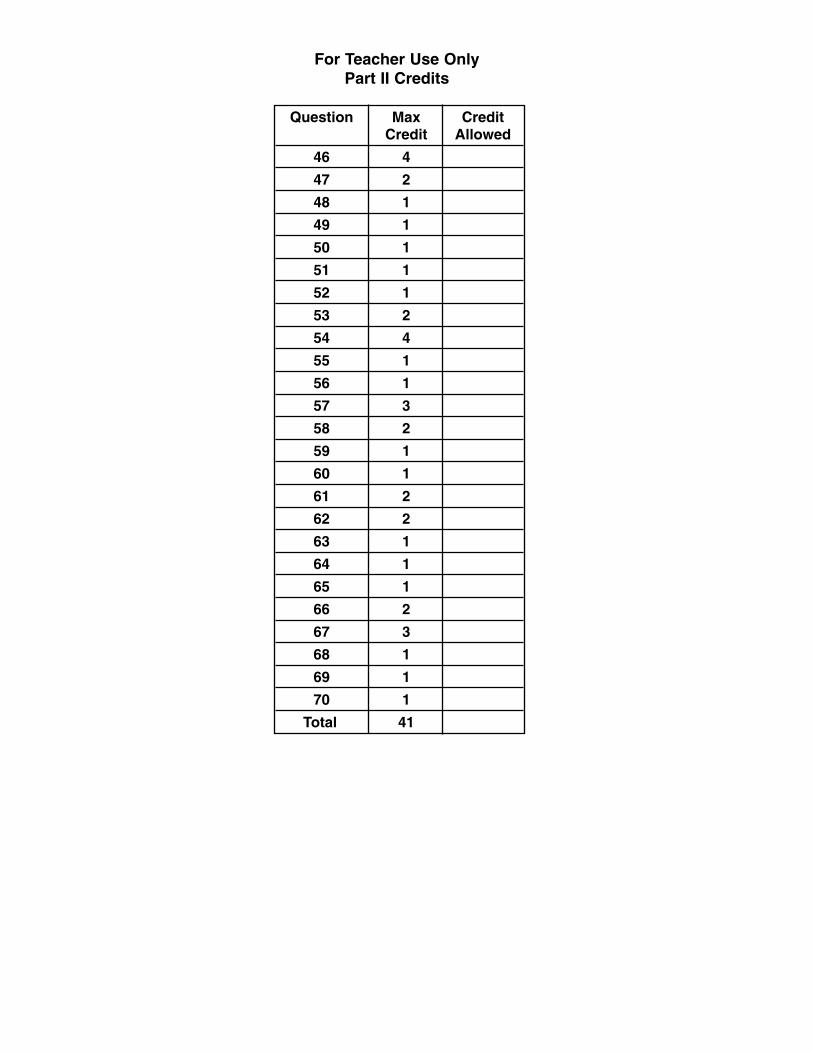
Question Max CreditCredit Allowed
46 4
47 2
48 1
49 1
50 1
51 1
52 1
53 2
54 4
55 1
56 1
57 3
58 2
59 1
60 1
61 2
62 2
63 1
64 1
65 1
66 2
67 3
68 1
69 1
70 1
Total 41
For Teacher Use OnlyPart II Credits