Embed Size (px)
Citation preview
1 | P a g e
THE UNIVERSITY OF QUEENSLAND
Bachelor of Engineering Thesis
Student Name: Ahmed Faiz Amin AHMED ISMAIL
Course Code: MECH4500
Supervisor: Ali Dehghan Manshadi
Submission Date: 28 October 2016
A thesis submitted in partial fulfillment of the requirement of the
Bachelor of Engineering degree in Mechanical Engineering
Development of Novel β-Ti Alloys through Powder
Metallurgical Routes
UQ Engineering
Faculty of Engineering, Architecture and Information Technology
2 | P a g e
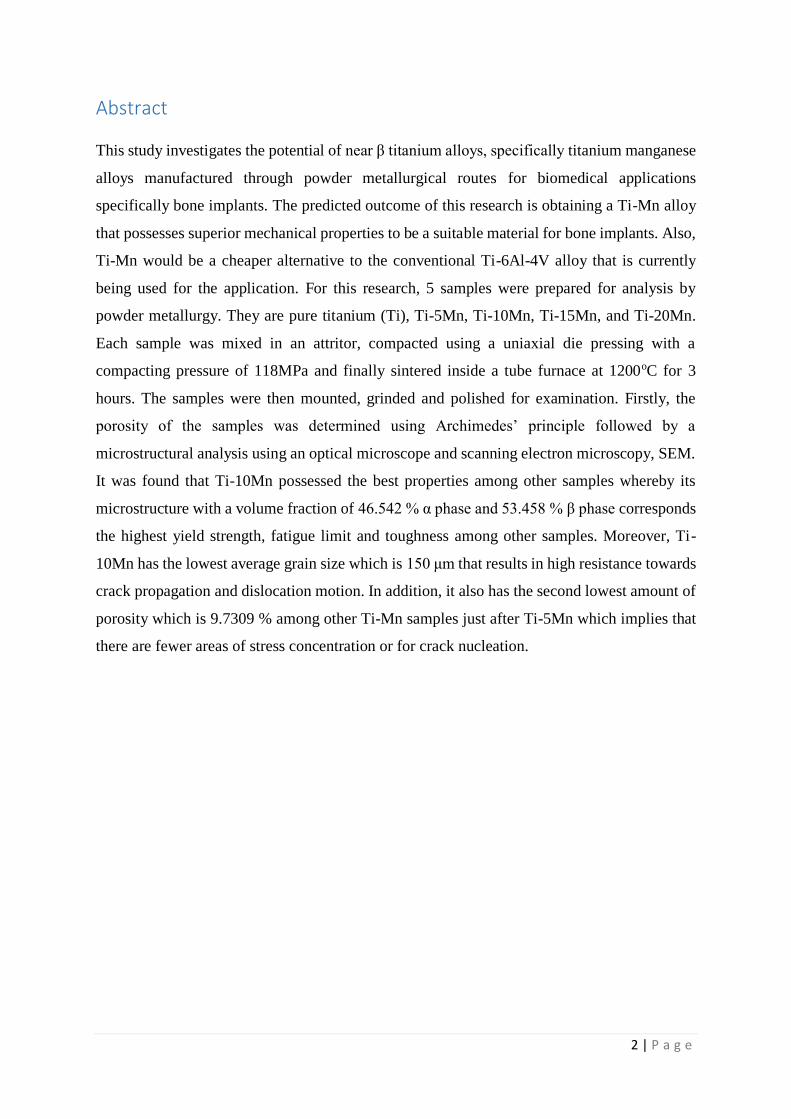
Abstract
This study investigates the potential of near β titanium alloys, specifically titanium manganese
alloys manufactured through powder metallurgical routes for biomedical applications
specifically bone implants. The predicted outcome of this research is obtaining a Ti-Mn alloy
that possesses superior mechanical properties to be a suitable material for bone implants. Also,
Ti-Mn would be a cheaper alternative to the conventional Ti-6Al-4V alloy that is currently
being used for the application. For this research, 5 samples were prepared for analysis by
powder metallurgy. They are pure titanium (Ti), Ti-5Mn, Ti-10Mn, Ti-15Mn, and Ti-20Mn.
Each sample was mixed in an attritor, compacted using a uniaxial die pressing with a
compacting pressure of 118MPa and finally sintered inside a tube furnace at 1200oC for 3
hours. The samples were then mounted, grinded and polished for examination. Firstly, the
porosity of the samples was determined using Archimedes’ principle followed by a
microstructural analysis using an optical microscope and scanning electron microscopy, SEM.
It was found that Ti-10Mn possessed the best properties among other samples whereby its
microstructure with a volume fraction of 46.542 % α phase and 53.458 % β phase corresponds
the highest yield strength, fatigue limit and toughness among other samples. Moreover, Ti-
10Mn has the lowest average grain size which is 150 μm that results in high resistance towards
crack propagation and dislocation motion. In addition, it also has the second lowest amount of
porosity which is 9.7309 % among other Ti-Mn samples just after Ti-5Mn which implies that
there are fewer areas of stress concentration or for crack nucleation.

3 | P a g e
Acknowledgement Firstly, I would like to praise All Mighty God for giving me the wisdom and strength to write
this thesis with ease. Even though it has been a bumpy ride throughout semester 1 and
semester 2 of 2016, I still managed to pull myself together and complete this thesis without
any major issues.
Secondly, I would like to express my utmost gratitude towards Mr. Ali Deghan Manshadi for
being a cool and dedicated thesis supervisor. Without his insightful guidance, completing this
project would be impossible. Mr Ali practically taught me everything from preparing samples
to finally examining them to obtain results. One of the most valuable lesson I learnt for him
was knowing how to use the scanning electron microscope, SEM to analyse the
microstructure of the samples. Using SEM, it was very easy to determine the phases and
elements present on the microstructure as well as the local composition which I considered
very advanced and complex prior to learning the procedures of operating SEM. Mr. Ali was
also responsible in assisting me to write a good thesis. I definitely consider him a good
mentor and teacher.
Thirdly, I also like to say a million thanks to Mr. Jonathon Read for being an awesome senior
technical officer. His laboratory inductions made me appreciate the importance of safety and
being responsible in laboratories. His friendly and easy going attitude made it very easy for
me to talk with him whenever I had an enquiry or encountered any technical related issues.
Next, I would like to thank my friends who were always there for me during my ups and
downs throughout completing this thesis. Without their persistent support and help, it would
be difficult for me to stay on track with the progress of this thesis.
4 | P a g e
Table of Contents Abstract ................................................................................................................................................ 2
Acknowledgement ................................................................................................................................ 3
1.0 Introduction .............................................................................................................................. 6
1.1 Project Significance ............................................................................................................... 6
1.2 Purpose and Aims ................................................................................................................. 7
Purpose ......................................................................................................................................... 7
Aims .............................................................................................................................................. 7
2.0 Background ............................................................................................................................... 8
2.1 Origin of Titanium ................................................................................................................. 8
2.2 Classifying Titanium Alloys .................................................................................................... 9
2.3 Titanium Alloys for Biomedical Purposes ............................................................................ 11
Brief History of Biomedical Implants ........................................................................................... 11
Recent Research ......................................................................................................................... 13
Potential of Titanium-Manganese (Ti-Mn) Alloy for the Biomedical Field ...................................... 14
2.4 Introduction to Powder Metallurgy .................................................................................... 17
2.5 Powder Manufacturing ....................................................................................................... 17
Kroll Process ................................................................................................................................ 17
Hydride-Dehydride Process......................................................................................................... 19
Plasma Atomisation .................................................................................................................... 20
Titanium Gas Atomisation (TGA) ................................................................................................. 21
Plasma Rotating Electrode Process (PREP) ................................................................................. 22
Powder Compaction ....................................................................................................................... 23
Axial die-pressing ........................................................................................................................ 24
Isostatic pressing ......................................................................................................................... 25
Powder Injection Moulding (PIM) ............................................................................................... 26
2.6 Sintering .............................................................................................................................. 27
Microstructures of Sintered Titanium Alloys............................................................................... 27
Parameters Affecting the Final Density of Sintered Samples ...................................................... 27
Parameters Affecting the Mechanical Properties of Powder Metallurgy Samples. ..................... 28
3.0 Project Risk Management Plan ............................................................................................... 30
4.0 Project Progress Timeline ....................................................................................................... 32
5.0 Experimental Procedures ........................................................................................................ 33
5.1 Preparation of Titanium and Titanium Manganese (Ti-Mn) Alloys...................................... 33
5.2 Determining Porosity .......................................................................................................... 34
5.3 Metallography Analysis ....................................................................................................... 36
5 | P a g e
6.0 Results ..................................................................................................................................... 37
6.1 Optical Microscope Examination......................................................................................... 37
6.2 Scanning Electron Microscopy, SEM Analysis ...................................................................... 38
........................................................................................................................................................ 39
........................................................................................................................................................ 39
........................................................................................................................................................ 40
........................................................................................................................................................ 40
6.3 Energy-dispersive X-ray spectroscopy, EDS analysis ........................................................... 42
6.4 Porosity ............................................................................................................................... 46
6.5 Volume Fraction of Phases .................................................................................................. 47
6.6 Grain Diameter .................................................................................................................... 48
7.0 Discussion ............................................................................................................................... 49
Ti-5Mn alloy: .................................................................................................................................. 49
Ti-10Mn: ......................................................................................................................................... 49
Ti-15Mn: ......................................................................................................................................... 50
Ti-20Mn: ......................................................................................................................................... 50
8.0 Conclusion ............................................................................................................................... 52
9.0 Recommendation .................................................................................................................... 53
References .......................................................................................................................................... 54
Appendix A .......................................................................................................................................... 58
6 | P a g e
1.0 Introduction
1.1 Project Significance
This study highlights the potential of titanium manganese alloy made via powder metallurgy
for biomedical applications specifically bone implants. Beta titanium, β-Ti alloys are a unique
type of group of Ti alloys as their characteristics are a combination of various beneficial traits.
Specifically, they have exceptional strength-to-density ratio, resistant towards corrosion and
crack propagation, outstanding fatigue properties, substantial hardenability [1]. There are
already titanium alloys such as Ti-6Al-4V, Ti-35Nb-4Sn and Ti-29Nb-13Ta-4.6Zr which are
being developed as ideal hard tissue replacements due to their low elastic modulus and high
strength [3]. However, elements such as vanadium, niobium and zirconium are associated with
high cost and supply risks as they are vastly used in other applications and are less abundant
than other earth elements [4]. Also, elements such as aluminium and vanadium have been
claimed to pose certain toxicity risks towards biological environments [5]. Manganese stands
out from all the other alloying elements due to certain aspects such as supply, cost, toxicity,
mechanical properties and feasibility. Due to its abundance on land and the seabed, supply is
virtually unlimited [7]. Moreover, according to the current market, manganese is significantly
cheaper than elements such as aluminium, niobium and vanadium and is readily available in
pure powder form for ease of production [8]. Powder metallurgy on the other hand, is a near
net shape manufacturing method which does not require melting to combine metals into an
alloy as heat is only needed to fuse the powder particles together [9]. This production technique
cuts cost, production time and complexity as well as overall energy usage to produce the alloy
[9]. A past study performed which involves a different type of alloy production shows that Ti-
9Mn showcases the best combination of elongation and tensile strength among other Ti-Mn
alloys of different weight ratios which is comparable to the currently used Ti-6Al-4V [4]. This
study on the other hand, analyses 5 samples namely pure Ti, Ti-5Mn, Ti-10Mn, Ti-15Mn, and
Ti-20Mn produced by compacting the thoroughly mixed Ti and Mn powder and sintering them
at 1200˚c for three hours. So far, a microstructural examination done shows that the grain
diameter of the beta-phases of the samples is comparable to the Ti-Mn alloys in the past results
[4]. The promising results obtained through this study and past researches shows that further
development of Ti-Mn alloys could potentially make them a good or even a better alternative
to the widely used Ti-6Al-4V in the biomedical field.
7 | P a g e
1.2 Purpose and Aims
Purpose
The purpose of this research is to develop a new βeta-titanium alloy specifically a titanium-
manganese alloy as a potential material in the biomedical field for applications involving fixing
or replacing the hard tissues or bones of the human body through powder metallurgy.
Aims
To develop a new low cost alternative for the conventional Ti-64ELI alloy used in the
biomedical field specifically bone replacement.
To develop a Titanium alloy that does not pose any health hazards to the human body
once implanted inside the body.
To develop a Titanium alloy that possess comparable mechanical properties to the
human bone.
To eliminate the necessity of using materials associated with supply risks as the alloying
elements such as vanadium, niobium and zirconium.
8 | P a g e
2.0 Background
2.1 Origin of Titanium In 1791, William Gregor discovered a new unidentified metallic element and named it
manaccanite while studying the mineral ilmenite. Later in 1795, Martin Klaproth renamed the
metal titanium as we know it today. Due to its high reactivity towards oxygen and nitrogen, it
was very difficult to synthesize pure titanium until the middle of the 20th century when the
commercially famous Kroll process was developed by J. W. Kroll around 1938 to 1940 in
Luxemburg [10]. This process is still one of the main methods of titanium production to this
date. It involves the reduction of titanium tetrachloride with magnesium under an inert gas
condition. Prior to Kroll’s process, there were known efforts to produce high purity titanium.
One of the earliest recorded methods were discovered by Nilsen and Peterson whereby
sodium was used as a reducing agent. This method was further refined and resulted in the
commercially known Hunter process. Around 1920, Anton Eduard van Arkel and Jan
Hendrik de Boer developed the crystal bar process which involved the reduction of titanium
tetra-iodide into pure titanium. Titanium tetra-chloride on the other hand, could be reduced
with hydrogen giving hydrides that could be transformed into pure metal through certain
thermal processes. Kroll used these findings to come up with his infamous process [10].
In the engineering realm, titanium and its alloys have a significant importance because of the
benefits that surpasses other metals. They have a higher strength to weight ratio compared to
aluminium and iron but still possess superior yield strength and resistance towards corrosion
[11]. These properties are the reason for their wide utilisation in the chemical industry where
corrosion resistance is vital, the aircraft and aerospace field where material of components
need to have high strengths and light weight at the same time [10]. Recent research also has
enabled titanium alloys to be used in the medical field where artificial bones, prosthetics and
artificial limbs need to be light weight, chemically inert and have similar strength and
toughness as the human hard tissue or bone [11]. Without the addition of stabilisers or other
alloying elements and under atmospheric pressure, titanium undergoes an allotropic
transformation from alpha to beta crystal structure at the transition temperature of around
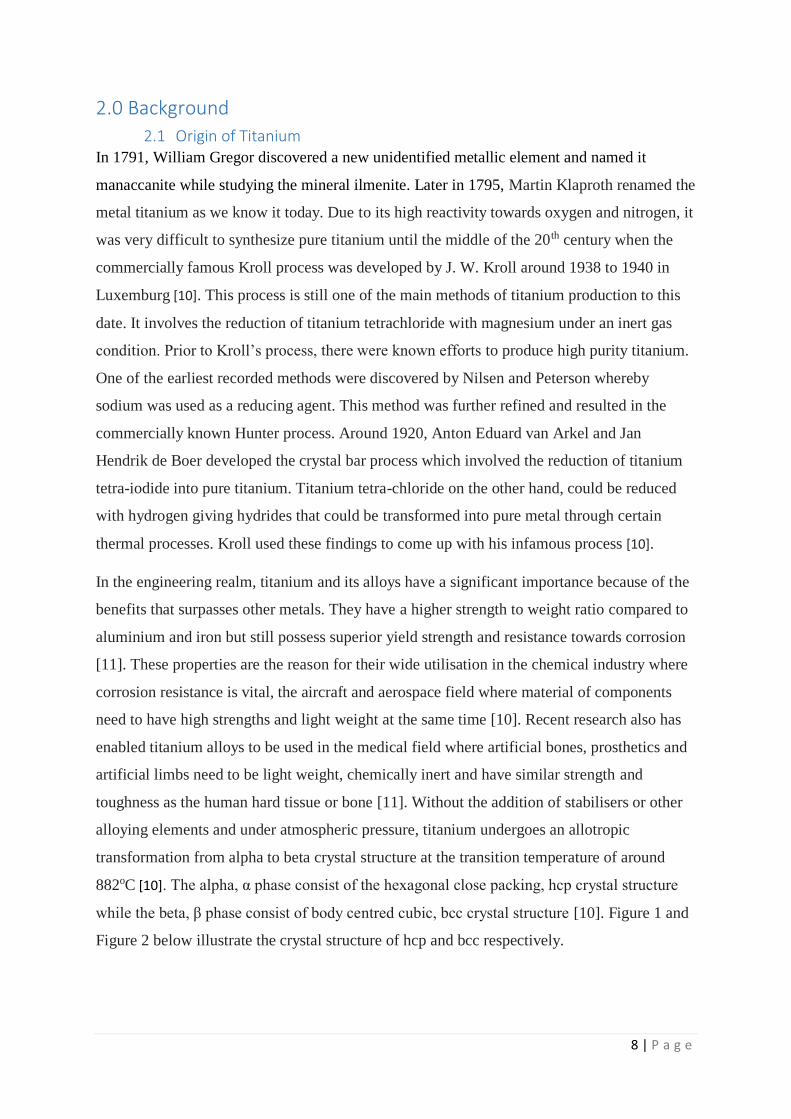
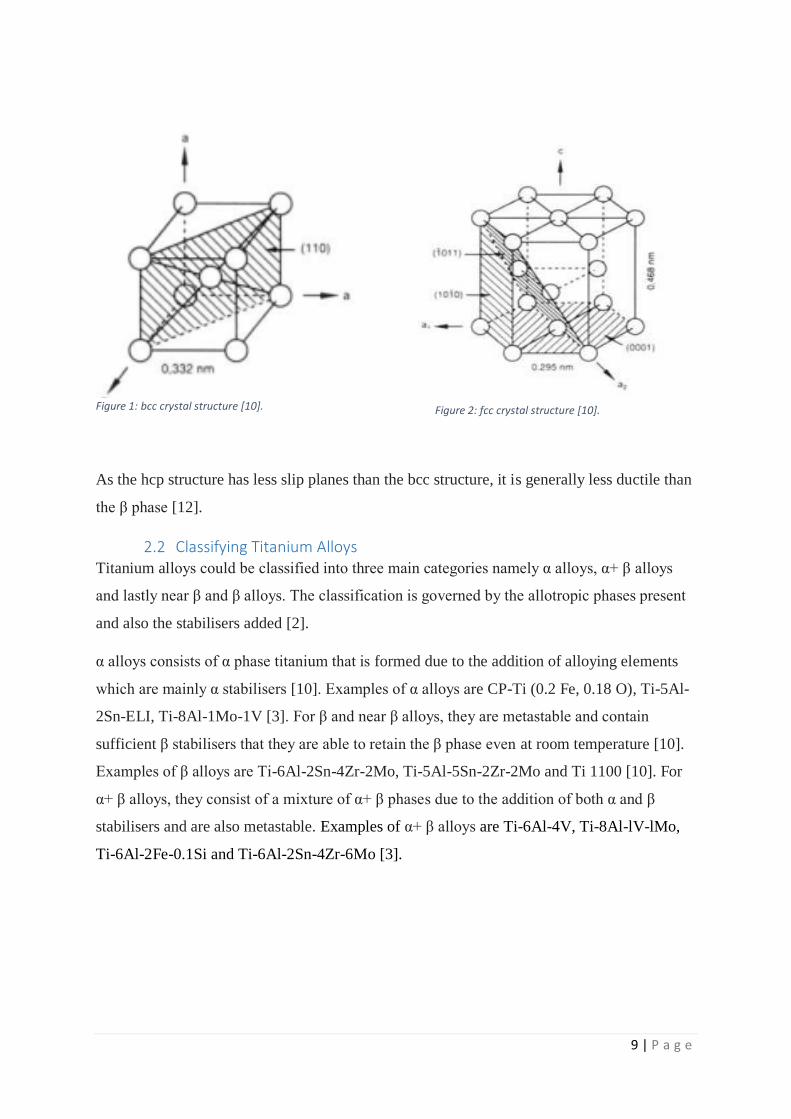
882oC [10]. The alpha, α phase consist of the hexagonal close packing, hcp crystal structure
while the beta, β phase consist of body centred cubic, bcc crystal structure [10]. Figure 1 and
Figure 2 below illustrate the crystal structure of hcp and bcc respectively.
9 | P a g e
As the hcp structure has less slip planes than the bcc structure, it is generally less ductile than
the β phase [12].
2.2 Classifying Titanium Alloys Titanium alloys could be classified into three main categories namely α alloys, α+ β alloys
and lastly near β and β alloys. The classification is governed by the allotropic phases present
and also the stabilisers added [2].
α alloys consists of α phase titanium that is formed due to the addition of alloying elements
which are mainly α stabilisers [10]. Examples of α alloys are CP-Ti (0.2 Fe, 0.18 O), Ti-5Al-
2Sn-ELI, Ti-8Al-1Mo-1V [3]. For β and near β alloys, they are metastable and contain
sufficient β stabilisers that they are able to retain the β phase even at room temperature [10].
Examples of β alloys are Ti-6Al-2Sn-4Zr-2Mo, Ti-5Al-5Sn-2Zr-2Mo and Ti 1100 [10]. For
α+ β alloys, they consist of a mixture of α+ β phases due to the addition of both α and β
stabilisers and are also metastable. Examples of α+ β alloys are Ti-6Al-4V, Ti-8Al-lV-lMo,
Ti-6Al-2Fe-0.1Si and Ti-6Al-2Sn-4Zr-6Mo [3].
Figure 1: bcc crystal structure [10]. Figure 2: fcc crystal structure [10].
10 | P a g e
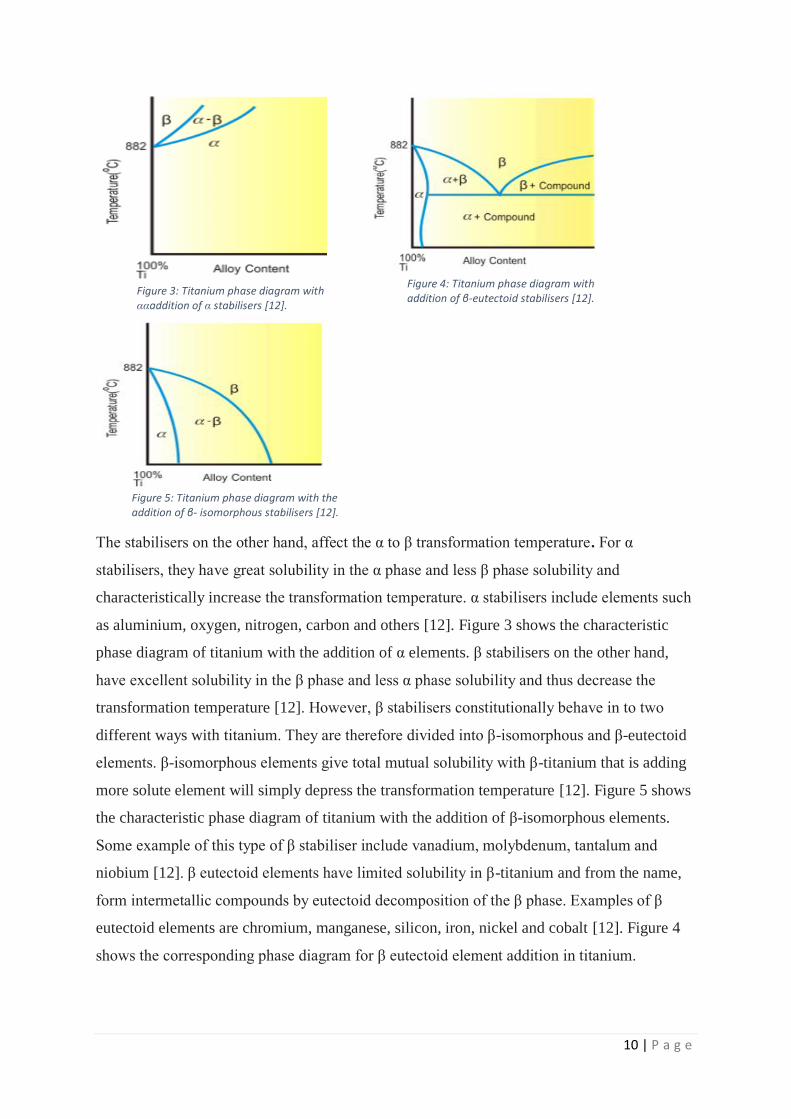
The stabilisers on the other hand, affect the α to β transformation temperature. For α
stabilisers, they have great solubility in the α phase and less β phase solubility and
characteristically increase the transformation temperature. α stabilisers include elements such
as aluminium, oxygen, nitrogen, carbon and others [12]. Figure 3 shows the characteristic
phase diagram of titanium with the addition of α elements. β stabilisers on the other hand,
have excellent solubility in the β phase and less α phase solubility and thus decrease the
transformation temperature [12]. However, β stabilisers constitutionally behave in to two
different ways with titanium. They are therefore divided into β-isomorphous and β-eutectoid
elements. β-isomorphous elements give total mutual solubility with β-titanium that is adding
more solute element will simply depress the transformation temperature [12]. Figure 5 shows
the characteristic phase diagram of titanium with the addition of β-isomorphous elements.
Some example of this type of β stabiliser include vanadium, molybdenum, tantalum and
niobium [12]. β eutectoid elements have limited solubility in β-titanium and from the name,
form intermetallic compounds by eutectoid decomposition of the β phase. Examples of β
eutectoid elements are chromium, manganese, silicon, iron, nickel and cobalt [12]. Figure 4
shows the corresponding phase diagram for β eutectoid element addition in titanium.
Figure 3: Titanium phase diagram with ααaddition of α stabilisers [12].
Figure 4: Titanium phase diagram with addition of β-eutectoid stabilisers [12].
Figure 5: Titanium phase diagram with the addition of β- isomorphous stabilisers [12].
11 | P a g e
2.3 Titanium Alloys for Biomedical Purposes
Brief History of Biomedical Implants
The first recorded use of titanium for osseointegration was in 1940 by Bothe, Davenport and
Beaten who performed a research on the application of titanium for animals and analysed the
feasibility of the foreign matter to fuse with bone [13]. Results obtained concluded that
titanium was a great candidate as a future material for prosthesis due to its excellent
mechanical properties specifically strength and hardness [13]. Also the results were evident
that it is possible to successfully introduce and integrate an artificial limb into a living body
without rejection [13]. However, not until the 1980’s that the idea of osseointegration was
accepted by the scientific and public community due to its benefits to the medical field [14].
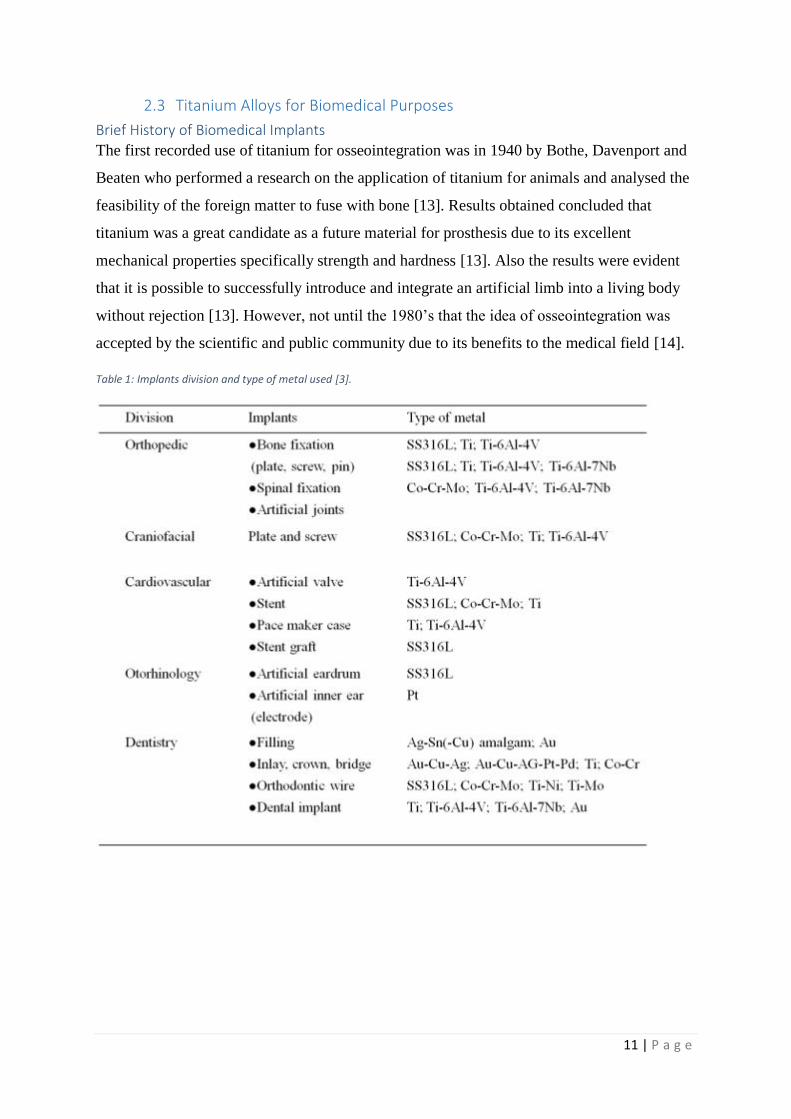
Table 1: Implants division and type of metal used [3].
12 | P a g e
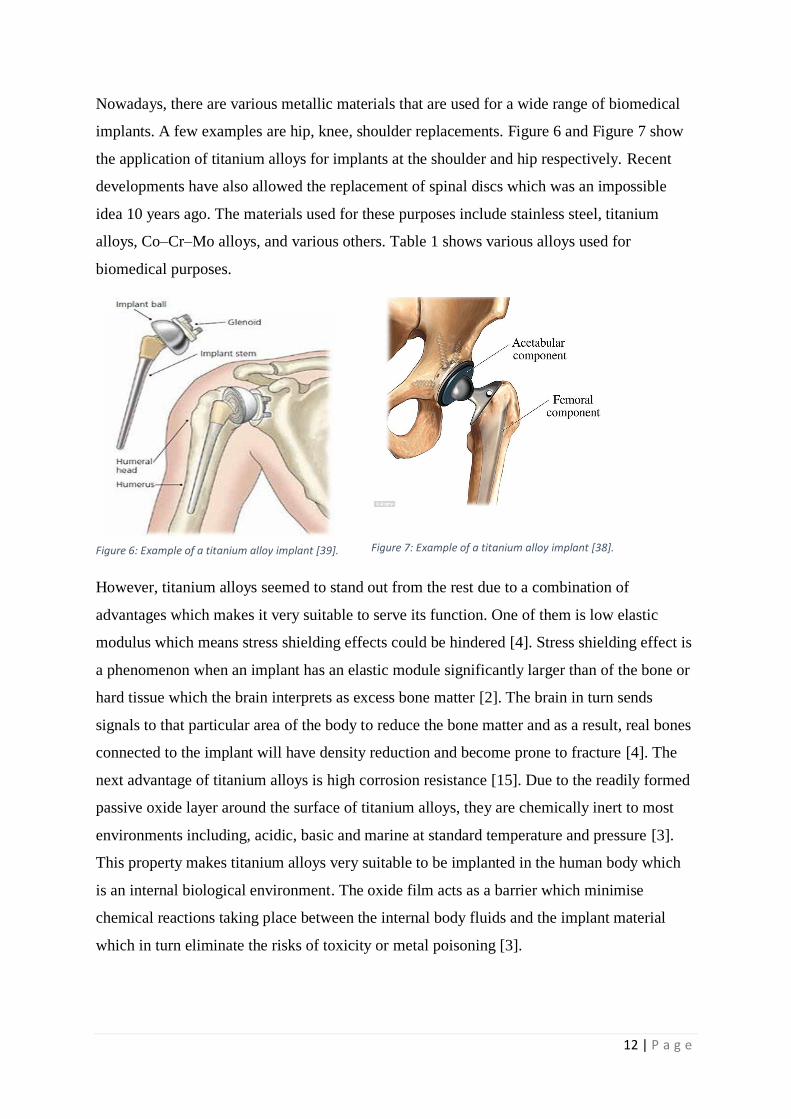
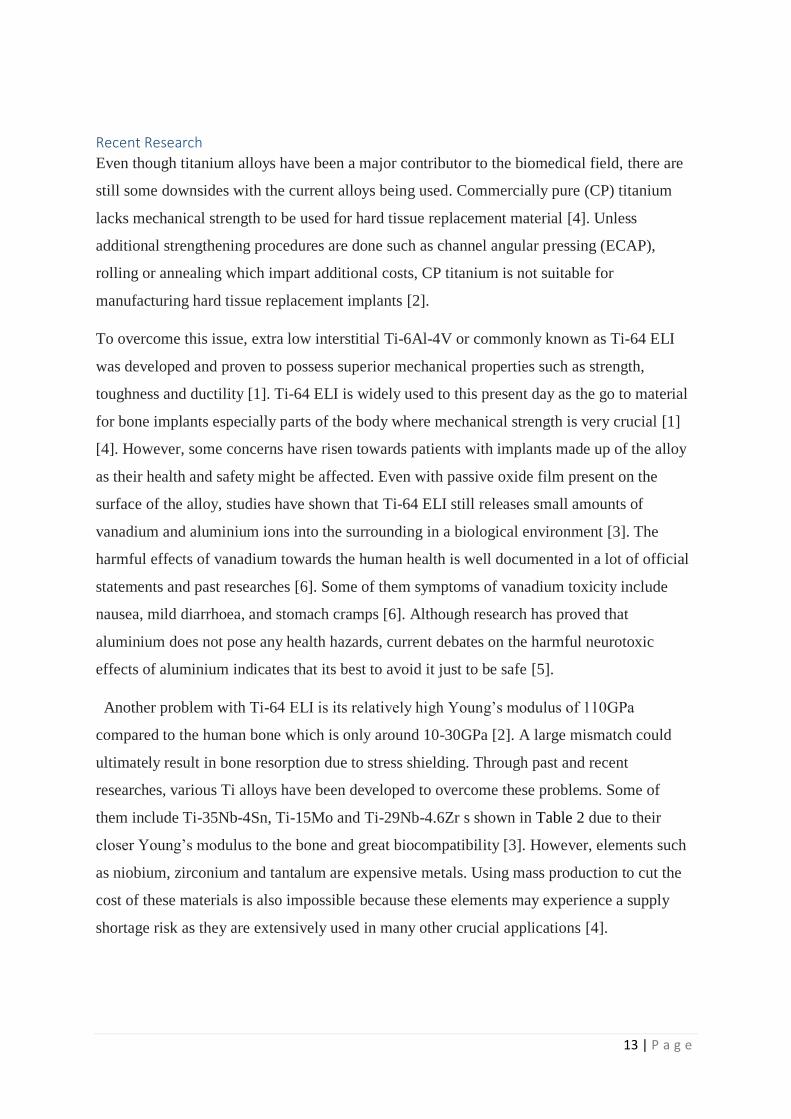
Nowadays, there are various metallic materials that are used for a wide range of biomedical
implants. A few examples are hip, knee, shoulder replacements. Figure 6 and Figure 7 show
the application of titanium alloys for implants at the shoulder and hip respectively. Recent
developments have also allowed the replacement of spinal discs which was an impossible
idea 10 years ago. The materials used for these purposes include stainless steel, titanium
alloys, Co–Cr–Mo alloys, and various others. Table 1 shows various alloys used for
biomedical purposes.
However, titanium alloys seemed to stand out from the rest due to a combination of
advantages which makes it very suitable to serve its function. One of them is low elastic
modulus which means stress shielding effects could be hindered [4]. Stress shielding effect is
a phenomenon when an implant has an elastic module significantly larger than of the bone or
hard tissue which the brain interprets as excess bone matter [2]. The brain in turn sends
signals to that particular area of the body to reduce the bone matter and as a result, real bones
connected to the implant will have density reduction and become prone to fracture [4]. The
next advantage of titanium alloys is high corrosion resistance [15]. Due to the readily formed
passive oxide layer around the surface of titanium alloys, they are chemically inert to most
environments including, acidic, basic and marine at standard temperature and pressure [3].
This property makes titanium alloys very suitable to be implanted in the human body which
is an internal biological environment. The oxide film acts as a barrier which minimise
chemical reactions taking place between the internal body fluids and the implant material
which in turn eliminate the risks of toxicity or metal poisoning [3].
Figure 6: Example of a titanium alloy implant [39]. Figure 7: Example of a titanium alloy implant [38].
13 | P a g e
Recent Research
Even though titanium alloys have been a major contributor to the biomedical field, there are
still some downsides with the current alloys being used. Commercially pure (CP) titanium
lacks mechanical strength to be used for hard tissue replacement material [4]. Unless
additional strengthening procedures are done such as channel angular pressing (ECAP),
rolling or annealing which impart additional costs, CP titanium is not suitable for
manufacturing hard tissue replacement implants [2].
To overcome this issue, extra low interstitial Ti-6Al-4V or commonly known as Ti-64 ELI
was developed and proven to possess superior mechanical properties such as strength,
toughness and ductility [1]. Ti-64 ELI is widely used to this present day as the go to material
for bone implants especially parts of the body where mechanical strength is very crucial [1]
[4]. However, some concerns have risen towards patients with implants made up of the alloy
as their health and safety might be affected. Even with passive oxide film present on the
surface of the alloy, studies have shown that Ti-64 ELI still releases small amounts of
vanadium and aluminium ions into the surrounding in a biological environment [3]. The
harmful effects of vanadium towards the human health is well documented in a lot of official
statements and past researches [6]. Some of them symptoms of vanadium toxicity include
nausea, mild diarrhoea, and stomach cramps [6]. Although research has proved that
aluminium does not pose any health hazards, current debates on the harmful neurotoxic
effects of aluminium indicates that its best to avoid it just to be safe [5].
Another problem with Ti-64 ELI is its relatively high Young’s modulus of 110GPa
compared to the human bone which is only around 10-30GPa [2]. A large mismatch could
ultimately result in bone resorption due to stress shielding. Through past and recent
researches, various Ti alloys have been developed to overcome these problems. Some of
them include Ti-35Nb-4Sn, Ti-15Mo and Ti-29Nb-4.6Zr s shown in Table 2 due to their
closer Young’s modulus to the bone and great biocompatibility [3]. However, elements such
as niobium, zirconium and tantalum are expensive metals. Using mass production to cut the
cost of these materials is also impossible because these elements may experience a supply
shortage risk as they are extensively used in many other crucial applications [4].
14 | P a g e
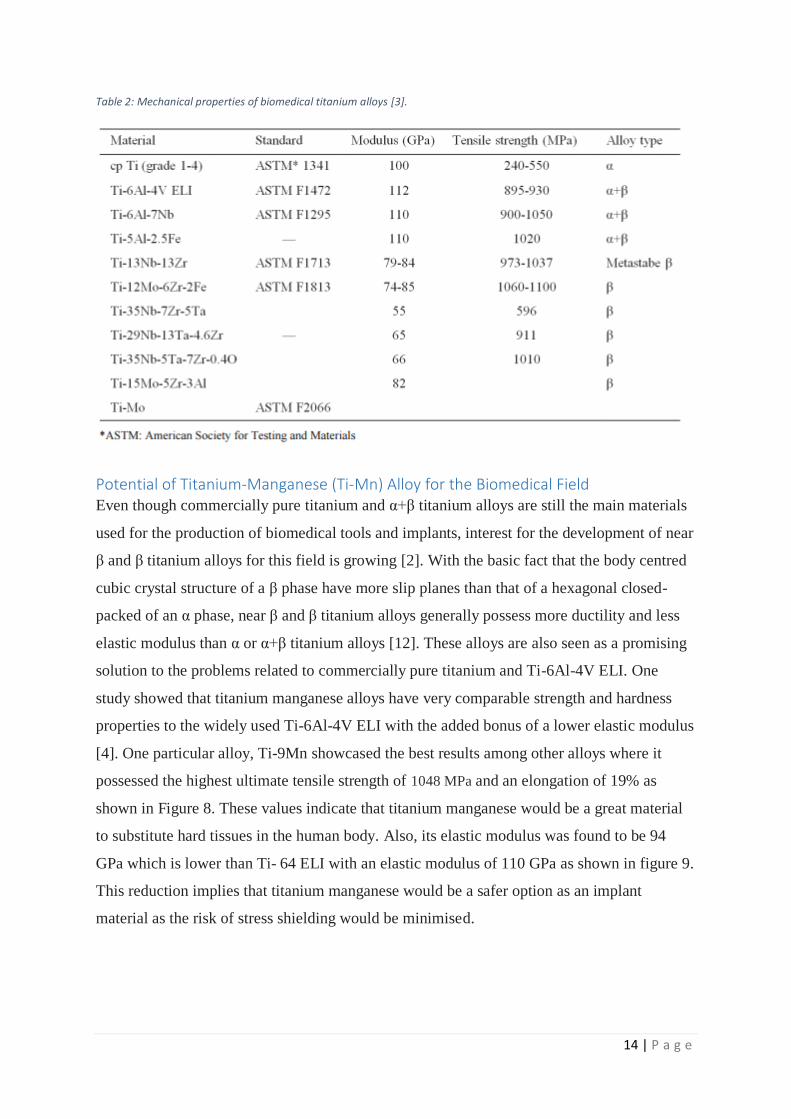
Table 2: Mechanical properties of biomedical titanium alloys [3].
Potential of Titanium-Manganese (Ti-Mn) Alloy for the Biomedical Field Even though commercially pure titanium and α+β titanium alloys are still the main materials
used for the production of biomedical tools and implants, interest for the development of near
β and β titanium alloys for this field is growing [2]. With the basic fact that the body centred
cubic crystal structure of a β phase have more slip planes than that of a hexagonal closed-
packed of an α phase, near β and β titanium alloys generally possess more ductility and less
elastic modulus than α or α+β titanium alloys [12]. These alloys are also seen as a promising
solution to the problems related to commercially pure titanium and Ti-6Al-4V ELI. One
study showed that titanium manganese alloys have very comparable strength and hardness
properties to the widely used Ti-6Al-4V ELI with the added bonus of a lower elastic modulus
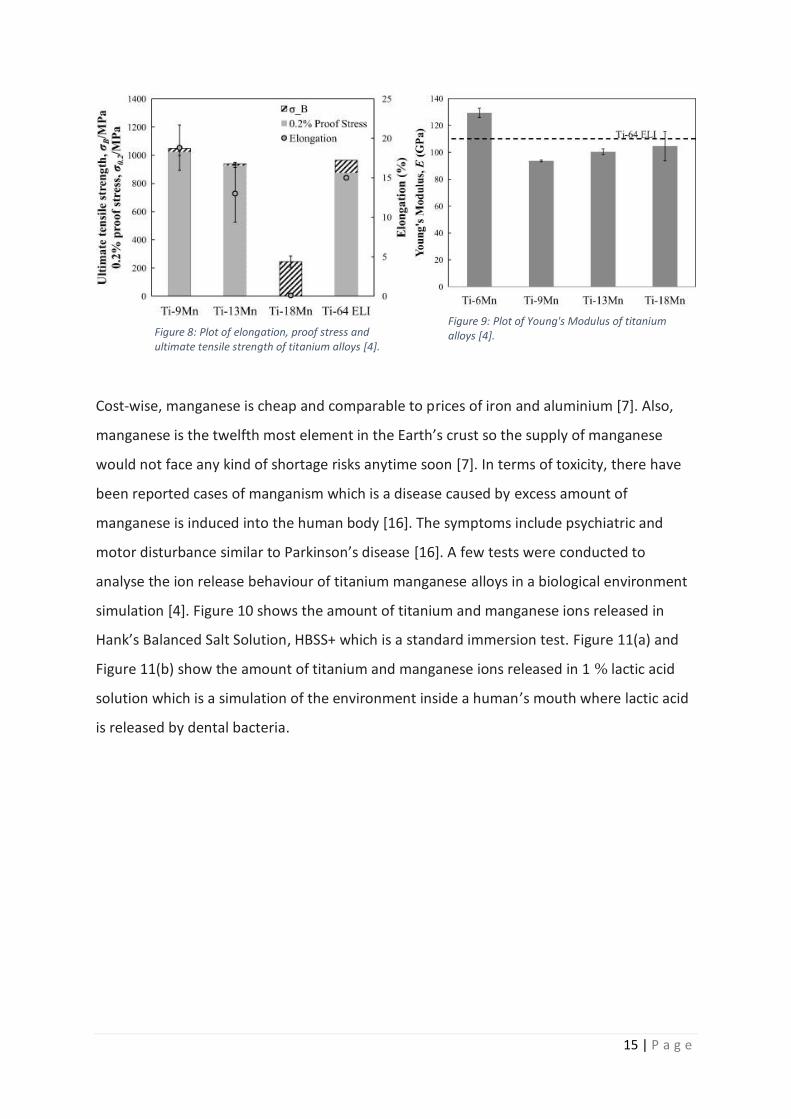
[4]. One particular alloy, Ti-9Mn showcased the best results among other alloys where it
possessed the highest ultimate tensile strength of 1048 MPa and an elongation of 19% as
shown in Figure 8. These values indicate that titanium manganese would be a great material
to substitute hard tissues in the human body. Also, its elastic modulus was found to be 94
GPa which is lower than Ti- 64 ELI with an elastic modulus of 110 GPa as shown in figure 9.
This reduction implies that titanium manganese would be a safer option as an implant
material as the risk of stress shielding would be minimised.
15 | P a g e
Cost-wise, manganese is cheap and comparable to prices of iron and aluminium [7]. Also,
manganese is the twelfth most element in the Earth’s crust so the supply of manganese
would not face any kind of shortage risks anytime soon [7]. In terms of toxicity, there have
been reported cases of manganism which is a disease caused by excess amount of
manganese is induced into the human body [16]. The symptoms include psychiatric and
motor disturbance similar to Parkinson’s disease [16]. A few tests were conducted to
analyse the ion release behaviour of titanium manganese alloys in a biological environment
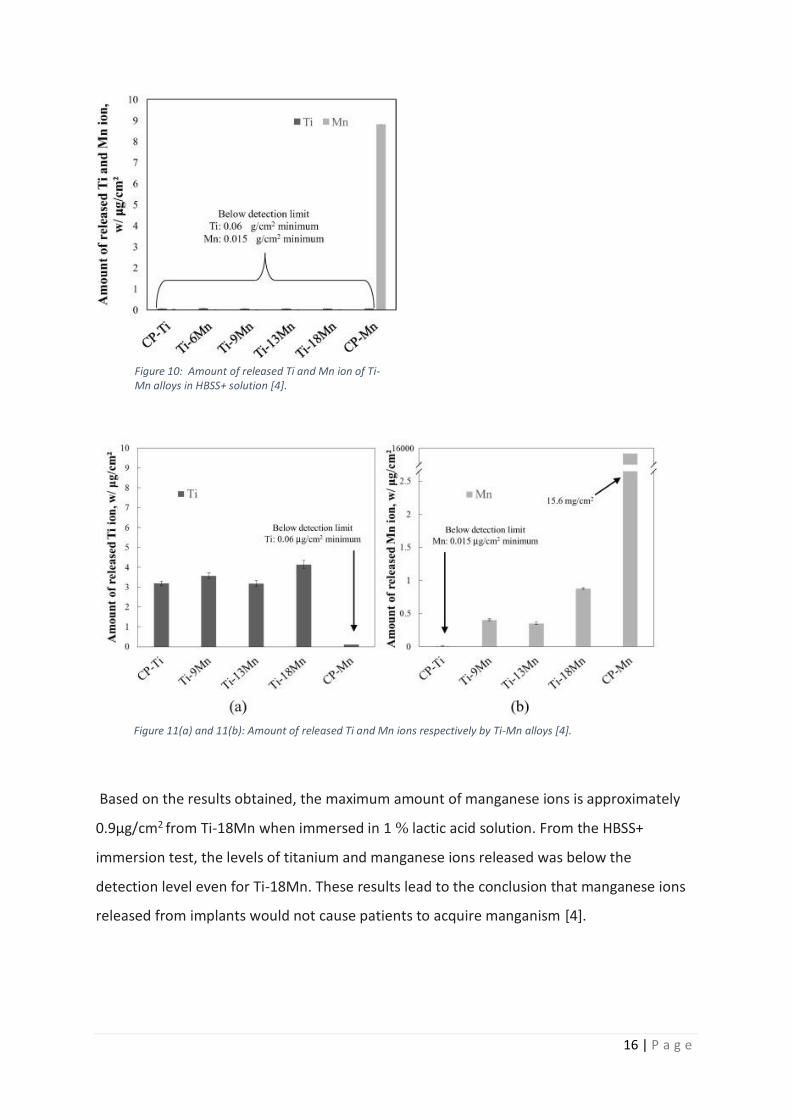
simulation [4]. Figure 10 shows the amount of titanium and manganese ions released in
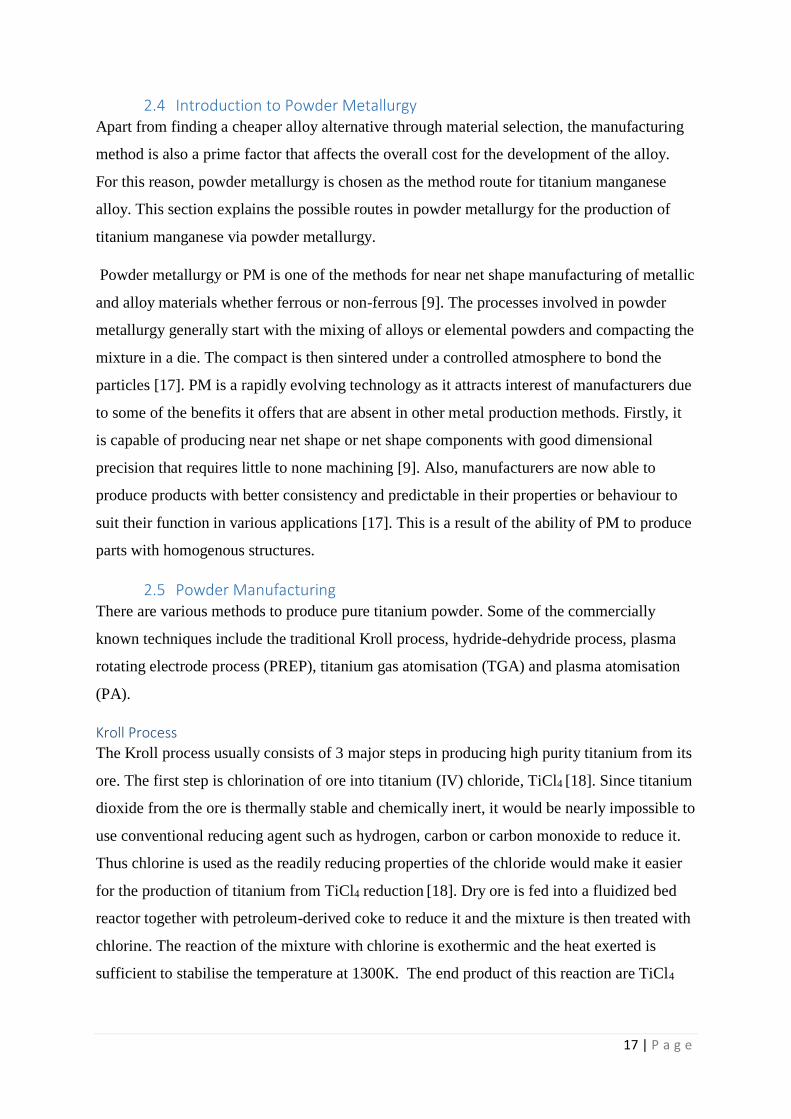
Hank’s Balanced Salt Solution, HBSS+ which is a standard immersion test. Figure 11(a) and
Figure 11(b) show the amount of titanium and manganese ions released in 1 % lactic acid
solution which is a simulation of the environment inside a human’s mouth where lactic acid
is released by dental bacteria.
Figure 8: Plot of elongation, proof stress and ultimate tensile strength of titanium alloys [4].
Figure 9: Plot of Young's Modulus of titanium alloys [4].
16 | P a g e
Based on the results obtained, the maximum amount of manganese ions is approximately
0.9μg/cm2 from Ti-18Mn when immersed in 1 % lactic acid solution. From the HBSS+
immersion test, the levels of titanium and manganese ions released was below the
detection level even for Ti-18Mn. These results lead to the conclusion that manganese ions
released from implants would not cause patients to acquire manganism [4].
Figure 10: Amount of released Ti and Mn ion of Ti-Mn alloys in HBSS+ solution [4].
Figure 11(a) and 11(b): Amount of released Ti and Mn ions respectively by Ti-Mn alloys [4].
17 | P a g e
2.4 Introduction to Powder Metallurgy Apart from finding a cheaper alloy alternative through material selection, the manufacturing
method is also a prime factor that affects the overall cost for the development of the alloy.
For this reason, powder metallurgy is chosen as the method route for titanium manganese
alloy. This section explains the possible routes in powder metallurgy for the production of
titanium manganese via powder metallurgy.
Powder metallurgy or PM is one of the methods for near net shape manufacturing of metallic
and alloy materials whether ferrous or non-ferrous [9]. The processes involved in powder
metallurgy generally start with the mixing of alloys or elemental powders and compacting the
mixture in a die. The compact is then sintered under a controlled atmosphere to bond the
particles [17]. PM is a rapidly evolving technology as it attracts interest of manufacturers due
to some of the benefits it offers that are absent in other metal production methods. Firstly, it
is capable of producing near net shape or net shape components with good dimensional
precision that requires little to none machining [9]. Also, manufacturers are now able to
produce products with better consistency and predictable in their properties or behaviour to
suit their function in various applications [17]. This is a result of the ability of PM to produce
parts with homogenous structures.
2.5 Powder Manufacturing There are various methods to produce pure titanium powder. Some of the commercially
known techniques include the traditional Kroll process, hydride-dehydride process, plasma
rotating electrode process (PREP), titanium gas atomisation (TGA) and plasma atomisation
(PA).
Kroll Process
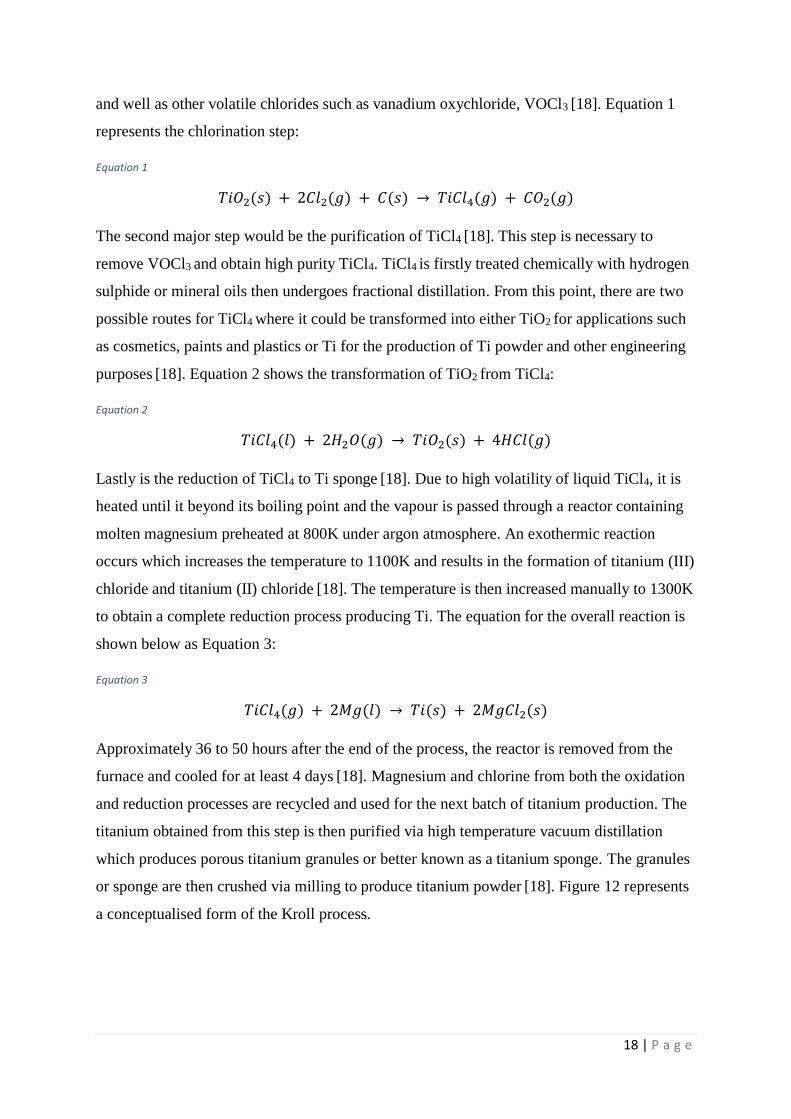
The Kroll process usually consists of 3 major steps in producing high purity titanium from its
ore. The first step is chlorination of ore into titanium (IV) chloride, TiCl4 [18]. Since titanium
dioxide from the ore is thermally stable and chemically inert, it would be nearly impossible to
use conventional reducing agent such as hydrogen, carbon or carbon monoxide to reduce it.
Thus chlorine is used as the readily reducing properties of the chloride would make it easier
for the production of titanium from TiCl4 reduction [18]. Dry ore is fed into a fluidized bed
reactor together with petroleum-derived coke to reduce it and the mixture is then treated with
chlorine. The reaction of the mixture with chlorine is exothermic and the heat exerted is
sufficient to stabilise the temperature at 1300K. The end product of this reaction are TiCl4
18 | P a g e
and well as other volatile chlorides such as vanadium oxychloride, VOCl3 [18]. Equation 1
represents the chlorination step:
Equation 1
𝑇𝑖𝑂2(𝑠) + 2𝐶𝑙2(𝑔) + 𝐶(𝑠) → 𝑇𝑖𝐶𝑙4(𝑔) + 𝐶𝑂2(𝑔)
The second major step would be the purification of TiCl4 [18]. This step is necessary to
remove VOCl3 and obtain high purity TiCl4. TiCl4 is firstly treated chemically with hydrogen
sulphide or mineral oils then undergoes fractional distillation. From this point, there are two
possible routes for TiCl4 where it could be transformed into either TiO2 for applications such
as cosmetics, paints and plastics or Ti for the production of Ti powder and other engineering
purposes [18]. Equation 2 shows the transformation of TiO2 from TiCl4:
Equation 2
𝑇𝑖𝐶𝑙4(𝑙) + 2𝐻2𝑂(𝑔) → 𝑇𝑖𝑂2(𝑠) + 4𝐻𝐶𝑙(𝑔)
Lastly is the reduction of TiCl4 to Ti sponge [18]. Due to high volatility of liquid TiCl4, it is
heated until it beyond its boiling point and the vapour is passed through a reactor containing
molten magnesium preheated at 800K under argon atmosphere. An exothermic reaction
occurs which increases the temperature to 1100K and results in the formation of titanium (III)
chloride and titanium (II) chloride [18]. The temperature is then increased manually to 1300K
to obtain a complete reduction process producing Ti. The equation for the overall reaction is
shown below as Equation 3:
Equation 3
𝑇𝑖𝐶𝑙4(𝑔) + 2𝑀𝑔(𝑙) → 𝑇𝑖(𝑠) + 2𝑀𝑔𝐶𝑙2(𝑠)
Approximately 36 to 50 hours after the end of the process, the reactor is removed from the
furnace and cooled for at least 4 days [18]. Magnesium and chlorine from both the oxidation
and reduction processes are recycled and used for the next batch of titanium production. The
titanium obtained from this step is then purified via high temperature vacuum distillation
which produces porous titanium granules or better known as a titanium sponge. The granules
or sponge are then crushed via milling to produce titanium powder [18]. Figure 12 represents
a conceptualised form of the Kroll process.
19 | P a g e
Hydride-Dehydride Process
One of the most commercial and economical routes of preparing titanium powder would be
the hydride de-hydride process [19]. This process is relatively low cost because it does not
involve any atomization procedure thus excluding the need of expensive atomizing
equipment. Basically, hydrogen gas is passed through a titanium sponge or under atmospheric
pressure at 300-500 °C [20]. Another variant to this process would be using titanium powder
instead of the sponge form and heating the powder to 700 °C under hydrogen atmosphere.
The ideal reaction for the formation of titanium hydride is shown by equation 4:
Equation 4
𝑇𝑖 + 𝐻2 → 𝑇𝑖𝐻2
This process leads to reaction of titanium and hydrogen producing titanium hydride and
excess unreacted hydrogen occupies any vacancy in the sponge structure [19]. The colour of
Figure 12: Visual concept of Kroll's process [18].
20 | P a g e
the titanium sponge changes from light grey to a blackish grey and the brittle end product is
ground to powder form through milling and the actual composition of the powder is TiH1.95
[20]. For the de-hydride process, it is the reverse of the hydride process and the reaction is
based on equation 5: Equation 5
𝑇𝑖𝐻2 → 𝑇𝑖 + 𝐻2
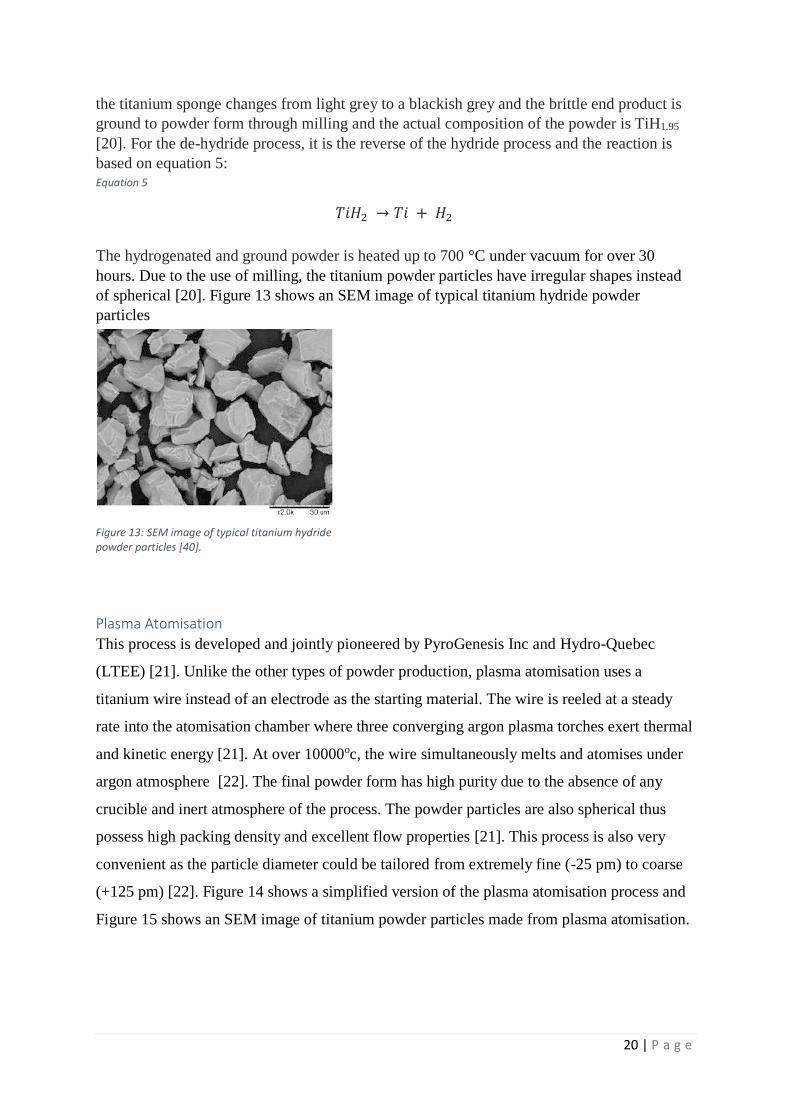
The hydrogenated and ground powder is heated up to 700 °C under vacuum for over 30
hours. Due to the use of milling, the titanium powder particles have irregular shapes instead
of spherical [20]. Figure 13 shows an SEM image of typical titanium hydride powder
particles
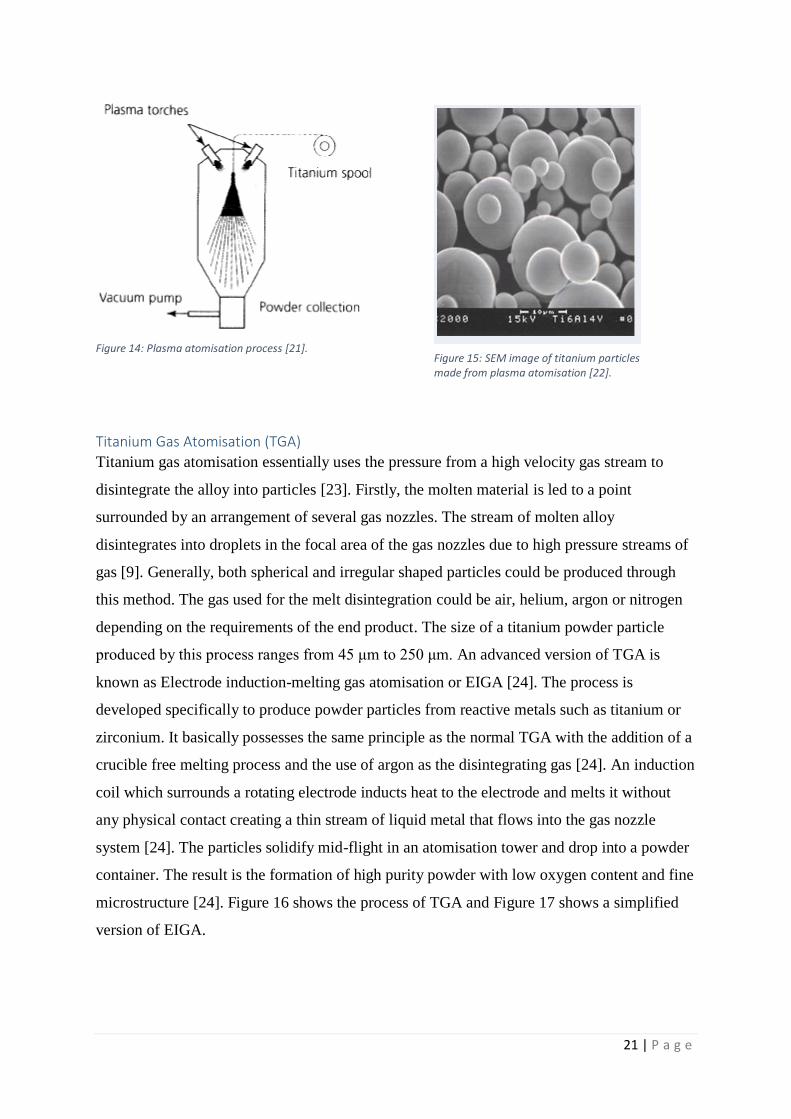
Plasma Atomisation
This process is developed and jointly pioneered by PyroGenesis Inc and Hydro-Quebec
(LTEE) [21]. Unlike the other types of powder production, plasma atomisation uses a
titanium wire instead of an electrode as the starting material. The wire is reeled at a steady
rate into the atomisation chamber where three converging argon plasma torches exert thermal
and kinetic energy [21]. At over 10000oc, the wire simultaneously melts and atomises under
argon atmosphere [22]. The final powder form has high purity due to the absence of any
crucible and inert atmosphere of the process. The powder particles are also spherical thus
possess high packing density and excellent flow properties [21]. This process is also very
convenient as the particle diameter could be tailored from extremely fine (-25 pm) to coarse
(+125 pm) [22]. Figure 14 shows a simplified version of the plasma atomisation process and
Figure 15 shows an SEM image of titanium powder particles made from plasma atomisation.
Figure 13: SEM image of typical titanium hydride powder particles [40].
21 | P a g e
Titanium Gas Atomisation (TGA)
Titanium gas atomisation essentially uses the pressure from a high velocity gas stream to
disintegrate the alloy into particles [23]. Firstly, the molten material is led to a point
surrounded by an arrangement of several gas nozzles. The stream of molten alloy
disintegrates into droplets in the focal area of the gas nozzles due to high pressure streams of
gas [9]. Generally, both spherical and irregular shaped particles could be produced through
this method. The gas used for the melt disintegration could be air, helium, argon or nitrogen
depending on the requirements of the end product. The size of a titanium powder particle
produced by this process ranges from 45 μm to 250 μm. An advanced version of TGA is
known as Electrode induction-melting gas atomisation or EIGA [24]. The process is
developed specifically to produce powder particles from reactive metals such as titanium or
zirconium. It basically possesses the same principle as the normal TGA with the addition of a
crucible free melting process and the use of argon as the disintegrating gas [24]. An induction
coil which surrounds a rotating electrode inducts heat to the electrode and melts it without
any physical contact creating a thin stream of liquid metal that flows into the gas nozzle
system [24]. The particles solidify mid-flight in an atomisation tower and drop into a powder
container. The result is the formation of high purity powder with low oxygen content and fine
microstructure [24]. Figure 16 shows the process of TGA and Figure 17 shows a simplified
version of EIGA.
Figure 14: Plasma atomisation process [21]. Figure 15: SEM image of titanium particles made from plasma atomisation [22].
22 | P a g e
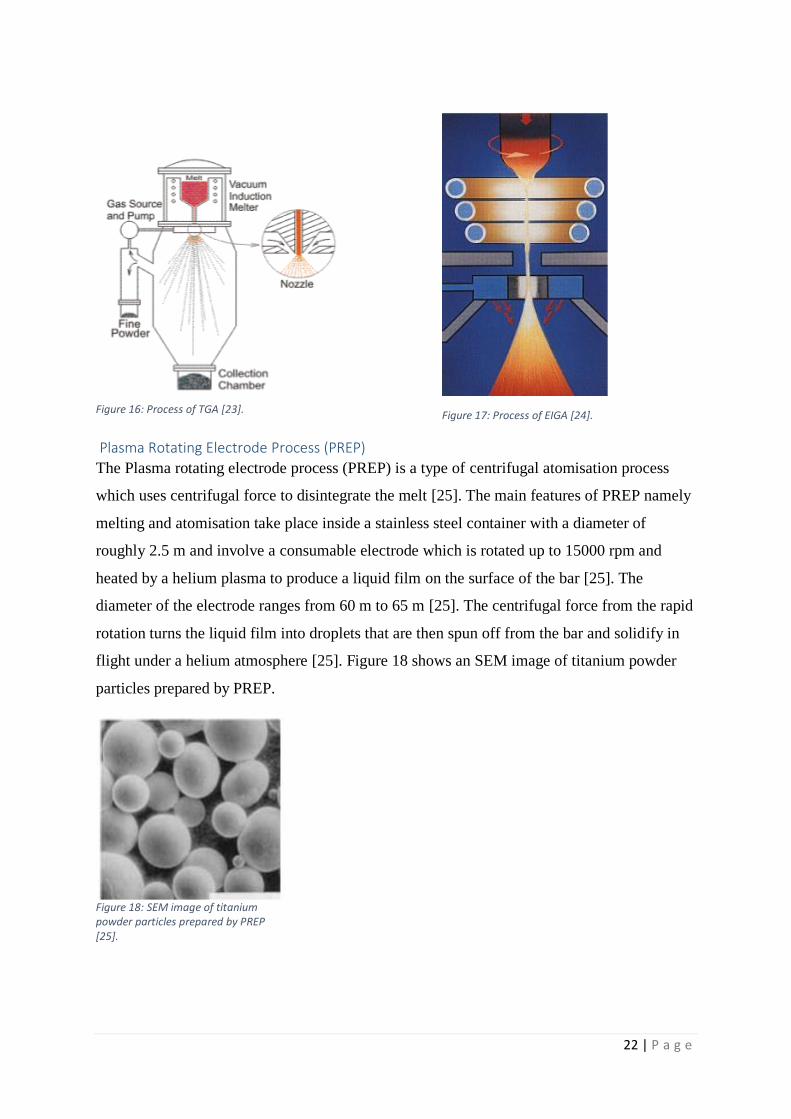
Plasma Rotating Electrode Process (PREP)
The Plasma rotating electrode process (PREP) is a type of centrifugal atomisation process
which uses centrifugal force to disintegrate the melt [25]. The main features of PREP namely
melting and atomisation take place inside a stainless steel container with a diameter of
roughly 2.5 m and involve a consumable electrode which is rotated up to 15000 rpm and
heated by a helium plasma to produce a liquid film on the surface of the bar [25]. The
diameter of the electrode ranges from 60 m to 65 m [25]. The centrifugal force from the rapid
rotation turns the liquid film into droplets that are then spun off from the bar and solidify in
flight under a helium atmosphere [25]. Figure 18 shows an SEM image of titanium powder
particles prepared by PREP.
Figure 16: Process of TGA [23]. Figure 17: Process of EIGA [24].
Figure 18: SEM image of titanium powder particles prepared by PREP [25].
23 | P a g e
The resulting PREP powder has excellent flow properties, is spherical and has a tap density
of 65% from the theoretical density [25]. The size of each powder particle depends on the
various parameters of the process such as the alloy composition, electrode diameter and the
rotational speed of the electrode [25]. The typical size for a typical powder particle prepared
by PREP ranges between 100 μm to 300 μm. Due to the desire of achieving smaller and
smaller particle diameter, various modifications are performed to this process to decrease the
diameter of powder particles [25]. One of the modifications include using a large diameter
electrode instead of bar-shaped which was proved to have decreased the mean particle size by
over 40% [25]. Another technique involves quenching the melted droplets into liquid argon
which also produced almost similar results [25].
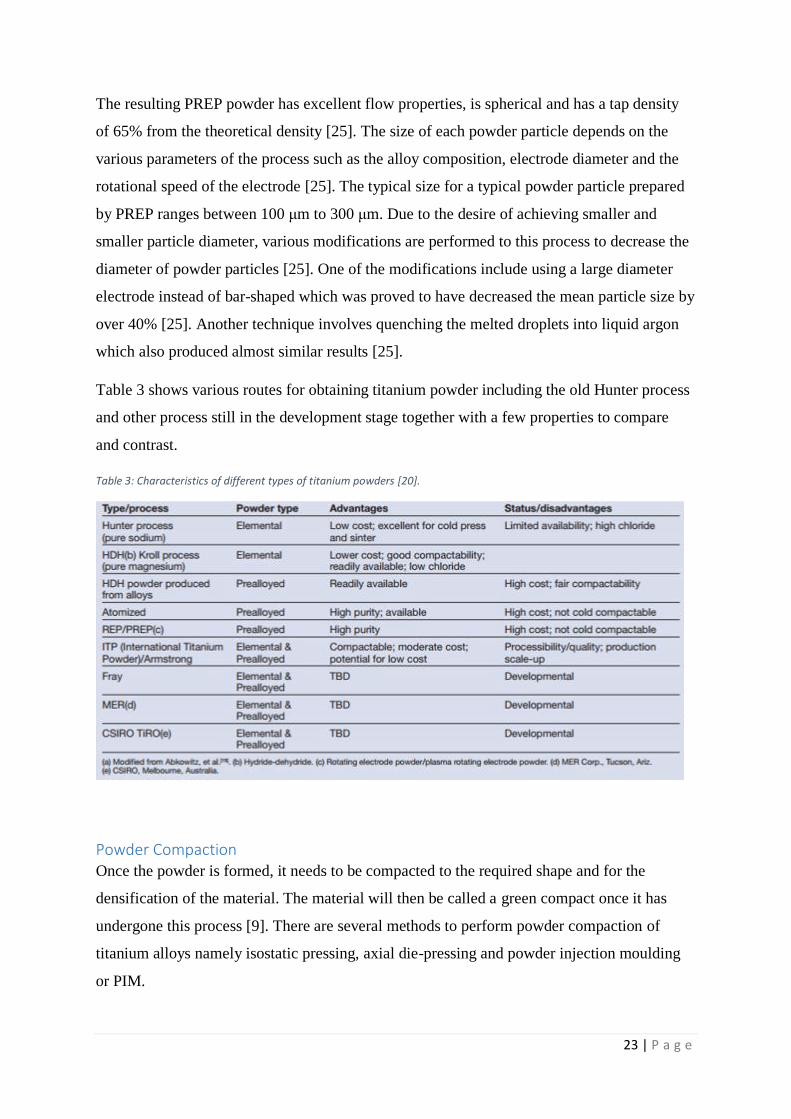
Table 3 shows various routes for obtaining titanium powder including the old Hunter process
and other process still in the development stage together with a few properties to compare
and contrast.
Table 3: Characteristics of different types of titanium powders [20].
Powder Compaction Once the powder is formed, it needs to be compacted to the required shape and for the
densification of the material. The material will then be called a green compact once it has
undergone this process [9]. There are several methods to perform powder compaction of
titanium alloys namely isostatic pressing, axial die-pressing and powder injection moulding
or PIM.
24 | P a g e
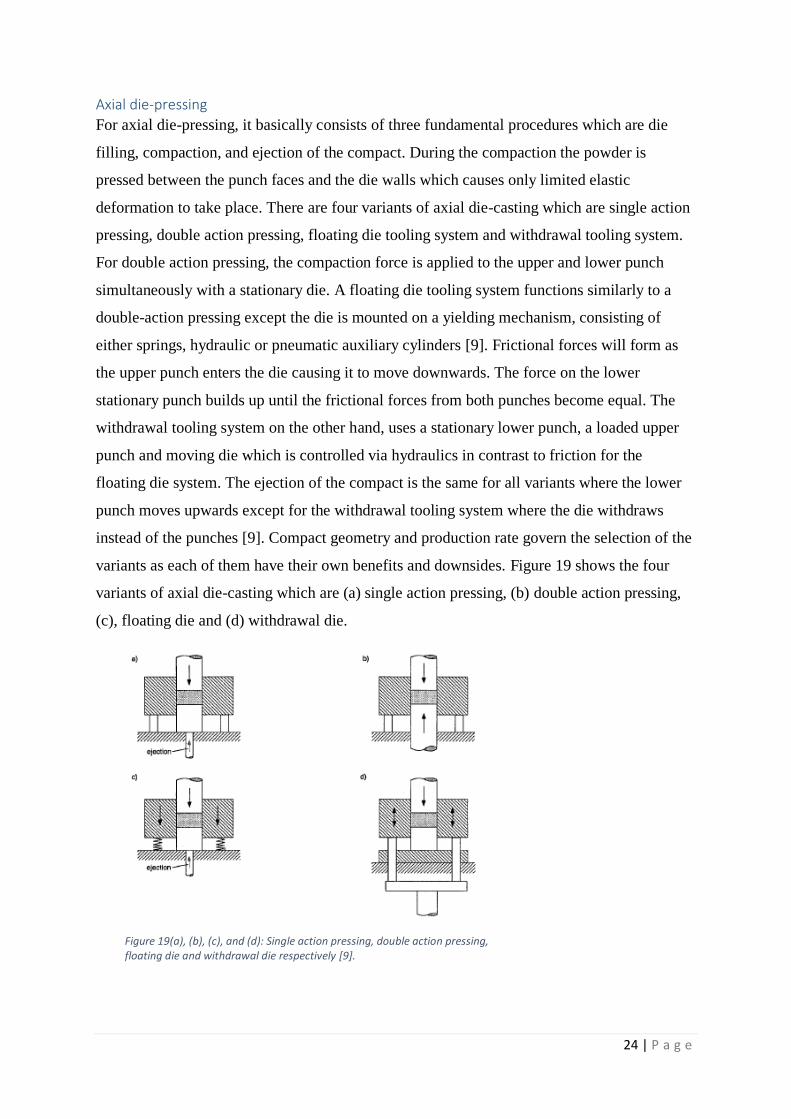
Axial die-pressing
For axial die-pressing, it basically consists of three fundamental procedures which are die
filling, compaction, and ejection of the compact. During the compaction the powder is
pressed between the punch faces and the die walls which causes only limited elastic
deformation to take place. There are four variants of axial die-casting which are single action
pressing, double action pressing, floating die tooling system and withdrawal tooling system.
For double action pressing, the compaction force is applied to the upper and lower punch
simultaneously with a stationary die. A floating die tooling system functions similarly to a
double-action pressing except the die is mounted on a yielding mechanism, consisting of
either springs, hydraulic or pneumatic auxiliary cylinders [9]. Frictional forces will form as
the upper punch enters the die causing it to move downwards. The force on the lower
stationary punch builds up until the frictional forces from both punches become equal. The
withdrawal tooling system on the other hand, uses a stationary lower punch, a loaded upper
punch and moving die which is controlled via hydraulics in contrast to friction for the
floating die system. The ejection of the compact is the same for all variants where the lower
punch moves upwards except for the withdrawal tooling system where the die withdraws
instead of the punches [9]. Compact geometry and production rate govern the selection of the
variants as each of them have their own benefits and downsides. Figure 19 shows the four
variants of axial die-casting which are (a) single action pressing, (b) double action pressing,
(c), floating die and (d) withdrawal die.
Figure 19(a), (b), (c), and (d): Single action pressing, double action pressing, floating die and withdrawal die respectively [9].
25 | P a g e
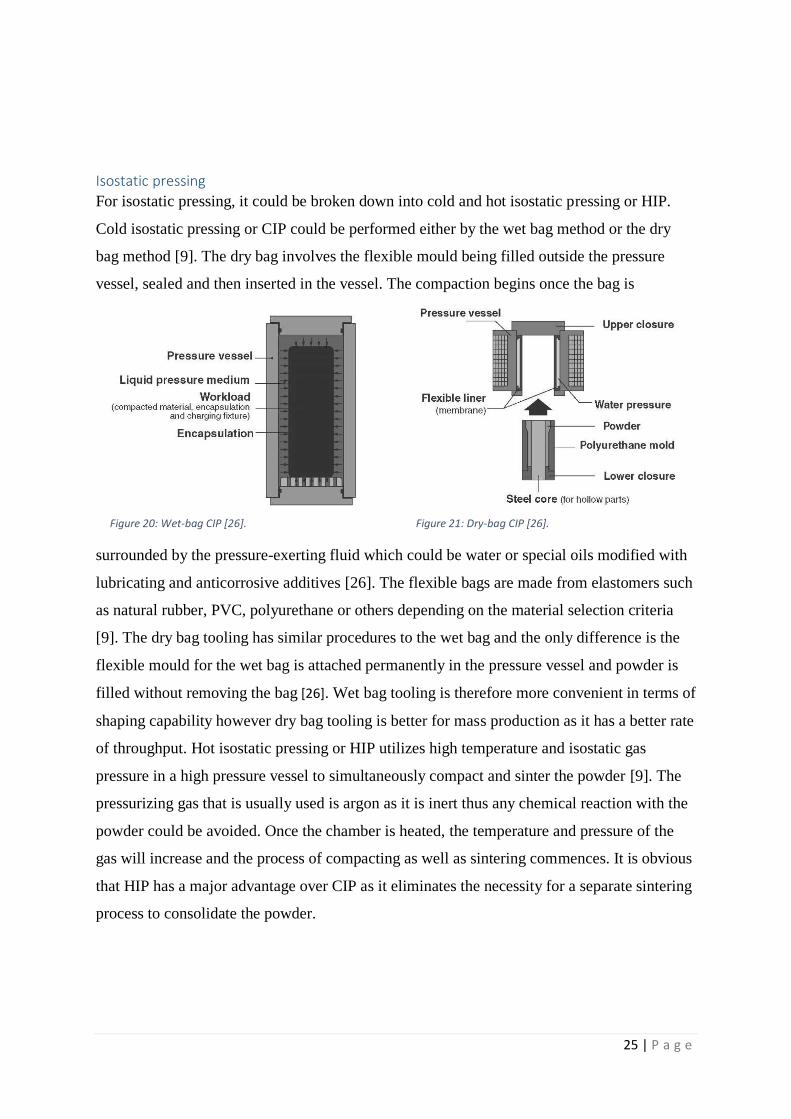
Isostatic pressing
For isostatic pressing, it could be broken down into cold and hot isostatic pressing or HIP.
Cold isostatic pressing or CIP could be performed either by the wet bag method or the dry
bag method [9]. The dry bag involves the flexible mould being filled outside the pressure
vessel, sealed and then inserted in the vessel. The compaction begins once the bag is
surrounded by the pressure-exerting fluid which could be water or special oils modified with
lubricating and anticorrosive additives [26]. The flexible bags are made from elastomers such
as natural rubber, PVC, polyurethane or others depending on the material selection criteria
[9]. The dry bag tooling has similar procedures to the wet bag and the only difference is the
flexible mould for the wet bag is attached permanently in the pressure vessel and powder is
filled without removing the bag [26]. Wet bag tooling is therefore more convenient in terms of
shaping capability however dry bag tooling is better for mass production as it has a better rate
of throughput. Hot isostatic pressing or HIP utilizes high temperature and isostatic gas
pressure in a high pressure vessel to simultaneously compact and sinter the powder [9]. The
pressurizing gas that is usually used is argon as it is inert thus any chemical reaction with the
powder could be avoided. Once the chamber is heated, the temperature and pressure of the
gas will increase and the process of compacting as well as sintering commences. It is obvious
that HIP has a major advantage over CIP as it eliminates the necessity for a separate sintering
process to consolidate the powder.
Figure 20: Wet-bag CIP [26]. Figure 21: Dry-bag CIP [26].
26 | P a g e
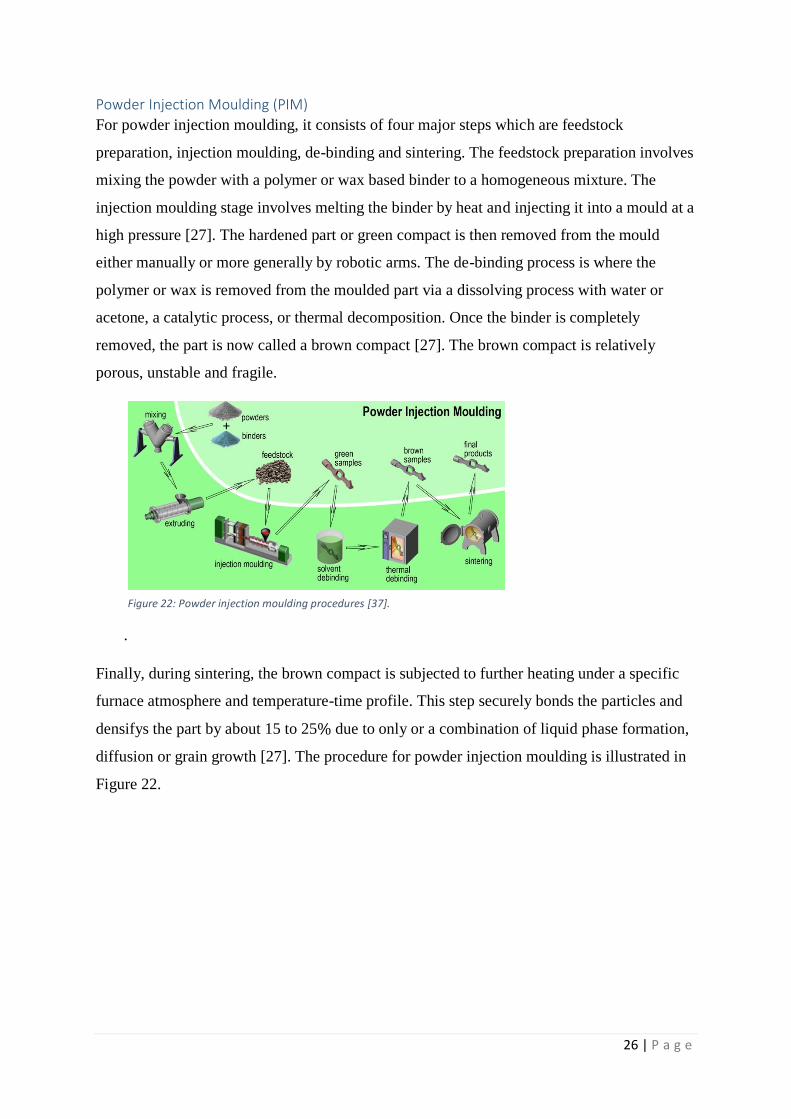
Powder Injection Moulding (PIM)
For powder injection moulding, it consists of four major steps which are feedstock
preparation, injection moulding, de-binding and sintering. The feedstock preparation involves
mixing the powder with a polymer or wax based binder to a homogeneous mixture. The
injection moulding stage involves melting the binder by heat and injecting it into a mould at a
high pressure [27]. The hardened part or green compact is then removed from the mould
either manually or more generally by robotic arms. The de-binding process is where the
polymer or wax is removed from the moulded part via a dissolving process with water or
acetone, a catalytic process, or thermal decomposition. Once the binder is completely
removed, the part is now called a brown compact [27]. The brown compact is relatively
porous, unstable and fragile.
.
Finally, during sintering, the brown compact is subjected to further heating under a specific
furnace atmosphere and temperature-time profile. This step securely bonds the particles and
densifys the part by about 15 to 25% due to only or a combination of liquid phase formation,
diffusion or grain growth [27]. The procedure for powder injection moulding is illustrated in
Figure 22.
Figure 22: Powder injection moulding procedures [37].
27 | P a g e
2.6 Sintering As mentioned before in powder injection moulding and hot isostatic pressing, sintering is
somewhat the final process of powder metallurgy if no post machining is required for a metal.
It involves heating the compact at a temperature below the melting temperature of the major
constituent in the powder compact. This causes diffusion and necks to form at contact points
of the particles as well as reduction of the pore size which impart strength and integrity [9].
There are usually two pre-sintering processes that happen before the actual sintering is
undergone. They are surface oxides reduction from the particles and removal of compacting
lubricant through burning or evaporation if any lubricant is used similar to PIM [9]. These
steps and sintering itself usually take place as one continuous process inside a furnace
through a carefully controlled furnace atmosphere and temperature rate [17].
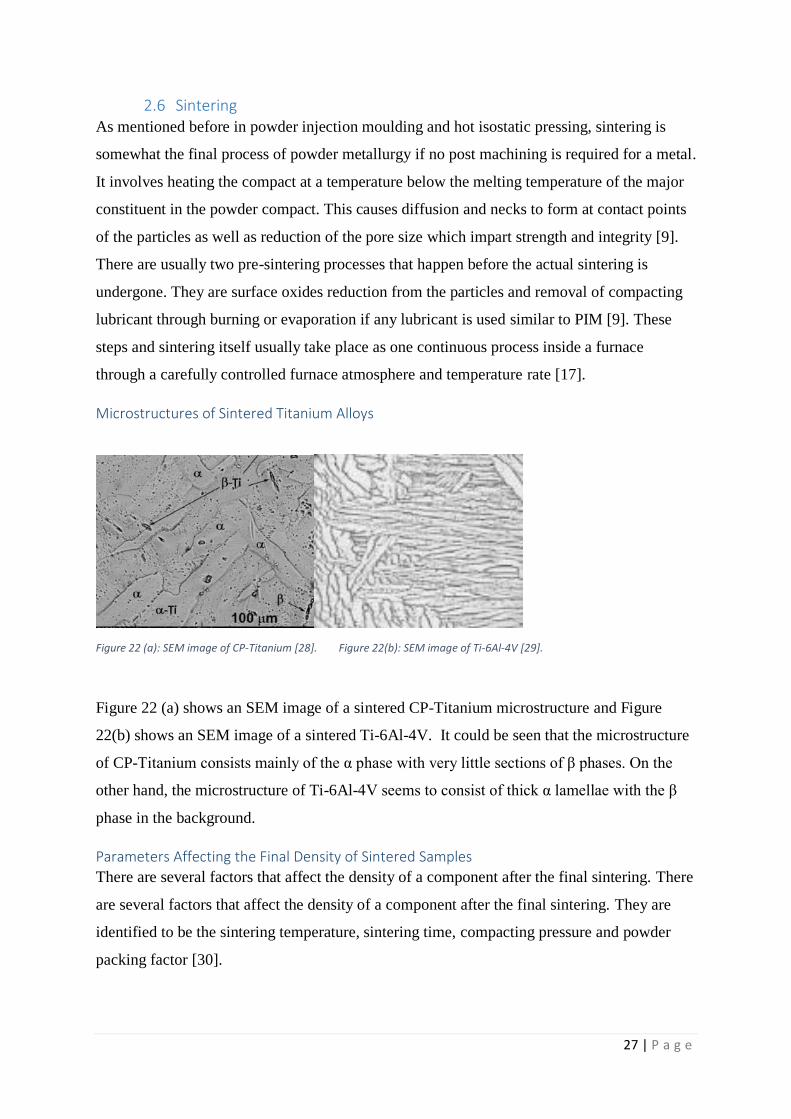
Microstructures of Sintered Titanium Alloys
Figure 22 (a): SEM image of CP-Titanium [28]. Figure 22(b): SEM image of Ti-6Al-4V [29].
Figure 22 (a) shows an SEM image of a sintered CP-Titanium microstructure and Figure
22(b) shows an SEM image of a sintered Ti-6Al-4V. It could be seen that the microstructure
of CP-Titanium consists mainly of the α phase with very little sections of β phases. On the
other hand, the microstructure of Ti-6Al-4V seems to consist of thick α lamellae with the β
phase in the background.
Parameters Affecting the Final Density of Sintered Samples
There are several factors that affect the density of a component after the final sintering. There
are several factors that affect the density of a component after the final sintering. They are
identified to be the sintering temperature, sintering time, compacting pressure and powder
packing factor [30].
28 | P a g e
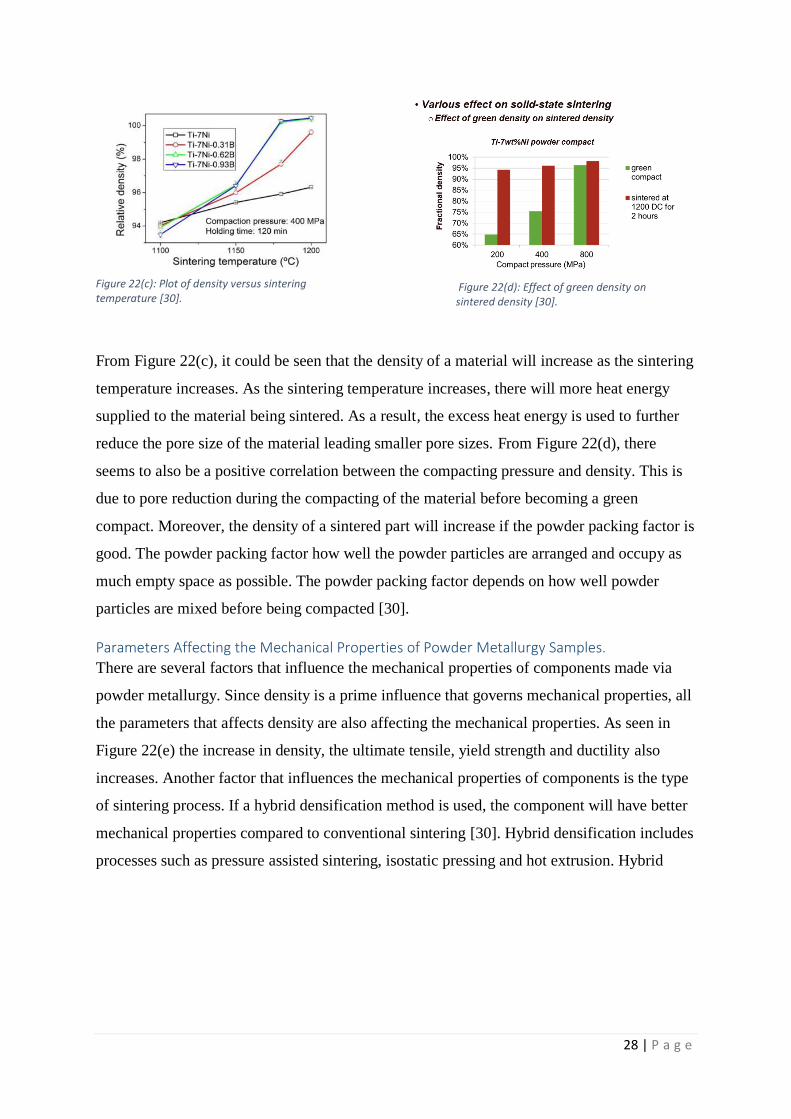
From Figure 22(c), it could be seen that the density of a material will increase as the sintering
temperature increases. As the sintering temperature increases, there will more heat energy
supplied to the material being sintered. As a result, the excess heat energy is used to further
reduce the pore size of the material leading smaller pore sizes. From Figure 22(d), there
seems to also be a positive correlation between the compacting pressure and density. This is
due to pore reduction during the compacting of the material before becoming a green
compact. Moreover, the density of a sintered part will increase if the powder packing factor is
good. The powder packing factor how well the powder particles are arranged and occupy as
much empty space as possible. The powder packing factor depends on how well powder
particles are mixed before being compacted [30].
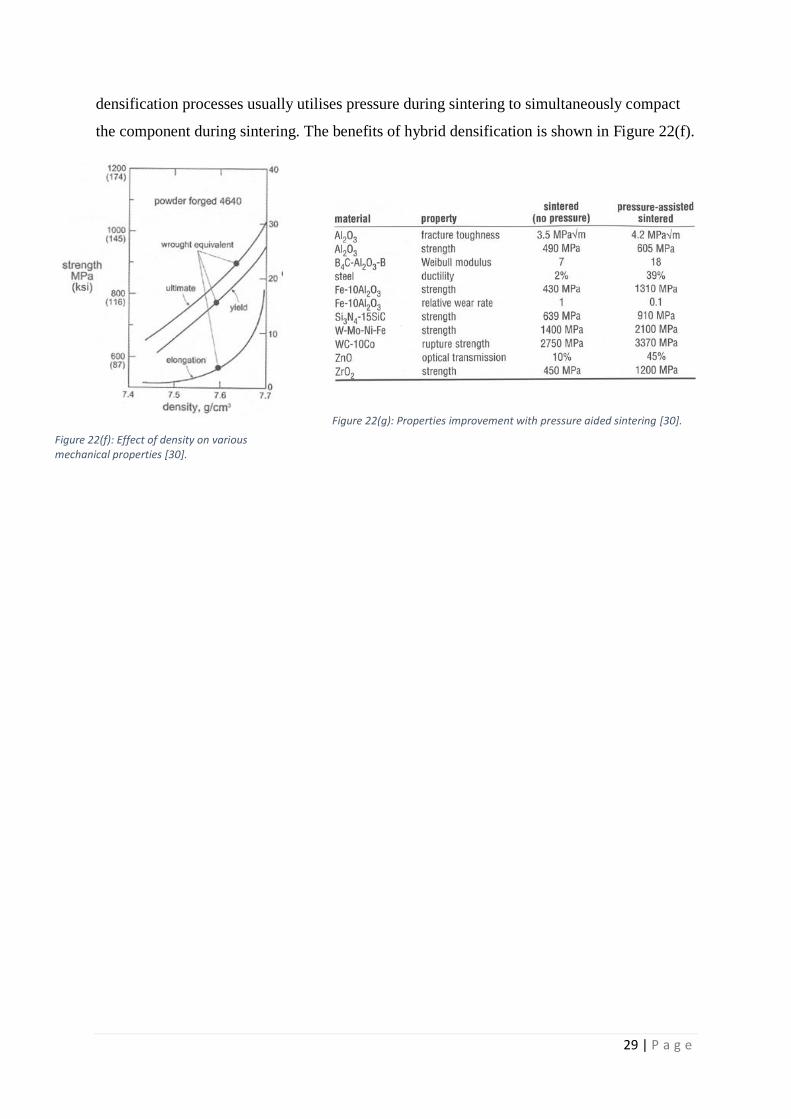
Parameters Affecting the Mechanical Properties of Powder Metallurgy Samples.
There are several factors that influence the mechanical properties of components made via
powder metallurgy. Since density is a prime influence that governs mechanical properties, all
the parameters that affects density are also affecting the mechanical properties. As seen in
Figure 22(e) the increase in density, the ultimate tensile, yield strength and ductility also
increases. Another factor that influences the mechanical properties of components is the type
of sintering process. If a hybrid densification method is used, the component will have better
mechanical properties compared to conventional sintering [30]. Hybrid densification includes
processes such as pressure assisted sintering, isostatic pressing and hot extrusion. Hybrid
Figure 22(c): Plot of density versus sintering temperature [30].
Figure 22(d): Effect of green density on sintered density [30].
29 | P a g e
densification processes usually utilises pressure during sintering to simultaneously compact
the component during sintering. The benefits of hybrid densification is shown in Figure 22(f).
Figure 22(f): Effect of density on various mechanical properties [30].
Figure 22(g): Properties improvement with pressure aided sintering [30].
30 | P a g e
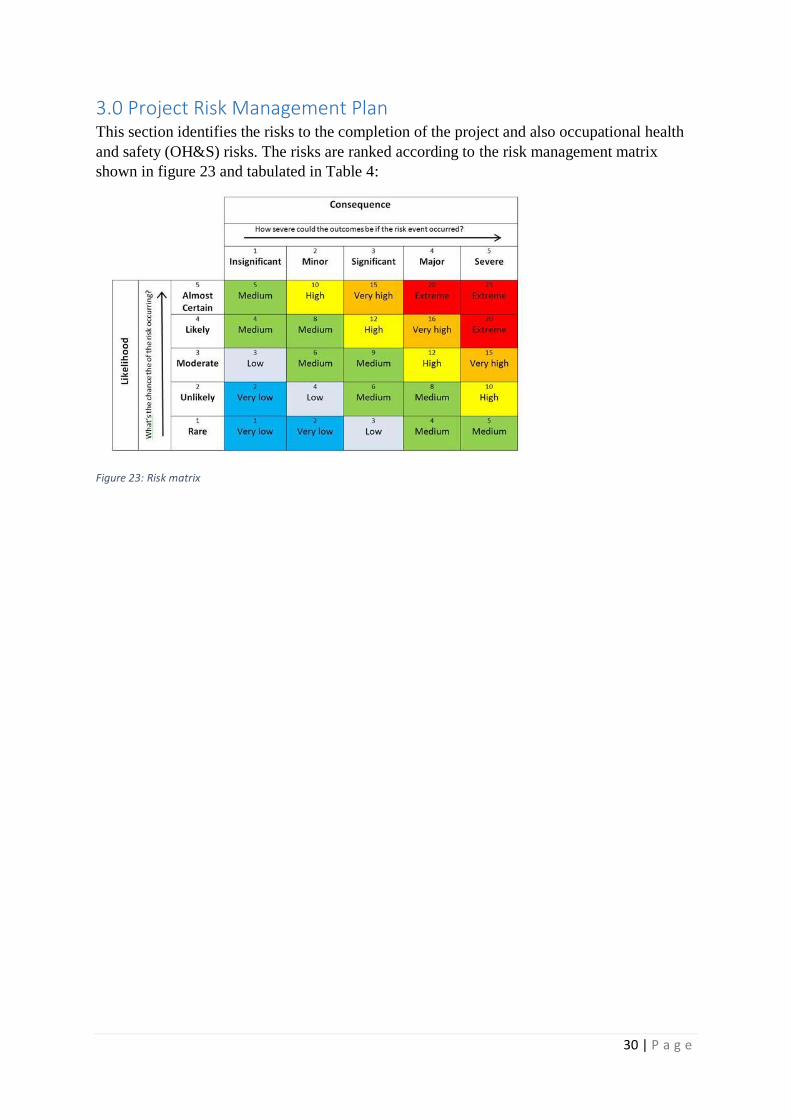
3.0 Project Risk Management Plan This section identifies the risks to the completion of the project and also occupational health
and safety (OH&S) risks. The risks are ranked according to the risk management matrix
shown in figure 23 and tabulated in Table 4:
Figure 23: Risk matrix
31
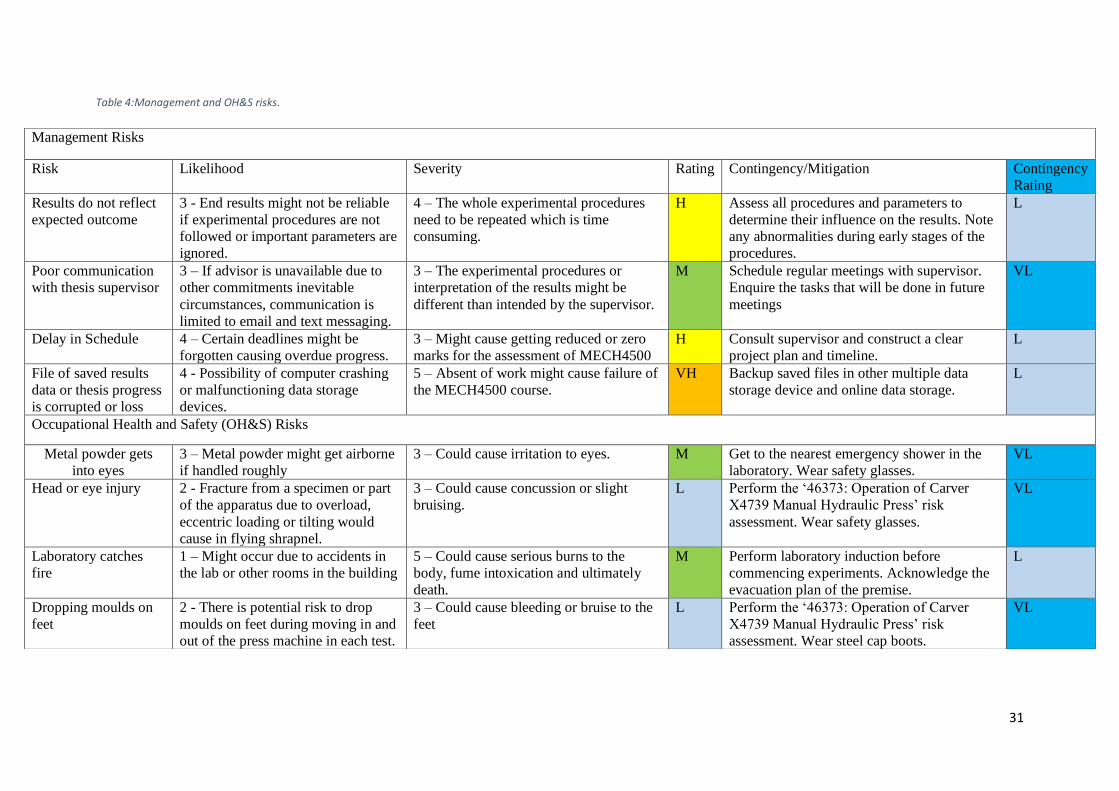
Table 4:Management and OH&S risks.
Management Risks
Risk Likelihood Severity Rating Contingency/Mitigation Contingency
Rating
Results do not reflect
expected outcome
3 - End results might not be reliable
if experimental procedures are not
followed or important parameters are
ignored.
4 – The whole experimental procedures
need to be repeated which is time
consuming.
H Assess all procedures and parameters to
determine their influence on the results. Note
any abnormalities during early stages of the
procedures.
L
Poor communication
with thesis supervisor
3 – If advisor is unavailable due to
other commitments inevitable
circumstances, communication is
limited to email and text messaging.
3 – The experimental procedures or
interpretation of the results might be
different than intended by the supervisor.
M Schedule regular meetings with supervisor.
Enquire the tasks that will be done in future
meetings
VL
Delay in Schedule 4 – Certain deadlines might be
forgotten causing overdue progress.
3 – Might cause getting reduced or zero
marks for the assessment of MECH4500
H Consult supervisor and construct a clear
project plan and timeline.
L
File of saved results
data or thesis progress
is corrupted or loss
4 - Possibility of computer crashing
or malfunctioning data storage
devices.
5 – Absent of work might cause failure of
the MECH4500 course.
VH Backup saved files in other multiple data
storage device and online data storage.
L
Occupational Health and Safety (OH&S) Risks
Metal powder gets
into eyes
3 – Metal powder might get airborne
if handled roughly
3 – Could cause irritation to eyes. M Get to the nearest emergency shower in the
laboratory. Wear safety glasses.
VL
Head or eye injury 2 - Fracture from a specimen or part
of the apparatus due to overload,
eccentric loading or tilting would
cause in flying shrapnel.
3 – Could cause concussion or slight
bruising.
L Perform the ‘46373: Operation of Carver
X4739 Manual Hydraulic Press’ risk
assessment. Wear safety glasses.
VL
Laboratory catches
fire
1 – Might occur due to accidents in
the lab or other rooms in the building
5 – Could cause serious burns to the
body, fume intoxication and ultimately
death.
M Perform laboratory induction before
commencing experiments. Acknowledge the
evacuation plan of the premise.
L
Dropping moulds on
feet
2 - There is potential risk to drop
moulds on feet during moving in and
out of the press machine in each test.
3 – Could cause bleeding or bruise to the
feet
L Perform the ‘46373: Operation of Carver
X4739 Manual Hydraulic Press’ risk
assessment. Wear steel cap boots.
VL
32
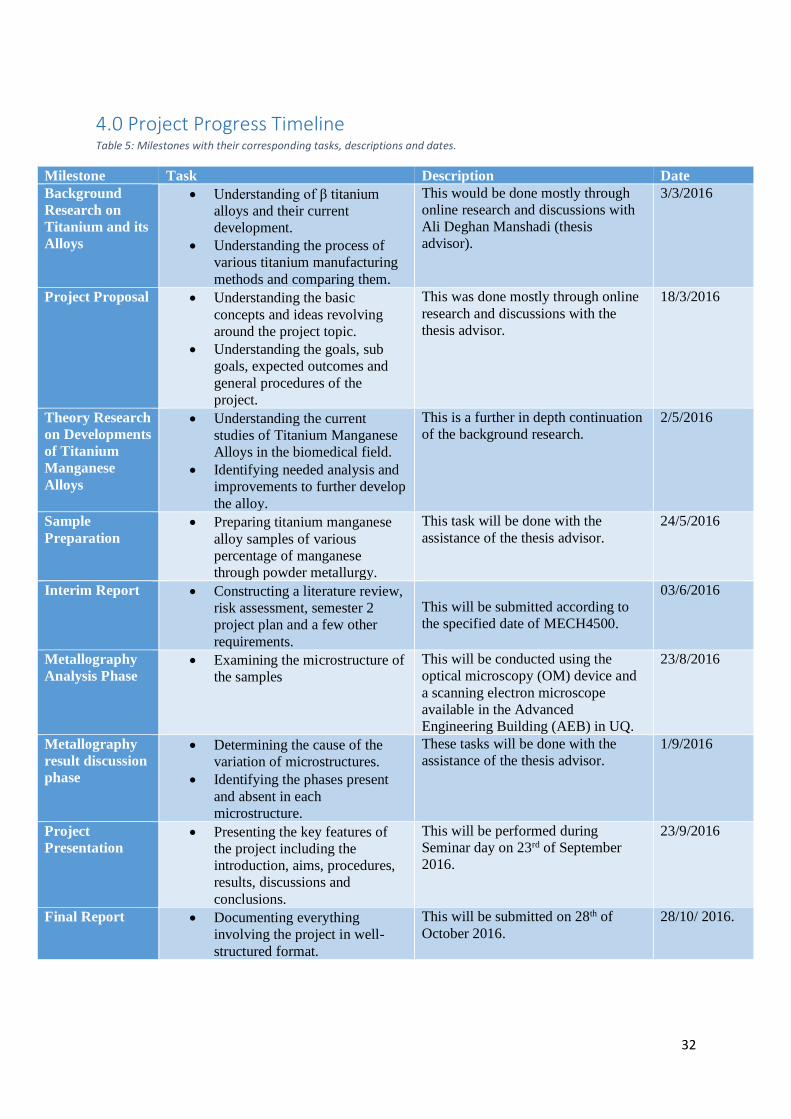
4.0 Project Progress Timeline Table 5: Milestones with their corresponding tasks, descriptions and dates.
Milestone Task Description Date
Background
Research on
Titanium and its
Alloys
Understanding of β titanium
alloys and their current
development.
Understanding the process of
various titanium manufacturing
methods and comparing them.
This would be done mostly through
online research and discussions with
Ali Deghan Manshadi (thesis
advisor).
3/3/2016
Project Proposal Understanding the basic
concepts and ideas revolving
around the project topic.
Understanding the goals, sub
goals, expected outcomes and
general procedures of the
project.
This was done mostly through online
research and discussions with the
thesis advisor.
18/3/2016
Theory Research
on Developments
of Titanium
Manganese
Alloys
Understanding the current
studies of Titanium Manganese
Alloys in the biomedical field.
Identifying needed analysis and
improvements to further develop
the alloy.
This is a further in depth continuation
of the background research.
2/5/2016
Sample
Preparation Preparing titanium manganese
alloy samples of various
percentage of manganese
through powder metallurgy.
This task will be done with the
assistance of the thesis advisor.
24/5/2016
Interim Report Constructing a literature review,
risk assessment, semester 2
project plan and a few other
requirements.
This will be submitted according to
the specified date of MECH4500.
03/6/2016
Metallography
Analysis Phase Examining the microstructure of
the samples
This will be conducted using the
optical microscopy (OM) device and
a scanning electron microscope
available in the Advanced
Engineering Building (AEB) in UQ.
23/8/2016
Metallography
result discussion
phase
Determining the cause of the
variation of microstructures.
Identifying the phases present
and absent in each
microstructure.
These tasks will be done with the
assistance of the thesis advisor.
1/9/2016
Project
Presentation Presenting the key features of
the project including the
introduction, aims, procedures,
results, discussions and
conclusions.
This will be performed during
Seminar day on 23rd of September
2016.
23/9/2016
Final Report Documenting everything
involving the project in well-
structured format.
This will be submitted on 28th of
October 2016.
28/10/ 2016.
33
5.0 Experimental Procedures
5.1 Preparation of Titanium and Titanium Manganese (Ti-Mn) Alloys 1. Five samples of titanium alloys were decided to be made with different manganese
composition. Depending on the weight percentage of manganese, the samples were
labelled Ti, Ti-5Mn, Ti-10Mn, Ti-15Mn, and Ti-20Mn.
2. The overall weight of each alloy was set to be 20 grams so the mass of manganese for
each sample was calculated before mixing the two elements as shown in table 6.
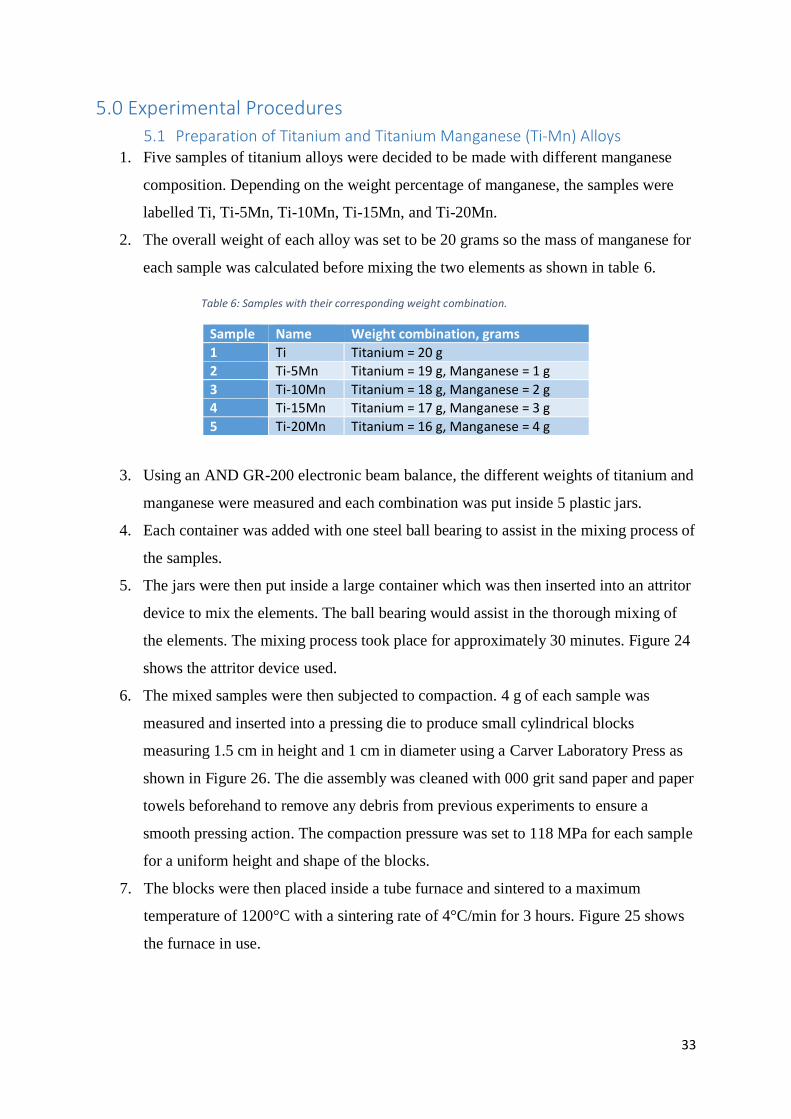
Table 6: Samples with their corresponding weight combination.
Sample Name Weight combination, grams
1 Ti Titanium = 20 g
2 Ti-5Mn Titanium = 19 g, Manganese = 1 g
3 Ti-10Mn Titanium = 18 g, Manganese = 2 g
4 Ti-15Mn Titanium = 17 g, Manganese = 3 g
5 Ti-20Mn Titanium = 16 g, Manganese = 4 g
3. Using an AND GR-200 electronic beam balance, the different weights of titanium and
manganese were measured and each combination was put inside 5 plastic jars.
4. Each container was added with one steel ball bearing to assist in the mixing process of
the samples.
5. The jars were then put inside a large container which was then inserted into an attritor
device to mix the elements. The ball bearing would assist in the thorough mixing of
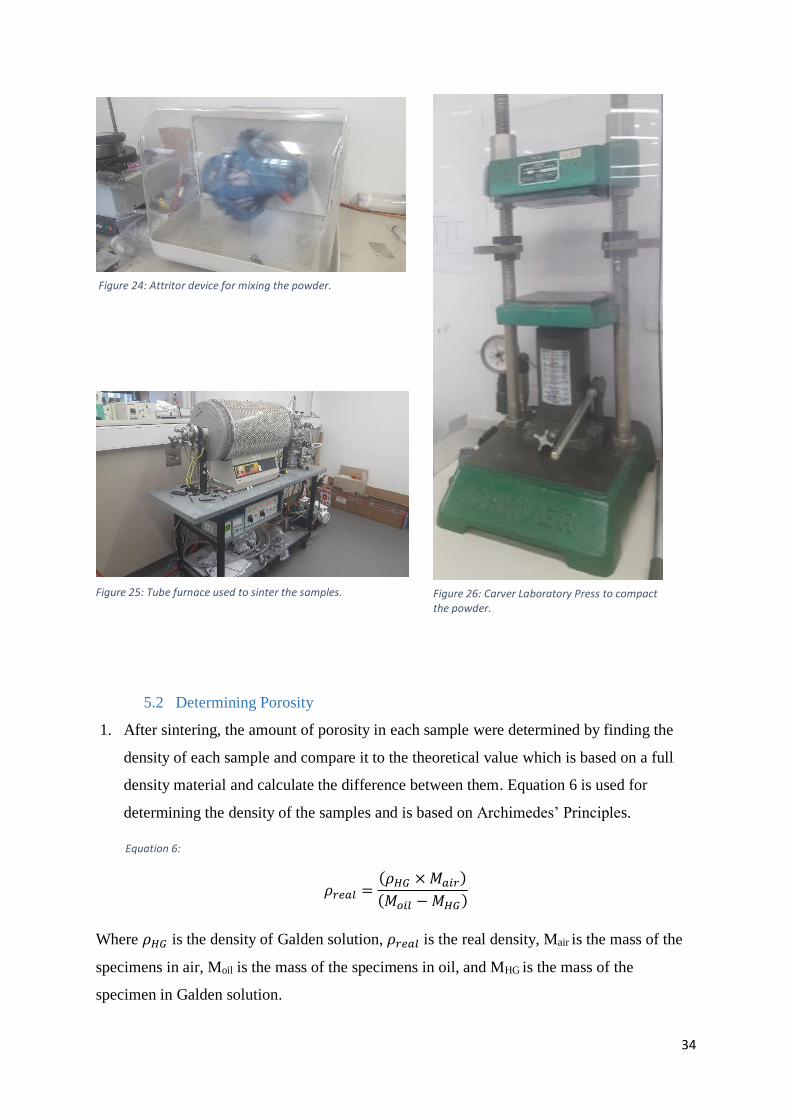
the elements. The mixing process took place for approximately 30 minutes. Figure 24
shows the attritor device used.
6. The mixed samples were then subjected to compaction. 4 g of each sample was
measured and inserted into a pressing die to produce small cylindrical blocks
measuring 1.5 cm in height and 1 cm in diameter using a Carver Laboratory Press as
shown in Figure 26. The die assembly was cleaned with 000 grit sand paper and paper
towels beforehand to remove any debris from previous experiments to ensure a
smooth pressing action. The compaction pressure was set to 118 MPa for each sample
for a uniform height and shape of the blocks.
7. The blocks were then placed inside a tube furnace and sintered to a maximum
temperature of 1200°C with a sintering rate of 4°C/min for 3 hours. Figure 25 shows
the furnace in use.
34
5.2 Determining Porosity
1. After sintering, the amount of porosity in each sample were determined by finding the
density of each sample and compare it to the theoretical value which is based on a full
density material and calculate the difference between them. Equation 6 is used for
determining the density of the samples and is based on Archimedes’ Principles.
Equation 6:
𝜌𝑟𝑒𝑎𝑙 =(𝜌𝐻𝐺 × 𝑀𝑎𝑖𝑟)
(𝑀𝑜𝑖𝑙 − 𝑀𝐻𝐺)
Where 𝜌𝐻𝐺 is the density of Galden solution, 𝜌𝑟𝑒𝑎𝑙 is the real density, Mair is the mass of the
specimens in air, Moil is the mass of the specimens in oil, and MHG is the mass of the
specimen in Galden solution.
Figure 24: Attritor device for mixing the powder.
Figure 25: Tube furnace used to sinter the samples. Figure 26: Carver Laboratory Press to compact the powder.
35
2. The theoretical density of each sample is determined through Equation 7.
Equation 7:
𝜌𝑡ℎ𝑒𝑜𝑟𝑒𝑡𝑖𝑐𝑎𝑙 = 𝑥(𝜌𝑇𝑖) + 𝑦(𝜌𝑀𝑛)
Where 𝜌𝑡ℎ𝑒𝑜𝑟𝑒𝑡𝑖𝑐𝑎𝑙 is the theoretical density, x is the stoichiometric weight ratio of titanium, y
is the stoichiometric weight ratio of manganese, 𝜌𝑇𝑖 is the ideal porous free density of
titanium and 𝜌𝑀𝑛 is the ideal porous free density of manganese. 𝜌𝑇𝑖 was found to be 4.5
g/cm3 and 𝜌𝑀𝑛 was found to be 7.43 g/cm3 [31] [32].
3. The percentage of porosity is obtained through Equation 8.
Equation 8:
%𝑝𝑜𝑟𝑜𝑠𝑖𝑡𝑦 =𝜌𝑡ℎ𝑒𝑜𝑟𝑒𝑡𝑖𝑐𝑎𝑙 − 𝜌𝑟𝑒𝑎𝑙
𝜌𝑡ℎ𝑒𝑜𝑟𝑒𝑡𝑖𝑐𝑎𝑙× 100
Where %𝑝𝑜𝑟𝑜𝑠𝑖𝑡𝑦 is the percentage of porosity, 𝜌𝑡ℎ𝑒𝑜𝑟𝑒𝑡𝑖𝑐𝑎𝑙 is the theoretical density and
𝜌𝑟𝑒𝑎𝑙 is the real density.
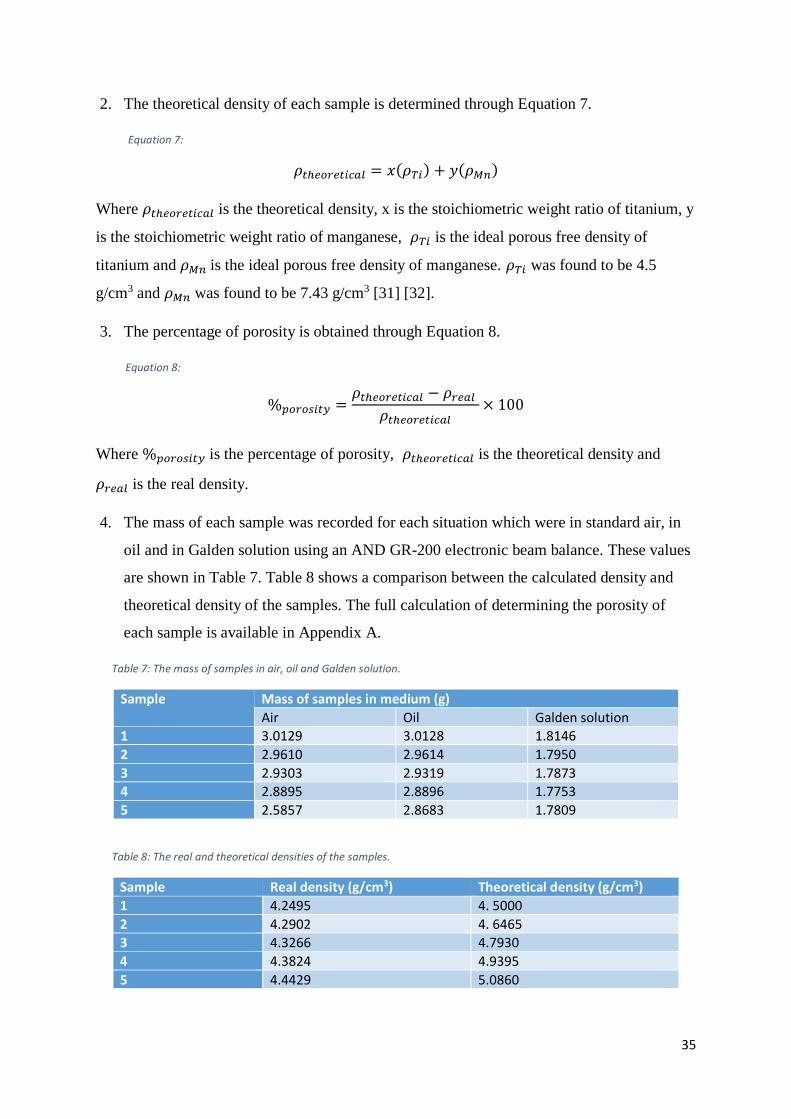
4. The mass of each sample was recorded for each situation which were in standard air, in
oil and in Galden solution using an AND GR-200 electronic beam balance. These values
are shown in Table 7. Table 8 shows a comparison between the calculated density and
theoretical density of the samples. The full calculation of determining the porosity of
each sample is available in Appendix A.
Table 7: The mass of samples in air, oil and Galden solution.
Sample Mass of samples in medium (g)
Air Oil Galden solution
1 3.0129 3.0128 1.8146
2 2.9610 2.9614 1.7950
3 2.9303 2.9319 1.7873
4 2.8895 2.8896 1.7753
5 2.5857 2.8683 1.7809
Table 8: The real and theoretical densities of the samples.
Sample Real density (g/cm3) Theoretical density (g/cm3)
1 4.2495 4. 5000
2 4.2902 4. 6465
3 4.3266 4.7930
4 4.3824 4.9395
5 4.4429 5.0860
36
5.3 Metallography Analysis 1. Each sample was cut in half using an automated saw blade with a cutting speed of
2700 rpm and a feed rate of 0.1 mm/min as the cross section was of interest for further
metallography examinations. Only one of the two halves of each samples were
mounted with ‘Polyfast’ using a Struers CitoPress-30 hot mounting press. ‘Polyfast’
is a thermosetting black bakelite hot mounting resin with carbon filler.
2. The specimens were then grinded with the Struer TegraPol 31 polishing/grinding
device using waterproof 320, 600, 1200 and 4000 grit silicon carbide paper.
3. The specimens were washed with distilled water and then bathed with ethanol in an
ultrasonic cleaner to remove any residue or surface contamination.
4. Next, the samples were then subjected to chemical-mechanical polish. Using the same
Struer TegraPol 31 polishing/grinding device, the surface of the samples was polished
with an MD-Chem cloth made from porous neoprene accompanied by a mixture of
colloidal silica (OP-S) and hydrogen peroxide.
5. Step 3 was repeated.
6. The specimens were etched using of 10% HCF + 15 % HNO3 and finally examined
under a scanning electron microscope, SEM to examine the constituent phases present
in the Ti-Mn alloys. An image processing software known as ‘IMAGEJ’ was used to
estimate the volume fraction of the α and β phases of each sample.
7. The samples are then put under an optical microscope using x100 to investigate their
microstructures. ‘IMAGEJ’ was again used to add a calibration bar on each image to
estimate the average grain size of each sample using an image calibrating function
provided by the software. In between examinations, the samples are stored in a
vacuum chamber to prevent the cross sectional surface from oxidising and
contamination.
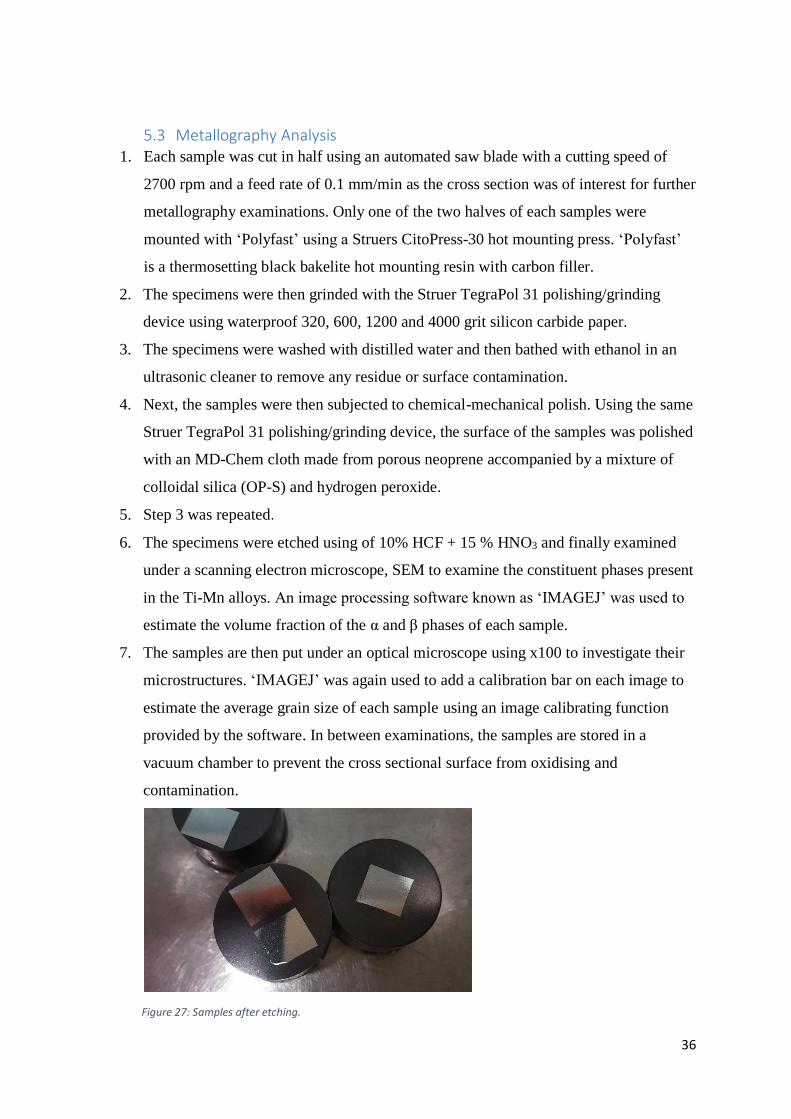
Figure 27: Samples after etching.
37
6.0 Results
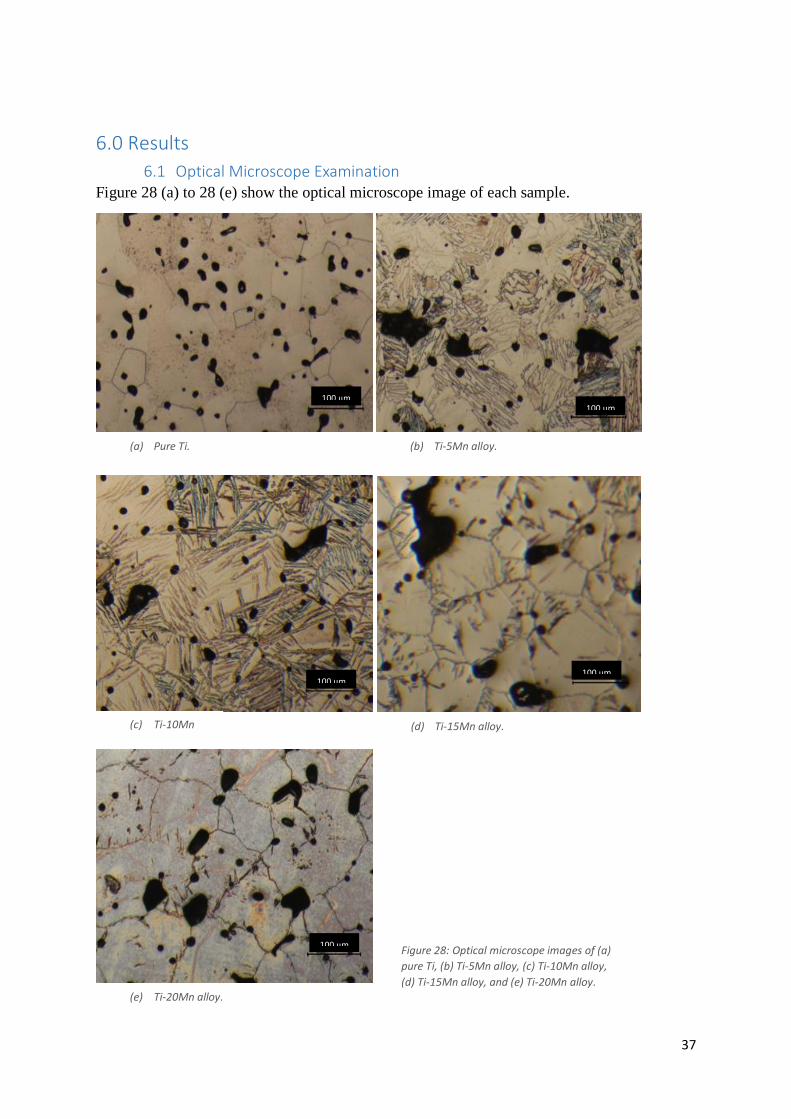
6.1 Optical Microscope Examination Figure 28 (a) to 28 (e) show the optical microscope image of each sample.
(a) Pure Ti. (b) Ti-5Mn alloy.
(c) Ti-10Mn
alloy. (d) Ti-15Mn alloy.
(e) Ti-20Mn alloy.
Figure 28: Optical microscope images of (a)
pure Ti, (b) Ti-5Mn alloy, (c) Ti-10Mn alloy,
(d) Ti-15Mn alloy, and (e) Ti-20Mn alloy.
100 μm 100 μm
100 μm 100 μm
100 μm
38
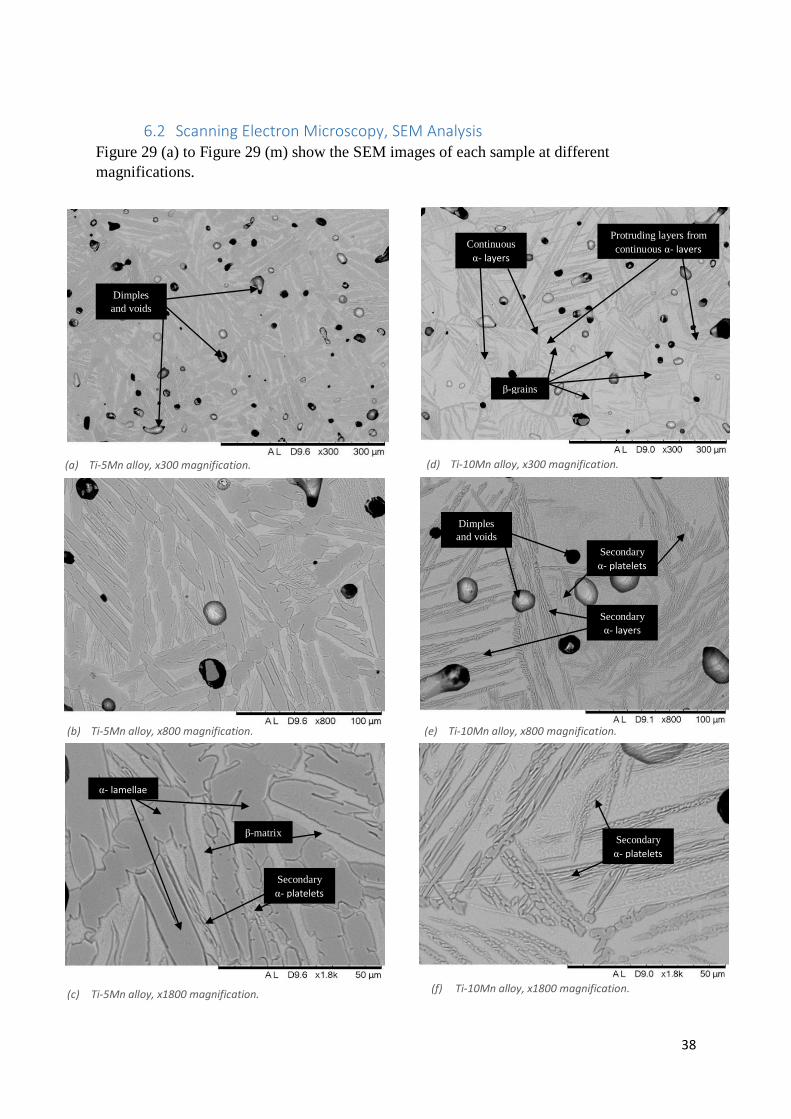
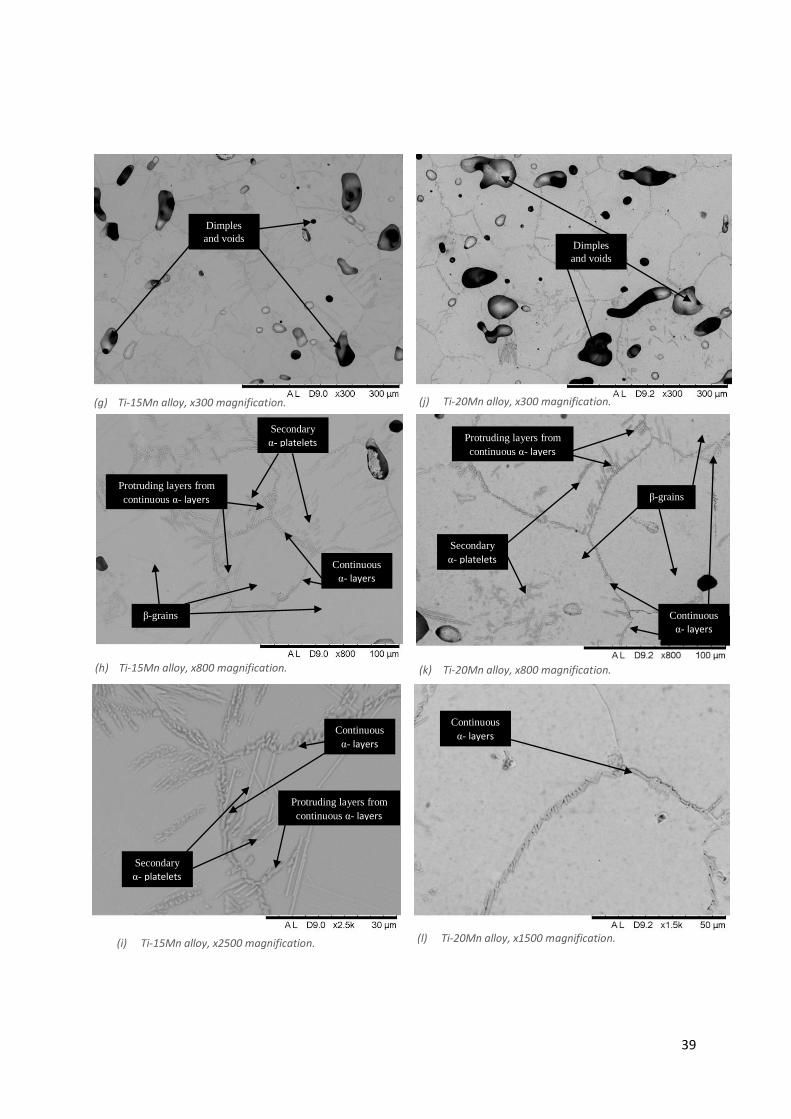
6.2 Scanning Electron Microscopy, SEM Analysis Figure 29 (a) to Figure 29 (m) show the SEM images of each sample at different
magnifications.
(a) Ti-5Mn alloy, x300 magnification.
(b) Ti-5Mn alloy, x800 magnification.
(c) Ti-5Mn alloy, x1800 magnification.
(d) Ti-10Mn alloy, x300 magnification.
(e) Ti-10Mn alloy, x800 magnification.
(f) Ti-10Mn alloy, x1800 magnification.
α- lamellae
Secondary
α- platelets
β-matrix
β-grains
Secondary
α- layers
Secondary
α- platelets
Secondary
α- platelets
Continuous
α- layers
Protruding layers from
continuous α- layers
Dimples
and voids
Dimples
and voids
39
(g) Ti-15Mn alloy, x300 magnification.
(h) Ti-15Mn alloy, x800 magnification.
(i) Ti-15Mn alloy, x2500 magnification.
(j) Ti-20Mn alloy, x300 magnification.
(k) Ti-20Mn alloy, x800 magnification.
(l) Ti-20Mn alloy, x1500 magnification.
Protruding layers from
continuous α- layers
Secondary
α- platelets
Continuous
α- layers
β-grains
Secondary
α- platelets
Protruding layers from
continuous α- layers
β-grains
Continuous
α- layers
Continuous
α- layers
Protruding layers from
continuous α- layers
Secondary
α- platelets
Continuous
α- layers
Dimples
and voids Dimples
and voids
40
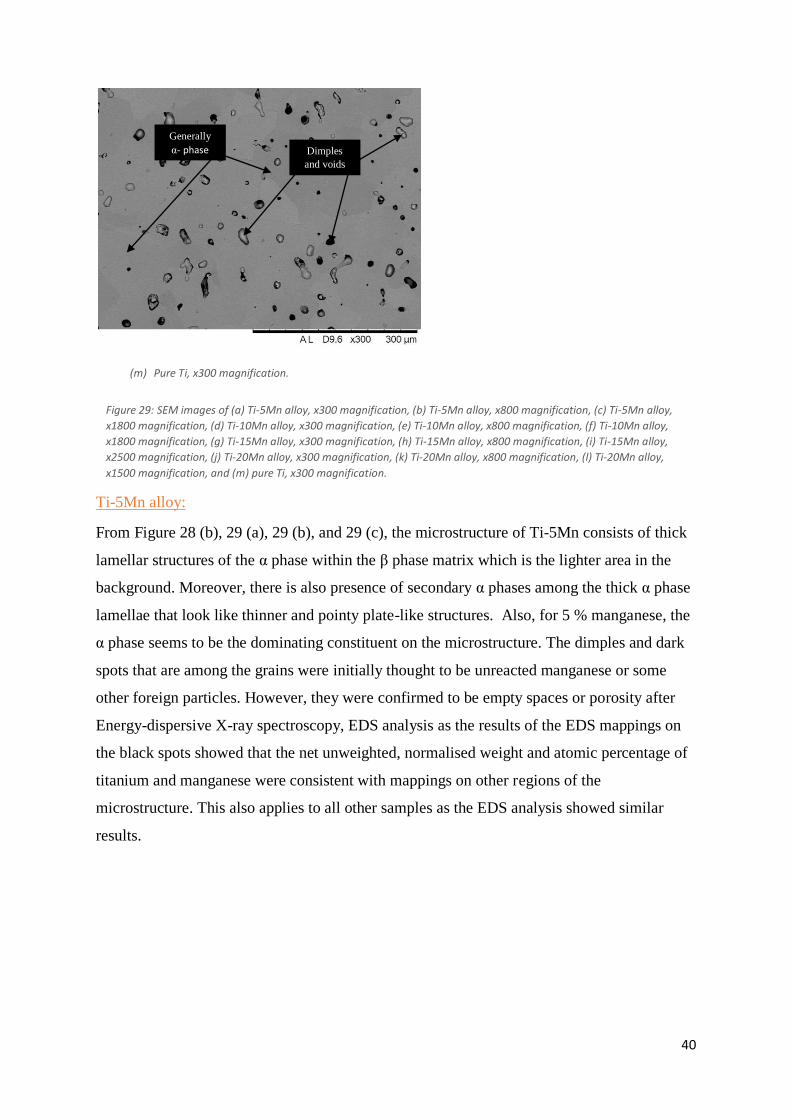
Ti-5Mn alloy:
From Figure 28 (b), 29 (a), 29 (b), and 29 (c), the microstructure of Ti-5Mn consists of thick
lamellar structures of the α phase within the β phase matrix which is the lighter area in the
background. Moreover, there is also presence of secondary α phases among the thick α phase
lamellae that look like thinner and pointy plate-like structures. Also, for 5 % manganese, the
α phase seems to be the dominating constituent on the microstructure. The dimples and dark
spots that are among the grains were initially thought to be unreacted manganese or some
other foreign particles. However, they were confirmed to be empty spaces or porosity after
Energy-dispersive X-ray spectroscopy, EDS analysis as the results of the EDS mappings on
the black spots showed that the net unweighted, normalised weight and atomic percentage of
titanium and manganese were consistent with mappings on other regions of the
microstructure. This also applies to all other samples as the EDS analysis showed similar
results.
(m) Pure Ti, x300 magnification.
Generally
α- phase Dimples
and voids
Figure 29: SEM images of (a) Ti-5Mn alloy, x300 magnification, (b) Ti-5Mn alloy, x800 magnification, (c) Ti-5Mn alloy,
x1800 magnification, (d) Ti-10Mn alloy, x300 magnification, (e) Ti-10Mn alloy, x800 magnification, (f) Ti-10Mn alloy,
x1800 magnification, (g) Ti-15Mn alloy, x300 magnification, (h) Ti-15Mn alloy, x800 magnification, (i) Ti-15Mn alloy,
x2500 magnification, (j) Ti-20Mn alloy, x300 magnification, (k) Ti-20Mn alloy, x800 magnification, (l) Ti-20Mn alloy,
x1500 magnification, and (m) pure Ti, x300 magnification.
41
Ti-10Mn alloy:
From Figure 28 (c), 29 (d), 29 (e), and 29 (f), the microstructure of Ti-10Mn is drastically
different with Ti-5Mn. Firstly, the thick lamellar α phases are no longer visible. Secondly, it
could be seen that the α phase has a significant reduction in volume fraction and visually seen
sharing an equal portion of volume with the β phase. The α phase is seen to transform into
continuous layers that take the boundaries of the β grains. Also, some α layers seem to
protrude from the continuous α layers occupying the grain boundaries into the β grains and
within the β grains. In addition, there seems to be secondary α phases in the form of layers
and platelets.
Ti-15Mn alloy:
From Figure 28 (d), 29 (g), 29 (h), and 29 (i), the microstructure of Ti-15Mn seems to have a
similar morphology with Ti-10Mn. However, it is visible that the continuous α layers along
the β grain boundaries and secondary α phases within the grains are generally thinner. The
secondary α phases also seem to be in a lower volume compared to Ti-10Mn as well as
consisting of only the platelets instead of both platelets and layers. For Ti-15Mn, it is
apparent that the β phase is the dominating phase. In addition, there appears to be less
protruding layers from the continuous α layers along the grain boundaries compared to Ti-
10Mn. Next, the grain size also appears to be significantly larger than Ti-10Mn.
Ti-20Mn alloy:
From Figure 28 (e), 29 (j), 29 (k), and 29 (l), the microstructure of Ti-20Mn shows not much
different with Ti-15Mn. In terms of morphology, both microstructures look very similar.
Only when the images with high magnification are observed, the differences could be
identified which include grain size, α layer thickness and volume fraction. The grain size
seems to be bigger than Ti-15Mn. The α layer thickness for both continuous and protruding
layers are also thinner than Ti-15Mn. On the other hand, the secondary α platelets seem to
reduce in size as well as volume.
Pure Ti:
From Figure 28 (a) and 29 (m), the microstructure of pure Ti consists of mainly equiaxed
grains. The microstructure is also made up fully of the α phase since there are no manganese
added into this sample. No in depth analysis has been done to this sample as it is not of
interest for this study.
42
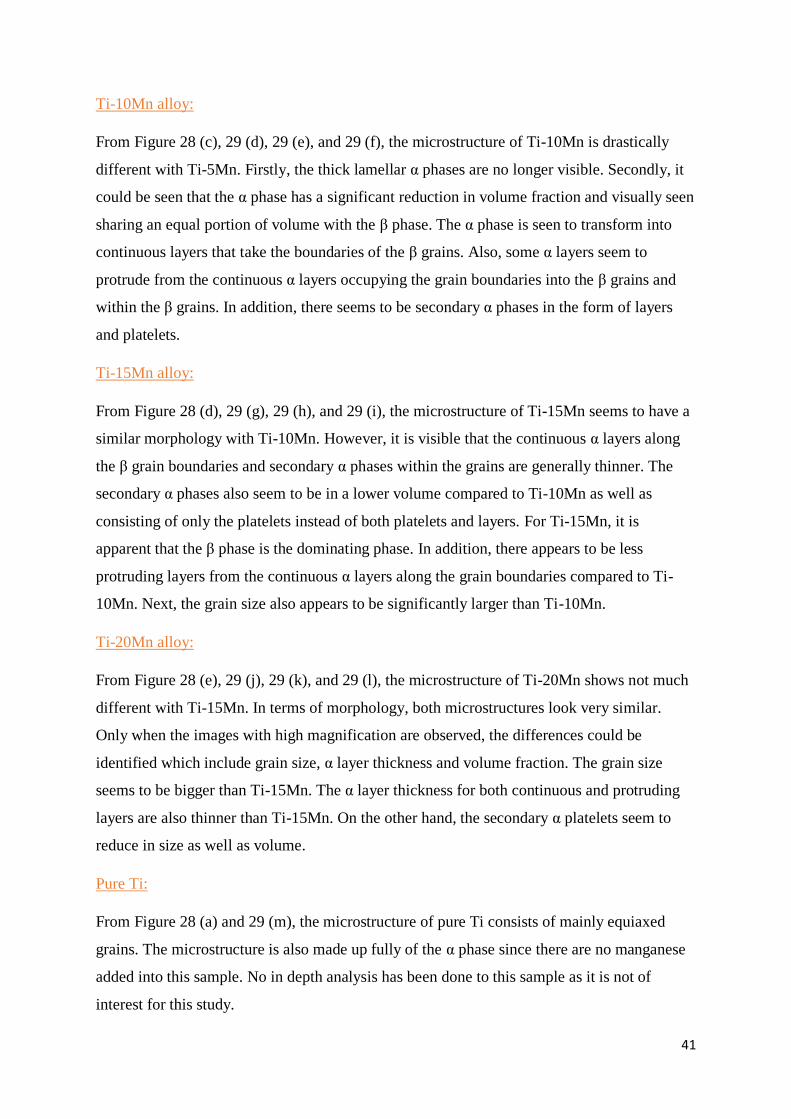
6.3 Energy-dispersive X-ray spectroscopy, EDS analysis Figure 30 (a) to 30 (d) show the SEM images of Ti-5Mn, Ti-10Mn, Ti-15Mn, and Ti-20Mn
for EDS mapping and analysis. The pure Ti sample was excluded because there is no interest
for the full α phase microstructure. The region inside red frame indicates the area of EDS
mapping and the region within the yellow circle is the area of interest for determining the
local composition of the microstructure.
(a) Ti-5Mn alloy EDS mapping. (b) Ti-10Mn alloy EDS mapping.
(d) Ti-20Mn alloy EDS mapping.
Figure 30: SEM images of (a) Ti-5Mn alloy, (b) Ti-10Mn alloy, (c) Ti-15Mn alloy, and (d) Ti-20Mn alloy for EDS mapping.
The yellow circle indicates the area of EDS spectral analysis.
(c) Ti-15Mn alloy EDS mapping.
43
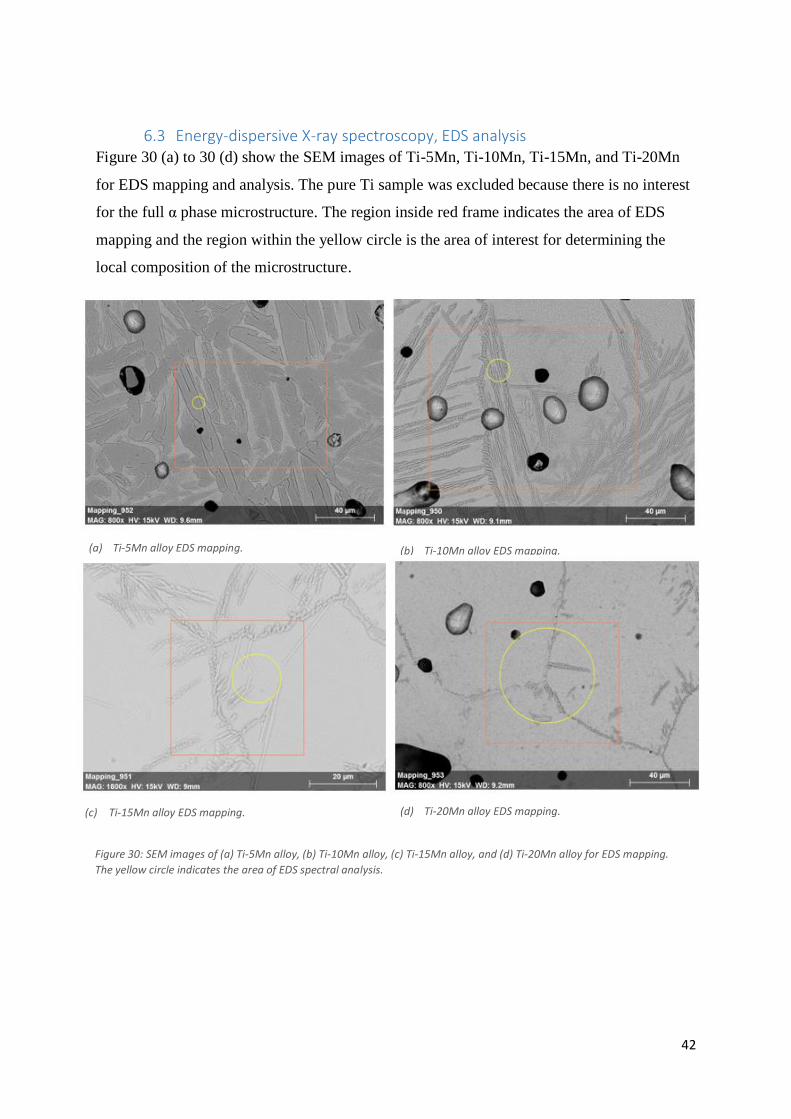
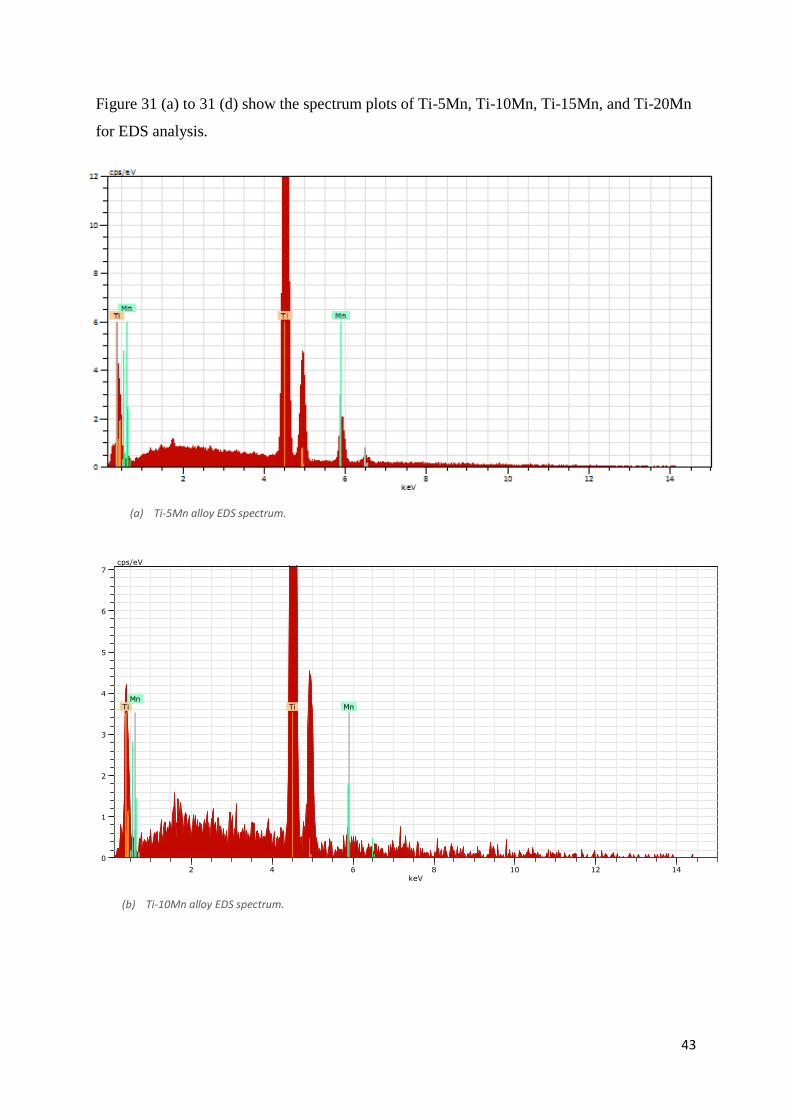
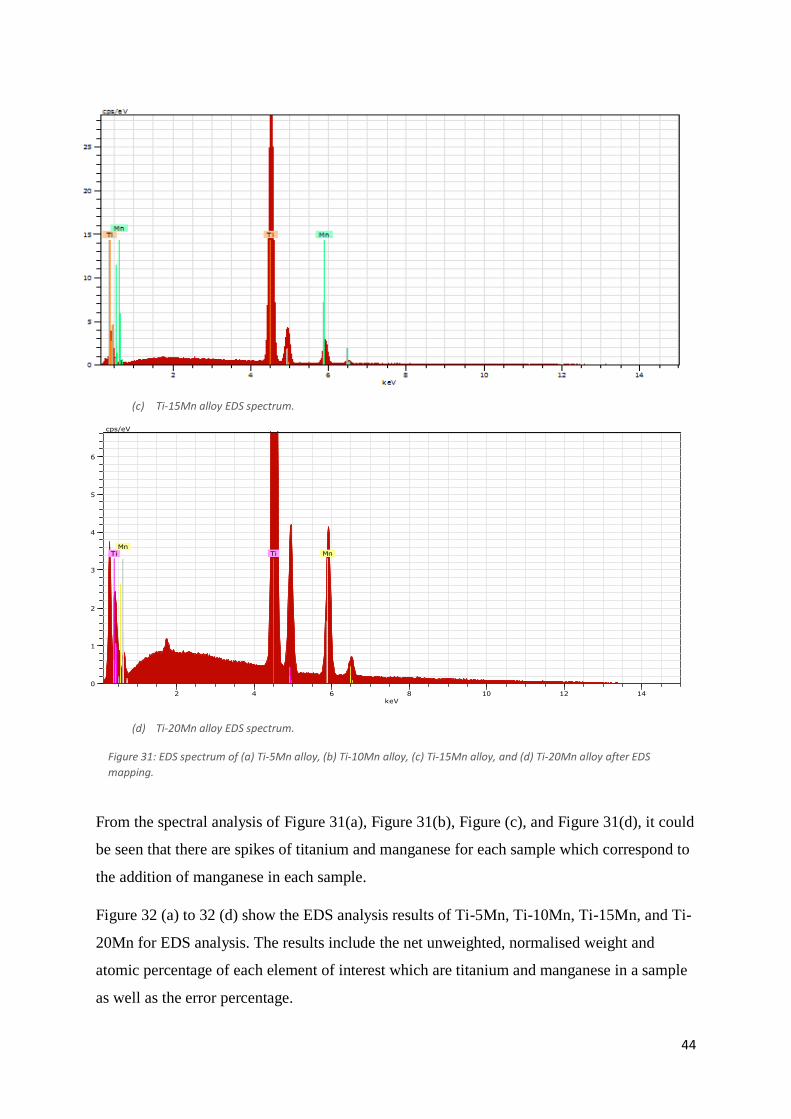
Figure 31 (a) to 31 (d) show the spectrum plots of Ti-5Mn, Ti-10Mn, Ti-15Mn, and Ti-20Mn
for EDS analysis.
2 4 6 8 10 12 14keV
0
1
2
3
4
5
6
7 cps/eV
Ti Ti Mn Mn
(b) Ti-10Mn alloy EDS spectrum.
(a) Ti-5Mn alloy EDS spectrum.
44
From the spectral analysis of Figure 31(a), Figure 31(b), Figure (c), and Figure 31(d), it could
be seen that there are spikes of titanium and manganese for each sample which correspond to
the addition of manganese in each sample.
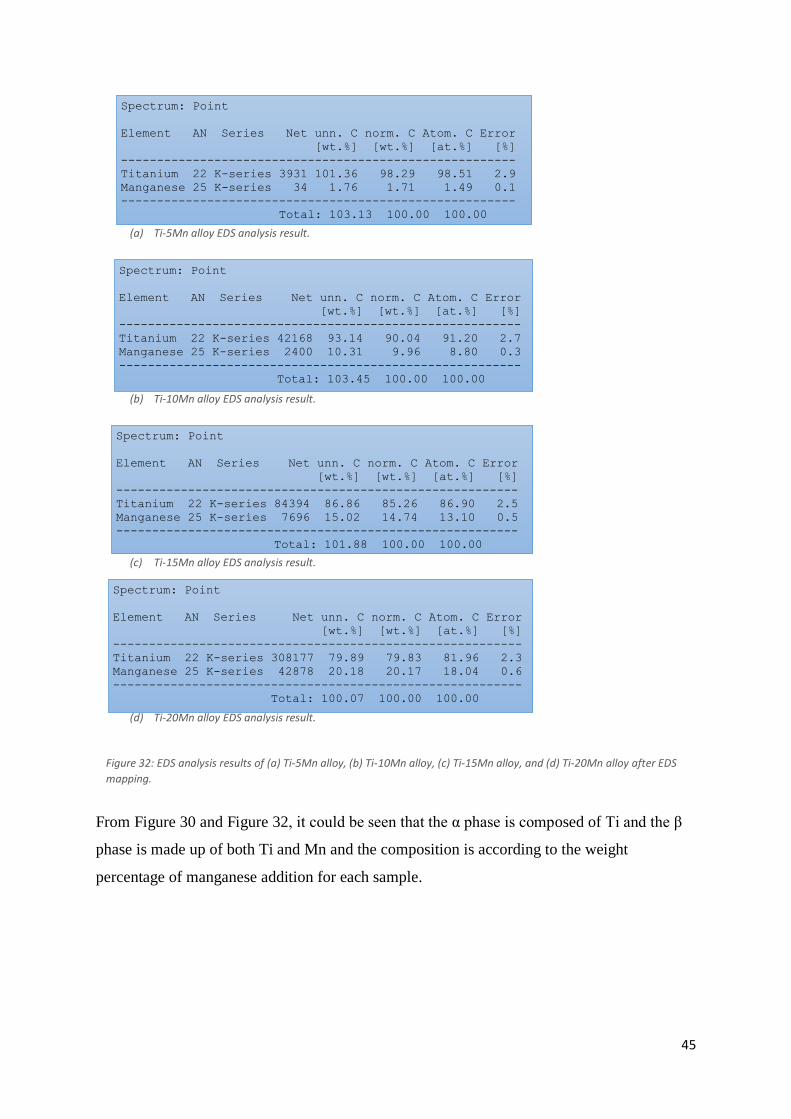
Figure 32 (a) to 32 (d) show the EDS analysis results of Ti-5Mn, Ti-10Mn, Ti-15Mn, and Ti-
20Mn for EDS analysis. The results include the net unweighted, normalised weight and
atomic percentage of each element of interest which are titanium and manganese in a sample
as well as the error percentage.
2 4 6 8 10 12 14keV
0
1
2
3
4
5
6
cps/eV
Ti Ti Mn Mn
(c) Ti-15Mn alloy EDS spectrum.
Figure 31: EDS spectrum of (a) Ti-5Mn alloy, (b) Ti-10Mn alloy, (c) Ti-15Mn alloy, and (d) Ti-20Mn alloy after EDS
mapping.
(d) Ti-20Mn alloy EDS spectrum.
45
From Figure 30 and Figure 32, it could be seen that the α phase is composed of Ti and the β
phase is made up of both Ti and Mn and the composition is according to the weight
percentage of manganese addition for each sample.
Spectrum: Point
Element AN Series Net unn. C norm. C Atom. C Error
[wt.%] [wt.%] [at.%] [%]
---------------------------------------------------------
Titanium 22 K-series 308177 79.89 79.83 81.96 2.3
Manganese 25 K-series 42878 20.18 20.17 18.04 0.6
---------------------------------------------------------
Total: 100.07 100.00 100.00
Spectrum: Point
Element AN Series Net unn. C norm. C Atom. C Error
[wt.%] [wt.%] [at.%] [%]
--------------------------------------------------------
Titanium 22 K-series 84394 86.86 85.26 86.90 2.5
Manganese 25 K-series 7696 15.02 14.74 13.10 0.5
--------------------------------------------------------
Total: 101.88 100.00 100.00
Spectrum: Point
Element AN Series Net unn. C norm. C Atom. C Error
[wt.%] [wt.%] [at.%] [%]
--------------------------------------------------------
Titanium 22 K-series 42168 93.14 90.04 91.20 2.7
Manganese 25 K-series 2400 10.31 9.96 8.80 0.3
--------------------------------------------------------
Total: 103.45 100.00 100.00
Spectrum: Point
Element AN Series Net unn. C norm. C Atom. C Error
[wt.%] [wt.%] [at.%] [%]
-------------------------------------------------------
Titanium 22 K-series 3931 101.36 98.29 98.51 2.9
Manganese 25 K-series 34 1.76 1.71 1.49 0.1
-------------------------------------------------------
Total: 103.13 100.00 100.00
(a) Ti-5Mn alloy EDS analysis result.
(b) Ti-10Mn alloy EDS analysis result.
(c) Ti-15Mn alloy EDS analysis result.
(d) Ti-20Mn alloy EDS analysis result.
Figure 32: EDS analysis results of (a) Ti-5Mn alloy, (b) Ti-10Mn alloy, (c) Ti-15Mn alloy, and (d) Ti-20Mn alloy after EDS
mapping.
46
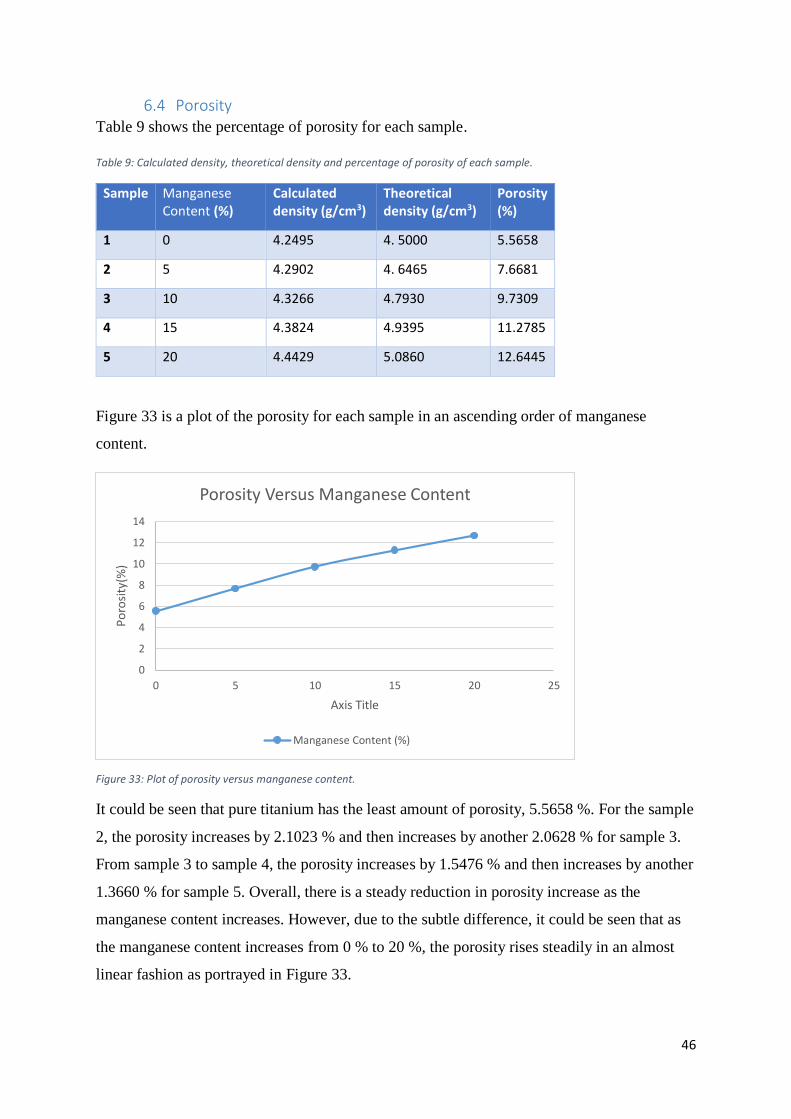
6.4 Porosity Table 9 shows the percentage of porosity for each sample.
Table 9: Calculated density, theoretical density and percentage of porosity of each sample.
Sample Manganese Content (%)
Calculated density (g/cm3)
Theoretical density (g/cm3)
Porosity (%)
1 0 4.2495 4. 5000 5.5658
2 5 4.2902 4. 6465 7.6681
3 10 4.3266 4.7930 9.7309
4 15 4.3824 4.9395 11.2785
5 20 4.4429 5.0860 12.6445
Figure 33 is a plot of the porosity for each sample in an ascending order of manganese
content.
Figure 33: Plot of porosity versus manganese content.
It could be seen that pure titanium has the least amount of porosity, 5.5658 %. For the sample
2, the porosity increases by 2.1023 % and then increases by another 2.0628 % for sample 3.
From sample 3 to sample 4, the porosity increases by 1.5476 % and then increases by another
1.3660 % for sample 5. Overall, there is a steady reduction in porosity increase as the
manganese content increases. However, due to the subtle difference, it could be seen that as
the manganese content increases from 0 % to 20 %, the porosity rises steadily in an almost
linear fashion as portrayed in Figure 33.
0
2
4
6
8
10
12
14
0 5 10 15 20 25
Po
rosi
ty(%
)
Axis Title
Porosity Versus Manganese Content
Manganese Content (%)
47
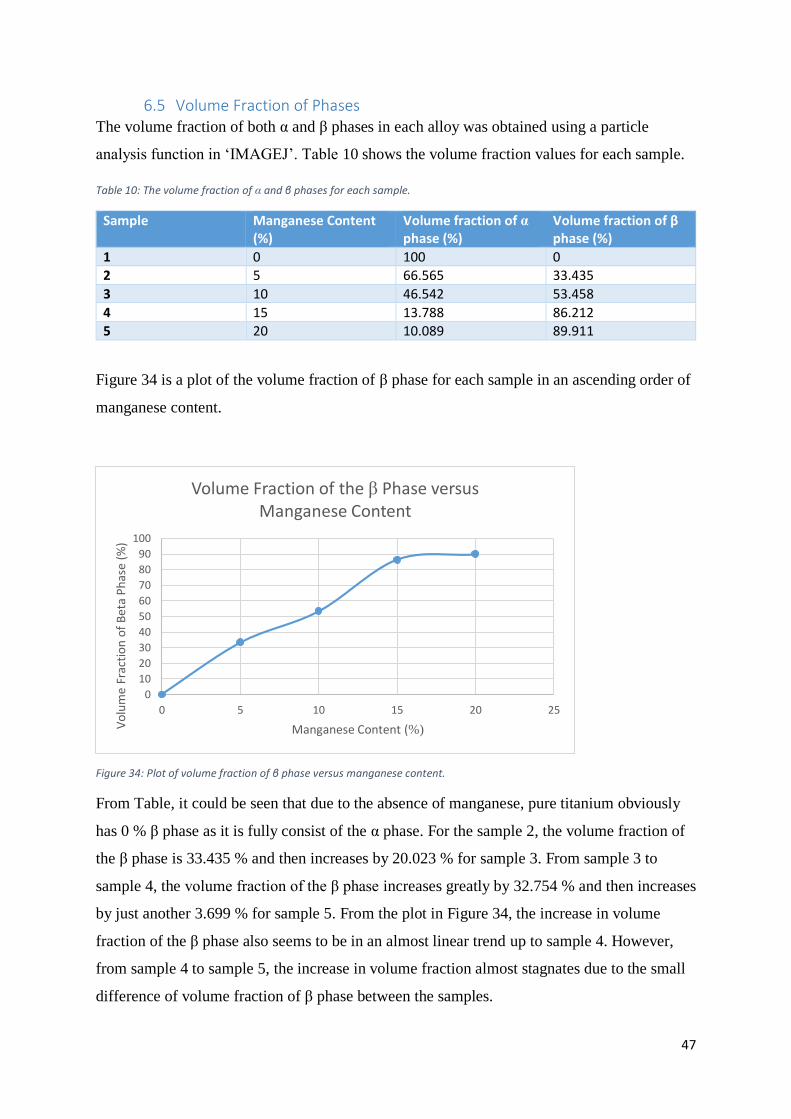
6.5 Volume Fraction of Phases The volume fraction of both α and β phases in each alloy was obtained using a particle
analysis function in ‘IMAGEJ’. Table 10 shows the volume fraction values for each sample.
Table 10: The volume fraction of α and β phases for each sample.
Sample Manganese Content (%)
Volume fraction of α phase (%)
Volume fraction of β phase (%)
1 0 100 0
2 5 66.565 33.435
3 10 46.542 53.458
4 15 13.788 86.212
5 20 10.089 89.911
Figure 34 is a plot of the volume fraction of β phase for each sample in an ascending order of
manganese content.
Figure 34: Plot of volume fraction of β phase versus manganese content.
From Table, it could be seen that due to the absence of manganese, pure titanium obviously
has 0 % β phase as it is fully consist of the α phase. For the sample 2, the volume fraction of
the β phase is 33.435 % and then increases by 20.023 % for sample 3. From sample 3 to
sample 4, the volume fraction of the β phase increases greatly by 32.754 % and then increases
by just another 3.699 % for sample 5. From the plot in Figure 34, the increase in volume
fraction of the β phase also seems to be in an almost linear trend up to sample 4. However,
from sample 4 to sample 5, the increase in volume fraction almost stagnates due to the small
difference of volume fraction of β phase between the samples.
0
10
20
30
40
50
60
70
80
90
100
0 5 10 15 20 25
Vo
lum
e Fr
acti
on
of
Bet
a P
has
e (%
)
Manganese Content (%)
Volume Fraction of the β Phase versus Manganese Content
48
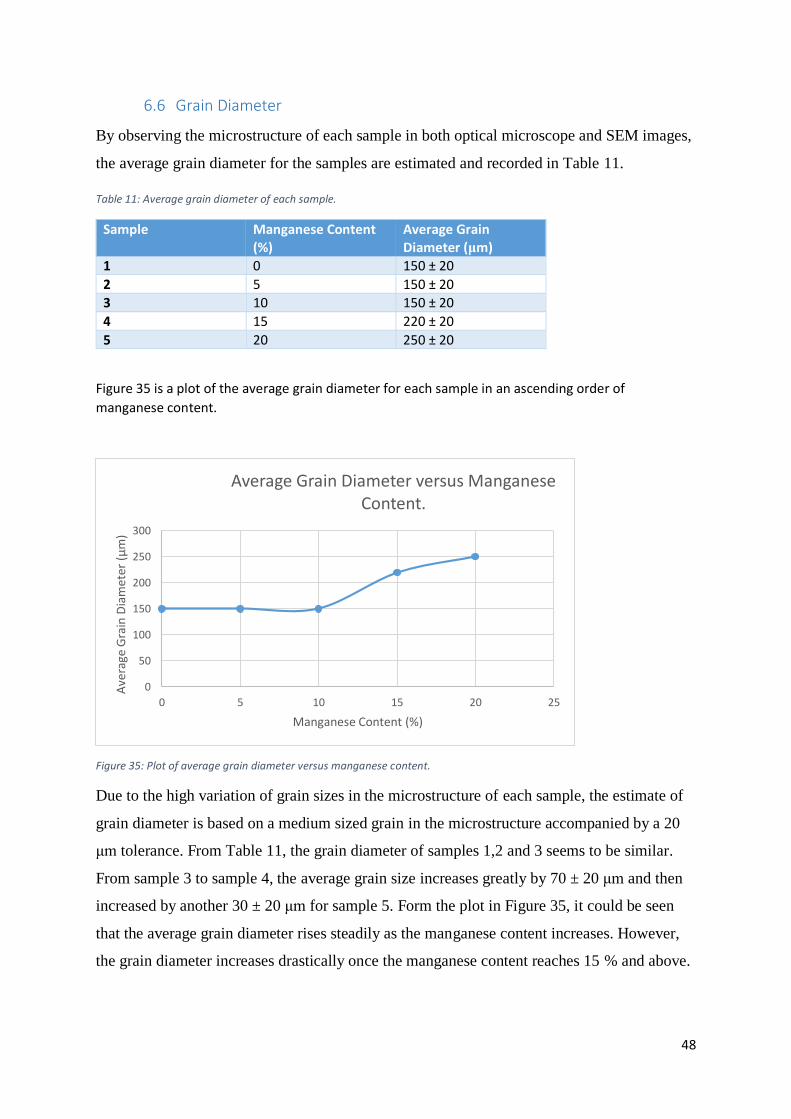
6.6 Grain Diameter
By observing the microstructure of each sample in both optical microscope and SEM images,
the average grain diameter for the samples are estimated and recorded in Table 11.
Table 11: Average grain diameter of each sample.
Sample Manganese Content (%)
Average Grain Diameter (μm)
1 0 150 ± 20
2 5 150 ± 20
3 10 150 ± 20
4 15 220 ± 20
5 20 250 ± 20
Figure 35 is a plot of the average grain diameter for each sample in an ascending order of
manganese content.
Figure 35: Plot of average grain diameter versus manganese content.
Due to the high variation of grain sizes in the microstructure of each sample, the estimate of
grain diameter is based on a medium sized grain in the microstructure accompanied by a 20
μm tolerance. From Table 11, the grain diameter of samples 1,2 and 3 seems to be similar.
From sample 3 to sample 4, the average grain size increases greatly by 70 ± 20 μm and then
increased by another 30 ± 20 μm for sample 5. Form the plot in Figure 35, it could be seen
that the average grain diameter rises steadily as the manganese content increases. However,
the grain diameter increases drastically once the manganese content reaches 15 % and above.
0
50
100
150
200
250
300
0 5 10 15 20 25
Ave
rage
Gra
in D
iam
ete
r (μ
m)
Manganese Content (%)
Average Grain Diameter versus Manganese Content.
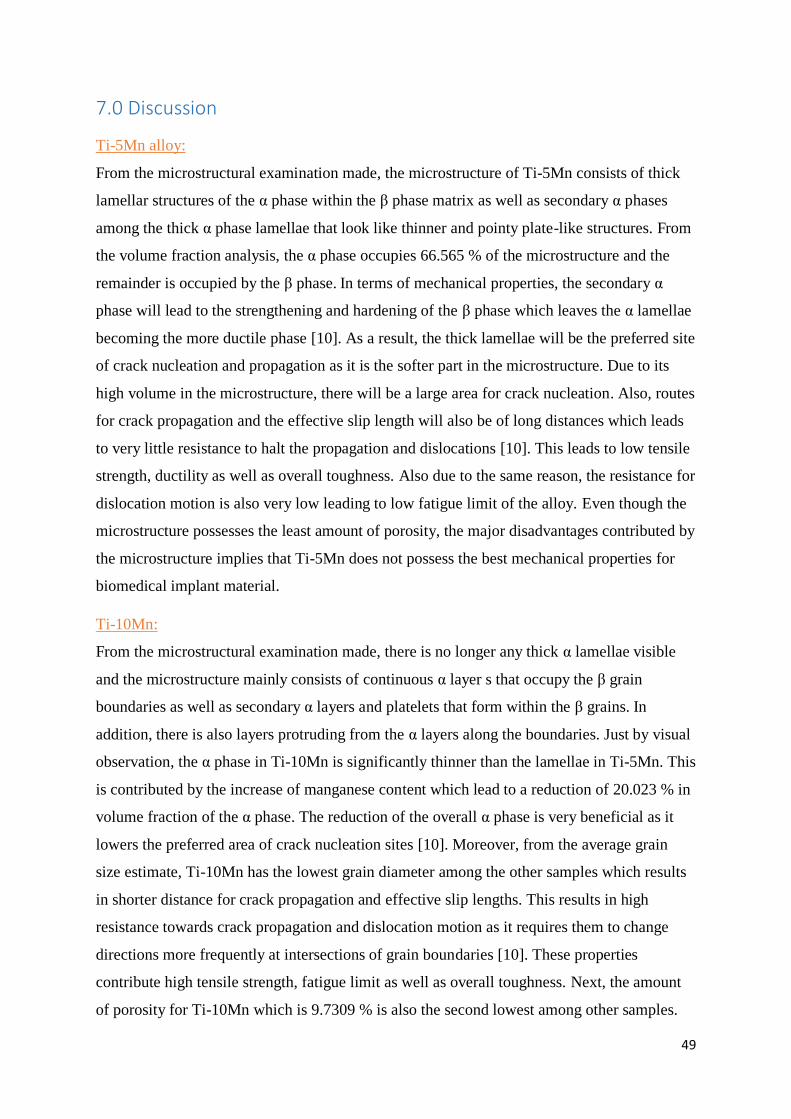
49
7.0 Discussion
Ti-5Mn alloy:
From the microstructural examination made, the microstructure of Ti-5Mn consists of thick
lamellar structures of the α phase within the β phase matrix as well as secondary α phases
among the thick α phase lamellae that look like thinner and pointy plate-like structures. From
the volume fraction analysis, the α phase occupies 66.565 % of the microstructure and the
remainder is occupied by the β phase. In terms of mechanical properties, the secondary α
phase will lead to the strengthening and hardening of the β phase which leaves the α lamellae
becoming the more ductile phase [10]. As a result, the thick lamellae will be the preferred site
of crack nucleation and propagation as it is the softer part in the microstructure. Due to its
high volume in the microstructure, there will be a large area for crack nucleation. Also, routes
for crack propagation and the effective slip length will also be of long distances which leads
to very little resistance to halt the propagation and dislocations [10]. This leads to low tensile
strength, ductility as well as overall toughness. Also due to the same reason, the resistance for
dislocation motion is also very low leading to low fatigue limit of the alloy. Even though the
microstructure possesses the least amount of porosity, the major disadvantages contributed by
the microstructure implies that Ti-5Mn does not possess the best mechanical properties for
biomedical implant material.
Ti-10Mn:
From the microstructural examination made, there is no longer any thick α lamellae visible
and the microstructure mainly consists of continuous α layer s that occupy the β grain
boundaries as well as secondary α layers and platelets that form within the β grains. In
addition, there is also layers protruding from the α layers along the boundaries. Just by visual
observation, the α phase in Ti-10Mn is significantly thinner than the lamellae in Ti-5Mn. This
is contributed by the increase of manganese content which lead to a reduction of 20.023 % in
volume fraction of the α phase. The reduction of the overall α phase is very beneficial as it
lowers the preferred area of crack nucleation sites [10]. Moreover, from the average grain
size estimate, Ti-10Mn has the lowest grain diameter among the other samples which results
in shorter distance for crack propagation and effective slip lengths. This results in high
resistance towards crack propagation and dislocation motion as it requires them to change
directions more frequently at intersections of grain boundaries [10]. These properties
contribute high tensile strength, fatigue limit as well as overall toughness. Next, the amount
of porosity for Ti-10Mn which is 9.7309 % is also the second lowest among other samples.
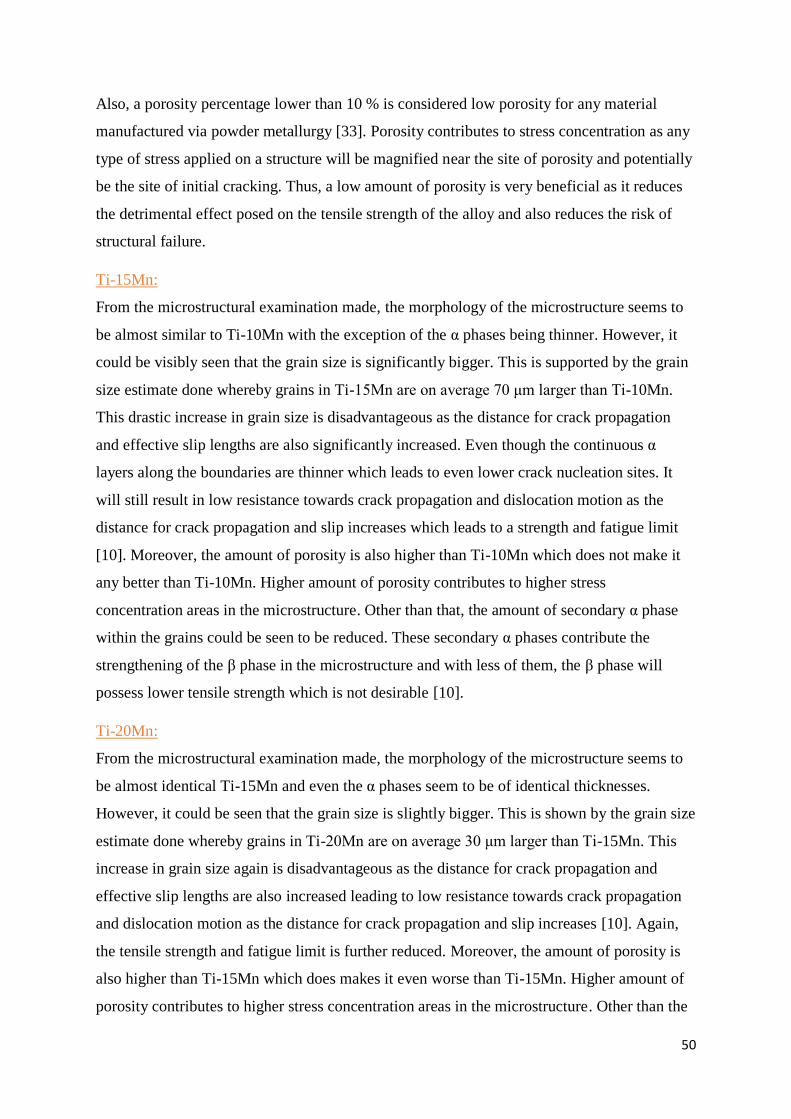
50
Also, a porosity percentage lower than 10 % is considered low porosity for any material
manufactured via powder metallurgy [33]. Porosity contributes to stress concentration as any
type of stress applied on a structure will be magnified near the site of porosity and potentially
be the site of initial cracking. Thus, a low amount of porosity is very beneficial as it reduces
the detrimental effect posed on the tensile strength of the alloy and also reduces the risk of
structural failure.
Ti-15Mn:
From the microstructural examination made, the morphology of the microstructure seems to
be almost similar to Ti-10Mn with the exception of the α phases being thinner. However, it
could be visibly seen that the grain size is significantly bigger. This is supported by the grain
size estimate done whereby grains in Ti-15Mn are on average 70 μm larger than Ti-10Mn.
This drastic increase in grain size is disadvantageous as the distance for crack propagation
and effective slip lengths are also significantly increased. Even though the continuous α
layers along the boundaries are thinner which leads to even lower crack nucleation sites. It
will still result in low resistance towards crack propagation and dislocation motion as the
distance for crack propagation and slip increases which leads to a strength and fatigue limit
[10]. Moreover, the amount of porosity is also higher than Ti-10Mn which does not make it
any better than Ti-10Mn. Higher amount of porosity contributes to higher stress
concentration areas in the microstructure. Other than that, the amount of secondary α phase
within the grains could be seen to be reduced. These secondary α phases contribute the
strengthening of the β phase in the microstructure and with less of them, the β phase will
possess lower tensile strength which is not desirable [10].
Ti-20Mn:
From the microstructural examination made, the morphology of the microstructure seems to
be almost identical Ti-15Mn and even the α phases seem to be of identical thicknesses.
However, it could be seen that the grain size is slightly bigger. This is shown by the grain size
estimate done whereby grains in Ti-20Mn are on average 30 μm larger than Ti-15Mn. This
increase in grain size again is disadvantageous as the distance for crack propagation and
effective slip lengths are also increased leading to low resistance towards crack propagation
and dislocation motion as the distance for crack propagation and slip increases [10]. Again,
the tensile strength and fatigue limit is further reduced. Moreover, the amount of porosity is
also higher than Ti-15Mn which does makes it even worse than Ti-15Mn. Higher amount of
porosity contributes to higher stress concentration areas in the microstructure. Other than the

51
continuous and protruding α layers, visually, the amount of secondary α phase within the
grains seem to be of similar thickness and volume. However, according to the volume
fraction analysis done there is a slight reduction in the overall volume fraction of the α phase.
From this result, the tensile strength of Ti-20Mn will be lower than Ti-15Mn as the
strengthening effect of the secondary α phase on the β phase is further reduced [10].
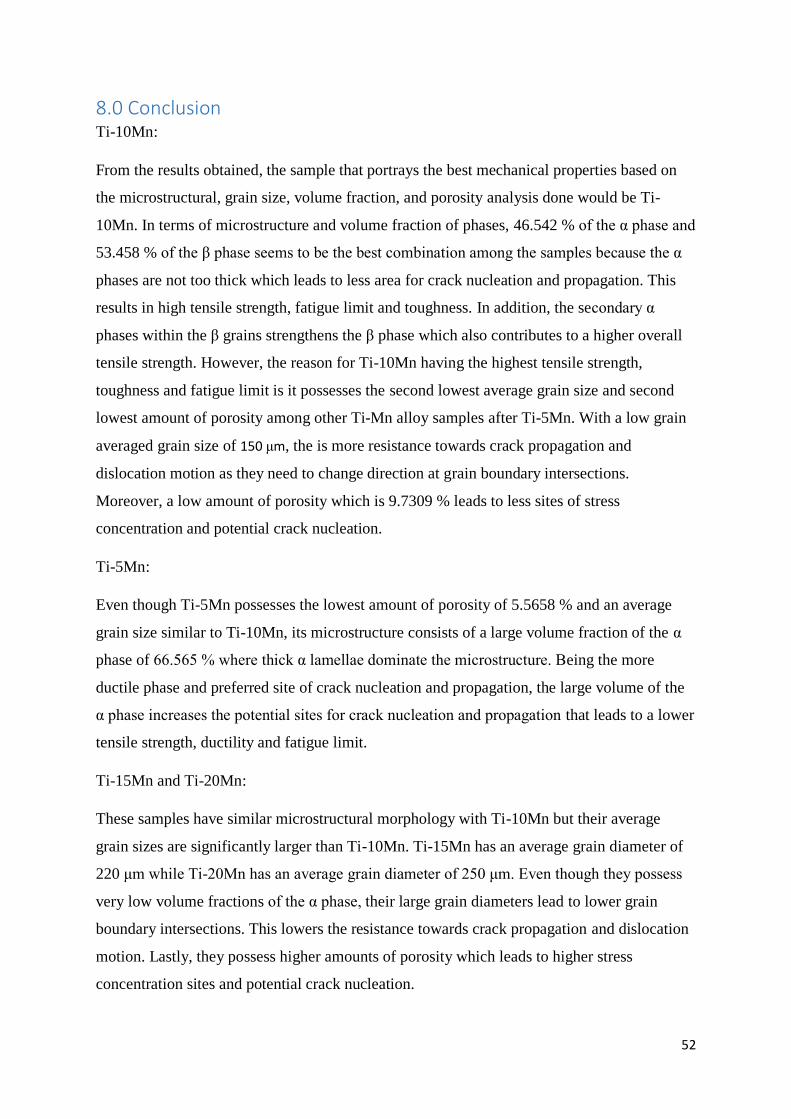
52
8.0 Conclusion Ti-10Mn:
From the results obtained, the sample that portrays the best mechanical properties based on
the microstructural, grain size, volume fraction, and porosity analysis done would be Ti-
10Mn. In terms of microstructure and volume fraction of phases, 46.542 % of the α phase and
53.458 % of the β phase seems to be the best combination among the samples because the α
phases are not too thick which leads to less area for crack nucleation and propagation. This
results in high tensile strength, fatigue limit and toughness. In addition, the secondary α
phases within the β grains strengthens the β phase which also contributes to a higher overall
tensile strength. However, the reason for Ti-10Mn having the highest tensile strength,
toughness and fatigue limit is it possesses the second lowest average grain size and second
lowest amount of porosity among other Ti-Mn alloy samples after Ti-5Mn. With a low grain
averaged grain size of 150 μm, the is more resistance towards crack propagation and
dislocation motion as they need to change direction at grain boundary intersections.
Moreover, a low amount of porosity which is 9.7309 % leads to less sites of stress
concentration and potential crack nucleation.
Ti-5Mn:
Even though Ti-5Mn possesses the lowest amount of porosity of 5.5658 % and an average
grain size similar to Ti-10Mn, its microstructure consists of a large volume fraction of the α
phase of 66.565 % where thick α lamellae dominate the microstructure. Being the more
ductile phase and preferred site of crack nucleation and propagation, the large volume of the
α phase increases the potential sites for crack nucleation and propagation that leads to a lower
tensile strength, ductility and fatigue limit.
Ti-15Mn and Ti-20Mn:
These samples have similar microstructural morphology with Ti-10Mn but their average
grain sizes are significantly larger than Ti-10Mn. Ti-15Mn has an average grain diameter of
220 μm while Ti-20Mn has an average grain diameter of 250 μm. Even though they possess
very low volume fractions of the α phase, their large grain diameters lead to lower grain
boundary intersections. This lowers the resistance towards crack propagation and dislocation
motion. Lastly, they possess higher amounts of porosity which leads to higher stress
concentration sites and potential crack nucleation.
53
9.0 Recommendation After performing this study on the microstructure of Ti-Mn alloys, it is vital to further explore
and develop the potentials of Ti-Mn produced via powder metallurgy for biomedical
purposes. In context of this research, the recommendations are listed below:
1. Perform strength and hardness tests to confirm the correlation of microstructure with
the mechanical properties of Ti-Mn alloys.
2. Perform a toxicity analysis to confirm the toxicity level of Ti-Mn alloys as shown by
past studies.
Other developments outside the scope of this research are as follows:
1. Varying the sintering temperature, sintering period, cooling rate or compacting
pressure to explore their effects on the density of Ti-Mn alloys and other properties
such as microstructure and mechanical properties.
2. Perform additional ageing, solution treatment or heat treatments such as annealing and
quenching on Ti-Mn alloys to study their effects on the properties of the alloy such as
microstructure and mechanical properties.
3. Use hybrid densification such as spark plasma sintering (SPS), powder forging, hot
isostatic pressing (HIP) or hot powder extrusion and compare the properties of Ti-
10Mn prepared by those methods to normal furnace sintering.
4. Perform electrical and thermal conductivity test on Ti-Mn alloys to further explore
their level of biocompatibility with the human body.
5. Develop an open pore Ti-Mn alloy to imitate the structure of the human bone and
determine whether similar mechanical properties to the human bone could be
achieved. Other properties such as level of osseointegration and chemical
permeability could be analysed and compared to normal closed pore Ti-Mn alloys.
6. Perform a cost analysis to determine the most cost efficient route in powder
metallurgy for manufacturing Ti-Mn alloys.
54
References
[1] A. D. Carlos Oldani, "Titanium as a Biomaterial for Implants, Recent Advances in Arthroplasty,
Dr. Samo Fokter (Ed.)," 2012. [Online]. Available: http://www.intechopen.com/books/recent-
advances-in-arthroplasty/titanium-as-a-biomaterial-for-implants. [Accessed 4 August 2016].
[2] J. Q. H.J. Rack, " Titanium alloys for biomedical applications," Materials Science and
Engineering: C, vol. 26, no. 8, pp. 1269-1277, 2006.
[3] Y. Yang, "Surface treated cp-titanium for biomedical applications : a combined corrosion.
Engineering Sciences [physics].," Ecole Centrale, Paris, 2014.
[4] P. Santos, M. Niinomi, K. Cho, M. Nakai, H. Liu, N. Ohtsu, M. Hirano, M. Ikeda and T.
Narushima, "Microstructures, mechanical properties and cytotoxicity of low cost beta Ti-Mn
alloys for biomedical applications," Acta Biomaterialia 26, (2015) 366-376.
[5] Agency for Toxic Substances and Diseas Registry, "Publich Health Statement Aluminum,"
September 2008. [Online]. Available: http://www.atsdr.cdc.gov/ToxProfiles/tp22-c1-b.pdf.
[Accessed 1 6 2016].
[6] U.S. DEPARTMENT OF HEALTH AND HUMAN SERVICES, "Toxicology Profile for Vanadium:
Agency for Toxic Susbtances and Disease Registry," September 2012. [Online]. Available:
http://www.atsdr.cdc.gov/ToxProfiles/tp58.pdf. [Accessed 17 August 2016].
[7] Geoscience Australia, "Manganese Ore: Australian Mine Atlas," 2012. [Online]. Available:
http://www.australianminesatlas.gov.au/aimr/commodity/manganese_ore.html. [Accessed
18 May 2016].
[8] J. H. Downing, "Manganese processing, Encyclopaedia Brittanica Incorporated," 15 October
2016. [Online]. Available: https://www.britannica.com/technology/manganese-processing.
[Accessed 3 March 2016].
[9] F. O. R. Thümmler, Introduction to Powder Metallurgy, London: Maney Publishing for IOM3,
the Institute of Materials, Minerals and Mining, 1993.
[1
0]
C. W. J. G. A. Lutjering G, Microstructure and Mechanical Properties of Titanium Alloys,
Cincinnati: General Electric Aircraft Engines, 1990.
[1
1]
F. B. E. Zhang, Novel Titanium Manganese Alloys and Their Macroporous Foams for Biomedical
Applications Prepeared by Field Assisted Sintering, Rostock: InTech, 2011.
[1
2]
AZoM, "Article: AZoNetwork Limited," AZoNetwork Limited, 24 September 2001. [Online].
Available: http://www.azom.com/article.aspx?ArticleID=915. [Accessed 27 April 2016].
[1
3]
G. Leventhal, "Titanium, a metal for surgery," The Journal of Bone and Join Surgery, vol. 33, no.
2, p. 473–474, 1951.
55
[1
4]
R. Rudy, P. A. Levi, F. J. Bonacci, A. S. Weisgold and D. Engler-Hamm, "Intraosseous anchorage
of dental prostheses: an early 20th century contribution," The Compendium of continuing
education in dentistry Journal, vol. 29, no. 4, p. 220–229, 2008.
[1
5]
AZoM, "Article: AZoNetwork Limited," AZoNetwork Limited, 11 January 2003. [Online].
Available: http://www.azom.com/article.aspx?ArticleID=1794. [Accessed 28 July 2016].
[1
6]
Z. Yin, H. Jiang, E.-S. Y. Lee, M. Ni, K. M. Erikson, D. Milatovic, A. B. Bowman and M. Aschner,
"Ferroportin is a manganese-responsive protein that decreases manganese cytotoxicity and
accumulation," Journal of Neurochemistry, vol. 5, no. 112, pp. 1190-8, 2010.
[1
7]
European Powder Metallurgy Association, "Powder Metallurgy: European Powder Metallurgy
Association," 2008. [Online]. Available: http://www.epma.com/what-is-powder-metallurgy.
[1
8]
The Essential Chemical Industry online, "Titanium: Metals: The Essential Chemical Industry
online," 15 January 2015. [Online]. Available:
http://www.essentialchemicalindustry.org/metals/titanium.html. [Accessed 15 September
2016].
[1
9]
A. K. X Goso, "PRODUCTION OF TITANIUM METAL POWDER BY THE HDH PROCESS,"
Pyrometallurgy division, Mintek, Johannesburg , 2010.
[2
0]
ASM International, "Documents: ASM International," September 2012. [Online]. Available:
http://www.asminternational.org/documents/10192/1877324/amp17009p16.pdf/2df24a9d-
754d-4801-8aa1-3759cf4e6b64/AMP17009P16. [Accessed 14 September 2016].
[2
1]
C. B. Ali Alagheband, "Plasma Atomization goes commercial," Metal Powder Report, vol. 53,
no. 11, pp. 26-28, 1998.
[2
2]
Strebl Energy, "Plasma Atomization," Strebl Energy Pte Ltd, 2016. [Online]. Available:
http://streblenergy.com/plasma-atomization/. [Accessed 3 May 2016].
[2
3]
AMT Advanced Materials Technology Gesellschaft mit beschränkter Haftung, "Processing:
AMT Advanced Materials Technology Gesellschaft mit beschränkter Haftung," [Online].
Available: http://amt-advanced-materials-technology.com/processing/gas-atomization/.
[Accessed 19 August 2016].
[2
4]
TLS Technik GmbH & Co, "The Process: TLS Technik AMT Advanced Materials Technology
Gesellschaft mit beschränkter Haftung & Corported," [Online]. Available: http://www.tls-
technik.de/e_2.html. [Accessed 11 August 2016].
[2
5]
Civil Engineering Handbook, "Powder Metallurgy: Civil Engineering Handbook," 1 July 2016 .
[Online]. Available: http://www.civilengineeringhandbook.tk/powder-
metallurgy/plasmarotating-electrode-process.html. [Accessed 14 September 2016 ].
[2
6]
what-when-how.com, "Isostatic Pressing: what-when-how.com," [Online]. Available:
http://what-when-how.com/materialsparts-and-finishes/isostatic-pressing/. [Accessed 1
October 2016].
56
[2
7]
Powder Injection Moulding International, "What is PIM? Powder Injection Moulding
International," 1999. [Online]. Available: http://www.pim-
international.com/what_is_metal_injection_moulding.
[2
8]
R. B. Rajesh Chaudhari, "Microstructure and Mechanical Properties of Titanium Processedby
Spark Plasma Sintering (SPS)," Metallogr. Microstruct. Anal., vol. 3, p. 30–35, 2014.
[2
9]
C. T. J. B. A. Lucía Reig 1, "Microstructure and Mechanical Behavior of Porous Ti–6Al–4V,"
Molecular Diversity Preservation International, vol. 6, pp. 4868-4878, 2013.
[3
0]
K. Nogita, "Lecture Note: Learn.UQ," 2015. [Online]. Available:
https://learn.uq.edu.au/webapps/blackboard/content/listContent.jsp?course_id=_34190_1&c
ontent_id=_1727493_1&mode=reset. [Accessed 12 10 2016].
[3
1]
Lenntech Besloten Vennootschap met beperkte aansprakelijkheid, "Periodic Table: Lenntech
Besloten Vennootschap met beperkte aansprakelijkheid," Lenntech Besloten Vennootschap
met beperkte aansprakelijkheid, 2016. [Online]. Available:
http://www.lenntech.com/periodic/elements/mn.htm. [Accessed 10 10 2016].
[3
2]
Royal Society of Chemistry Organisation, "Periodic Table: Royal Society of Chemistry
Organisation," Royal Society of Chemistry Organisation, 2016. [Online]. Available:
http://www.rsc.org/periodic-table/element/22/titanium. [Accessed 10 10 2016].
[3
3]
The Library of Manufacturing, "Pressing And Sintering: The Library of Manufacturing,"
[Online]. Available: http://thelibraryofmanufacturing.com/pressing_sintering.html. [Accessed
12 8 2016].
[3
4]
U.S. Department of Energy., "Critical Materials Strategy," 2011. [Online]. Available:
http://energy.gov/sites/prod/files/DOE_CMS2011_FINAL_Full.pdf. [Accessed 5 5 2016].
[3
5]
national museum australia, "Collection care and preservation policy," 6 12 2012. [Online].
Available:
http://www.nma.gov.au/about_us/ips/policies/collection_care_and_preservation_policy.
[3
6]
J. L. R. V. a. M. M. C.N. Elias, "Journals: Papers: Meyers group," March 2008. [Online].
Available: http://meyersgroup.ucsd.edu/papers/journals/Meyers%20316.pdf. [Accessed 12
September 2016].
[3
7]
Y. U. Peng, "MSE: South University of Science and Technology of China," [Online]. Available:
http://116.7.234.100/en/faculty/view/alias/dWWsd5464e. [Accessed 4 September 2016].
[3
8]
C. Mackenzie, "Health: Daily Mail Australia," Associated Newpaper limited, 26 October 2013.
[Online]. Available: http://www.dailymail.co.uk/health/article-2477338/NHS-banned-using-
toxic-metal-hip-replacements-failure-rate-soars-10-cases.html. [Accessed 20 September
2016].
[3
9]
Hospital for Special Surgery, "Conditions and Treatments: Hospital for Special Surgery," 2 April
2014. [Online]. Available: https://www.hss.edu/conditions_designing-the-modern-total-
shoulder-replacement.asp. [Accessed 19 September 2016].

57
[4
0]
AG materials Incorporated, "Product: AG materials Incorporated," [Online]. Available:
http://www.agmaterials.com/products/titaniumhydride.html. [Accessed 18 April 2016].
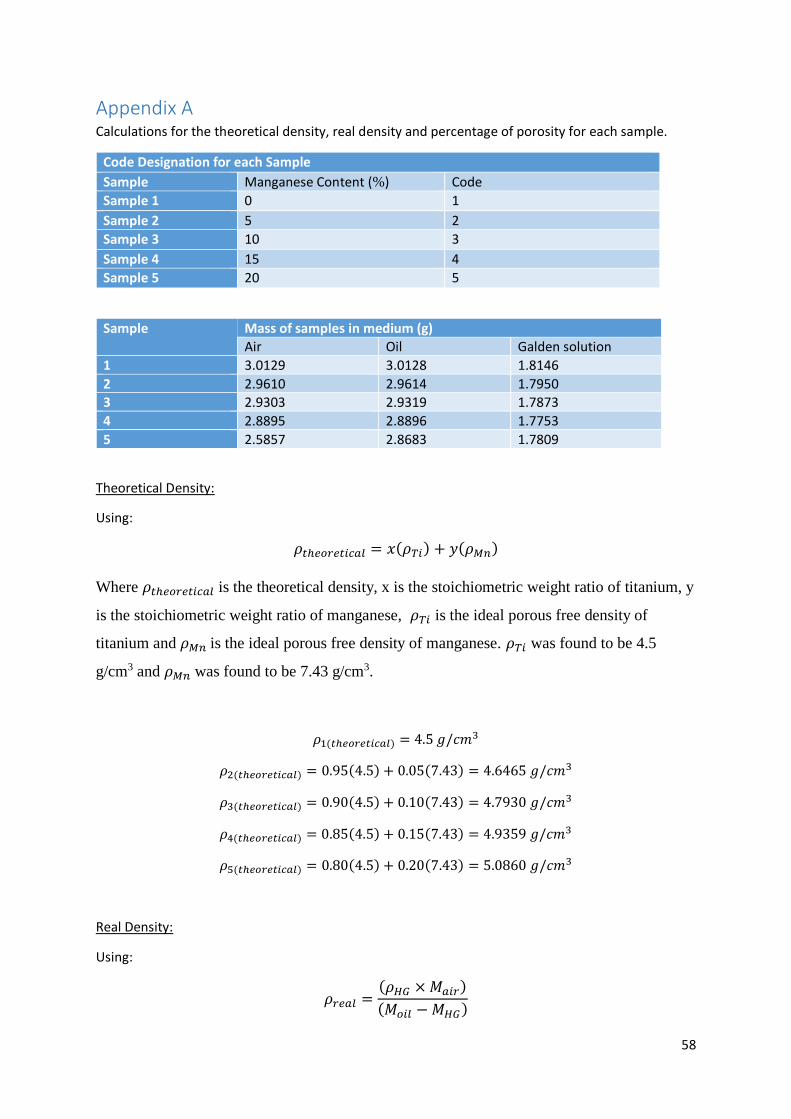
58
Appendix A Calculations for the theoretical density, real density and percentage of porosity for each sample.
Code Designation for each Sample
Sample Manganese Content (%) Code
Sample 1 0 1
Sample 2 5 2
Sample 3 10 3
Sample 4 15 4
Sample 5 20 5
Sample Mass of samples in medium (g)
Air Oil Galden solution
1 3.0129 3.0128 1.8146
2 2.9610 2.9614 1.7950
3 2.9303 2.9319 1.7873
4 2.8895 2.8896 1.7753
5 2.5857 2.8683 1.7809
Theoretical Density:
Using:
𝜌𝑡ℎ𝑒𝑜𝑟𝑒𝑡𝑖𝑐𝑎𝑙 = 𝑥(𝜌𝑇𝑖) + 𝑦(𝜌𝑀𝑛)
Where 𝜌𝑡ℎ𝑒𝑜𝑟𝑒𝑡𝑖𝑐𝑎𝑙 is the theoretical density, x is the stoichiometric weight ratio of titanium, y
is the stoichiometric weight ratio of manganese, 𝜌𝑇𝑖 is the ideal porous free density of
titanium and 𝜌𝑀𝑛 is the ideal porous free density of manganese. 𝜌𝑇𝑖 was found to be 4.5
g/cm3 and 𝜌𝑀𝑛 was found to be 7.43 g/cm3.
𝜌1(𝑡ℎ𝑒𝑜𝑟𝑒𝑡𝑖𝑐𝑎𝑙) = 4.5 𝑔/𝑐𝑚3
𝜌2(𝑡ℎ𝑒𝑜𝑟𝑒𝑡𝑖𝑐𝑎𝑙) = 0.95(4.5) + 0.05(7.43) = 4.6465 𝑔/𝑐𝑚3
𝜌3(𝑡ℎ𝑒𝑜𝑟𝑒𝑡𝑖𝑐𝑎𝑙) = 0.90(4.5) + 0.10(7.43) = 4.7930 𝑔/𝑐𝑚3
𝜌4(𝑡ℎ𝑒𝑜𝑟𝑒𝑡𝑖𝑐𝑎𝑙) = 0.85(4.5) + 0.15(7.43) = 4.9359 𝑔/𝑐𝑚3
𝜌5(𝑡ℎ𝑒𝑜𝑟𝑒𝑡𝑖𝑐𝑎𝑙) = 0.80(4.5) + 0.20(7.43) = 5.0860 𝑔/𝑐𝑚3
Real Density:
Using:
𝜌𝑟𝑒𝑎𝑙 =(𝜌𝐻𝐺 × 𝑀𝑎𝑖𝑟)
(𝑀𝑜𝑖𝑙 − 𝑀𝐻𝐺)
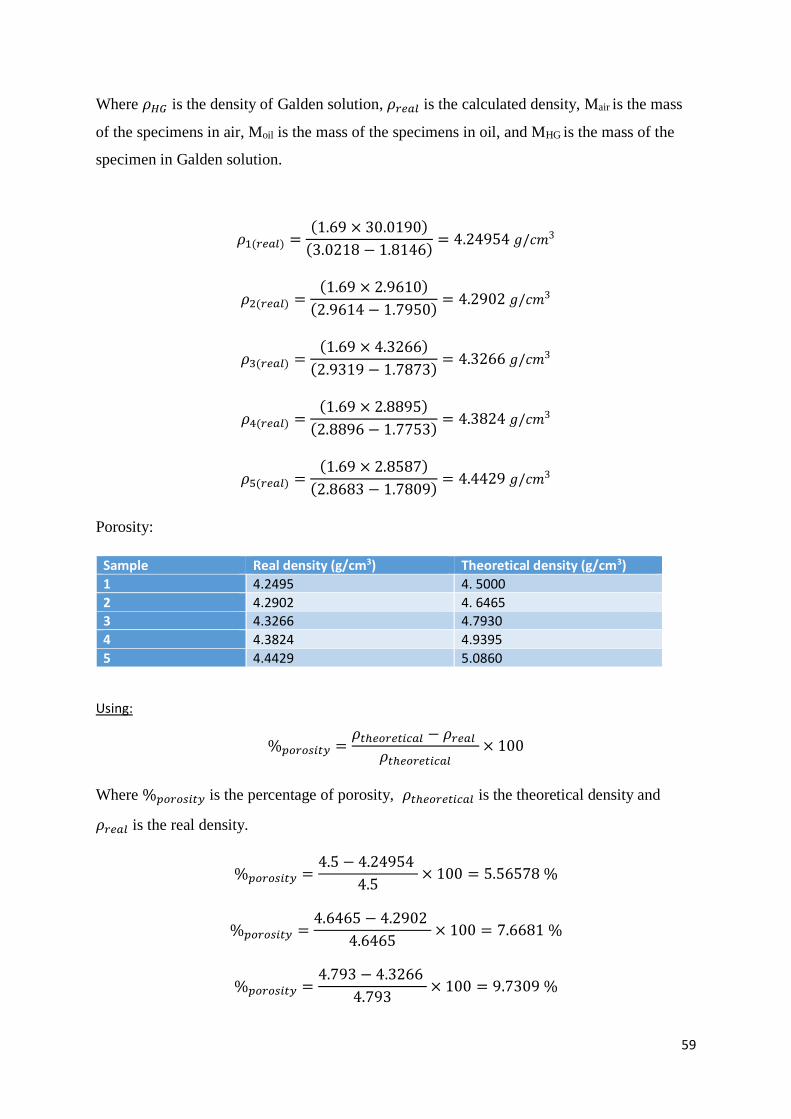
59
Where 𝜌𝐻𝐺 is the density of Galden solution, 𝜌𝑟𝑒𝑎𝑙 is the calculated density, Mair is the mass
of the specimens in air, Moil is the mass of the specimens in oil, and MHG is the mass of the
specimen in Galden solution.
𝜌1(𝑟𝑒𝑎𝑙) =(1.69 × 30.0190)
(3.0218 − 1.8146)= 4.24954 𝑔/𝑐𝑚3
𝜌2(𝑟𝑒𝑎𝑙) =(1.69 × 2.9610)
(2.9614 − 1.7950)= 4.2902 𝑔/𝑐𝑚3
𝜌3(𝑟𝑒𝑎𝑙) =(1.69 × 4.3266)
(2.9319 − 1.7873)= 4.3266 𝑔/𝑐𝑚3
𝜌4(𝑟𝑒𝑎𝑙) =(1.69 × 2.8895)
(2.8896 − 1.7753)= 4.3824 𝑔/𝑐𝑚3
𝜌5(𝑟𝑒𝑎𝑙) =(1.69 × 2.8587)
(2.8683 − 1.7809)= 4.4429 𝑔/𝑐𝑚3
Porosity:
Sample Real density (g/cm3) Theoretical density (g/cm3)
1 4.2495 4. 5000
2 4.2902 4. 6465
3 4.3266 4.7930
4 4.3824 4.9395
5 4.4429 5.0860
Using:
%𝑝𝑜𝑟𝑜𝑠𝑖𝑡𝑦 =𝜌𝑡ℎ𝑒𝑜𝑟𝑒𝑡𝑖𝑐𝑎𝑙 − 𝜌𝑟𝑒𝑎𝑙
𝜌𝑡ℎ𝑒𝑜𝑟𝑒𝑡𝑖𝑐𝑎𝑙× 100
Where %𝑝𝑜𝑟𝑜𝑠𝑖𝑡𝑦 is the percentage of porosity, 𝜌𝑡ℎ𝑒𝑜𝑟𝑒𝑡𝑖𝑐𝑎𝑙 is the theoretical density and
𝜌𝑟𝑒𝑎𝑙 is the real density.
%𝑝𝑜𝑟𝑜𝑠𝑖𝑡𝑦 =4.5 − 4.24954
4.5× 100 = 5.56578 %
%𝑝𝑜𝑟𝑜𝑠𝑖𝑡𝑦 =4.6465 − 4.2902
4.6465× 100 = 7.6681 %
%𝑝𝑜𝑟𝑜𝑠𝑖𝑡𝑦 =4.793 − 4.3266
4.793× 100 = 9.7309 %
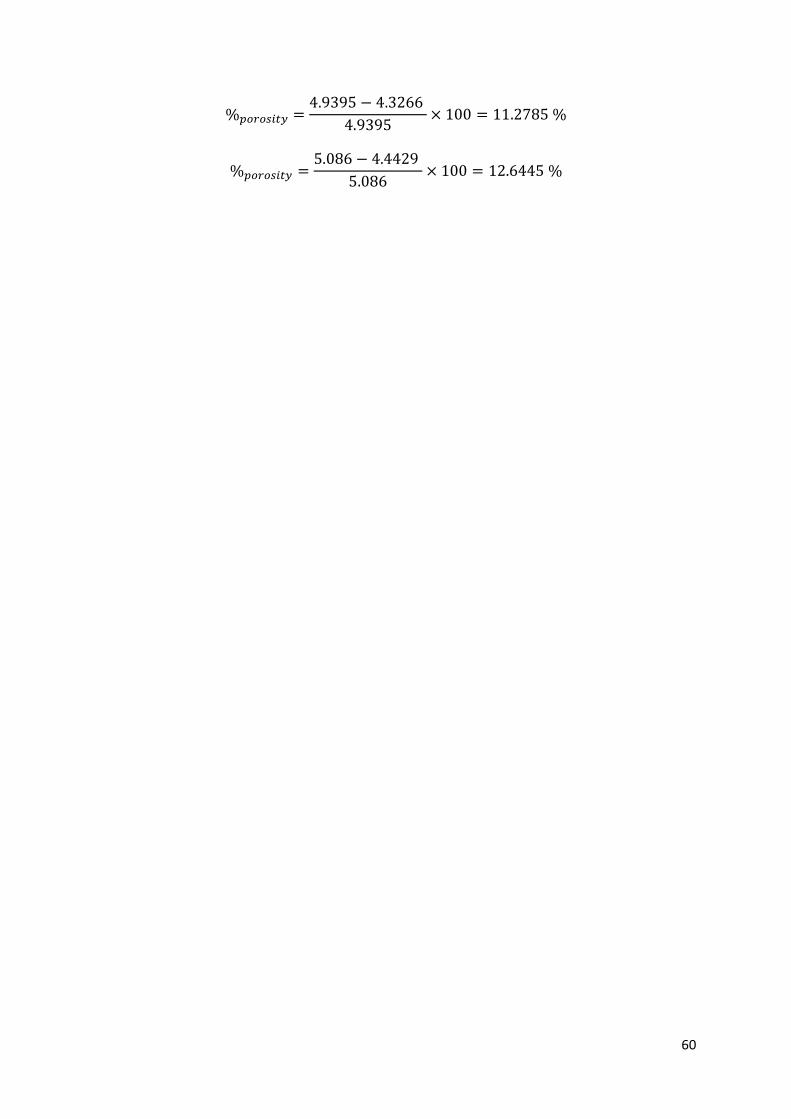
60
%𝑝𝑜𝑟𝑜𝑠𝑖𝑡𝑦 =4.9395 − 4.3266
4.9395× 100 = 11.2785 %
%𝑝𝑜𝑟𝑜𝑠𝑖𝑡𝑦 =5.086 − 4.4429
5.086× 100 = 12.6445 %


![of Ti 6Al 4V Ti 6Al 4V 1B for FRIB beam dumppuhep1.princeton.edu/mumu/target/FRIB/amroussia_112613.pdfTi-6Al-4V vs Ti-6Al-4V-1B Alloy Ti‐6Al‐4V Ti‐6Al‐4V‐1B E [GPa] At RT](https://img.pdfslide.us/doc/110x75/5eb2d6d755eb4c7aaa54e97d/of-ti-6al-4v-ti-6al-4v-1b-for-frib-beam-ti-6al-4v-vs-ti-6al-4v-1b-alloy-tia6ala4v.jpg)