Embed Size (px)
Citation preview

Riparian Restoration and Managementof Arid and Semiarid Watersheds
Item Type text; Electronic Dissertation
Authors Bunting, Daniel Paul
Publisher The University of Arizona.
Rights Copyright © is held by the author. Digital access to this materialis made possible by the University Libraries, University of Arizona.Further transmission, reproduction or presentation (such aspublic display or performance) of protected items is prohibitedexcept with permission of the author.
Download date 25/06/2018 18:58:56
Link to Item http://hdl.handle.net/10150/228166
RIPARIAN RESTORATION AND MANAGEMENT OF ARID AND SEMIARID
WATERSHEDS
by
Daniel P. Bunting
_____________________
A Dissertation Submitted to the Faculty of the
SCHOOL OF NATURAL RESOURCES AND THE ENVIRONMENT
In Partial Fulfillment of the Requirements
For the Degree of
DOCTOR OF PHILOSOPHY
WITH A MAJOR IN WATERSHED HYDROLOGY AND MANAGEMENT
In the Graduate College
THE UNIVERSITY OF ARIZONA
2012

2
THE UNIVERSITY OF ARIZONA
GRADUATE COLLEGE
As members of the Dissertation Committee, we certify that we have read the dissertation
prepared by Daniel P. Bunting
entitled, ―Riparian Restoration and Management of Arid and Semiarid Watersheds‖
and recommend that it be accepted as fulfilling the dissertation requirement for the
Degree of Doctor of Philosophy
________________________________________________ Date: 4/19/2012
Shirley Papuga
________________________________________________ Date: 4/19/2012
Stuart Marsh
________________________________________________ Date: 4/19/2012
Randy Gimblett
________________________________________________ Date: 4/19/2012
Russell Scott
________________________________________________ Date: ___________
Final approval and acceptance of this dissertation is contingent upon the candidate‘s
submission of the final copies of the dissertation to the Graduate College.
I hereby certify that I have read this dissertation prepared under my direction and
recommend that it be accepted as fulfilling the dissertation requirement.
________________________________________________ Date: ___________
Dissertation Director: Shirley Papuga

3
STATEMENT BY AUTHOR
This dissertation has been submitted in partial fulfillment of requirements for an
advanced degree at the University of Arizona and is deposited in the University Library
to be made available to borrowers under rules of the Library.
Brief quotations from this dissertation are allowable without special permission, provided
that accurate acknowledgment of source is made. Requests for permission for extended
quotation from or reproduction of this manuscript in whole or in part may be granted by
the head of the major department or the Dean of the Graduate College when in his or her
judgment the proposed use of the material is in the interests of scholarship. In all other
instances, however, permission must be obtained from the author.
SIGNED: Daniel P. Bunting

4
ACKNOWLEDGEMENTS
This dissertation would not have been possible without the guidance of my major advisor,
Shirley Papuga, and the rest of my doctoral committee, Edward Glenn, Stuart Marsh,
Randy Gimblett, and Russell Scott. I also extend my gratitude to Phil Guertin, Pamela
Nagler, and Mark Briggs who offered much advice, support, and mentorship throughout
my graduate career as well as Cheryl Craddock and Katie Hughes for their guidance.
The Papuga Research Lab has been invaluable to my progress and I thank them for their
knowledge and moral support: Andy Neal, Jon Martin, Lisa Benton, Michelle
Cavanaugh, Zulia Mayari Sanchez Mejia, Krystine Nelson, and Bhaskar Mitra. I thank
all of my fellow graduate students and colleagues for their advice and support, and in
particular Tyson Swetnam, Jamie Massart, Abd salam El Vilaly, and Susanna Pearlstein.
Funding for this research was provided by a National Science Foundation Graduate
Research Fellowship and their support is gratefully acknowledged. I would also like to
thank the Semi-Arid Hydrology and Riparian Areas (SAHRA) program and the US
Geological Survey, Southwest Biological Science Center, Sonoran Desert Research
Station, University of Arizona for supplemental funding to attend conferences and
seminars.
Data for this study were provided by the Ameriflux network and were used in accordance
with their fair-use policy. Data were also provided by the USDA-ARS Southwest
Watershed Research Center.
I would also like to thank Mike Milczarek from GeoSystems Analysis, Inc. and Leslie
Gunatilaka from the Southwest Center for Natural Products Research and
Commercialization for employment, experience, and support throughout my graduate
years.
Lastly, thank you to my parents, Joni and Winston, my brother Benjamin, and my
girlfriend Lindsey.

5
DEDICATION
To my dad, Winston Scot Bunting, who passed away in June 2009.
Through you I live my life by the Golden Rule and always aspire to better myself so I can
help others.

6
TABLE OF CONTENTS
ABSTRACT ........................................................................................................................ 7
1. INTRODUCTION .......................................................................................................... 9
1.1 Background ........................................................................................................... 9
1.2 Research Objectives ............................................................................................ 15
1.3 Dissertation Format ............................................................................................. 22
2. PRESENT STUDY ....................................................................................................... 24
2.1 Restoring rivers in the semiarid and arid southwestern United States and
northern Mexico: Lessons learned from the past to benefit future riparian
restoration ................................................................................................................. 24
2.2 Long-term vegetation dynamics after high-density seedling establishment:
Implications for riparian restoration and management ............................................. 26
2.3 Using remote sensing and eddy covariance data to determine
evapotranspiration across a water-limitation gradient .............................................. 28
2.4 Future Research Opportunities ....................................................................... 30
2.4.1 Regional River Restoration ..................................................................... 30
2.4.2 Local River Restoration .......................................................................... 32
2.4.3 Water Resources ...................................................................................... 34
REFERENCES. ................................................................................................................ 37
APPENDIX A: RESTORING RIVERS IN ARID AND SEMIARID SOUTHWESTERN
UNITED STATES AND NORTHERN MEXICO: LESSONS LEARNED FROM THE
PAST TO BENEFIT FUTURE RIPARIAN RESTORATION ........................................ 43
APPENDIX B: LONG-TERM VEGETATION DYNAMICS AFTER HIGH-DENSITY
SEEDLING ESTABLISHMENT: IMPLICATIONS FOR RIPARIAN RESTORATION
AND MANAGEMENT .................................................................................................... 83
APPENDIX C: USING REMOTE SENSING AND EDDY COVARIANCE DATA TO
DETERMINE EVAPOTRANSPIRATION ACROSS A WATER-LIMITATION
GRADIENT .................................................................................................................... 128

7
ABSTRACT
Riparian ecosystems are valued for ecosystem services which have impacts on the
well-being of humans and the environment. Anthropogenic disturbances along rivers in
arid and semiarid regions have altered historical flow regimes and compromised their
integrity. Many rivers are hydroecologically deteriorated, have diminished native
riparian forests, and are pressured for their water supplies.
My first study is founded on the premise that river restoration has increased
exponentially with little documentation on effectiveness. We designed a conference to
discuss lessons learned from past restoration activities to benefit future efforts.
Participants, who included scientists, managers, and practitioners, agreed that creating
measureable objectives with subsequent monitoring is essential for quantifying success
and employing adaptive management. Attendees stated that current projects are local and
have limited funding and time, whereas future efforts must have longer funding cycles,
larger timeframes, should contribute to regional goals, and address factors responsible for
ecological decline. Bridging gaps among science, management, and policy in the 21st
century is a key component to success.
My second study focused on the benefits of long-term monitoring of local riparian
restoration. Many efforts include revegetation components to re-establish native
cottonwood-willow communities, but do not address how high-density establishment
impacts vegetation dynamics and sustainability. Over five years, we documented
significantly higher growth rates, lower mortality, and higher cover in cottonwood

8
compared to non-native tamarisk. Cottonwood height, diameter at breast height, growth
rates, and foliar volumes were reduced at higher densities. Herbaceous species decreased
every year but native shrubs volunteered after two years resulting in a reduction of
overall plant diversity from 2007-2009 with a slight increase from 2009-2011.
My third study focused on improving basin-scale evapotranspiration (ET), a large
component of the water budget, to better inform water resource allocation. My research
suggests that multiple models are required for basin-scale ET estimates due to vegetation
variability across water-limitation gradients. We created two empirical models using
remote sensing, a multiplicative riparian ET model (r2=0.92) using MODIS nighttime
land surface temperature (LSTn) and enhanced vegetation index, and an upland ET model
(r2=0.77) using multiple linear regression replacing LSTn with a precipitation input.

9
1. INTRODUCTION
1.1 Background
Riparian ecosystems provide ecosystem services (e.g., cycling soil and nutrients,
replenishing aquifers, treating pollutants, providing water supply, providing recreation
opportunities, etc.) worldwide and support human water demands for agriculture,
municipal use, and industry (Malanson, 1995). Ecosystem services are also extremely
important in arid and semiarid regions where they support (e.g., via refuge, habitat,
migratory corridors) the majority of the region‘s wildlife species and maintain high
biodiversity and ecosystem productivity (Knopf et al. 1988; Malanson, 1995). Riparian
ecosystems in Arizona for example, make up less than 0.5% of the total land surface area,
yet up to 75% of all resident wildlife depends on them for at least part of their lifespan
(Arizona Riparian Council 1995). Often referred to as the ―kidneys of the landscape,‖
wetlands and other riparian ecosystems play an integral role in maintaining ecological
function and will continue to be valued by humans and wildlife whose well-being
depends on them.
Western riparian ecosystems in the United States (US) have undergone significant
changes in the past century to prevent flooding, supply energy, satisfy agricultural
demands, and supply water to growing desert metropolitan areas (Rood and Mahoney
1990, 1991, Nilsson and Svedmark, 2002). River impoundment, land-use change,
surface and groundwater extraction, and artificial inter- and intra-basin transfers
profoundly alter natural flow regimes (Poff et al. 1997, Naiman et al. 2002, Postel and
10
Richter 2003, Revenga et al. 2005, Pearce 2007). These anthropogenic disturbances have
compromised the integrity of many western US river systems (Poff et al. 1997; Ward &
Stanford 1995), meanwhile urban population growth in the Southwest continues to
increase human consumptive water use as well as agricultural, commercial, and industrial
demands (Gollehon and Quinby 2006). Climate change predictions, which include
higher temperatures (IPCC 2007), less precipitation in arid and semiarid regions (IPCC
2007, Hall et al. 2008), and decreased snow accumulation in the Rocky Mountains (IPCC
2007, Pederson et al. 2011) exacerbate concerns surrounding future water resources and
allocations.
Rising concerns over the deterioration of riparian ecosystems and subsequent
impacts on ecosystems services, wildlife habitat, and water resources have stimulated
increased efforts to restore rivers across the US. In fact, restoration efforts have
increased exponentially since the 1980s and thousands of restoration projects have been
implemented since the turn of the 21st century (National River Restoration Science
Synthesis 2006). However, concerns regarding project efficacy and foci are arising when
considering the magnitude of projects and associated costs with little documentation on
overall effectiveness (Follstad Shah et al. 2007, Palmer et al. 2007). Restoration efforts
have been typically directed toward site-specific projects within small areas or with a
single disciplinary focus narrowly defined and confined to a specific species that may be
threatened-endangered or a species with sport or commercial interest (Hauer and Lorang
2002). In the future, efforts must be made in a basin-wide perspective because planning

11
based on isolated components (fish, vegetation, restoration of specific stream sections) is
ecologically incomplete and may lead to unintended consequences (Naiman et al. 1993).
Costs associated with restoration and enhancement of streams and rivers within
the continental US has been estimated at $14 to $15 billion since 1990, and is now over
$1 billion per year (Bernhardt et al. 2005). Although river restoration projects have
increased exponentially in the last 25 years, most have failed to report successes and
failures due to the lack of a sound monitoring program (Bernhardt et al. 2005). Smaller
projects often fail to include post-treatment evaluations during the planning and design
phases (Palmer et al. 2007), thus valuable information regarding success and failures is
lost and not disseminated to the broader restoration community. Often overlooked and
underfunded, ecological monitoring is a valuable component of restoration that can
provide the data needed to alter management in a manner that will improve effectiveness
(Bernhardt and Palmer 2011, Briggs 2011). River restoration efforts implemented in the
southwestern US follow the national trends elucidated by Bernhardt et al. (2005) and
Follstad Shah et al. (2007), including increased project numbers and high costs with little
investment toward reporting results. While the Southwest generally has a higher
percentage of projects with monitoring components compared to nation-wide statistics,
Bernhardt et al. (2005) also found that most projects with monitoring protocols do not
have appropriate information for quantifying success nor do they disseminate results.
River restoration needs to be redefined in the 21st century. Current water
management practices may no longer be appropriate for the unpredictable flow regimes
of a warmer and more densely populated world (Vörösmarty et al. 2004, Alcamo et al.

12
2008, Milly et al. 2008, Palmer et al. 2008). Owing to the fact that it is currently
impossible to use existing databases to determine whether desired environmental benefits
of river restoration are being achieved (Follstad Shah et al., Palmer and Allan 2006), it is
essential that the river restoration community makes a concerted effort to change
restoration directives. Future restoration will face graver challenges and have different
goals and objectives than past efforts (Palmer et al. 2007). Independent of scale, future
river restoration planning and implementation could be improved if practitioners would
report results from current management practices, regardless of whether they were
effective or not. Opening communication between river scientists, managers,
practitioners and policy-makers could foster collaboration and partnerships required to
meet broad-scale restoration goals in the future. The US needs regulatory and legislative
federal policy reforms in order to improve the effectiveness of river restoration and thus
the health of the nation‘s waterways (Palmer and Allan 2006). Unless political and
institutional cooperation can be achieved, the rich array of biologically diverse resources
and ecological services associated with riparian corridors will continue to be exploited or
wasted (Naiman et al. 1993).
Native riparian forests are perhaps the most affected by the physical degradation
of western US rivers. Native riparian forests in the southwestern US consist primarily of
cottonwood (Populus spp.) and willow (Salix spp.) communities that support wildlife,
biodiversity, watershed protection, and recreation in an otherwise unproductive arid
region (Fenner et al. 1985, Szaro 1989, Patten 1998). They are considered among the
most threatened forest types in the US (Swift 1984, Busch and Smith 1995, Shafroth et al.

13
2005) due to severe degradation resulting from altered riparian ecosystem hydrology
(Rood and Mahoney 1990, 1991, Stromberg 1993, Lite and Stromberg 2005, Hultine et
al. 2010). Dam regulation and water diversions alter flow regimes and often result in
decreased soil moisture and increased soil salinization (Busch and Smith 1995, Sala and
Smith 1996, Glenn et al. 1998, Nagler et al. 2008), channel narrowing and incision
(Shafroth et al. 2002), floodplain disconnection, and non-native species invasions that
facilitate higher fire frequency (Busch 1995). Collectively, these impacts diminish the
ability for native species to recruit and establish large stands (Howe and Knopf 1991,
Johnson 1992, Merrit and Poff 2010, Mortensen and Weisberg 2010). Re-establishing
cottonwood-willow communities has become a major component of river restoration in
the Southwest. Although revegetation alone cannot return full hydroecological function
to southwestern rivers, many efforts will continue to include management that focuses on
habitat creation for avian and other terrestrial communities that are considered sensitive,
threatened, or endangered species under federal regulations.
While small-scale projects provide limited hydroecological benefit and typically
cannot address the main stressors causing hydroecological deterioration, they can be
completed quickly, are less costly than large-scale projects, provide opportunities for
learning how to improve large-scale success, and can be visited by funders and
stakeholders to garner support for larger-scale efforts (Briggs 2011). Small-scale or pilot
projects, when implemented appropriately, can become important contributions to broad-
scale restoration programs and goals. Local scale projects can demonstrate success often
necessary to engage public support and stakeholder buy-in, which is important to the
14
long-term viability of restoration activities (Briggs 2011). Pilot projects also provide
baseline research and experience for restoration practitioners to determine the feasibility
for implementing restoration strategies. For instance, as part of the Multi-Species
Conservation Program (MSCP), the US Bureau of Reclamation is conducting baseline
research and implementing demonstration projects on the Cibola National Wildlife
Refuge to determine the viability and cost-effectiveness of various management practices
(USBR 2011). The revegetation component of the MSCP, in particular, aims to create
and maintain 2400 ha of cottonwood-willow habitat. Due to ability to purchase
agricultural lands and transfer associated water rights, many reclaimed agricultural areas
will be used for revegetation practices. Concerns have been raised regarding whether
reclaimed agricultural fields are even suitable for long-term restoration of native riparian
habitat (see Aaron 2001). The overall effectiveness of each method applied on
agricultural lands will require long-term evaluations on ecological factors (e.g.,
vegetation dynamics and sustainability, quality of habitat created, ability to support
targeted wildlife species) as well as hydrological factors (Nelson and Anderson 1999,
Stromberg et al. 2007). Other research suggests that long-term vegetation success can
only be quantified with short-term data that evaluates biotic integrity, hydrologic
function, and soil and site stability (Harrick et al. 2006).
Regardless of the river restoration tactic employed, restoration activities and
management have important implications on water resources in the desert Southwest
(Lite and Stromberg 2005, Nagler et al. 2008). Restoration often involves planting native
trees that require large amounts of water during the establishment phase and, in some
15
cases, the life of the project (Hartwell et al. 2010). Revegetation for instance, often
involves establishing native hydroriparian phreatophytes, which are capable of returning
large amounts of water to the atmosphere via transpiration (Nagler et al. 2008). This high
consumptive water use by native vegetation has direct implications on water resources
management, especially considering that water lost by riparian vegetation cannot be used
for human uses. Basin-wide scales are important from a management perspective
because accurate evapotranspiration (ET) estimates are required to estimate how much
regional water can be safely allocated to human needs while supporting environmental
needs (Commission for Environmental Cooperation 1999, Congalton et al. 1998, Hansen
and Gorbach 1997, U.S. Department of Interior 2002, Leenhouts et al. 2006). River
restoration and agricultural practices alike can affect regional water budgets because
consumptive water use may differ spatially and temporally. Scientists need to develop
tools and models to inform and facilitate ecologically sustainable water management,
thereby balancing human and ecological demand for freshwater in complex, dynamic and
changing social and political environments (Arthington et al. 2010). The ability of
researchers to use novel strategies to estimate ET at large scales will benefit managers
who aim to sustain water resources for humans and the environment.
1.2 Research Objectives
The objective of this research is to contribute to river restoration and watershed
management in arid and semiarid regions. River restoration in the 21st century faces
more challenges than ever before and successful recovery of degraded riparian

16
ecosystems will be determined by realistic strategies that incorporate science and socio-
political needs. It is now more important than ever to begin approaching river restoration
in a broad context to understand the factors responsible for hydroecological decline.
Managers should embrace localized projects for their ability to provide baseline research,
but at the same time, define how these projects that provide limited hydroecological
benefit contribute to broad-scale restoration. In this context, managers can benefit from
highlighting successes and failures of small-scale projects, which provide invaluable
experience for understanding the potential and improving the efficacy of future large-
scale efforts aimed at meeting broad-scale goals. Regulated rivers may not be able to
achieve true restoration (i.e., returning a river back to its wild state, or pre-impact levels)
which often aims at restoring hydroecological processes. However, if steps toward
ecological recovery can be achieved in a sustainable manner supported by science, then it
may be worth exploring novel approaches for restoring regulated rivers to benefit biotic
communities. Implementing monitoring protocols in future restoration efforts and
disseminating results is perhaps the only way to quantify success and employ adaptive
management strategies. Because water resources are already over-allocated and will
continue to be pressured by human populations, environmental needs, and climate
change, the ability to understand and quantify the amount of water entering and leaving
riparian landscapes is essential. Models are necessary to estimate ET and compute water
budgets at large scales so resource managers can make sound water allocation decisions,
especially considering the impacts that land-use changes (e.g., agriculture, restoration, or
development) may have on future water resources.

17
This research aims to answer three broad questions:
1) What are the most important lessons learned from past restoration activities that
can be used effectively to improve restoration in the 21st century considering such
inherent challenges as securing water supply, understanding the socio-political
environment, and meeting broad-scale goals in the face of climate change?
In order to address this question, I started by helping to organize a conference entitled
“Restoring Rivers in the Southwestern U.S. and Northern Mexico: A Bi-national
Conference on Learning from the Past for the Benefit of the Future,” which convened in
Tucson, Arizona on December 10, 2010. Headed by the World Wildlife Fund, this
conference brought together river scientists, managers, practitioners, private citizens and
policy-makers from federal and state agencies, academic institutions, non-governmental
organizations (NGOs), and tribal nations in the southwestern US, northern Mexico, and
southeastern Australia to discuss lessons learned from their river restoration experiences.
Specific focus was given to dryland rivers and the biotic communities they support in
semi-arid and arid climates. The necessity for such a conference stemmed from the
continuing ecological deterioration of rivers; increased understanding of the impacts of
climate change; and the need to share information, foster collaboration, and document
what has been learned to benefit natural resource practitioners. The inherent challenges
faced by all river restoration efforts, coupled with reduced resources for their
implementation, makes it increasingly critical to implement efforts that will be

18
successful, which is contingent upon learning from past restoration efforts, both effective
and ineffective, to improve future success. I synthesized and summarized key points
highlighted at the conference and submitted the results as a ―Set-backs and Surprises‖
article through the journal of Restoration Ecology entitled ―Restoring Rivers in the
Semiarid and Arid Southwestern United States and Northern Mexico: Lessons Learned
from the Past to Benefit Future Riparian Restoration.‖ Goals were to disseminate
valuable information to the scientific community in a way that emphasized the
importance for: 1) improving efficacy of future restoration projects by learning from past
experiences; 2) valuing ecological monitoring that quantifies objectives and is shared
among practitioners; 3) designing local restoration projects around broad-scale programs
and regional goals; 4) highlighting the need for political and institutional will that results
in longer funding cycles, longer restoration timeframes, and policy reform to achieve
regional goals. This effort also aimed to foster input and feedback for an applied
guidebook tentatively titled, ―Planning and Implementing River Restoration in the
Southwestern United States and Northern Mexico, An Applied Guidebook for Restoration
Practitioners” that will be drafted by the World Wildlife Fund.
2) What are the impacts on vegetation diversity and structural dynamics at river
restoration sites that aim to re-establish native vegetation at high densities on
reclaimed agricultural lands?

19
I addressed the second question through a long-term study at a local restoration site (i.e.,
Cibola National Wildlife Refuge) established using native seed collection and distribution
techniques. This project is unique in that data has been collected extensively over a five-
year period in a field setting where limited maintenance and minimal disturbance has
allowed species to naturally compete for resources. This study, implemented at a retired
agricultural field on the historical Colorado River floodplain, also contributeed baseline
research regarding the efficacy and sustainability of seeding riparian species at high
densities on reclaimed agricultural lands. Research was conducted to understand the
long-term impacts of using agricultural infrastructure for restoration practices, especially
considering that these areas are disconnected from the main river channel and require
long-term maintenance (e.g., irrigation). Few studies have monitored and disseminated
results after the first few years of establishment. This research specifically focused on
how density affects vegetation diversity and structural dynamics (e.g., terminal height,
diameter at breast height, number of primary and secondary limbs) over time. Results
benefit managers aiming to establish vegetation at specific densities that will meet
desired measures of diversity and structural characteristics important for habitat creation.
This research was also part of a MSCP demonstration project and supplies baseline
research for the USBR, who is tasked with re-establishing 2400 ha of cottonwood-willow
habitat. If this method of restoration can be used to establish trees with desired structural
attributes and community characteristics, large-scale restoration efforts can be
implemented using these same strategies at much lower costs compared to traditional
practices using pole-plantings or out-planted nursery stock.

20
3) How can remote sensing and eddy flux data be used to generate wide-area
estimates of ET, an important component of the water budget in arid and semiarid
systems?
To address the last question, I evaluated and refined empirical ET models using remote
sensing and micrometeorological data. Sound water resource managers must benefit
from knowing how much water can be allocated for human needs while addressing
environmental needs. Because ET is often a large component of the water budget in arid
and semiarid systems, tools are needed for large-scale estimations. Eddy flux tower
networks produce the most accurate ET measurements at moderate scales (< km), but
cannot be used alone for extrapolating ET to larger scales due to the spatial heterogeneity
of desert vegetation. Remote sensing is perhaps the only feasible way to extrapolate ET
to larger scales (> km). While a global ET product (i.e., MOD16 available through the
ORNL DAAC) exists, distinct and large differences in this product to actual ET measured
at flux towers has been observed, justifying the need to further improve upland and
riparian ET models. I aimed to understand what drives ET in riparian-influenced
vegetation compared to upland, water-limited systems. Identifying the variables that
control ET across different vegetation associations is key to modeling ET at large scales.
I addressed how ET is differentially affected across water limitation gradients (e.g.,
shallow groundwater versus no water table) and mosaic desert landscapes. The end
products were empirical ET models incorporating the most appropriate inputs for
estimating ET across riparian and upland landscapes characteristic of arid and semiarid

21
systems. This work also contributed to research associated with ET and groundwater
projects funded by the Southwest Biological Science Center, US Geological Survey.
Watershed management in arid and semiarid ecosystems broadly encompasses
many disciplines. Much of my research is dedicated to improving river restoration
practices in the future. Realizing that only 10% of river restoration projects since the
1980s have incorporated monitoring and many have failed to determine whether they
were effective at restoring ecological function (Bernhardt et al. 2005), it is essential that
we improve current restoration practices. This will take a concerted effort among river
managers, practitioners, and funders and requires bridging the gap between science and
policy. This dissertation aims to highlight and disseminate key points expressed by river
enthusiasts from private restoration firms, trying to contribute to broad-scale restoration
while employing good science, to federal and state representatives in charge of setting
overarching goals and distributing funding. My research is also dedicated to the science
aspect and provides an example of how a local effort can contribute to baseline
restoration research. In this project, I share approaches for monitoring restored
vegetation over long timeframes but also disclose that monitoring the ecological
component is only part of determining the overall effectiveness of river restoration. I
emphasize the need to select meaningful methods and demonstrate how to quantify
vegetation trends over time that will benefit managers who aim to create specific habitat.
Embracing these types of local projects for what they offer in a lessons-learned context is
invaluable to future efforts with larger goals and multiple objectives. Lastly, addressing
how water resources are managed in arid and semiarid systems is of great importance in

22
the 21st century. With most dryland rivers over-allocated or threatened by human
extractions, we as watershed managers and ecohydrologists will be faced with the
challenge to sustain water resources for humans while addressing environmental needs.
The health of our riparian ecosystems will depend on how we manage our water in the
future, which includes, but is not limited to, improving methods for estimating water
budgets, reforming water allocations, reducing human water use when possible (e.g.,
reduced agriculture, urban water conservation, etc.), improving irrigation schedules, and
securing water for environmental needs. An ecohydrologist in the 21st century must be
well-rounded, broadly trained, and well-informed in science and policy. Whether
managing watersheds, restoring rivers, or managing water resources, the ability to openly
communicate, employ novel strategies, document successes and failures, and adapt to
changes will improve resilience and the ability to succeed in the future.
1.3 Dissertation Format
Following the introduction is the ―Present Study‖ which provides a summary of
the analyses and conclusions of three papers prepared for peer-reviewed publication. The
three articles included as appendices are as follows:
Appendix A: ―Restoring Rivers in the Semiarid and Arid Southwestern United States and
Northern Mexico: Lessons Learned from the Past to Benefit Future Riparian
Restoration.‖ In this paper I synthesized and summarized key points from a ‗lessons
learned restoration conference,‘ interpreted results, and drafted the manuscript;

23
Appendix B: ―Long-term Vegetation Dynamics after High-density Seedling
Establishment: Implications for Riparian Restoration and Management.‖ In this paper I
performed all analyses, interpreted results, and drafted the manuscript;
Appendix C: ―Using Remote Sensing and Eddy Covariance Data to Determine
Evapotranspiration across a Water-limitation Gradient.‖ In this paper I performed all
analyses, interpreted results and drafted the manuscript.
Altogether these three papers discuss findings that improve the efficacy of restoring
rivers in the 21st century, re-evaluate the importance of water as a precious commodity in
arid and semiarid systems, and enhance our understanding of how radiation, vegetation,
and soil affect water transport processes.

24
2. PRESENT STUDY
The methods, results, and conclusions of this study are presented in the papers
appended to this dissertation. The following is a summary of the most important findings
in these documents.
2.1 Restoring rivers in the semiarid and arid southwestern United States and northern
Mexico: Lessons learned from the past to benefit future riparian restoration
A conference convened in Tucson, Arizona, in December 2010 brought together
river practitioners, scientists, private citizens, and conservationists from federal and state
agencies, academic institutions, and non-governmental organizations to discuss
challenges and lessons learned from past river restoration experiences for the benefit of
future river restoration efforts. Open platform discussions focused on a variety of river
restoration topics including planning, design strategies, monitoring, adaptive
management, data sharing, and community involvement.
Developing realistic restoration objectives is a key component to all river
restoration efforts and should be based on both a biophysical evaluation of river
conditions and a sound understanding of the sociopolitical environment. If the factors
that underlie a river‘s ecological deterioration cannot be addressed, it is important to ask
if the river can be restored, or if it even should be restored. While it is often not possible
to achieve true restoration, returning a river system back to its pre-impact level or wild

25
state, all restoration projects should aim to not only improve current conditions, but to
achieve a certain level of sustainability. Small-scale projects provide useful lessons and
garner stakeholder and public support, but typically produce limited biophysical benefit
so every effort in the future should contribute to broad-scale objectives and goals.
Discussions also focused on the importance of having an interdisciplinary team,
developing a realistic timeline, and—from the outset—planning all phases of the project:
design, implementation, monitoring, and evaluation. Of particular interest, was the need
to develop measureable objectives that allow practitioners to quantify success, which was
often lacking in many past projects. This also paves the way to implement adaptive
management, which, in an ecological or restoration context, is the ability to alter
management strategies to redirect a project‘s trajectory toward success, given an inherent
amount of uncertainty. Learning from past mistakes, and disclosing restoration failures is
just as important as highlighting successes, so many participants agreed that sharing data
and disseminating findings will be important for improving river restoration success in
the future.
In addition to these topics, the conference also focused on the emerging river
restoration themes of climate change, environmental flows, and restoration of trans-
boundary rivers. Planning and design that includes climate change adaptation planning
will be key to successful and resilient river restoration practices that take into account
how rising temperatures and potential shifts in snowpack and precipitation will affect
water resources. Because US and Mexico share many river miles, and policies and water
laws differ among nations, it will be increasingly important to create bi-national

26
collaborations. Both countries share similar concerns over water quantity and quality and
river restoration in particular may require liaisons and partnerships between the US
Department of Homeland Security to ensure that rivers can be protected while employing
safe strategies along international borders.
2.2 Long-term vegetation dynamics after high-density seedling establishment:
Implications for riparian restoration and management
Human disturbances have contributed to the deterioration of many western US
rivers in the past century. Cottonwood-willow communities, present historically along
the Colorado River, protect watersheds and provide wildlife habitat, but are now among
the most threatened forests. As a result, restoration efforts have increased to re-establish
and maintain cottonwood-willow stands. While successful establishment has been
observed using multiple strategies with varying investments, few projects are evaluated to
quantify efficacy and determine long-term sustainability. We monitored a seeded
cottonwood-willow site over a five-year period beginning in 2007, with particular interest
in how density affected vegetation diversity and stand structure over time.
Fremont cottonwood (Populus fremontii) and volunteer tamarisk (Tamarix
ramosissma) were the only abundant riparian trees at the site after one year. Compared to
T. ramosissma, P. fremontii had higher growth rates, lower mortality, and dominated
overstory and total cover each year. P. fremontii had an average terminal height of 2.43
m and an average diameter at breast height (DBH) of 0.76 cm, compared to 1.90 m and
27
0.36 cm, respectively, for T. ramosissma. While T. ramosissma was not significantly
affected by density, higher densities suppressed terminal height, DBH, and resulted in
lower growth rates of P. fremontii. We also showed that height-to-stem diameter
relationships of P. fremontii were explained by a power relationship. If specific and
desired structural attributes were measured in situ (e.g., foliar volumes, number of stems
or branches, etc.), allometry (e.g., relating height to DBH at different densities) could be
used to determine areas suitable for avian habitat. This could prove to be an important
tool for long-term restoration management and studying habitat suitability.
Vegetation diversity decreased from 2007-2009, but slightly increased from 2009-
2011. This likely resulted from a large reduction in herbaceous vegetation throughout the
study period, but with positive recruitment of native shrub species throughout the study
period. As expected, diversity was highest in the lowest density class (1-12 stems/m2),
but similar diversity was found among all other classes (13-24, 25-42, 43+). This
suggests that plant diversity is not affected after a certain density is reached (e.g., 13
trees/m2). Although examined qualitatively, it was apparent that the trees at our high-
density site had smaller stems and foliar volumes than trees restored at lower densities at
adjacent fields. Also of interest, was that larger trees at our site, determined by sample
root excavations, were phreatophytic after two growing seasons, and our biggest trees,
not including in our surveys due to edge effects have reached ~10 m in height with 9-10-
cm DBHs. Understanding long-term trends at densely-planted or seeded sites can benefit
restoration managers who aim to establish specific community structure and vegetation
diversity for wildlife habitat.
28
2.3 Using remote sensing and eddy covariance data to determine evapotranspiration
across a water-limitation gradient
A responsibility for water resource managers is to ensure long-term water
supplies for increasing human populations. Evapotranspiration (ET) is an important
component of the water balance and accurate estimates are important to quantify how
much water can be safely allocated for human use while supporting environmental needs.
ET measurements are often representative of small (<1 km) spatial scales, but scaling up
to basins has been problematic due to spatial and temporal variability. Satellite data,
however, provide spatially distributed remote sensing products that account for seasonal
climate and vegetation variability.
We used Moderate Resolution Imaging Spectroradiometer (MODIS) products
[i.e., Enhanced Vegetation Index (EVI) and nighttime land surface temperatures (LSTn)]
to create an empirical ET model calibrated using measured ET from three riparian-
influenced and two upland, water-limited flux tower sites. Results showed that
combining all sites introduced systematic bias, whereby upland sites tended to over-
predict ET while riparian sites tended to under-predict ET. In practice, error would be
introduced as a function of how much upland vegetation was present compared to
riparian vegetation. We found ET to be differentially affected by groundwater and soil
moisture at riparian-influenced sites compared to upland, water-limited sites so we
developed separate models to estimate riparian ET and upland ET separately. While EVI

29
and LSTn were the main drivers for ET in riparian sites, precipitation replaced LSTn as
the secondary driver of ET in upland sites. Riparian ET was improved with a
multiplicative approach (r2 = 0.92) while upland ET was adequately modeled using a
multiple linear regression approach (r2 = 0.77). These models can be used in combination
to estimate total annual ET at basin scales provided that each region is classified
appropriately and precipitation data is available.
Our approach was limited temporally by MODIS 16-day VI products of 250 m.
Finer spatial resolution such as 30-m Landsat products may improve estimates but may
not be offered at high enough temporal resolution to account for inter-seasonal
fluctuations of ET important for water budgeting. Our upland model also requires a
precipitation input, but some areas may not have sufficient precipitation data. Accuracy
may be further impacted by interpolating rain from the nearest rain gauges or relying on
precipitation models or forecasting to estimate upland ET. However, advances in satellite
sensors will soon produce near-surface soil moisture readings which will greatly improve
ET modeling in the future.

30
2.4 Future Research Opportunities
Here, I outline suggestions for future research opportunities that could follow research
developed for my dissertation.
2.4.1 Regional River Restoration
Most arid and semiarid regions with stressed and degraded river systems
encounter similar challenges for restoring rivers in the face of uncertainty. Some
unpredictability stems from climatic stressors such as rising temperatures and other
impacts related to climate change; others may stem from changes in social and political
values or needs. What we do know is that past river restoration efforts are not working as
well as they should, river restoration will remain a big industry in the future, and it is
essential to develop strategies to improve the efficacy of future efforts. Below are topics
that outline a few future research needs.
Gaps among science, management, and policy still hinder river restoration progress
and efficiency.
In the context of river restoration, scientists may stress the importance of
addressing the factors responsible for ecological decline and may advocate the return
of hydroecological processes while policy-makers may view practical options that
account for overall the investment and societal needs. Social impacts or broader
impacts often drive the types of river restoration employed. Social science may be a
useful avenue to evaluate and justify which types of policy reforms could effectively

31
change river restoration practices that are not currently working. Perhaps platforms
(e.g., conferences, seminars, blogs, interactive Internet) could be created to openly
communicate the needs of scientists, river practitioners, policy-makers, and society as
they relate to river restoration. New incentives and novel strategies should be
investigated to improve efficacy of future efforts.
Most river restoration projects are local in scale and are limited by funding and time.
Future efforts should explore methods to promote longer funding cycles and
longer time frames. Exploring or defining what an ideal river restoration framework
looks like in the context of each project would guide river practitioners and funding
agencies when designing restoration templates (e.g., a 5, 10, or 20-yr project
investment; a 25%:50%:25% template on planning & design, implementation, and
post-project monitoring, respectively; or a 25%:25%:50% template to accommodate
adaptive management during post-implementation). Designing river restoration with
funding to support all phases from planning to post-project monitoring is essential,
but realistic planning may have to consider that funding may not be evenly
appropriated over time.
Past restoration efforts are not well-documented, and as a result, are not valuable for
future efforts.
The lessons-learned conference convened in Tucson, AZ was invaluable to
participants because the first day was treated as a workshop, invoking open

32
discussions in smaller, eclectic groups. However, owing to the fact that river
restoration has increased exponentially, the experiences from 1000s of projects and
practitioners remain an untapped resource of information. With little accessible
documentation, strategies to mine these past efforts could rebuild the foundation of
river restoration. Perhaps interviews or additional conferences and/or seminars could
gather more information that could add to the current restoration knowledge base.
Currently, the majority of past projects are considered bad investments with lost
information, but finding a way to learn from these projects could still be valuable for
future efforts.
2.4.2 Local River Restoration
River restoration efforts have increased exponentially and the majority of efforts
are small-scale, or local, projects. Many regulated rivers, in particular, have greater
challenges for restoring rivers when dams cannot be regulated to produce or mimic
floods. Despite the fact that hydroecological processes will not be returned along these
rivers, many revegetation projects will continue to be implemented in the future. This
document shares a case study along the lower Colorado River located on Field 51 at
Cibola National Wildlife Refuge (CNWR) and exemplifies how longer-term monitoring
could be used to not only assess tree health over time, but give insights to the ecological
value of such projects. Because evaluation of the long-term sustainability of such efforts
is in its infancy, future research will be necessary to document overall effectiveness.

33
Below, potential future project ideas are given and a few opportunities are highlighted to
share how monitoring could continue into the future.
Local restoration sites require monitoring over longer time frames.
Revisiting the same field site (Field 51, CNWR, Unit #1) 10 years after initial
seeding (i.e., 2007) to re-assess impacts of high-density establishment on vegetation
dynamics (e.g., height, stem diameter, foliar volume, etc.) would add to the value of
the current study outlined in this document. Additional surveys and repeat sampling
will be valuable to managers interested in the long-term stability of seeding
techniques. Revegetation strategies are usually implemented to create habitat for
threatened or endangered avian species so long-term monitoring should also
incorporate surveys to determine bird presence, abundance, and diversity.
High densities negatively impact vegetation diversity and structure.
High-density sites, such as Field 51, could be strategically managed to
augment negative impacts on plant diversity and structure. Manually thinning woody
trees at the field site could result in larger trees with higher foliar volumes, which
may benefit avian communities that require specific structural attributes for nesting or
stop-over habitat. Management should also consider how herbaceous vegetation and
native shrubs could be seeded or planted in the open spaces to increase habitat value.
Perhaps thinning trees could coincide with other management objectives or
collaborate with other projects (e.g., cutting trees during dormancy could be

34
beneficial to other river restoration projects that need source trees for revegetation;
this site could be a nursery to assist other revegetation projects that require
genetically diverse native cottonwood trees). Managers should also consider
estimating the overall cost and effort associated with long-term maintenance and
management.
Re-establishing vegetation on disconnected floodplains requires long-term irrigation
and maintenance so concerns arise regarding long-term sustainability.
Ceasing irrigation when trees become phreatophytic may save water
resources, but may impact biotic and abiotic factors. I recommend a future
experiment ceasing irrigation at Field 51 with subsequent monitoring to evaluate
riparian tree health and give insights on the sustainability of such revegetation
practices. Abiotic factors should be monitored to assess changes in soil and
groundwater salinity. For instance, previous irrigation management may have
leached salts and replenished groundwater, but ceasing irrigation could increase
salinity levels. Assessing ecological value based on how hydrology and soils impact
vegetation is also important to evaluate the suitability of using reclaimed agricultural
fields for restoration practices.
2.4.3 Water Resources
Water is an important and valued commodity across arid and semiarid regions.
Because large amounts of water are returned to the atmosphere via evapotranspiration

35
(ET), large-scale estimates of ET are necessary to compute annual water budgets. The
research in this document outlines an empirical approach that uses remote sensing to
extrapolate ground measurements of ET to larger scales. These methods inherently have
challenges and error related to the spatial and temporal resolution of data collected for
modeling ET. Stemming from current research detailed in this document, a few future
research needs are summarized below.
Applying multiple ET models requires pixels to be classified into vegetation
associations.
Strategies to classify pixels representing ―riparian-influenced‖ vegetation and
―upland, water-limited‖ vegetation are required when applying our two empirical ET
models. Spatial analysis software (e.g., ArcGIS, ERDAS Imagine) could be used to
manually classify vegetation pixels before applying the appropriate model. Perhaps
riparian-influenced sites could be differentiated from water-limited sites by exploring
differences in remotely-sensed data (e.g., EVI or NDVI). For instance, pixel
characteristic of riparian vegetation may have higher maximum Vegetation Indices
(VIs) due to differences in water use and growth trends during the growing season.
Exploring contrasting patterns or changes in VIs within the growing season may help
isolate which pixels are influenced by groundwater versus those influenced by
precipitation.

36
Upland models are limited by the difficulty of acquiring precipitation data at high
spatial and temporal resolutions.
Data developed from models (e.g., Parameter-elevation Regressions on
Independent Slopes Model, PRISM) that provide precipitation at better spatial
resolution than point measurements (e.g., meteorological stations, rain gauges) should
be explored for their value in upland ET models. If modeled precipitation data cannot
be used to improve the upland ET estimates, then a sensitivity study could be
performed to explore the number of rain gauges required within a given area to obtain
precipitation data that produces valid upland ET estimates.
Upland models could be improved with a remotely sensed input related to moisture.
Current remote sensing products, such as water indices, should be explored as
an improvement over precipitation in the upland empirical model. Future remote
sensing efforts (e.g., SMAP) may offer improved soil moisture products that are more
representative of the moisture status of uplands, and these should also be explored as
an improvement to the upland empirical model.
37
REFERENCES
Aaron, P. 2001. The Suitability of reclaimed agricultural lands along the lower Colorado
River for native riparian habitat restoration. UNLV
Theses/Dissertations/Professional Papers/Capstones. Paper 289.
http://digitalcommons.library.unlv.edu/thesesdissertations/ 289.
Alcamo J., C. Vörösmarty, R.J. Naiman, D. Lettenmaier, and C. Pahl-Wostl. 2008. A
grand challenge for freshwater research: understanding the global water system.
Environmental Research Letters 3:1-6.
Arizona Riparian Council. 1995. Fact Sheet #1. Arizona State University. Center for
Environmental Studies. Tempe, AZ. pp 4.
Arthington, A H., R.J. Naiman, M.E. McClain, and C. Nilsson. 2010. Preserving the
biodiversity and ecological services of river: new challenges and research
opportunities. Freshwater Biology 55:1-16.
Bernhardt, E.S., M.A. Palmer, J.D. Allan, G. Alexander, K. Barnas, S. Brooks, J. Carr, C.
Dahm, J. Follstad-Shah, D.Galat, S. Gloss, P. Goodwin, D. Hart, B. Hassett, R.
Jenkinson, S. Katz, G. M. Kondolf, P. S. Lake, R. Lave, J.L. Meyer, T.K.
O'Donnell, L. Pagano, B. Powell, and E. Sudduth. 2005. Synthesizing U.S. river
restoration efforts. Science 205:636-637.
Bernhardt, E.S., and M.A. Palmer. 2011. Evaluating River Restoration. Ecological
Applications, 21:1925-1925.
Briggs, M.K. 2011. Restoring rivers in southwestern United States and northern Mexico:
lessons learned from the past to benefit the future. Final Report Summarizing
Results of Conference. Chihuahuan Desert Program, World Wildlife Fund,
Tucson, AZ.
Brinson, M. M., A. E. Lugo, and S. Brown. 1981. Primary productivity, decomposition,
and consumer activity in freshwater wetlands. Annual Review of Ecological
Systems 12:123-161.
Busch, D.E. 1995. Effects of fire on southwestern riparian plant community structure.
Southwestern Naturalist 40:259-267.
Busch, D.E. and S.D. Smith. 1995. Mechanisms associated with the decline of woody
species in riparian ecosystems of the southwestern U. S. Ecological Monographs
65:347-370.

38
Commission for Environmental Cooperation. 1999. Ribbon of life: an agenda for
preserving transboundary migratory bird habitat on the Upper San Pedro River.
Montreal, Canada: Commission for Environmental Cooperation.
Congalton, R., M. Balogh, C. Bell, K. Green, J. Milliken, and R. Ottman. 1998. Mapping
and monitoring agricultural crops and other land cover in the Lower Colorado
River Basin. Photogrammetric Engineering and Remote Sensing 64:1107-1113.
Fenner, P., W.W. Brady, and D.R. Patton. 1985. Effects of regulated water flows on
regeneration of Fremont cottonwood. Journal of Range Management 38:135-138.
Glenn, E., R. Tanner, S. Mendez, T. Kehret, D. Moore, J. Garcia, and C. Valdes. 1998.
Growth rates, salt tolerance and water use characteristics of native and invasive
riparian plants from the delta of the Colorado River, Mexico. Journal of Arid
Environments 40:281-294.
Glenn, E.P., P.L. Nagler, and A.R. Huete. 2010. Vegetation index methods for estimating
evapotranspiration by remote sensing. Surveys in Geophysics DOI
10.1007/s10712-010-9102-2.
Gollehon, N. and W. Quinby. 2006. Chapter 2.1: irrigation resources and water costs.
Agricultural Resources and Environmental Indicators, 2006. EIB-16. Economic
Research Service, USDA.
Hall, N.D., B.B. Stuntz, and R.H. Abrams. 2008. Climate change and freshwater
resources. Natural Resources & Environment 22:30-35.
Hansen, S. and C. Gorbach. 1997. Middle Rio Grande water assessment: final report.
Albuquerque Area Office, Albuquerque, NM: U. S. Bureau of Reclamation.
Hartwell, S., K. Morino, P.L. Nagler, E.P. Glenn. 2010. On the irrigation requirements of
cottonwood (Populus fremontii and Populus deltoides var. wislizenii) and willow
(Salix gooddingii) grown in a desert environment. Journal of Arid Environments
74:667-674.
Herrick, J.E., G.E. Schuman, A. Rango. 2006. Monitoring ecological processes for
restoration projects. Journal for Nature Conservation 14:161-171.
Howe, W.H. and F.L. Knopf. 1991. On the imminent decline of Rio Grande cottonwoods
in central New Mexico. Southwestern Naturalist 36:218-224.
Hultine, K.R., S.E. Bush, and J.R. Ehleringer. 2010. Ecophysiology of riparian
cottonwood and willow before, during, and after two years of soil water removal.
Ecological Applications 20:347-361.

39
IPCC. 2007. Summary for policymakers. In: Parry, M.L., Canziani, O.F., Palutikof, J.P.,
Van Der Linden, P.J., Hanson, C.E. (Eds.), Climate Change 2007: Impacts,
Adaptation and Vulnerability. Contribution of Working Group II to the Fourth
Assessment Report of the Intergovernmental Panel on Climate Change.
Cambridge University Press, Cambridge, UK.
Johnson, W.C. 1992. Dams and riparian forests: case study from the Upper Missouri
River. Rivers 3:229-242.
Knopf, F.L., R.R. Johnson, T. Rich, F.B. Samson, R.C. Szaro. 1988. Conservation of
riparian ecosystems in the United States. Wilson Bulletin 100:272-284.
Leenhouts, J.M., J.C. Stromberg, and R.L. Scott. 2006. Hydrologic requirements of and
evapotranspiration by riparian vegetation along the San Pedro River, Arizona.
Fact Sheet 2006-3027 U.S. Geological Survey.
Lite, S.J., and J.C. Stromberg. 2005. Surface water and ground-water thresholds for
maintaining Populus-Salix forests, San Pedro River, Arizona. Biological
Conservation 125:153-167.
Malanson, G.P. 1995. Riparian Landscapes. Cambridge University Press: Cambridge.
Merrit, D.M. and N.L. Poff. 2010. Shifting dominance of riparian Populus and Tamarix
along gradients of flow alteration in western North American rivers. Ecological
Applications 20:135-152.
Milly P.C.D., J. Betancourt, M. Falkenmark, R.M. Hirsch, Z.W. Kundzewicz, D.P.
Lettenmaier, and R.J. Stouffer. 2008. Stationarity is dead: whither water
management? Science 319:573-574.
Mortenson, S.G. and P.J. Weisberg. 2010. Does river regulation increase the dominance
of invasive woody species in riparian landscapes? Global Ecology and
Biogeography 19:562-574.
Murray, R.S., P.L. Nagler, K. Morino, and E.P. Glenn. 2009. An empirical algorithm for
estimating agricultural and riparian evapotranspiration using MODIS Enhanced
Vegetation Index and ground measurements of ET. II. Application to the Lower
Colorado River, US. Remote Sensing 1:1125-1138.
Nagler, P., J. Cleverly, D. Lampkin, E. Glenn, A. Huete, and Z. Wan. 2005a. Predicting
riparian evapotranspiration from MODIS vegetation indices and meteorological
data. Remote Sensing and the Environment 94:17-30.

40
Nagler, P., R. Scott, C. Westenberg, J, Cleverly, E. Glenn, A. Huete. 2005b.
Evapotranspiration on western U.S. rivers estimated using the Enhanced
Vegetation Index from MODIS and data from eddy covariance and Bowen ratio
flux towers. Remote Sensing and the Environment 97:337-351.
Nagler, P.L., K. Morino, K. Didan, J. Erker, J. Osterberg, K.R. Hultine, and E. P. Glenn.
2008. Removal of saltcedar (Tamarix spp.) will not facilitate return of native trees
nor save water on the lower Colorado River. Ecohydrology doi:10.1002/eco.35.
Naiman, R.J., H. Decamps, M. Pollock. 1993. The role of riparian corridors in
maintaining regional biodiversity. Ecological Society of America 209-212.
Naiman R.J., S.E. Bunn, C. Nilsson, G.E. Petts, G. Pinay, and L.C. Thompson. 2002.
Legitimizing fluvial ecosystems as users of water: an overview. Environmental
Management 30:455-467.
Naiman, R. J., H. Decamps, and M. E. McClain. 2005. Riparia: ecology, conservation,
and management of streamside communities. Elsevier Academic Press, San
Diego, California.
Nelson, S.M. and D.C. Anderson. 1999. Butterfly (Papilionoidea and Hesperioidea)
assemblages associated with natural, exotic, and restored riparian habitats along
the lower Colorado River, USA. Regulated Rivers: Research and Management
15:485-504.
Nilsson, C. and M. Svedmark. 2002. Basic principles and ecological consequences of
changing water regimes: riparian plant communities. Environmental Management
30:468-480.
Palmer, M.A. and J.D. Allan. 2006. Restoring rivers. Issues in Science & Technology,
National Academy of Sciences, Winter, pp 40-48.
Palmer, M., J.D. Allan, J. Meyer, and E.S. Bernhardt. 2007. River restoration in the
twenty-first century: data and experiential knowledge to inform future efforts.
Restoration Ecology 15:472-481.
Palmer M.A., C.A. Reidy Liermann, C. Nilsson, M. Flörke, J. Alcamo, P.S. Lake, and N.
Bond. 2008. Climate change and the world‘s river basins: anticipating
management options. Frontiers in Ecology and the Environment 6:81-89.
Patten, D.T. 1998. Riparian ecosystems of semi-arid North America: diversity and human
impacts. Wetlands 18:498-512.

41
Pearce, F. 2007. When the rivers run dry: what happens when our water runs out?
Transworld Publishers, London.
Pederson, G.T., S.T. Gray, C.A. Woodhouse, J.L. Betancourt, D.B. Fagre, J.S. Littell, E.
Watson, B.H. Luckman, L.J. Graumlich. 2011. The unusual nature of recent
snowpack declines in the North American Cordillera. Science 333:332-335.
Poff, N.L., J.D. Allan, M.B. Bain, J.R. Karr, K.L. Prestegaard, B.D. Richter, R.E. Sparks,
and J.C. Stromberg. 1997. The natural flow regime. A paradigm for river
conservation and restoration. BioScience 47:769-784.
Poff, N. L. J. D. Allan, M. A. Palmer, D. D. Hart, B. D. Richter, A. H. Arthington, J. L.
Meyer, K. H. Rogers, and J. A. Stanford. 2003. River flows and water wars:
emerging science for environmental decision making. Fontiers in Ecology and
the Environment 1:298-306.
Postel S., and B. Richter. 2003. Rivers for life: managing water for people and nature.
Island Press, Washington, DC.
Revenga C., I. Campbell, R. Abell, P. De Villiers, and M. Bryer. 2005. Prospects for
monitoring freshwater ecosystems towards the 2010 targets. Philosophical
transactions of the Royal Society of London, Series B, Biological sciences
360:397-413.
Rood, S.B., and J.M. Mahoney. 1990. The collapse of riparian poplar forests downstream
from dams on western prairies: Probable causes and prospects for mitigation.
Environmental Management 14:451-464.
Rood, S.B., and J.M. Mahoney. 1991. The importance and extent of cottonwood forest
decline downstream from dams. P. 1-9. In S. B. Rood and J. M. Mahoney (eds.)
The Biology and Management of Southern Alberta‘s Cottonwoods. University of
Lethbridge Press, Alberta Canada.
Sala, A. and S. Smith. 1996. Water use by Tamarix ramosissma and associated
phreatophytes in a Mohave Desert floodplain. Ecological Applications 6:888-898.
Shafroth, P.B., J.C. Stromberg and D.T. Patten. 2002. Riparian vegetation response to
altered disturbance and stress regimes. Ecological Applications 12:107-123.
Shafroth, P.B., J.R. Cleverly, T.L. Dudley, J.P. Taylor, C. van Riper III, E.P. Weeks, and
J.N. Stuart. 2005. Control of Tamarix in the western United States: Implications
for Water Salvage, Wildlife Use, and Riparian Restoration. Environmental
Management 35:231-246.
42
Scott, R.L., W.L. Cable, T.E. Huxman, P.L. Nagler, M. Hernandez, D.C. Goodrich. 2008.
Multiyear riparian evapotranspiration and groundwater use for a semiarid
watershed. Journal of Arid Environments 72:1232-1246.
Stromberg, J.C. 1993. Fremont cottonwood-Gooding willow riparian forests: a review of
their ecology, threats, and recovery potential. Journal of the Arizona-Nevada
Academy of Science 26:97-111.
Stromberg, J.C., Beauchamp, V.B., Dixon, M.D., Lite, S.J., Paradzick, C. 2007.
Importance of low-flow and high-flow characteristics to restoration of riparian
vegetation along rivers in arid southwestern United States. Freshwater Biology
52:651-679.
Swift, B.L. 1984. Status of riparian ecosystems in the United States. Water Resources
Bulletin 20:223-228.
Szaro, R. 1989. Riparian forests and shrubland community types of Arizona and New
Mexico. Desert Plants 9:1-138.
Taylor, J.P., Wester, D.B., Smith, L.M. 1999. Soil disturbance, flood management, and
woody riparian plant establishment in the Rio Grande floodplain. Wetlands
19:372-382.
U.S. Bureau of Reclamation. 2011. Lower Colorado River Multi-Species Conservation
Program – [http://www.lcrmscp.gov/index.html] – Lower Colorado River Multi-
Species Conservation Program: Balancing resource use and conservation, USA.
U.S. Department of Interior. 2002. Lower Colorado River accounting system
demonstration of technology calendar year 2001. Boulder City, NV: U. S.
Department of Interior, Bureau of Reclamation.
Vörösmarty, C., D. Lettenmaier, C. Lévêque, M. Meybeck, C. Pahl-Wostl, J. Alcamo, W.
Cosgrove, H. Grassl, H. Hoff, P. Kabat, F. Lansigan, R. Lawford, and R. Naiman.
2004. Humans transforming the global water system. EOS, American
Geophysical Union Transactions 85:509-514.
Ward, J.V. and J.A. Stanford. 1995. The serial discontinuity concept: extending the
model to floodplain rivers. Regulated Rivers: Research and Management 10:159-
168.
43
APPENDIX A: RESTORING RIVERS IN ARID AND SEMIARID SOUTHWESTERN
UNITED STATES AND NORTHERN MEXICO: LESSONS LEARNED FROM THE
PAST TO BENEFIT FUTURE RIPARIAN RESTORATION
Daniel P. Bunting1 and Mark K. Briggs
2
Submitted to the Journal of Restoration Ecology
1School of Natural Resources and the Environment, University of Arizona, Tucson, AZ
2Chihuahuan Desert Program, World Wildlife Fund, Tucson, AZ
Daniel P. Bunting, School of Natural Resources and the Environment, 1311 E. 4th
St.
304A BioSciences East, University of Arizona, Tucson, AZ 85721
Mark Briggs, Chihuahuan Desert Program, World Wildlife Fund, 4969 N. Camino
Antonio, Tucson, AZ 85718

44
Abstract
A conference convened in Tucson, Arizona, in December 2010 brought together
river practitioners, scientists, private citizens, and conservationists from federal and state
agencies, academic institutions, and non-governmental organizations to discuss
challenges and lessons learned from past river restoration experiences for the benefit of
future river restoration efforts. Discussions focused on a variety of river restoration topics
including planning, community involvement, data sharing, monitoring, biophysical
evaluation strategies, and adaptive management. Developing realistic restoration
objectives is a key component of all river restoration efforts and should be based on both
a biophysical evaluation of river conditions and a sound understanding of the
sociopolitical environment. Discussions also focused on the importance of having an
interdisciplinary team, addressing broad-scale objectives, developing a realistic timeline,
and—from the outset—planning all phases of the project: design, implementation,
monitoring, and evaluation. Small-scale projects typically produce limited biophysical
benefit but can provide useful lessons and garner stakeholder and public support for
subsequent larger-scale efforts. However, only by identifying and addressing the main
drivers of ecological deterioration can significant progress be made toward true
restoration. In addition to these topics, the conference also focused on the emerging river
restoration themes of climate change, environmental flow, native fish conservation, and
restoration of trans-boundary rivers.

45
Key words: climate change, community involvement, environmental flows, ecosystem
services, hydroecology, monitoring, native fish, trans-boundary rivers

46
1.0 Introduction
Riparian ecosystems provide a variety of ecosystem services (e.g., cycling soil
and nutrients, treating pollutants, replenishing aquifers, supplying water, etc.) that benefit
humans and the environment. Ecosystem services support human water demands for
agriculture, industry, and municipal use and provide an array of recreational and
experiential opportunities (Malanson, 1995). They are also extremely important in arid
and semiarid regions, in particular, where the majority of the region‘s wildlife species
depend on them for survival (e.g., via refuge, habitat, migratory corridors; Arizona
Riparian Council 1995). Riparian ecosystems in arid and semiarid regions are
characteristic of cottonwood (Populus spp.) and willow (Salix spp.) communities, that
maintain high productivity and biodiversity, support wildlife, protect watersheds, and
provide recreation in an otherwise unproductive region (Fenner et al. 1985, Knopf et al.
1988, Szaro 1989, Malanson, 1995, Patten 1998).
A variety of human-related perturbations in the southwestern United States (US),
northern Mexico, and southeastern Australia have resulted in over-allocated river water
and hydroecologically deteriorated rivers. These anthropogenic disturbances have
impacted ecosystem functions and services and have compromised the integrity of
dryland rivers (Poff et al. 1997; Ward & Stanford 1995). Southwestern riparian
ecosystems in the US, for example, have undergone significant changes in the past
century to prevent flooding, supply energy, satisfy agricultural demands, and supply
water to growing desert metropolitan areas (Rood and Mahoney 1990, 1991, Nilsson and
Svedmark, 2002). River impoundment, land-use change, surface and groundwater

47
extraction, and artificial inter- and intra-basin transfers have profoundly altered natural
flow regimes (Poff et al. 1997, Naiman et al. 2002, Postel and Richter 2003, Revenga et
al. 2005, Pearce 2007). Altered riparian ecosystem hydrology is responsible for severely
degrading many of these dryland rivers (Rood and Mahoney 1990, 1991, Stromberg
1993, Lite and Stromberg 2005, Hultine et al. 2010). Water diversions following the
construction of dams, channels, and levees have often resulted in decreased soil moisture
and increased soil salinization (Busch and Smith 1995, Sala and Smith 1996, Glenn et al.
1998, Nagler et al. 2008), channel narrowing and incision (Shafroth et al. 2002),
floodplain disconnection, and non-native species invasions that facilitate higher fire
frequency (Busch 1995). Regulated flows also often impede the fluvial processes (e.g.,
vegetation scouring, sediment deposition, and soil/nutrient cycling) necessary for native
riparian vegetation recruitment and survival (Howe and Knopf 1991, Ward & Stanford
1995, Poff et al. 1997, Taylor et al. 1999, Stromberg 2007). As a result, riparian forests
are now considered among the most threatened forest types in the US (Swift 1984, Busch
and Smith 1995, Shafroth et al. 2005).
In recent years, considerable efforts are being invested to recover deteriorated
rivers. In fact, a representation of river restoration projects implemented across the US
has shown an increase from 10s of river restoration projects in the 1980s, to 100s in the
1990s, to 1000s since the turn of the 21st century (NRRSS 2007). Unfortunately, most
projects have lacked any form of assessment, monitoring, or evaluation to quantify
effectiveness so, given the proliferation of restoration activities, concerns are rising
regarding their overall efficacy, foci, and cost (Follstad Shah et al. 2007). River

48
restoration efforts implemented in the southwestern US follow the national trends
elucidated by Bernhardt et al. (2005) and Follstad Shah et al. (2007), including increased
project numbers and high costs with little investment toward post-project monitoring.
While the Southwest generally has a higher percentage of projects with monitoring
components compared to nation-wide statistics, Bernhardt et al. (2005) also found that
most projects with monitoring protocols do not have appropriate information for
quantifying success nor do they disseminate results. Smaller projects, specifically, make
up the majority of all river restoration activities, yet monitoring is often left out of the
planning and design phase (Bernhardt et al. 2005, Palmer et al. 2007), thus valuable
information regarding success and failures is not shared with the broader restoration
community. Given myriad restoration activities across the southwestern US and northern
Mexico with little documentation; the knowledge, experiences, and lessons learned by
restoration practitioners remains an untapped resource of valuable information.
The southwestern US and northern Mexico, like many parts of the world, have a
diverse population of river practitioners who have been involved in river restoration
efforts for years. Together, these practitioners have learned from an array of projects that
focused on a variety of different river systems. Tapping into this resource to discuss and
document lessons learned could be extremely valuable for future river restoration efforts.
Protecting and restoring dryland rivers will face greater challenges with fewer resources
for restoration activities, making it increasingly critical to implement efforts that will be
successful. Combined, the southwestern US and northern Mexico form a region where
concerns over water resources are anomalous to most regions of the world. Water

49
supplies in these regions are pressured by urban population growth as well as agricultural,
commercial, and industrial demands (Gollehon and Quinby 2006). With water resources
already over-allocated along most dryland rivers, it is also inevitable that impacts of
climate change will likely exacerbate pressures on water availability in the future.
Considering that rivers are dynamic and unpredictable ecosystems, the lack of
documentation of many river restoration projects has reduced the ability to implement
efficient and robust restoration strategies. Therefore, it is essential to directly
communicate with river practitioners (the scientists, river managers, conservationists, etc.
who have worked directly in river restoration projects) to synthesize what has been
learned from past river restoration experiences. Adding to the current restoration
knowledge base will provide a stronger foundation for moving forward in the 21st
century. One feasible way to gather information that addresses regional concerns is to
present a platform to allow river practitioners to share their experiences. Compiling
lessons learned from past restoration efforts is not new. Warner and Hendrix (1984)
headed a restoration conference which resulted in 128 technical papers which outlined the
ecology of California river systems and highlighted key factors that influenced their
decline, what lessons had been learned, and what future management plans should be
considered.
Despite the important information that these types of synthesis efforts provide,
considerable and important questions remain regarding how the restoration and
conservation world can most effectively address the challenges of rivers in arid and
semiarid climates. Questions of particular importance include: What restoration

50
strategies have been effective? What approaches were not successful? How does this
body of lessons learned inform future restoration? What are the main steps that
practitioners need to contemplate in developing a sound and viable river restoration plan?
Can communication between practitioners and funders be improved to meet broad-scale
objectives? What gaps are present among science, management, and policy that may
hinder future river restoration efforts? Can climate change adaptation be incorporated
into the restoration equation to give greater confidence for meeting long-term goals in the
context of a changing climate? Taking into account what new and continued challenges
river practitioners will face in the 21st century, these questions aim to promote positive
feedback and advance our understanding of our current river systems and restoration
practices in effort to improve future river conditions with sustainable outcomes.
In December 2010, we designed and convened a conference in Tucson, Arizona
entitled ―Restoring Rivers in the Southwestern US and Northern Mexico: A Bi-national
Conference on Learning from the Past for the Benefit of the Future.‖ We brought
together river practitioners, scientists, private citizens, and conservationists from federal
and state agencies, academic institutions, and non-governmental organizations from
southwestern US, northern Mexico, and southeastern Australia to discuss lessons learned
from their river restoration experiences. The necessity for such a lessons learned
conference stemmed from the convergence of several factors, including the continuing
and dramatic ecological deterioration of many of our rivers, increased understanding of
climate change and its impacts on river systems, and growing appreciation of the need to
come together as group, share information, collaborate, and document what we have

51
learned for the benefit of future natural resource practitioners. Discussions of particular
importance at the conference centered on restoration planning and design as well as the
emerging themes of climate change, environmental flow, trans-boundary rivers, and
native fish conservation. In this article, we briefly discuss the design and intent of the
conference and summarize lessons learned and key findings relayed during the five main
conference sessions: development of restoration objectives, project design, and
implementation; post-implementation considerations (e.g., monitoring, evaluation, site
maintenance); quantifying and securing environmental flows; river restoration in the
context of a changing climate; and restoration along trans-boundary rivers.
2.0 Conference Organization
The conference was attended by natural resource practitioners, scientists, and
conservationists representing 13 federal agencies; 3 state agencies; 15 universities; 10
private organizations; 15 NGOs; 2 US tribal nations; and 3 county and city agencies from
the US, Mexico, and Australia. Conference sessions mirrored the typical sequence of
restoration project steps, progressing through goals, objectives, planning,
implementation, and post-implementation. Four breakout groups of 40-50 participants
each undertook discussions of these topics. Attention then turned to the emerging themes
of river restoration in the context of climate change, environmental flows, native fish
conservation, and trans-boundary rivers. Facilitators and note-takers documented
discussion points, and English/Spanish translators provided information to all

52
participants. The end products were extensive session notes summarizing key
information from the assembled practitioners, organized according to key steps in the
restoration process (Figure 1).
3.0 Conference Results
3.1 Lessons Learned from the Planning and Design Phase
3.1.1 Determining the Overarching Restoration Goal. A project goal is a broad
statement that brings the intention of the project into focus. The importance of
developing a realistic restoration goal was a strong conference theme. Participants noted
the value of asking ‗why‘ a river should be restored, and even ‗if‘ it could or should be
restored. Having available restoration funds does not necessarily mean restoration should
be initiated if other key ingredients are not in place. Participants felt that if practitioners
and stakeholders could not agree about restoration along a particular river reach or
system, or if restoration proved too daunting, funding mechanisms should be flexible
enough to provide support in more feasible areas. For this reason, the importance of site
prioritization was stressed given inherent political, legal, social, economic, and
environmental challenges.
River restoration potential is strongly linked to a river‘s hydroecology—the way
hydrology impacts the ecosystem (Kundzewicz 2002, Zalewski 2002). Along these lines,
participants agreed that successful restoration requires understanding current
hydroecological conditions, how conditions have changed, the main stressors driving

53
change, and the possibilities of addressing stressors given current trends and the socio-
economic environment of the river. A project‘s ability to effectively address stressors
determines feasible restoration endpoints. If stressors cannot be eliminated, or their
impacts at least reduced, it may be impossible to return a river to its natural or wild state.
In such a situation, river practitioners will be greatly limited as to what can be
accomplished and should apply a cost/benefit analysis that provides the basis for
identifying sites where restoration resources will produce the most benefit (Figure 2).
True river restoration (e.g., complete structural and functional return to a pre-
disturbance state; Cairns, 1991) aims to restore both hydrological and ecological
processes, which seldom may be possible at regulated rivers (Wohl, 2007). Conference
participants agreed that true restoration is impossible in most situations in the Southwest
given the degree of biophysical deterioration. A roadmap for developing realistic river
restoration goals emerged, understanding that a practical approach would likely aim to
improve current river conditions through rehabilitation strategies that have a sustainable
outcome. Preliminary steps to eliminate or reduce stressors include evaluating current
hydroecological conditions and understanding what can be accomplished given socio-
political will. Gathering such information allows the formation of a realistic vision—
articulated in a goal statement—that depicts the end product after objectives are met.
Goals should be at the watershed scale and have a long-term outlook. Strengthening
information gathering, team building, and planning at the outset of a project can provide a
strong foundation for developing goals that are spatially, temporally, and fiscally
realistic.

54
3.1.2 Developing Realistic Restoration Objectives. Restoration project objectives are
descriptions of specific steps that contribute to achieving the project goal. Measuring the
extent to which project objectives are achieved indicates progress toward meeting the
goal. Participants observed that developing realistic restoration objectives requires
preparing preliminary objectives, evaluating site-specific river conditions, and using the
improved knowledge base to refine objectives. The initial objective might grow out of a
question, such as whether it is possible to restore native fish populations. If subsequent
baseline evaluations appear promising, the question might evolve to a stated objective:
We intend to restore native fish by improving habitat conditions necessary to support
them with subsequent reintroduction of native fish stock. The statement needs to be
further refined to be quantifiable, providing the basis for a monitoring program that is
capable of quantifying progress toward achieving objectives.
Evaluating baseline river conditions prior to planning contributes to formulating
realistic restoration objectives (Kondolf and Downs 1996); provides information for
project design (Jungwirth et al. 2002, Hopfensperger et al. 2007); provides initial
monitoring data for comparison to future conditions (Kondolf and Downs 1996); and is
essential in planning, gauging restoration progress, evaluating effectiveness of restoration
tactics (NRC 1992, Henry and Amoros 1995), and formulating adaptive management
responses (Downs and Kondolf 2002). Despite the importance of this step, it is often
minimized or overlooked due to time and funding constraints (Stromberg 2007).
The parameters included in a baseline evaluation vary with project focus, scale,
funding, and data availability, among other considerations. Conference participants

55
stressed the importance of documenting physical processes, especially water and
sediment movement. Assessment of channel morphology, seasonal depths to
groundwater, groundwater salinity, and average and variable streamflow statistics are
important in this context. To reestablish native hydroriparian trees, site abiotic
parameters such as soil texture, salinity, and seasonal soil moisture availability must be
evaluated. Based on evaluation results, preliminary restoration objectives can be refined
and finalized to describe specific measurable actions that contribute to achieving a
realistic goal.
3.1.3 Developing the Restoration Plan. Participants noted that many projects have
failed due to lack of planning or the lack of effective planning. Failures to reach
restoration goals have been attributed to inadequate understanding of the ecologic system
being restored (Westman 1991, Wohl 2005), poor definition of the initial problem
(Hopfensperger et al. 2007), and unpredicted natural or anthropogenic disturbances
(National Research Council [NRC] 1992). One of the first steps to remedy this is to
develop a diverse interdisciplinary team, which might include engineers, scientists,
biologists, ecologists, as well as politicians, community leaders, and other caring
visionaries, who can help develop realistic restoration objectives and tactics based on the
river system of interest. Multiple expertise within a restoration team can provide a
holistic approach for understanding the science while accounting for social and political
values when implementing river restoration tactics. Routine meetings, checkpoints, and

56
progress reports strengthen team coordination, foster flexibility in planning, and maintain
project momentum.
River restoration takes time. Many river restoration projects run out of funds
before completion due to unrealistic planning. Thoughtful fiscal planning at the onset is
key to developing a realistic project timeline and a budget that supports all project
activities, including baseline assessments at target sites as well as monitoring and
evaluation activities after project implementation. Fiscal planning should also be
sufficiently flexible to accommodate unforeseen obstacles. Working with government
agencies early in the planning process helps participants gain a common understanding of
required permits, objectives, personnel and material needs, and other important factors.
Pressure to complete work within fiscal rather than ecological timeframes is
common. The challenge sometimes lies in meeting time and budget constraints imposed
by grant obligations or project bidding. Conference participants were concerned that
projects are sometimes awarded to applicants who knowingly underbid competitors,
submitting unrealistic proposals that receive support rather than more thoughtful
proposals that address overarching river restoration objectives. Successful river
restoration in the future will require funders who embrace the bigger picture and who can
build diverse partnerships among agencies, institutes, organizations, and citizens over
longer time frames and funding cycles.
3.2 Lessons Learned from the Implementation Phase

57
3.2.1 Planting. Successful revegetation is fostered by knowledge of historical
hydrologic and vegetative conditions and by designing restoration tactics that mimic
natural site conditions (Wohl 2005). Conference participants noted that using locally
collected and grown plant materials and collecting seed stock from multiple native plants
near the restoration site ensures genetic diversity and increases establishment rates, which
is consistent with the literature (e.g., Landis et al. 2003, Withrow-Robinson and Johnson
2006). Possibly the most important consideration is understanding and making certain
that site soil texture, soil salinity, and above- and below-ground water availability will
support the species being planted in the long-term (e.g., Anderson 1995, Aaron 2001,
Dreesen 2002).
Many methods (e.g., seed distribution, pole-plantings, out-planting containerized
nursery stock) with variable investments have been successful at re-establishing
cottonwood-willow communities (e.g., Raulston 2003, USBR 2011a). Success has often
been measured by the ability to simply establish trees or to establish trees at certain
densities (Taylor et al. 2006); however, success should be measured by a project‘s
sustainability and ecological value (Palmer et al. 2005, Stromberg 2007), especially if
strategies did not aim to restore historical hydroecological processes (e.g., flooding,
scouring, cycling nutrients). Although revegetation is often an important element of
restoration work, it alone cannot counteract causes of degradation and should be
accompanied by strategies that directly address the main drivers of ecological
deterioration, promote natural river dynamics, and enhance resilience.

58
3.2.2 Unanticipated Obstacles. Conference attendees shared stories of logistical
challenges that impeded the ability to achieve restoration objectives. Progress can be
improved by considering potential obstacles and anticipating speed bumps along the way.
Conference attendees noted the importance of reviewing legislation and policy-related
issues and securing necessary permits in advance of restoration work. Project planners
need to identify and work within physical, legal and/or ecological constraints. Questions
to ask include: Are any threatened or endangered species present at the restoration site?
Are permits required to access chosen sites? Should bird migration windows be addressed
in project design? Is coordination needed with other research groups or outside parties?
3.2.3 Project Management and Timing. Practitioners emphasized that thoughtful
planning increases project efficiency and progress. Explaining goals and objectives;
providing guidance and support; building relationships; and ensuring cooperation with
staff, team members, and contractors helps all parties contribute fully. Fiscal and
management timelines should coincide with natural processes and/or biological time
windows. In some cases, pole-plantings of hydroriparian species have failed because
poles were not collected during dormancy (USBR 2011a), or were not planted at
appropriate times or in appropriate locations to accommodate groundwater fluctuations
(Dreesen 2002). Efforts to establish vegetation from seed have failed because seeding
did not coincide with natural seed dispersal windows or did not account for short-lived
viability.

59
3.2.4 Importance of Small-scale and Pilot Projects. Tackling river issues at the
watershed scale is key to addressing stressors and achieving long-lasting results but can
be challenging, costly, and time consuming. As compared to restoration at the watershed
scale, small-scale projects (e.g., pilot, site-based projects) will not produce dramatic
biophysical and social benefits. Yet, such limited efforts can provide numerous short-
term benefits and, when planned appropriately, can be part of long-term watershed-scale
programs. In this vein, conference participants observed that small-scale projects provide
opportunities to organize project teams, better understand current biophysical conditions
and trends, and identify main drivers of decline. They also provide demonstrable,
tangible results in the near-term, which are often critical for learning lessons and
fostering support from community leaders and funders while garnering public support
and stakeholder buy-in that pave the way for future collaborative efforts.
3.2.5 Community Involvement. Restoration programs need to benefit society as well
as aquatic and riparian biota (Naiman et al. 2002; Richter et al. 2003). Public perception
of a river‘s condition often drives the decision to undertake the restoration as well as
the decision about what type of restoration is needed (Wohl 2005). Highlighting the
social benefits of restoration can enhance community support and appreciation, which is
key to long-term viability. Obtaining public input can help shape restoration plans to
better address such public needs as flood control, water supply, water quality, recreation,
and aesthetics that can go hand-in-hand with environmental restoration goals.
Community involvement can be promoted by emphasizing the ecosystem services that

60
rivers provide and how alterations such as damming and diversions pressure water quality
and supply. An engaged community can assist in restoring, monitoring, and maintaining
sites. Conference participants from several trans-border rivers gave examples of how
riverside citizens have directly participated in constructing gabions, eradicating invasive
species, planting native vegetation, and monitoring. With such collaboration, the project
truly becomes a community experience, providing the foundation for the project‘s long-
term viability as well as garnering support for future restoration opportunities.
3.3 Lessons Learned from the Post-implementation Phase
3.3.1 Monitoring. The principal aim of monitoring is to measure progress toward
meeting project objectives, underscoring the importance of developing quantifiable
objectives and success criteria from the outset (England et al. 2008, Buchanan et al.
2012). The cost of monitoring must be built into the restoration budget, a practice not
applied frequently enough. Conference participants noted that monitoring methods
should be peer-reviewed, useful to scientists, meaningful to managers, and easily
understandable to the community. Project team members should stay involved during the
monitoring process to ensure effectiveness.
Ideally, monitoring should connect physical, chemical, biological, and even social
parameters (Skinner et al. 2007, England et al. 2008). If restoration objectives aim to
establish vegetation as habitat for native bird species, the monitoring program should aim
to measure the vegetation characteristics (e.g., density, percent cover), key physical-

61
chemical parameters (e.g., soil salinity, depth to saturated soils), bird presence (e.g.,
if/when/how birds use the habitat), and even such parameters as human visitation to
quantify socioeconomic impacts of restoration.
Monitoring approaches need to be repeatable, rely on quantification, and provide
data that measures progress toward meeting restoration objectives relative to baseline or
control conditions (England et al. 2008; e.g., Underwood 1994). Participants reiterated
the importance of selecting appropriate indicators that can reliably depict stream health,
and cautioned that false indicators can lead to misinterpreting restoration outcomes.
Approaches that rely too heavily on indirect measurements of stream health or subjective
assessment without sufficient data collection should be avoided.
Participants also noted the importance of standardizing and documenting
monitoring protocols to reduce impacts of spatial and temporal variability. The same
methods should be employed year-to-year and be conducted at the same time each year.
Ideally, monitoring should also include establishing control or reference sites that have
similar climatological and pre-project biophysical conditions, to allow comparisons
between treated and untreated sites (Jungwirth et al. 2002; e.g., Before-After-Control-
Impact designs, reviewed in Underwood 1994). Standardizing monitoring so that local-
scale programs can be linked to large-scale programs helps document progress toward
meeting broad-scale objectives.
Given the potential diversity of scientists, managers, and policy-makers involved
in river restoration, conference participants noted that defining whether objectives are
successful may vary depending on the orientations and backgrounds of the restoration

62
team. For this reason, different monitoring approaches, such as compliance-based
evaluations (e.g., verification of task completion or meeting quality standards; e.g.,
Mirauda, and Ostoich 2011) or functional monitoring (e.g., quantification of whether
hydroecological processes have been restored and/or whether target species use the
restoration site; e.g., Gonzalez and Garcia 2001) are commonly employed to evaluate
results. As reviewed by Palmer et al. (2005), success is perceived differently among
various disciplines and can be separated into a few categories: stakeholder (e.g.,
aesthetics, costs, compliance), learning (e.g., lessons learned and experience gained), and
ecological (e.g., returning river processes, sustainability) success.
3.3.2 Adaptive Management. Participants noted the importance of employing
adaptive management protocols as a means of improving the success of restoration
efforts. While definitions vary with discipline or by the approach used (e.g., Walters
1986, Halbert and Lee 1991, Johnson et al. 2002), the essence of adaptive management is
to employ an iterative process that optimizes management strategies over time in the face
of uncertainty. The goal is to implement management and measure progress while
recognizing that inherent uncertainties exist in dynamic and unpredictable riparian
ecosystems (Walters, 1986). Ecological and social complexities also arise when
implementing river restoration strategies, so strategic adaptive management can also
incorporate how science, management, and policy influence outcomes (Kingsford et al.
2011). Adaptive management uses each step of a management program as an
information-gathering exercise in which results are used to modify or design the next

63
stage (Halbert and Lee 1991). Therefore, adaptive management requires the collection
and analysis of monitoring data to evaluate progress toward meeting a restoration
objective (Thom 1997). Restoration results must be monitored, documented, and
evaluated in a manner that provides the information needed to determine not only how
well progress toward objectives is being achieved, but what is driving the level of
progress. If progress is deemed unacceptable, knowing how to adjust restoration tactics
to improve progress is the essence of adaptive management. Incorporating lessons
learned into adaptive management strategies will improve future chances for project
success while reducing uncertainties.
3.3.3 Data Sharing. Conference participants highlighted the importance of
standardizing, centralizing, and sharing restoration data. Participants concluded that
accomplishing these goals and disseminating data to the broader community will improve
restoration, but will require coordinated efforts by the restoration community. Benefits of
sharing qualitative and quantitative information include improving project coordination,
learning from others‘ experiences, avoiding ―reinventing-the-wheel‖ scenarios,
disseminating site background information, and identifying potential restoration team
members.
Although Internet resources and technology can be used to build and archive
restoration data, sharing data between different entities in an open, transparent manner
can be a challenge. Proprietary rules regarding data sharing often need to be understood
and addressed. Data sharing requires identifying which member or group of a diverse

64
restoration team will take on the on-going responsibility of data entry, quality assurance,
and management. While standard data protocols exist at the federal level, an integrated,
web-based database with standardized protocols could improve collaboration and data
sharing between non-federal entities. Conference participants involved in trans-boundary
river projects noted the additional challenge of establishing shared databases that are
internationally recognized.
3.4 Emerging River Restoration Themes
3.4.1 Environmental Flows. As defined at the 2007 International River Symposium in
Brisbane, Australia, environmental flows refer to ―the quantity, timing, and quality of
water flows required to sustain freshwater and estuarine ecosystems and the human
livelihoods and well-being that depend upon these ecosystems‖ (Brisbane 2007).
Securing environmental flows is a priority in semiarid regions in the US, Mexico,
Australia, and other countries where water resources are often over-allocated with no
water dedicated to supporting native river ecosystems. Inherent complexities of water
law, regulations, compacts, and policies make securing water, as well as transporting
secured water to its destination, a significant challenge. Despite these challenges, a
variety of innovative strategies have been recently developed, which tend to fall into one
of three categories: supply, demand management, or reallocation (Garrick et al. 2011).
Identifying the most appropriate strategy for a stream or river requires understanding the

65
relative costs and benefits of allocating water between multiple demands, including
environmental needs.
In the Colorado River Basin, strategies for securing water for restoration activities
focus mainly on purchasing water rights from owners of retired agricultural lands (John
Swett pers. comm.). Water to meet these rights is stored in reservoirs and prescribed for
future needs. Proposals are in the works in effort to secure in-stream flows whereby
Mexico could store water rights in US reservoirs during surplus years to be used during
dry years or for restoration that requires water prescriptions (e.g., quantified peak flow or
baseflow discharges; Osvel Hinojosa pers. comm.). In contrast, along the unimpounded
San Pedro River in southern Arizona, management has focused on retiring riverside
agricultural lands in order to reduce groundwater extraction, thus protecting base flow
that is needed to support native flora and fauna.
Linking water saved via water conservation actions to direct benefits for native
ecosystems is a key legal and political challenge. Harvesting stormwater runoff can
assist in recharging shallow aquifers, which may elevate water tables and potentially
increase streamflows. Some regions have established water conservancy districts,
developed management plans, and/or established grant programs that address water
quantity and quality concerns. In Sierra Vista, Arizona, for example, the Partnership
Water Conservation Grant Program gives grants to businesses to improve water
conservation and efficiency, the Desert Hospitality Water Conservation Program offers
incentives to lodging and dining establishments to save water, and the County Toilet
Rebate Program offers local residences the option to replace old commodes with new
66
efficient water-saving commodes (CCWCO 2012). Tucson, Arizona, is conducting a
Conserve to Enhance pilot project that allows money saved on water bills to be pooled
and used to purchase environmental water rights (Schwarz and Megdal 2008).
Conference participants noted that environmental flow initiatives can take significant
time to negotiate and implement, and it is critical to show near-term tangible progress
(e.g., on-the-ground pilot projects) while long-term initiatives are prepared.
3.4.2 Climate Change. The issue of how to incorporate climate change information
into the river restoration ‗equation‘ was a key theme of the conference. It is likely that
riparian ecosystems will be among the most sensitive to climate change given their
dependence on precipitation patterns (Ormerod 2009). Future warming and drying
predicted throughout the southwestern US into Mexico (Intergovernmental Panel on
Climate Change [IPCC] 2007) will shift the timing and intensity of streamflows and
consequently alter transport of water and sediment to and within channels (Pfister et al.
2004), producing a new level of uncertainty for setting restoration objectives and for
managing restoration projects (Ingram 2009).
Despite the importance of designing and implementing climate change adaptation
into restoration projects, only a few publications have addressed hydro-climatology in
support of long-term water resources management and planning (Serrat-Capdevila et al.
2007). As part of a forthcoming river restoration guidebook based on conference results
(see Discussion below), conference organizers are developing a climate-adaptive strategy

67
specific to river restoration that centers on assessing the vulnerability of restoration
objectives to climate change impacts.
A variety of programs and information sources are available to provide restoration
practitioners climate change data and assistance, including CONAGUA in Mexico,
National Oceanic and Atmospheric Administration (NOAA) in the US, many academic
institutions in both countries, as well as the Department of Interior‘s Climate Science
Centers and Landscape Conservation Cooperatives, the Interagency Climate Change
Adaptation Task Force created in 2009 by the White House, various state climatologist
offices, and the National Phenology Network, among numerous others.
3.4.3 Native Fish Conservation. Of all fauna, native fish species may be the most
affected by the biophysical deterioration of our rivers. Most regulated rivers can no
longer sustain historical native fish populations because streamflow cannot be managed
to mimic pre-dam conditions (e.g., turbidity, temperature, sediment transport) necessary
for migration, spawning, and survival (Stanford and Ward 1986, Minckley and Meffe
1987, Marchetti and Moyle 2001, Brouder 2001). Conversely, non-native fish species
often thrive in altered rivers and compete with natives (Stanford and Ward 1986, Richter
1997). Future restoration of native fish populations could be further impacted by climate
change exacerbating stresses on native fish and potentially shifting geographic ranges
(USBR 2011b). A key priority identified by conference participants was the need to
develop criteria to identify high priority river reaches where long-term restoration would
be most likely to succeed. Understanding which fish species may be imperiled and which

68
species can benefit from even partial restoration of the natural flow regime can help
prioritize sites and benefit future efforts for native fish restoration (Poff et al. 1997,
Propst and Gido 2011).
The urgency to protect and restore native fish habitat highlights the importance
for strengthening communication and collaboration between ichthyologists, or other
aquatic scientists, and river practitioners working on other types of restoration projects.
Partnerships can promote opportunities to address complicated challenges, such as when
river management is dictated by other priorities (e.g., recreational fishing). Fortunately,
approaches for improving native fish habitat often parallel restoration tactics intended to
restore hydroecological processes, thus the ability of a river to maintain native fish
populations is a good indicator of overall river health.
3.4.4 Trans-boundary River Conservation. The US and Mexico share many river
miles and both nations are interested in the conservation and protection of dryland rivers.
Water quality and quantity are concerns in international talks and agreements. Trans-
boundary cooperation and collaboration are of utmost importance when trying to ensure
healthy riparian ecosystems. Challenges in trans-boundary work include political, social,
cultural, language, training, and technological issues, along with differences in national
and regional policies and goals.
Recently, security issues related to drug smuggling have made collaborative trans-
boundary efforts even more challenging. Building partnerships with the US Department
of Homeland Security could benefit restoration. Acquiring permits or work visas and

69
establishing liaisons can increase travel efficiency and safety across borders. Improving
safety for restoration workers has helped efforts on the Rio Colorado by giving a former
―no-man‘s land‖ back to the community. Along the Rio Grande/Rio Bravo, work permits
are obtained through the International Boundary Water Commission (IBWC) and
Comisión Internacional Limitrofe y Agua (CILA) that allow bi-national work crews to
conduct restoration-related tasks on both sides of the river.
By building confidence and trust, on-the-ground pilot projects can provide the
necessary foundation for larger, longer-term bi-national efforts. A key ingredient noted
by several trans-boundary restoration experts was the importance of involving riverside
citizens by both addressing socioeconomic community needs in restoration objectives,
and by hiring citizens to conduct project activities. Involving river communities and
showing short-term project progress was critical in the Colorado River Delta to obtain
long-term agency buy-in and restoration plan support—another key ingredient of
successful bi-national projects.
Project recognition and involvement with agencies from the highest government
levels is also important. Encouraging government buy-in, working closely with key
water users, and explaining broader goals are important when developing trans-boundary
environmental flow programs. Discussing the lack of threats that conservation efforts
have on water supply and quality and emphasizing overall benefits is also necessary for
trans-boundary collaboration. The IBWC, CILA, and the Commission for Environmental
Cooperation provide a variety of services supporting trans-boundary work, including
fostering transparency between US and Mexican teams, enhancing technical and

70
scientific dialog, developing long-term objectives, conducting cross-training, and
providing a mechanism for effective data exchange.
4.0 Discussion
All major rivers in the southwestern US and northern Mexico have experienced
some degree of ecological deterioration. Efforts to restore rivers have increased
exponentially over the last 25 years. However, little documentation exists describing or
validating the best management practices for achieving restoration objectives. The 2010
Tucson conference provided river practitioners a platform at which to share experiences
and lessons to benefit future efforts. The overarching goal is to promote regional river
restoration such that local scale projects, which make up the majority of all river
restoration projects, can begin to contribute to broad-scale programs and goals. Broad-
scale river restoration that attempts to meet multiple objectives will require coordination
at multiple scales, with funding that supports projects that target more than a single
outcome (Gilvear et al. 2012). Perhaps the only way to accomplish such a feat, is to
promote larger funding cycles that support longer project timeframes. Building
partnerships and collaborations will allow varying expertise to attack multiple objectives
that all are working toward one goal, protecting and saving our dryland rivers for
generations to come.
An applied river restoration guidebook is being developed that incorporates
results from the conference and draws on contributing restoration experts, with the
preliminary title: “Planning and Implementing River Restoration in the Southwestern

71
United States and Northern Mexico.” The guidebook will provide detailed information
on all aspects of stream restoration processes, from planning and implementation to
monitoring and evaluation. Additional chapters will address climate change, quantifying
and securing environmental flows, native fish conservation, invasive plants, and the
development of restoration plans for rivers that cross political boundaries. The focus will
be on dryland rivers in arid and semiarid regions, but it will also serve as a useful
reference for planning river restoration in more mesic climates.
72
Acknowledgements
This work was funded through the World Wildlife Fund and NOAA Sectoral
Applications Research Program (SARP) with supplemental support by a National Science
Foundation Graduate Fellowship. The conference was funded by the Research
Coordination Network of the Colorado River Delta, Instituto Naciónal de Ecologia,
National Park Service, NOAA SARP, and Pronatural Noroeste. We appreciate other
support via small grants and in-kind services from the Center for Biology and Society at
Arizona State University, Desert Fish Council, Ecosystem Economics, RECON Inc.,
Sonoran Institute, Tamarisk Coalition, and Weber State University. We gratefully
acknowledge the conference‘s organizing committee for their efforts and Ann Audrey for
her beneficial reviews to this manuscript.
References
Aaron, P. 2001. The Suitability of reclaimed agricultural lands along the lower Colorado
River for native riparian habitat restoration. UNLV Theses/Dissertations/
Professional Papers/Capstones. Paper 289.
Anderson, B.R. 1995. Saltcedar, revegetation and riparian ecosystems in the Southwest.
California Exotic Pest Plant Council. 1995 Symposium Proceedings.
Arizona Riparian Council. 1995. Fact Sheet #1. Arizona State University. Center for
Environmental Studies. Tempe, AZ. pp 4.

73
Bernhardt, E.S., M.A. Palmer, J.D. Allan, G. Alexander, K. Barnas, S. Brooks, J. Carr, C.
Dahm, J. Follstad-Shah, D.Galat, S. Gloss, P. Goodwin, D. Hart, B. Hassett, R.
Jenkinson, S. Katz, G. M. Kondolf, P. S. Lake, R. Lave, J.L. Meyer, T.K.
O'Donnell, L. Pagano, B. Powell, and E. Sudduth. 2005. Synthesizing U.S. river
restoration efforts. Science 205:636-637.
Brisbane. 2007. The Brisbane Declaration. White Paper 1–7 [http://www.diversitas-
international.org/activities/research/freshwaterbiodiversity/resources/Brisbane_De
claration.pdf].
Brouder, M. J. 2001. Effects of flooding on recruitment of roundtail chub, Gila robusta,
in a Southwestern river. Southwestern Naturalist 46:302–310.
Buchanan, B.P., M.T. Walter, G.N. Nagle and R.L. Schneider.2012. Monitoring and
assessment of a river restoration project in central New York. River Research and
Applications 28:216-233.
Busch, D.E. 1995. Effects of fire on southwestern riparian plant community structure.
Southwestern Naturalist 40:259-267.
Cairns, J. 1991. The status of the theoretical and applied science of restoration ecology.
The Environmental Professional 11: 152-159.
Cochise County Water Conservation Office (CCWCO). 2012. Water Policy. Cochise
County. http://cochise.az.gov/cochise_water_policy.aspx?id=754.
Downs P.W. and G.M. Kondolf. 2002. Post-project appraisals in adaptive management of
river channel restoration. Environmental Management 29:477-496.
Dreesen, D., J. Harrington, T. Subirge, P. Stewart, and G. Fenchel. 2002. Riparian
restoration in the Southwest: species selection, propagation, planting methods,
and case studies. In: Dumroese RK, Riley LE, Landis TD, technical coordinators.
National proceedings: forest and conservation nursery associations—1999, 2000,
and 2001. Ft Collins (CO): USDA Forest Service, Rocky Mountain Research
Station. Proceedings RMRS-P-24. p 253–272.
England, J., K.S. Skinner, and M.G. Carter. 2008. Monitoring, river restoration and the
water framework directive. Water and Environment Journal 22:227-234.
Fenner, P., W.W. Brady, and D.R. Patton. 1985. Effects of regulated water flows on
regeneration of Fremont cottonwood. Journal of Range Management 38:135-138.

74
Follstad Shah, J.J., C.N. Dahm, S.P. Gloss, and E.S. Bernhardt. 2007. River and riparian
restoration in the Southwest: Results from the National River Restoration Science
Synthesis Project. Restoration Ecology 15:550-562.
Garrick, D., C. Lane-Miller, and A. McCoy. 2011. Institutional innovations for governing
environmental water in the western US. Economic Papers 30:1-18.
Gilvear, D.J., R. Casas-Mulet, and C.J. Spray. 2012. Trends and issues in delivery of
integrated catchment scale river restoration: lessons learned from a national river
restoration survey within Scotland. River Research and Applications 28:234-246.
Glenn, E., R. Tanner, S. Mendez, T. Kehret, D. Moore, J. Garcia, and C. Valdes. 1998.
Growth rates, salt tolerance and water use characteristics of native and invasive
riparian plants from the delta of the Colorado River, Mexico. Journal of Arid
Environments 40:281-294.
Gollehon, N. and W. Quinby. 2006. Chapter 2.1: irrigation resources and water costs.
Agricultural Resources and Environmental Indicators, 2006. EIB-16. Economic
Research Service, USDA.
Gonzalez, T.M. and J.D. Garcia. 2011. Riparian Quality Index (RQI): A methodology
for characterizing and assessing the environmental conditions of riparian zones.
Limnetica 30:235-253.
Halbert, C.L., and K.N. Lee. 1991. Implementing adaptive management. The Northwest
Environmental Journal 7:136-150.
Henry C.P. and C. Amoros. 1995. Restoration ecology of riverine wetlands: I. A
scientific base. Environmental Management 19:891-902.
Hopfensperger, K.N., K.A.M. Engelhardt, and S.W. Seagle. 2007. Ecological feasibility
studies in restoration decision making 39:843-852.
Howe, W.H. and F.L. Knopf. 1991. On the imminent decline of Rio Grande cottonwoods
in central New Mexico. Southwestern Naturalist 36:218-224.
Hultine, K.R., S.E. Bush, and J.R. Ehleringer. 2010. Ecophysiology of riparian
cottonwood and willow before, during, and after two years of soil water removal.
Ecological Applications 20:347-361.
Ingram, 2009. Practicing ecological restoration: climate change in context Ecological
Restoration 27:235-237.

75
IPCC. 2007. Summary for policymakers. In: Parry, M.L., Canziani, O.F., Palutikof, J.P.,
Van Der Linden, P.J., Hanson, C.E. (Eds.), Climate Change 2007: Impacts,
Adaptation and Vulnerability. Contribution of Working Group II to the Fourth
Assessment Report of the Intergovernmental Panel on Climate Change.
Cambridge University Press, Cambridge, UK.
Johnson, P.A., R.L. Tereska, E.R. Brown. 2002. Using technical adaptive management to
improve design guidelines for urban instream structures. Journal of the American
Water Resources Association 38:1143-1152.
Jungwirth, M., S. Muhar, and S. Schmutz. 2002. Re-establishing and assessing ecological
integrity in riverine landscapes. Freshwater Biology 47:867-887.
Kingsford, R.T., H.C. Biggs, and S.R. Pollard. 2011. Strategic Adaptive Management in
freshwater protected areas and their rivers. Biological Conservation 144:1194-
1203.
Knopf, F.L., R.R. Johnson, T. Rich, F.B. Samson, and R.C. Szaro. 1988. Conservation of
riparian ecosystems in the United States. Wilson Bulletin 100:272-284.
Kondolf, G.M., and P.W. Downs. 1996. Catchment approach to planning channel
restoration. Pages 129–148 in A. Brookes and F.D. Shields (eds.) River channel
restoration: guiding principles for sustainable projects. Wiley, Chichester.
Kundzewicz, Z.W. 2002. Ecohydrology—seeking consensus on interpretation of the
notion. Hydrological Sciences Journal 47:799–804.
Landis, T.D., D.R. Dreesen, R.K. Dumroese, R. Kasten, 2003. Sex and the single Salix:
considerations for riparian restoration. Native Plants Journal 4:110–117.
Lite, S.J., and J.C. Stromberg. 2005. Surface water and ground-water thresholds for
maintaining Populus-Salix forests, San Pedro River, Arizona. Biological
Conservation 125:153-167.
Malanson, G.P. 1995. Riparian Landscapes. Cambridge University Press: Cambridge.
Marchetti, M. P., and P. B. Moyle. 2001. Effects of flow regime on fish assemblages in a
regulated California stream. Ecological Applications 11:530–539.
Minckley, W.L. and G.K. Meffe. 1987. Differential selection by flooding in stream fish
communities of the arid American Southwest. In W. J. Matthews and D. C. Heins,
editors. Community and evolutionary ecology of North American stream fishes.
University of Oklahoma Press, Norman, Oklahoma. pp.93-104.

76
Mirauda, D. and M. Ostoich. 2011. Surface water vulnerability assessment applying the
integrity model as a decision support system for quality improvement.
Environmental Impact Assessment Review 31:161-171.
Nagler, P.L., K. Morino, K. Didan, J. Erker, J. Osterberg, K.R. Hultine, and E. P. Glenn.
2008. Removal of saltcedar (Tamarix spp.) will not facilitate return of native trees
nor save water on the lower Colorado River. Ecohydrology doi:10.1002/eco.35.
Naiman, R.J., S.E. Bunn, C. Nilsson, G.E. Petts, G. Pinay, and L.C. Thompson. 2002.
Legitimizing fluvial ecosystems as users of water: an overview. Environmental
Management 30:455–467.
National Research Council (NRC) (1992) Restoration of Aquatic Ecosystems: Science,
Technology, and Public Policy. National Academic Press, Washington, DC.
National River Restoration Science Synthesis (NRRSS). 2006. River restoration in our
nation: a scientific synthesis to inform policy, grassroots actions, and future
research. http://nrrss.nbii.gov/info/statistics.html.
Nilsson C. and M. Svedmark. 2002. Basic principles and ecological consequences of
changing water regimes: riparian plant communities. Environmental Management
30:468-480.
Ormerod, S.J. 2009. Climate change, river conservation and the adaptation
challenge. Aquatic Conservation: Marine and Freshwater Ecosystems 19:609-
613.
Palmer, M.A., E.S. Bernhardt, J.D. Allan, G. Alexander, S. Brooks, J. Carr et al. 2005.
Standards for ecologically successful river restoration. Journal of Applied
Ecology 42:208–217
Palmer, M., J.D. Allan, J. Meyer, and E.S. Bernhardt. 2007. River restoration in the
twenty-first century: data and experiential knowledge to inform future efforts.
Restoration Ecology 15:472-481.
Patten, D.T. 1998. Riparian ecosystems of semi-arid North America: diversity and human
impacts. Wetlands 18: 498-512.
Pearce, F. 2007. When the rivers run dry: what happens when our water runs out?
Transworld Publishers, London.
Pfister, L., J. Kwadijk, A. Musy, A. Bronstert, and L. Hoffmann. 2004. Climate change,
land use change and runoff prediction in the Rhine-Meuse basins. River Research
and Applications 20:229-241.

77
Poff, N. L., J. D. Allan, M.B. Bain, J.R. Karr, K.L. Prestegaard, B.D. Richter, R.E.
Sparks, and J.C. Stromberg. 1997. The natural flow regime: a paradigm for river
conservation and restoration. BioScience 47:769-784.
Postel S., and B. Richter. 2003. Rivers for life: managing water for people and nature.
Island Press, Washington, DC.
Propst, D.L. and K.B. Gido. 2011. Responses of Native and Nonnative Fishes to Natural
Flow Regime Mimicry in the San Juan River. Transactions of the American
Fisheries Society 133:922–931.
Raulston, B.E. 2003. Habitat restoration on the lower Colorado River, demonstration
projects: 1995-2002. U.S. Bureau of Reclamation, Lower Colorado Regional
Office, Boulder City, Nevada, 36pp.
Revenga C., I. Campbell, R. Abell, P. De Villiers, and M. Bryer. 2005. Prospects for
monitoring freshwater ecosystems towards the 2010 targets. Philosophical
transactions of the Royal Society of London, Series B, Biological sciences
360:397-413.
Richter, B.D., D.P. Braun, M.A. Mendelson, and L.L. Master. 1997. Threats to imperiled
freshwater fauna. Conservation Biology 11:1081–1093.
Richter, B.D., R. Matthews, D.L. Harrison, and R. Wigington. 2003. Ecologically
sustainable water management: managing river flows for ecological integrity.
Ecological Applications 13:206–224.
Rood, S.B., and J.M. Mahoney. 1990. The collapse of riparian poplar forests downstream
from dams on western prairies: Probable causes and prospects for mitigation.
Environmental Management 14:451-464.
Rood, S.B., and J.M. Mahoney. 1991. The importance and extent of cottonwood forest
decline downstream from dams. P. 1-9. In S. B. Rood and J. M. Mahoney (eds.)
The Biology and Management of Southern Alberta‘s Cottonwoods. University of
Lethbridge Press, Alberta Canada.
Sala, A. and S. Smith. 1996. Water use by Tamarix ramosissma and associated
phreatophytes in a Mohave Desert floodplain. Ecological Applications 6:888-898.
Schwarz, A. and S.B. Megdal. 2008. Conserve to Enhance: Voluntary Municipal Water
Conservation to Support Environmental Restoration. Journal of the American
Water Works Association 100:42-53.

78
Serrat-Capdevila, A., J. B. Valdes, J. González Pérez, K. Baird, L.J. Mata, and T.
Maddock. 2007. Modeling climate change impacts—and uncertainty—on the
hydrology of a riparian system: The San Pedro Basin (Arizona/Sonora). Journal of
Hydrology 347:48-66.
Shafroth, P.B., J.C. Stromberg and D.T. Patten. 2002. Riparian vegetation response to
altered disturbance and stress regimes. Ecological Applications 12:107-123.
Shafroth, P.B., J.R. Cleverly, T.L. Dudley, J.P. Taylor, C. van Riper III, E.P. Weeks, and
J.N. Stuart. 2005. Control of Tamarix in the western United States: Implications
for Water Salvage, Wildlife Use, and Riparian Restoration. Environmental
Management 35:231-246.
Skinner, K.S., F.D. Shields, and S. Harrison. 2007. Measures of success: defining the
outcomes. In Sear, D.A. and Darby, S.E. (eds). River Restoration: Managing the
Uncertainty in Restoring Physical Habitat. John Wiley and Sons Ltd., Chichester.
Stanford, J. A., and J. V. Ward. 1986. Fish of the Colorado River system. Pages 385–402
in B. R. Davies and K. F. Walker, editors. The ecology of river systems. Dr. W.
Junk Publishers, Dordrecht, The Netherlands.
Stromberg, J.C. 1993. Fremont cottonwood-Gooding willow riparian forests: a review of
their ecology, threats, and recovery potential. Journal of the Arizona-Nevada
Academy of Science 26:97-111.
Stromberg, J.C., V.B. Beauchamp, M.D. Dixon, S.J. Lite, and C. Paradzick. 2007.
Importance of low-flow and high-flow characteristics to restoration of riparian
vegetation along rivers in arid southwestern United States. Freshwater Biology
52:651-679.
Swift, B.L. 1984. Status of riparian ecosystems in the United States. Water Resources
Bulletin 20:223-228.
Szaro, R. 1989. Riparian forests and shrubland community types of Arizona and New
Mexico. Desert Plants 9:1-138.
Taylor, J.P., D.B. Wester, and L.M. Smith. 1999. Soil disturbance, flood management,
and woody riparian plant establishment in the Rio Grande floodplain. Wetlands
19:372-382.
Thom, R.M. 1997. System-development matrix for adaptive management of coastal
ecosystem restoration projects. Ecological Engineering 8:219-232.

79
Underwood, A.J. 1994. On beyond BACI: sampling designs that might reliably detect
environmental disturbances. Ecological Applications 4:3-15.
U.S. Bureau of Reclamation. 2011a. Lower Colorado River Multi-Species Conservation
Program – [http://www.lcrmscp.gov/steer_committee/technical_reports.html] –
Technical Reports: work tasks, conservation areas development and management.
U.S. Bureau of Reclamation. 2011b. SECURE Water Act Section 9503(c) – Reclamation
Climate Change and Water, Report to Congress.
Walters, C. J. 1986. Issues of adaptive management of renewable resources. Macmillan,
New York, 374 pp.
Ward, J.V. and J.A. Stanford. 1995. The serial discontinuity concept: extending the
model to floodplain rivers. Regulated Rivers: Research and Management 10:159-
168.
Warner, R.E. and K.M. Hendrix. 1984. California Riparian Systems: Ecology,
Conservation and Productive Management. University of California Press,
Berkeley, California. 1035 pp.
Westman, W.E. 1991. Ecological restoration projects: measuring their performance.
Environmental Professional 13:207-215.
Withrow-Robinson, B. and R. Johnson. 2006. Selecting native plant materials for
restoration projects: ensuring local adaptation and maintaining genetic diversity.
Oregon State University, Extension Service. Corvalis, OR.
Wohl, E., P.L. Angermeier, B. Bledsoe, G.M. Kondolf, L. MacDonnell, D.M. Merritt,
M.A. Palmer, N.L. Poff, and D. Tarboton. 2005. River restoration. Water
Resources Research Vol. 41, W10301, 12 PP., doi:10.1029/2005WR003985.
Wohl, E. 2005. Compromised rivers: understanding historical human impacts on rivers in
the context of restoration. Ecology and Society 10:2
http://www.ecologyandsociety.org/vol10/iss2/art2/.
Zalewski M. 2002. Ecohydrology—the use of ecological and hydrological processes for
sustainable management of water resources. Hydrological Sciences Journal
47:823–832.

80
Figure Captions
Figure 1. Flow chart for river restoration steps including phases for planning and design,
implementation, and post-implementation.
Figure 2. A cost/benefit analysis conducted for potential restoration sites may assist in
site prioritization and determining restoration feasibility. Taking environmental and
socio-political constraints into account, restoration projects can fall into three categories:
A) full recovery potential, resources are available for rapid improvement with long-term
stability; B) limited recovery potential, resources may be available, but rehabilitation may
take time to achieve a certain level of stability; or resources may be limited, but current
conditions can be rehabilitated to attain an improved level of long-term stability; or C) no
recovery potential, there are insufficient resources to succeed, or the site has irreversible
anthropogenic damage (e.g., regulated dams, levees, channel diversion, disconnected
floodplains, etc.) that cannot be mitigated or managed to improve hydroecological
processes.
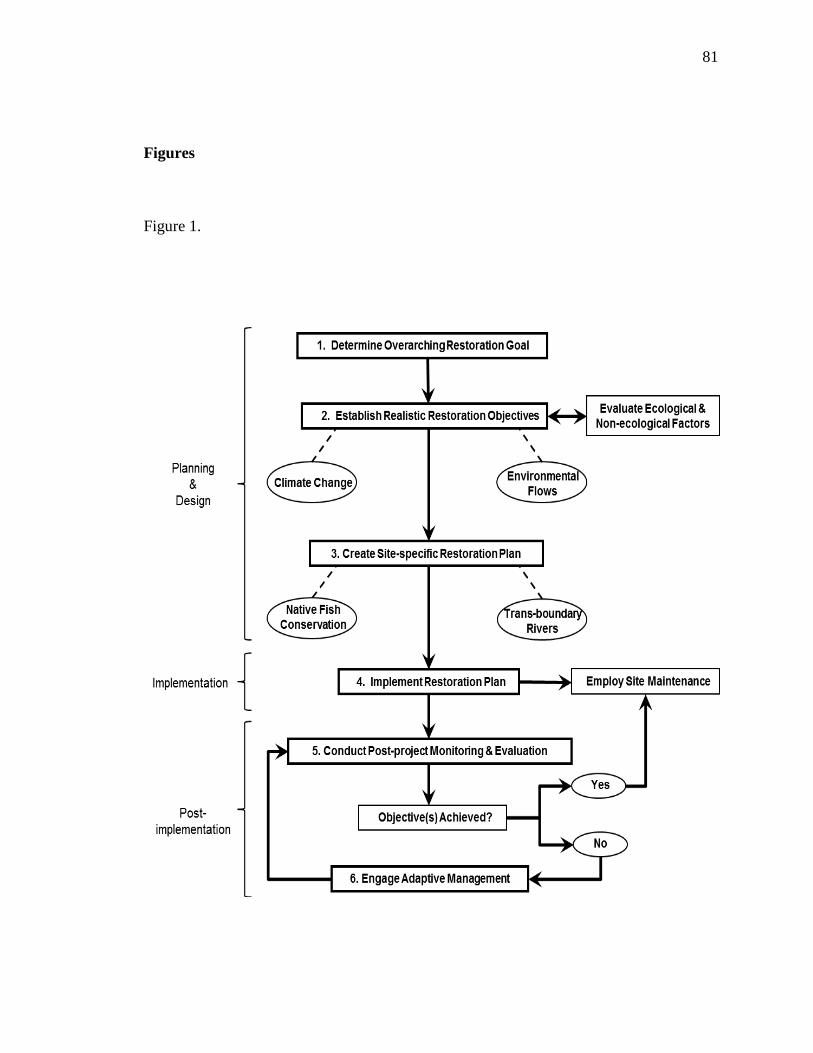
81
Figures
Figure 1.
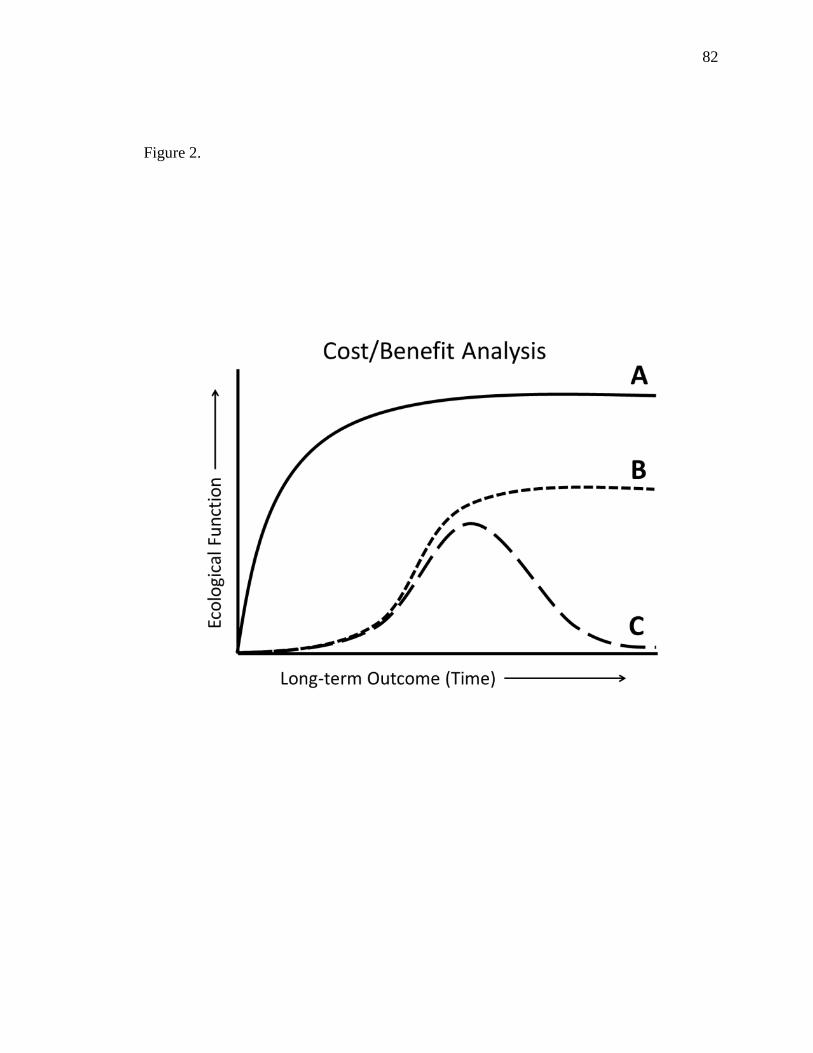
82
Figure 2.
83
APPENDIX B: LONG-TERM VEGETATION DYNAMICS AFTER HIGH-DENSITY
SEEDLING ESTABLISHMENT: IMPLICATIONS FOR RIPARIAN RESTORATION
AND MANAGEMENT
Daniel P. Bunting1, Shirley A. Kurc
1, and Matthew R. Grabau
2
Submitted to the Journal of River Research and Applications
1School of Natural Resources and the Environment, University of Arizona, Tucson, AZ
2GeoSystems Analysis, Inc., Tucson, AZ
Daniel P. Bunting. School of Natural Resources and the Environment, University of
Arizona, 304A Biological Sciences East, 1311 E. 4th
St, Tucson, AZ 85721,
USA., [email protected]
Shirley A. (Kurc) Papuga. Assistant Professor. School of Natural Resources and the
Environment, University of Arizona, 209 Biological Sciences East, P.O. Box
210043, Tucson, AZ 85721, USA, [email protected]
Matthew R. Grabau. GeoSystems Analysis, Inc., 2015 North Forbes Blvd., Suite 105,
Tucson, AZ 85745, USA, [email protected]
84
Abstract
Human disturbances have contributed to the deterioration of many western US
rivers in the past century. Cottonwood-willow communities, present historically along
the Colorado River, protect watersheds and provide wildlife habitat, but are now among
the most threatened forests. As a result, restoration efforts have increased to re-establish
and maintain cottonwood-willow stands. While successful establishment has been
observed using multiple strategies with varying investments, few projects are evaluated to
quantify efficacy and determine long-term sustainability. We monitored a seeded
cottonwood-willow site over a five-year period beginning in 2007, with particular interest
in how density affected vegetation diversity and stand structure over time. Fremont
cottonwood (Populus fremontii) and volunteer tamarisk (Tamarix ramosissma) were the
only abundant riparian trees at the site after one year. P. fremontii, compared to T.
ramosissma, had higher growth rates, lower mortality, and dominated overstory and total
cover each year. Vegetation diversity decreased from 2007-2009, but was similar from
2009-2011 as a result of decreased herbaceous and increased shrub species richness.
Diversity was highest in the lowest density class (1-12 stems/m2), but similar among all
other classes (13-24, 25-42, 43+). High initial woody species densities resulted in single-
stemmed trees with depressed terminal and radial growths. Allometry, relating height to
DBH at different densities, could prove to be an important tool for long-term restoration
management and studying habitat suitability. Understanding long-term trends at densely-

85
planted or seeded sites can benefit restoration managers who aim to establish specific
community structure and vegetation diversity for wildlife habitat.
Key Words: Colorado River, cottonwood, diameter at breast height, Populus fremontii,
revegetation, saltcedar, Tamarix ramosissima

86
1.0 Introduction
Western rivers in the United States (US) have been severely degraded throughout
the past century. Land-use change, river impoundment, surface and groundwater
extraction, and artificial inter- and intra-basin transfers have profoundly altered natural
flow regimes (Poff et al., 1997; Naiman et al., 2002; Postel and Richter, 2003; Revenga et
al., 2005; Pearce, 2007). Perhaps most affected by the physical degradation of western
US rivers are native riparian forests. Southwestern riparian forests in the US consist
primarily of cottonwood (Populus spp.) and willow (Salix spp.) communities that support
wildlife, biodiversity, watershed protection, and recreation in an otherwise unproductive
arid region (Fenner et al., 1985; Szaro, 1989; Patten, 1998). They are considered among
the most threatened forest types in the US (Swift, 1984; Busch and Smith, 1995; Shafroth
et al., 2005) due to severe degradation resulting from altered riparian ecosystem
hydrology (Rood and Mahoney, 1990; 1991; Stromberg, 1993; Lite and Stromberg, 2005;
Hultine et al., 2010). River regulation, in particular, has resulted in decreased soil
moisture and increased soil salinization (Busch and Smith, 1995; Sala and Smith, 1996;
Glenn et al., 1998; Nagler et al., 2008), channel narrowing and incision (Shafroth et al.,
2002), floodplain disconnection, and non-native species invasions that facilitate higher
fire frequency (Busch, 1995), which collectively have diminished the ability for native
species to recruit and establish large stands (Howe and Knopf, 1991; Johnson, 1992;
Merrit and Poff, 2010; Mortensen and Weisberg, 2010).
Because of the negative impacts from human disturbances and poor management
practices imposed in the past, much attention has been given to restore western US rivers.

87
Riparian ecosystems provide ecosystem services (e.g., cycling soil and nutrients,
replenishing aquifers, treating pollutants, providing water supply, providing recreation
opportunities, etc.) valued by humans (Carothers, 1977; Patten, 1998), but are also
extremely important in arid and semiarid regions where they support the majority of the
region‘s wildlife species and maintain high biodiversity and ecosystem productivity
(Knopf et al., 1998; Malanson, 1995). Riparian ecosystems in Arizona for example,
make up less than 0.5% of the total land surface area, yet 60-75% of all resident wildlife
depends on them for at least part of their lifespan (Arizona Riparian Council, 1995). For
this reason, re-establishing cottonwood-willow communities has become a major
component of river restoration in the Southwest. Although revegetation alone cannot
return full hydroecological function to southwestern rivers, many efforts will continue to
include management that focuses on habitat creation for avian and other wildlife
communities that are considered sensitive, threatened, or endangered species under
federal regulations.
Restoration projects have increased exponentially since the 1980s; however,
monitoring data are lacking or inaccessible, raising concerns on project efficacy,
numbers, foci, and costs (Follstad Shah et al., 2007). Many riparian revegetation
methods have proven effective, but success has often been measured by the ability to
establish native plants at high densities over short time windows (< 3 years; Taylor et al.,
2006). The reasoning for establishing trees at high densities is derived from the
competitive exclusion theory, which, in an ecological context, states that two functionally
similar species competing for the same resources cannot coexist (Grime, 1973).

88
Implementing such a strategy for riparian restoration allows the competitive superiority
of Populus spp. to limit success of volunteer species such as Tamarix spp. when water is
not limiting (Sher et al., 2000; 2002).
Many projects have been successful at re-establishing native riparian vegetation at
high densities using native seeds (Friedman et al., 1995; Taylor et al., 1999; Sprenger et
al., 2002; Raulston, 2003; USBR, 2005; Bhattacharjee et al., 2006; Grabau et al., 2011).
However, long-term monitoring data are required to quantify effectiveness and
sustainability of this strategy over time (Taylor et al., 2006). To date, few studies have
focused on longer-term persistence and competitive relationships of cottonwood and
tamarisk stands, or on the relationship of initial seedling densities to long-term restoration
of native riparian habitat in the southwestern US (Taylor et al., 2006). Many studies have
reported the restoration of a certain number of species and age classes along regulated
rivers, yet an understanding of long-term vegetation dynamics such as landscape
heterogeneity and native species diversity is lacking (Stromberg et al., 2007).
The Colorado River, considered the most regulated river in North America
(Adler, 2007), experiences negative impacts from river impoundment and agricultural
practices, including native vegetation clearing, high soil salinity (Busch and Smith, 1995;
Glenn et al., 1998), disconnected floodplains, and non-native species invasions that
facilitate higher fire frequency (Busch, 1995). However, the Lower Colorado River
(LCR) still serves as a greenbelt, an important migratory corridor for a host of birds, and
home to many aquatic and terrestrial wildlife species (USFWS, 2012). To ensure that
these habitats continue to support wildlife, myriad conservation and restoration practices

89
have been put into place along the LCR (USFWS, 2012; USBR, 2011a), particularly for
re-establishing native cottonwood-willow habitat. Variable results with different levels
of investment have been observed for many revegetation methods in the past (Raulston,
2003; USBR, 2011b). Selecting methods for future restoration practices should not only
aim for specific densities, but should understand how different densities will affect
structure and diversity as they relate to desired habitat characteristics.
The main objective of this paper is to understand longer-term (~ 5 years)
vegetation dynamics after seeding riparian vegetation at high densities. To our
knowledge, few studies have reported monitoring results spanning over a few years since
seedling establishment. However, quantitative and qualitative information regarding
vegetation stand structure, diversity, and insights to the overall trajectory of such
practices are important to managers when choosing restoration strategies in the future. In
2006, as part of the LCR Multi-Species Conservation Program (LCR-MSCP), the US
Bureau of Reclamation (USBR) implemented a study to test the feasibility of using native
seeds for riparian restoration. The project aimed to investigate potential methods for
seeding native riparian vegetation on a retired agricultural field with supplemental
irrigation (Grabau et al., 2011). Through the first three growing seasons, P. fremontii
showed competitive superiority over T. ramosissma (Bunting et al., 2011). Additional
surveys in 2010 and 2011 and a secondary analysis of data spanning from 2007-2011
allowed us to examine density effects on growth, mortality, and diversity over a five-year
period. While previous research demonstrates the ability of P. fremontii to be
successfully seeded and established in a field setting, this research explores the long-term

90
sustainability of such practices with particular emphasis on how woody tree density
affects growth and survival, overall vegetation diversity, and tree stand structure over
time.
True river restoration (e.g., complete structural and functional return to a
predisturbance state; Cairns, 1991) aims to restore both hydrological and ecological
processes, which seldom may be possible at regulated rivers (Wohl, 2007; Briggs, 2011).
Regardless, management to re-establish cottonwood-willow habitat will continue to occur
on both reclaimed agricultural lands as well as more natural settings because it satisfies
the Habitat Conservation Plan for covered (i.e., endangered species) and evaluation (i.e.,
could be listed in the future) species on the LCR (USBR, 2011a) and provides an
ecological improvement from current conditions, which are characteristic of patchy,
discontinuous vegetation and tamarisk monocultures that do not provide quality habitat.
The success of converting agricultural land for restoration practices will be determined,
in part, by long-term evaluations of abiotic and biotic factors that underlie the overall
quality, function, and sustainability of the habitat created. Determining levels of passive
or active maintenance required to sustain such practices in the long term may influence
when and where restoration is executed. If true restoration is not feasible, efforts should
be invested at suitable sites or should develop quantifiable objectives that will improve
current conditions to a certain level of sustainability, understanding the physical
limitations that are imposed at the project site.
2.0 Methods

91
2.1 Study site
This study was conducted on a former agricultural field on the Cibola National
Wildlife Refuge (CNWR) and is managed by the USBR. The field lies 1.5 km east of the
Colorado River (33°22‘03‖ N, 114°40‘50‖ W; 71 m elevation) in La Paz County, AZ and
is located on the historical floodplain terrace (Figure 1). Annual temperature ranges from
4°C to 49°C and rainfall averages under 100 mm yr-1
.
Soil at the site is predominately silt and silt loam down to a meter below ground
surface. Sand and sandy loam strata are prevalent below, especially toward the southern
portion of the field (GSA, 2007). Prior to irrigation, average surface soil salinity was less
than 2 dS m-1
and tended to be higher near the northern portion of the study site and
lower at depth in coarser, sandy soils (GSA, 2008). Salinity measured from 1-m soil
cores in winter 2007 was highly variable among plots, ranging from 1.8 dS m-1
to 26.9 dS
m-1
(soil salinity at 15 cm below ground surface (EC15) averaged 4.4 dS m-1
and ranged
from 1.8 to 22.3 dS m-1
; EC46 was 8.4 dS m-1
and ranged from 2.4 to 22.9 dS m-1
; and
EC91 was 6.3 dS m-1
and ranged from 0.5 to 26.9 dS m-1
. Groundwater salinity measured
in March, April, and June 2009 ranged from 1.6 to 2.7 dS m-1
. Depth to groundwater,
measured with on-site well-point piezometers prior to irrigation ranged from 2.2 to 2.6 m
below ground surface and ranged from 1.6 to 2.7 m throughout the study period (GSA,
2008; Bunting et al., 2011).
2.2 Irrigation management
92
The field site, originally seeded in May 2007, was surface or sprinkler-irrigated
daily for the first 10 days. Between day 10 and day 25, the field was watered every other
day, and was watered occasionally thereafter with a maximum gap of eight days between
irrigation events during the first growing season. Non-growing season irrigation was
infrequent. Irrigation in the 2008 growing season was scheduled to approximate 80% of
reference crop evapotranspiration (ET0) computed at the Cibola Weather Station (WRRC,
2012). Soil moisture and tree health condition monitoring in 2008 showed no water
stress, so irrigation in 2009 and 2010 was prescribed to approximate 60% of ET0. In
2011, irrigation infrastructure was modified such that calculation of applied water was
not possible; however, plots were flood-irrigated occasionally to prevent stress and
provide water during the growing season. Average irrigation across the field ranged from
5-15 cm every one to four weeks during each growing season with occasional watering in
the winter.
2.3 Field design
The field site was divided into 36 individual plots (6 m x 12 m) to test
germination success across various treatments (Grabau et al., 2011). In May 2008, three
randomized transects (6 m) were laid across each plot to measure overstory and total
cover percentages for all vegetation at the field site over time. Permanent quadrats (1.0
m x 0.5 m) were randomized along transects to assess health condition and to measure
target tree (i.e., Fremont cottonwood, P. fremontii; tamarisk, T. ramosissma) growth
rates, survival, and density over time. Target trees within each quadrat were assigned a

93
permanent tag with a unique number to allow measurement of the same tree in
subsequent surveys. To reduce edge effects and avoid disturbed areas following 2008
root excavations, this study analyzes two of the three original transects and quadrats from
each plot (i.e., those on the interior of each plot).
Initial tree densities ([stems/m2]; i.e., number of trees within each 0.5 m x 1.0-m
quadrat multiplied by two) were computed by counting how many target trees (not stems)
were present in each quadrat. Densities, ranging from 0 to 56 stems per 0.5 square meter,
were extrapolated to stems per square meter and assigned using the histogram
distribution. Density classes were chosen as follows: 0 (n = 7); 1-12 (n = 16); 13-24 (n =
16); 25-42 (n=17); and 43+ (n=16). We analyze and compare vegetation metrics among
density classes to assess how density impacts native versus non-native trees over time.
2.4 Vegetation monitoring
2.4.1 Growth and survival. Overall growth rate [cm/year] was determined by
subtracting height measurements for every target tree within each quadrat from each fall
survey, which were conducted every year at the end of the growing season. Tree height
in this study is defined by the terminal height of the primary stem. Growth rates were
analyzed among density classes and between P. fremontii and T. ramosissima. Mortality
percentages were assessed by documenting all dead trees in each quadrat upon
subsequent surveys (i.e., Mortality % = (d/n)*100, where d is the total number of deaths
within each quadrat during the year and n is the total number of trees documented in each
quadrat). Mortality was also analyzed among density classes and between species.
94
2.4.2 Cover and diversity. Cover percentages for both overstory and total cover were
computed using the point-intercept method (i.e., Cover % = x/n*100, where x is the
number of ―hits‖ of a given cover type and n is the number of sample points in each
transect for each plot). Four categories were selected to document species richness: 1)
Riparian (all target species including P. fremontii, S. gooddingii, S. exigua, and T.
ramosissma); 2) Shrubs (all volunteer shrubs including Prosopis spp., Baccharis spp.,
and Pluchea sericea); 3) Grasses/Sedges; and 4) Herbaceous (all non-grass annuals).
Vegetation diversity at the species level was computed using the Shannon-Wiener Index
(i.e., H‘ = -∑ pi*lnpi, where H‘ is species diversity and pi is the proportion constituted by
species i of all species present; Shannon, 1948), which was chosen because it accounts
for the relative abundance of each species and is the preferred index for communities
with few species (Tiegs, et al., 2005). Real communities often have rare species present
at very low numbers and the Shannon-Wiener Index, unlike other methods that treat rare
and common species the same, addresses diversity by weighting species by their
proportions (Huston, 1994; Jost, 2012). Vegetation diversity was analyzed among
density categories as well as total diversity after four years as observed using the 2010
fall survey (2011 was not analyzed because only a sub-sample of plots was surveyed due
to limited resources).
2.4.3 Stand structure. Qualitative and quantitative information was gathered to
document various structural attributes (e.g., tree form, number of stems per tree, terminal
95
height, and diameter at breast height). A total stem count (i.e., vegetation stem counts
include primary stems and secondary stems, when an additional stem branches out
between the base of the tree up to 10 cm above ground surface) was tallied and compared
to the total tree count. Relationships between terminal height and diameter at breast
height (DBH) were compared between target trees and between years 2008 and 2009.
Radial growth [cm/yr], calculated by subtracting DBHs between two field surveys (2009
and 2008), was compared between target species and among density classes.
3.0 Results
3.1 Growth and survival
Overall P. fremontii growth rate was significantly higher in 2009 (31.2 cm/yr) as
compared to 2010 (15.2 cm/yr) and 2011 (15.0 cm/yr) (Figure 2a). T. ramosissima
growth rate was higher in 2009 and 2010 (4.75 cm/yr and 5.52 cm/yr) compared to
2011(0.88 cm/yr), although not significant (Figure 2b). P. fremontii growth rates were
significantly higher than T. ramosissma in all years (Figure 2).
P. fremontii growth rate generally decreased with increased density in each year
except 2011 where the highest growth rates were observed in the highest density class
(43+ stems/m2; Figure 2a). T. ramosissma growth rates did not follow a trend when
comparing among density classes; the highest growth rates were observed in lowest
density class (1-12 stems/m2) and the second highest density class (13-42 stems/m
2).
96
P. fremontii mortality was similar to T. ramosissma in 2009, but was significantly
higher in 2010 and 2011 (Figure 3). The highest P. fremontii mortality (11.5%) was
observed in 2009, whereas the highest T. ramosissima mortality (49.4%) was observed in
2011, which was significantly higher than all other mortality rates during the study.
Mortality rates were not affected by density for either species. No P. fremontii
mortality occurred in the lowest or second lowest density class in 2010 or the lowest
density class in 2011, however, T. ramosissma mortality was observed in every density
class every year (Figure 3).
3.2 Cover and diversity
In 2007, a few months after seeding, grasses and sedges dominated both overstory
and total cover percentages (Figure 4). After two growing seasons, P. fremontii
dominated the overstory cover and after three growing seasons P. fremontii dominated
total cover. P. fremontii was the only vegetation class that increased in both overstory
and total cover each year with both percentages equaling 89% in 2011. As a result, no
other vegetation class had high overstory cover percentages throughout the study period.
T. ramosissma and grasses and sedges decreased in total cover percentage throughout the
study period, while shrubs and forbs experienced a slight increase from 2009-2011.
Species richness within the herbaceous and riparian classes decreased over time,
while species richness in the shrub class increased over time (Figure 5). Species richness
for grasses and sedges varied throughout the study period. Vegetation diversity
decreased significantly from 2007-2009, but was similar from 2009 and 2011 (Figure 5).

97
Diversity was lowest in the zero density class (which lacked any woody species), was
highest in the lowest density class (1-12), and did not differ in the highest three density
classes (Figure 6).
3.3 Stand structure
Only three P. fremontii trees in the stem-count survey had secondary stems,
resulting in a stem count of 548 from a total of 545 trees tagged. Total T. ramosissma
stem count matched the tree count of 500. The average P. fremontii terminal height was
2.43 m while the average T. ramosissma terminal height was 1.90 m. P. fremontii height
and DBH were significantly reduced at higher densities (Figure 7a), whereas T.
ramosissma height and DBH were not affected (Figure 7b). The average P. fremontii
DBH was 0.76 cm with a maximum of 3.35 cm while the average T. ramosissma DBH
was 0.36 cm with a maximum of 1.82 cm. Radial growth for P. fremontii more than
doubled that of T. ramosissma from 2008 to 2009 (Figure 8). Excluding the highest
density class, radial growth of P. fremontii decreased significantly as density class
increased, but no significant differences were found when relating radial growth of T.
ramosissma among density classes (Figure 8).
As expected, terminal height and DBH were strongly related (Figure 9, Table 1).
We looked at year-to-year differences between relationships to depict changes in growth
patterns over time. Regressions of P. fremontii terminal height and DBH showed slightly
stronger linear relationships in 2009 (r2 = 0.86) compared to 2008 (r
2 = 0.84), but T.
ramosissima was opposite, with a stronger linear relationship observed in 2008 (Table 1).

98
Overall, terminal height-to-DBH ratios were higher in P. fremontii compared to T.
ramosissma as depicted by slightly higher-sloped trendlines (Figure 9, Table 1). Because
we expected this relationship could change as trees grew older, we analyzed non-linear
relationships such as logarithmic and power functions that may account for reduced
growth over time. Only in the case of P. fremontii did a power function improve the
relationship (Figure 9). A linear trend better represented height-to-DBH relationships for
T. ramosissma in both years (Table 1).
4.0 Discussion
4.1 Long-term stand community dynamics
Based on all evaluation measures (e.g., growth rate, mortality rate, overstory and
total cover percentages, radial growth, etc.) through five years, P. fremontii has clearly
demonstrated competitive superiority over T. ramosissima at this field site. This
complements many studies that have highlighted the competitive advantages that Populus
spp. have over Tamarix spp. when water is not limiting (Stromberg, 1997; Sher et al.,
2000; 2002; Bunting et al., 2011). Rapid growth rates and minimal mortality have
resulted in a dominant P. fremontii overstory, but have consequently reduced grass and
herbaceous cover in the understory. While our tallest tree heights in our dataset reflect P.
fremontii and T. ramosissima terminal heights approaching six and four meters (Figure
9), respectively, some trees at this site have reached over 10 meters after only five years
of growth.
99
Allometric relationships are often used in forest ecology to estimate biomass
production, carbon stocks, fuel load, or simply to characterize trees at different life stages
(e.g., Gibbs et al., 2007; Wolf et al., 2011). Generally, height is roughly proportional to
diameter among understory saplings, but increases more gradually among large canopy
trees (Kira, 1978; Sterck and Bongers, 1998). This may partially explain why after two
years of growth, P. fremontii trees, which have a larger range of terminal heights,
displayed a stronger power relationship than T. ramosissma which, on average, consisted
of much smaller trees. Interestingly, adding two large trees (10.0 m, 1000-cm DBH and
9.2 m, 920-cm DBH) from ancillary data as tie points produced a P. fremontii power
relationship with the same r2 with an almost identical equation as observed in our dataset,
supporting the use of a power function for a wider range of tree sizes. Tree allometry
also varies in relation to the environment (King et al., 2009). For example, trees grown in
wide open spaces have trunks that can be several times as thick as trees of the same
height grown in dense patches (Ek, 1974; King, 1981). Our P. fremontii trees, having
lower DBHs at higher densities, support this relationship. Restoration that targets a
specific density can relate established tree density to metrics such as tree height, DBH,
and stem count. These relationships could be valuable to resource managers that are
interested in how density will affect tree structure and growth over time.
Similar to approaches used in forest management (Leftsky, 2001; Mette, 2004),
allometric relationships built around height, which can be quickly estimated in large
spatial extents using modern technologies such as LiDAR (Farid et al., 2006; Popescu,
2007), could be used to identify areas with appropriate structure for nesting habitat. For

100
instance, selected vegetation characteristics collected in situ can be related to height and
then, using LiDAR, larger areas could be analyzed to find suitable habitat. As a first step,
we built linear and power relationships between height and DBH for young target trees.
Additional allometric relationships valuable to habitat could include biomass, crown or
canopy width, and foliage density or vegetation volume. This research suggests that
allometry could be a valuable tool for long-term restoration management if large
databases were created to supply pertinent information on how different species heights
are influenced by density and how density, in turn, affects overall structural dynamics.
These relationships could then be used in restoration design and could be evaluated and
validated after establishment to assess overall effectiveness or suitability.
4.2 Vegetation diversity
Restoration endpoints often aim to maintain a desirable level of vegetation
diversity; however, as observed in this study, restoring native woody vegetation at high
densities negatively impacts recruitment of new species. Overall species richness
decreased every year with the most prevalent reduction in herbaceous cover. Herbaceous
growth established and maintained in open spaces, however, is one of the best wildlife
habitat improvements within large tracts of woodland (VDGIF, 2012). The Shannon-
Wiener Index has been commonly used to measure vegetation diversity because it can
track changes in relative species abundance over time (e.g., Huang et al., 2007; Ishida et
al., 2010; Shaheen et al., 2011). For instance, studies using the Shannon-Wiener Index
have shown decreases in species diversity and richness over time since flood disturbance

101
(Tiegs et al., 2005). Diversity at our field site reduced rapidly in the first couple years,
but leveled out three years after initial seeding. A slight increase in diversity in 2011 was
likely attributed to the recruitment of native shrub species, concurrent with reduced
proportions of riparian species. Native shrubs volunteering at the field site included
Pluchea sericea, Prosopis glandulosa, Baccharis salicifolia, and Atriplex lentiformis, all
of which are native species used in conservation plantings (USBR, 2011a). Vegetation
diversity could be augmented by adding seeds from desired native species to the seed
mix. Given their ability to volunteer in low-light, dense conditions, manually thinning
trees at high-density restoration sites could allow more desired shrubs to establish and
perhaps allow herbaceous species to proliferate in open spaces between woody
vegetation. Supplemental management could also include subsequent planting or seeding
of desired understory species, but long-term site maintenance may not be cost efficient.
4.3 Implications for wildlife habitat
Community composition and stand dynamics are important topics to discuss when
establishing trees for avian habitat, yet few studies focus on how revegetation strategies
affect these attributes. Some land managers consider high density establishment to be
more successful than low-density establishment, without taking into account that higher
densities may result in lower DBHs and hence lower stand volume (Bhattacharjee et al.,
2008; Taylor et al., 2006). The ability of native riparian communities with rich canopy
structures and abundant decadent trees to support more birds than saltcedar monocultures,
and to also support nest cavities and harbor greater species diversity has been well
102
documented (Anderson and Ohmart, 1982; 1984; Busch et al., 1992; Ellis, 1995; Ohmart
et al., 1988; Sedgwick and Knopf, 1986). Furthermore, certain structural attributes may
favor a particular bird species over another (e.g., Southwestern Willow Flycatcher versus
Brown-headed Cowbird), thus management efforts should take into account specific
nesting and refuge requirements for targeted bird species. For instance, high-density
native communities with shorter canopies may be desired to support habitat requirements
for the Southwestern Willow Flycatcher, while low initial densities with larger Populus
spp. forests may favor cavity-nesting bird species (Taylor et al., 2006).
Although foliar density was not quantified, high-density establishment of woody
species at our field site resulted in noticeably lower foliar volumes and DBHs compared
to recently restored riparian vegetation at adjacent fields, which is consistent with other
studies analyzing density effects on tree structure (Taylor et al., 2006). Furthermore, few
trees, out of over a thousand tagged, had greater than one basal stem, which is likely a
product of the high-density establishment of both P. fremontii and T. ramosissma.
Single-stemmed riparian vegetation may or may not be a desired structural attribute when
considering habitat requirements (e.g., bird nesting) for certain bird species. However,
larger trees observed at our study site have secondary branches large enough to support
nests and multiple nests have been observed in both P. fremontii and T. ramosissma trees,
although no official bird surveys have been conducted to quantify distribution,
abundance, or diversity.
4.4 Reclaimed agricultural fields and native seed distribution
103
The suitability of using reclaimed agricultural fields for revegetation, particularly
on the LCR, has been challenged (Aaron, 2011; Stromberg, 2007). For restoring
cottonwood-willow communities, in particular, it has been suggested to rely on the
following edaphic conditions: a) groundwater level (0.1 m - 3m); b) soil moisture; c)
salinity (< 2 dS); d) pH (6 - 8.5); and e) soil texture (coarse) (Aaron, 2011). In one study
using these guidelines, only one of nine chosen sites along the Colorado River was
considered suitable for restoration, and the majority of these sites were limited by
insufficient groundwater levels (Aaron, 2011). However, canal infrastructure at
agricultural sites can be used advantageously to supplement water until roots of riparian
vegetation reach the water table (Bunting et al., 2011). The ability of larger P. fremontii
and T. ramosissma trees at our site to reach shallow groundwater (< 3 m) after two
growing seasons suggests that using agricultural irrigation infrastructure would likely
succeed at sites having deeper groundwater with similar soil textures.
Despite not meeting all of the proposed edaphic conditions (e.g., our site had
salinity levels reaching well over 3 dS m-1
and soils characteristic of silt and silt loam), P.
fremontii and T. ramosissma trees have established and persisted for over five years.
However, irrigation has been applied consistently each growing season throughout the
five-year study period so tree response if irrigation were to cease is still unknown.
Irrigation not only supplements soil moisture, but flushes potentially harmful salts that
may evapoconcentrate on surface soils (ASCE, 2011). Results to date show site and soil
suitability have been sufficient for sustaining riparian vegetation, given extensive
irrigation. Typically, soil and groundwater salinity increase as a function of distance

104
from the main channel (Glenn and Nagler, 2005). Our site is further from the main
channel but has similar depth to groundwater to the majority of proposed MSCP sites on
the CNWR.
Importantly, the intent of this USBR project was not to restore hydroecological
processes, but to determine the feasibility of using and to demonstrate how to use native
seed distribution techniques for native riparian revegetation. Irrigation regimes were
implemented to grow riparian vegetation according to reference crop calculations and to
provide moist soils to promote conditions for invertebrate communities, but did not
necessarily mimic natural flood conditions nor aim to restore hydrological conditions.
Nonetheless, large P. fremontii trees are now phreatophytic and have the potential to be
sustained by shallow groundwater even after irrigation is ceased in the future. While
restoring riparian vegetation on a disconnected floodplain is not ideal, sustaining a
mixture of native and non-native species may contribute to continuity and refuge
necessary for migratory birds. Addressing all the factors responsible for degradation
along regulated rivers may not be possible, but restoration efforts may be able to mitigate
some negative impacts with sustainable outcomes. Recognizing the limitations inherent
in the present-day system, a compromise between purity and practicality has to occur to
progress toward establishing a significant amount of restored habitat on the LCR
(Raulston, 2003). For this reason, monitoring and quantified assessments of local
restoration projects, such as this, are important contributions to the restoration knowledge
base as future efforts aim to improve current and past management practices while
addressing broad, regional goals.

105
4.5 Conclusions
After five years, high-density establishment of woody species has resulted in
lower vegetation diversity and reduced overall growth potential of woody species.
Reduced terminal and radial growth rates are more pronounced in P. fremontii compared
to T. ramosissma; however, this is precluded by the competitive superiority of P.
fremontii observed at this field site. Relatively low mortality throughout the study period
suggests that high recruitment of other woody, shrub, or herbaceous species will not
likely occur without additional management to thin trees and create open spaces. The
decision to revegetate native species at high densities could benefit from a better
understanding of what ideal measures of biodiversity are, why they are important, and
how targeted wildlife species will be affected. Overall effectiveness will depend on
defining quantifiable objectives and addressing other underlying factors (e.g., moist soils;
invertebrate presence, abundance, and diversity; distance to surface water) that may not
only be impacted by the type of management imposed, but could be just as important for
attracting targeted wildlife species as the trees themselves. Monitoring efforts such as
this offer insight to long-term restoration trajectories and can be used to improve future
efforts for sustaining native riparian vegetation with desired densities and structure.
106
Acknowledgements
This research was supported by a National Science Foundation Graduate Research
Fellowship. Supplemental funding for the 2007-2009 surveys was provided by the
Bureau of Reclamation Lower Colorado River Multi-species Program and is gratefully
acknowledged. We thank Michael Milczarek and GeoSystems Analysis, Inc. for their
continued support as well as everyone at the Cibola National Wildlife Refuge. Lastly, we
thank all of the University of Arizona student employees who assisted in field surveys
and data collection.
References
Aaron P. 2001. The Suitability of reclaimed agricultural lands along the lower Colorado
River for native riparian habitat restoration. UNLV Theses/Dissertations/
Professional Papers/Capstones. Paper 289.
Adler RW 2007. The living artery: disruptions to the river‘s linear connections. Pages 26-
52. In Restoring Colorado River ecosystems: a troubled sense of immensity. Ch.
2. Island Press.
American Society of Civil Engineers. 1990. Agricultural salinity assessment and
management. 632 pp. Prepared by The Water Quality Technical Committee of
the Irrigation and Drainage Division of ASCE.
Anderson BW, Ohmart RD. 1982. Revegetation and Wildlife Enhancement Along the
Lower Colorado River. U.S. Department of the Interior, Bureau of Reclamation.
Contract 7-07-30-VOO09. 215 p.
Anderson BW, Ohmart RD. 1984. Final Report-Vegetation Management Study for the
Enhancement of Wildlife Along the Lower Colorado River. U.S. Department of
the Interior, Bureau of Reclamation. Contract 7-07-30-VOO09. 529 p.

107
Arizona Riparian Council. 1995. Fact Sheet #1. Arizona State University. Center for
Environmental Studies. Tempe, AZ. 4 pp.
Balandier P, Frochot H, Sourisseau A. 2009. Improvement of direct tree seeding with
cover crops in afforestation: microclimate and resource availability induced by
vegetation composition. Forest Ecology and Management 257:1716-1724.
Bhattacharjee J, Taylor JP, Smith LM, 2006. Controlled flooding and staged drawdown
for restoration of native cottonwoods in the Middle Rio Grande Valley, New
Mexico, USA. Wetlands 26: 691-702.
Bhattacharjee J, Taylor JP, Smith LM, Haukos DA. 2006. Seedling competition between
native cottonwood and exotic saltcedar: implications for restoration. Biological
Invasions 11: 1777-1787.
Briggs MK. 2011. Restoring rivers in southwestern United States and northern Mexico:
lessons learned from the past to benefit the future. Final Report Summarizing
Results of Conference. Chihuahuan Desert Program, World Wildlife Fund,
Tucson, AZ.
Bunting D, Kurc SA, Grabau MR. 2011. Using existing agricultural infrastructure for
restoration practices: Factors influencing successful establishment of Populus
fremontii over Tamarix ramosissma. Journal of Arid Environments 75: 851-860.
Busch D, Herbranson L, Johns E, Pinkney F, Sisneros D. 1992. Vegetation
management study: Lower Colorado River. Phase I Report to the USDI-U.S.
Bureau of Reclamation, Lower Colorado Region. 103 p.
Busch DE. 1995. Effects of fire on southwestern riparian plant community structure.
Southwestern Naturalist 40: 259-267.
Busch DE, Smith SD. 1995. Mechanisms associated with the decline of woody species in
riparian ecosystems of the southwestern U. S. Ecological Monographs 65: 347-
370.
Cairns J. 1991. The status of the theoretical and applied science of restoration ecology.
The Environmental Professional 11: 152-159.
Carothers SW. 1977. Importance, preservation, and management of riparian habitats: an
overview. Pages 2-4 In Importance, preservation, and management of riparian
habitats: a symposium. USDA Forest Service General Technical Report RM-43.
108
Ek AR. 1974. Dimensional relationships of forest and open grown trees in
Wisconsin. University of Wisconsin, School of Natural Resources Forestry
Research Note 181.
Ellis LM. 1995. Bird use of saltcedar and cottonwood vegetation in the Middle Rio
Grande valley of New Mexico, U.S.A. Journal of Arid Environments 30: 339-
349.
Farid A, Goodrich DC, Sorooshian S. 2006. Using Airborne Lidar to Discern Age
Classes of Cottonwood Trees in a Riparian Area. Western Journal of Applied
Forestry 21: 149-158.
Fenner P, Brady WW, Patton DR. 1985. Effects of regulated water flows on regeneration
of Fremont cottonwood. Journal of Range Management 38: 135-138.
Follstad Shah JJ, Dahm CN, Gloss SP, Bernhardt ES. 2007. River and riparian restoration
in the Southwest: Results from the National River Restoration Science Synthesis
Project. Restoration Ecology 15: 550-562.
Friedman JM, Scott ML, Lewis WM. 1995. Restoration of riparian forests using
irrigation, artificial disturbance, and natural seed fall. Environmental
Management 19: 547-557.
GeoSystems Analysis, Inc. 2007. Feasibility study using native seeds in restoration,
California-Arizona-Nevada – 2007 Annual Report. Prepared for Bureau of
Reclamation, Lower Colorado Region, March 2008.
GeoSystems Analysis, Inc., 2008. Site Characterization: Cibola National Wildlife Refuge
Field 51. Prepared for Bureau of Reclamation, Lower Colorado Region, April
2008.
Gibbs HK, Brown S, Niles JO, Foley JA. 2007. Monitoring and estimating tropical forest
carbon stocks: making REDD a reality. Environmental Research Letters 2:1-13.
Glenn EP, Tanner R, Mendez S, Kehret T, Moore D, Garcia J, Valdes C. 1998. Growth
rates, salt tolerance and water use characteristics of native and invasive riparian
plants from the delta of the Colorado River, Mexico. Journal of Arid
Environments 40: 281–294.
Glenn EP, Nagler PL. 2005. Comparative ecophysiology of Tamarix ramossissima
and native trees in western U.S. riparian zones. Journal of Arid Environments 61:
419-446.

109
Grabau MR, Milczarek MA, Karpiscak MM, Raulston BE, Garnett GN, Bunting DP.
2011. Direct seeding for riparian tree re-vegetation: Small-scale field study of
seeding methods and irrigation techniques. Ecological Engineering 37: 864-872.
Grime JP. 1973. Competitive exclusion in herbaceous vegetation. Nature 242: 344–347.
Heslop-Harrison J. 1965. Forty years of genecology. Advances in Ecological Research 2:
159-247.
Howe WH, Knopf FL. 1991. On the imminent decline of Rio Grande cottonwoods in
central New Mexico. Southwestern Naturalist 36: 218-224.
Huang D, Wang K, Wub WL. 2007. Dynamics of soil physical and chemical properties
and vegetation succession characteristics during grassland desertification under
sheep grazing in an agro-pastoral transition zone in Northern China. Journal of
Arid Environments 70: 120-136.
Hultine KR, Bush SE, Ehleringer JR. 2010. Ecophysiology of riparian cottonwood and
willow before, during, and after two years of soil water removal. Ecological
Applications 20: 347-361.
Huston M. 1994. Biological Diversity. Cambridge University Press, Cambridge, UK.
Ishida S, Yamazaki A, Takanose Y, Kamitani T. 2010. Off-channel temporary pools
contribute to native riparian plant species diversity in a regulated river floodplain.
Ecological Restoration 25: 1045-1055.
Johnson WC. 1992. Dams and riparian forests: Case study from the Upper Missouri
River. Rivers 3: 229-242.
Jost L. 2012. The New Synthesis of Diversity Indices and Similarity Measures:
Measuring the diversity of a single community. http://www.loujost.com/
Statistics%20and%20Physics/Diversity%20and%20Similarity/DiversitySimilarity
Home.htm.
King DA. 1981. Tree dimensions: maximizing the rate of height growth in
dense stands. Oecologia 51: 351–356.
King DA, Davies SJ,Tan S, Noor NSMd. 2009. Trees approach gravitational limits to
height in tall lowland forests of Malaysia. Functional Ecology 23: 284-291.

110
Kira T. 1978. Community architecture and organic matter dynamics in tropical lowland
rain forests of Southeast Asia with special reference to Pasoh Forest, West
Malaysia. Tropical Trees as Living Systems Pages (eds P.B. Tomlinson & M.H.
Zimmermann), pp. 561–590. Cambridge University Press, Cambridge.
Knopf FL, Johnson RR, Rich T, Samson FB, Szaro RC. 1988. Conservation of riparian
ecosystems in the United States. Wilson Bulletin 100: 272-284.
Landis TD, Dreesen DR, Dumroese RK, Kasten R. 2003. Sex and the single salix:
considerations for riparian restoration. Native Plants Journal 4: 110–117.
Lefsky MA, Cohen WB, Harding DJ, Parker GG, Acker SA, Gower ST. 2001. Lidar
Remote Sensing of Aboveground Biomass in Three Biomes. International
Archives of Photogrammetry and Remote Sensing 34: 155-160.
Lite SJ, Stromberg JC. 2005. Surface water and ground-water thresholds for maintaining
Populus-Salix forests, San Pedro River, Arizona. Biological Conservation 125:
153-167.
Malanson GP. 1995. Riparian Landscapes. Cambridge University Press: Cambridge.
Merritt DM, Poff NL. 2010. Shifting dominance of riparian Populus and Tamarix along
gradients of flow alteration in western North American rivers. Ecological
Applications 20: 135-152.
Mette T. 2004. Applying a common allometric equation to convert forest height from
Pol-InSAR data to forest biomass. Geoscience and Remote Sensing Symposium,
IGARSS '04. Proceedings. 2004 IEEE International.
Mortenson SG, Weisberg PJ. 2010. Does river regulation increase the dominance of
invasive woody species in riparian landscapes? Global Ecology and
Biogeography 19: 562-574.
Nagler PL, Morino K, Didan K, Osterberg J, Hultine K, Glenn E. 2009. Wide-area
estimates of saltcedar (Tamarix spp.) evapotranspiration on the Lower Colorado
River measured by heat balance and remote sensing methods. Ecohydrology 2:
18-33.
Naiman RJ, Bunn SE, Nilsson C, Petts GE, Pinay G, Thompson LC. 2002. Legitimizing
fluvial ecosystems as users of water: an overview. Environmental Management
30: 455-467.

111
Ohmart RD, Anderson BW, Hunter WC. 1988. The Ecology of the Lower Colorado
River from Davis Dam to the Mexico-United States International Boundary: A
Community Profile. USDI-U.S. Fish and Wildlife Service Biological Report 85,
296 p.
Patten DT. 1998. Riparian ecosystems of semi-arid North America: diversity and human
impacts. Wetlands 18: 498-512.
Pearce F. 2007. When the rivers run dry: what happens when our water runs out?
Transworld Publishers, London.
Poff NL, Allan JD, Bain MB, Karr JR, Prestegaard KL, Richter BD, Sparks RE,
Stromberg JC. 1997. The natural flow regime. A paradigm for river conservation
and restoration. BioScience 47: 769-784.
Popescu SC. 2007. Estimating biomass of individual pine trees using airborne lidar.
Biomass and Bioenergy 31: 646–655.
Postel S, Richter B. 2003. Rivers for life: managing water for people and nature. Island
Press, Washington, DC.
Raulston BE. 2003. Habitat restoration on the lower Colorado River, demonstration
projects: 1995-2002. U.S. Bureau of Reclamation, Lower Colorado Regional
Office, Boulder City, Nevada, 36pp.
Revenga C, Campbell I, Abell R, De Villiers P, Bryer M. 2005. Prospects for monitoring
freshwater ecosystems towards the 2010 targets: Philosophical transactions of the
Royal Society of London, Series B. Biological Sciences 360: 397–413.
Rood SB, Mahoney JM. 1990. The collapse of riparian poplar forests downstream from
dams on western prairies: Probable causes and prospects for mitigation.
Environmental Management 14: 451-464.
Rood SB, Mahoney JM. 1991. The importance and extent of cottonwood forest decline
downstream from dams. P. 1-9. In S. B. Rood and J. M. Mahoney (eds.) The
Biology and Management of Southern Alberta‘s Cottonwoods. University of
Lethbridge Press, Alberta Canada.
Sala A, Smith S. 1996. Water use by Tamarix ramosissma and associated phreatophytes
in a Mohave Desert floodplain. Ecological Applications 6: 888-898.
Sedgwick D, Knopf F. 1986. Cavity-nesting birds and the cavity-tree resource in plains
cottonwood bottomlands. Journal of Wildlife Management 50: 247-252.

112
Shafroth PB, Stromberg JC, Patten DT. 2002. Riparian vegetation response to altered
disturbance and stress regimes. Ecological Applications 12: 107-123.
Shaheen H, Khan SM, Harper DM, Ullah Z, Qureshi RA. 2011. Species diversity,
community structure, and distribution patterns in western Himalayan alpine
pastures of Kashmir, Pakistan. Mountain Research and Development 31: 153-159.
Shannon CE. 1948. A mathematical theory of communication. Bell System Technical
Journal 27: 377-423, 623- 656.
Sher AA, Marshall DL, Gilbert SA. 2000. Competition between native Populus deltoides
and invasive Tamarix ramosissima and the implication for re-establishing
flooding disturbance. Conservation Biology 14: 1744-1745.
Sher AA, Marshall DL, Taylor JP. 2002. Establishment of native Populus and Salix in
presence of invasive nonnative Tamarix. Ecological Applications 12: 760-772.
Sprenger MD, Smith LM, Taylor JP. 2002. Restoration of riparian habitat using
experimental flooding. Wetlands 22: 49-57.
Sterck FJ, Bongers F. 1998. Ontogenetic changes in size, allometry, and mechanical
design of tropical rain forest trees. American Journal of Botany 85: 266–272.
Stromberg JC. 1993. Fremont cottonwood-Gooding willow riparian forests: a review of
their ecology, threats, and recovery potential. Journal of the Arizona-Nevada
Academy of Science 26: 97-111.
Stromberg JC. 1997. Growth and survivorship of Fremont cottonwood, Goodding willow,
and saltcedar seedlings after large floods in Arizona. Great Basin Naturalist 57:
198-208.
Stromberg JC, Beauchamp VB, Dixon MD, Lite SJ, Paradzick C. 2007. Importance of
low-flow and high-flow characteristics to restoration of riparian vegetation along
rivers in arid southwestern United States. Freshwater Biology 52: 651-679.
Swift BL. 1984. Status of riparian ecosystems in the United States. Water Resources
Bulletin 20: 223-228.
Szaro R. 1989. Riparian forests and shrubland community types of Arizona and New
Mexico. Desert Plants 9: 1-138.
Taylor JP, Wester DB, Smith LM. 1999. Soil disturbance, flood management, and woody
riparian plant establishment in the Rio Grande floodplain. Wetlands 19: 372-382.
113
Taylor JP, Smith LM, Haukos DA. 2006. Evaluation of woody plant restoration in the
Middle Rio Grande: Ten years after. Wetlands 26: 1151-1160.
Tiegs SD, O‘Leary JF, Pohl MM, Munill CL. 2005. Flood disturbance and riparian
species diversity on the Colorado River Delta. Biodiversity and Conservation 14:
1175-1194.
U. S. Bureau of Reclamation. 2005. Beal Lake Habitat Restoration. Bureau of
Reclamation, Lower Colorado Region, Boulder City, NV.
U.S. Bureau of Reclamation. 2011a. Lower Colorado River Multi-Species Conservation
Program – [http://www.lcrmscp.gov/index.html] – Lower Colorado River Multi-
Species Conservation Program: Balancing resource us and conservation, USA.
U.S. Bureau of Reclamation. 2011b. Lower Colorado River Multi-Species Conservation
Program – [http://www.lcrmscp.gov/steer_committee/technical_reports.html] –
Technical Reports: work tasks, conservation areas development and management.
U.S. Fish and Wildlife Service (USFWS). 2012. Cibola National Wildlife Refuge.
[http://www.fws.gov/southwest/refuges/arizona/cibola.html].
Virginia Department of Game and Inland Fisheries. 2012. Creating Herbaceous
Woodland Openings to Improve Wildlife Habitat.
http://www.dgif.virginia.gov/habitat/ landowners/infosheets/woodland-
openings.asp.
Western Region Climate Center – [http: /www.wrcc.dri.edu] – Western Region Climate
Center – climatological data for Cibola National Wildlife Refuge, Cibola, AZ,
USA.
Withrow-Robinson B, Johnson R. 2006. Selecting native plant materials for restoration
projects: ensuring local adaptation and maintaining genetic diversity. Oregon
State University, Extension Service. Corvalis, OR.
Wohl E, Angermeier PL, Bledsoe B, Kondolf GM, MacDonnell L, Merritt DM, Palmer
MA, Poff NL, Tarboton D. 2005. River restoration. Water Resources Research
Vol. 41, W10301, 12 PP., doi:10.1029/2005WR003985.
Wolf A, Field CB, Berry JA. 2011. Allometric growth and allocation in forests: a
perspective from FLUXNET. Ecological Applications 21:1546-1556.

114
Table Captions
Table 1. Height to diameter at breast height relationships through two and three growing
seasons since seedling establishment.

115
Figure Captions
Figure 1. Site map of Cibola National Wildlife Refuge. Our study site is located on
Field 51, a retired agricultural field located on Unit#1 on the north side of the refuge
approximately 1.5 km east of the Colorado River.
Figure 2. Growth rates over time for: a) Fremont cottonwood; and b) tamarisk. Student‘s
t tests were used to compare means where lower case letters denote significance among
density classes within each year while capital letters denote significance among years
surveyed. Error bars depict standard error.
Figure 3. Mortality rates over time for: a) Fremont cottonwood; and b) tamarisk. Error
bars denote significance using 1.96 standard deviations (α = 0.05).
Figure 4. Vegetation cover percentages by selected vegetation classes surveyed over five
years for: a) overstory cover; and b) total cover. Error bars are not shown to avoid
clutter, although all error bars were small due to high sampling numbers each survey
(n=1512).

116
Figure 5. Species richness by vegetation class (bars) and Shannon-Wiener Index for
diversity (bold numbers) over time. All vegetation at the field was divided into four
categories: Riparian (all target species including cottonwood, tamarisk, and willow trees);
Shrubs (all non-target woody species including mesquite, baccharis, arrowweed, etc.);
Grasses/Sedges; and Herbecious (all annual and forb species).
Figure 6. Shannon-Wiener Index for diversity measured during the Fall 2010 survey.
Target stems include all woody target species (i.e., Fremont cottonwood and tamarisk)
per square meter.
Figure 7. Relationships between 2009 density and: a) Average diameter at breast height
(DHB); and b) Average height of Fremont cottonwood and tamarisk trees. P-values
denote significant differences (slope) across density classes using an Analysis of
Variance.
Figure 8. Radial growth among density classes for Fremont cottonwood and tamarisk
from year 2008-2009. Student‘s t tests were conducted to test significance where lower
case letters denote significance among density classes within species and capital letters
denote significance for average radial growth between species.

117
Figure 9. Height and diameter at breast height relationships after two (2008, closed
circles) and three (2009, open circles) years of growth for a) Fremont cottonwood using a
linear trend; b) Fremont cottonwood using a power trend; c) tamarisk using a linear trend;
and d) tamarisk using a power trend.
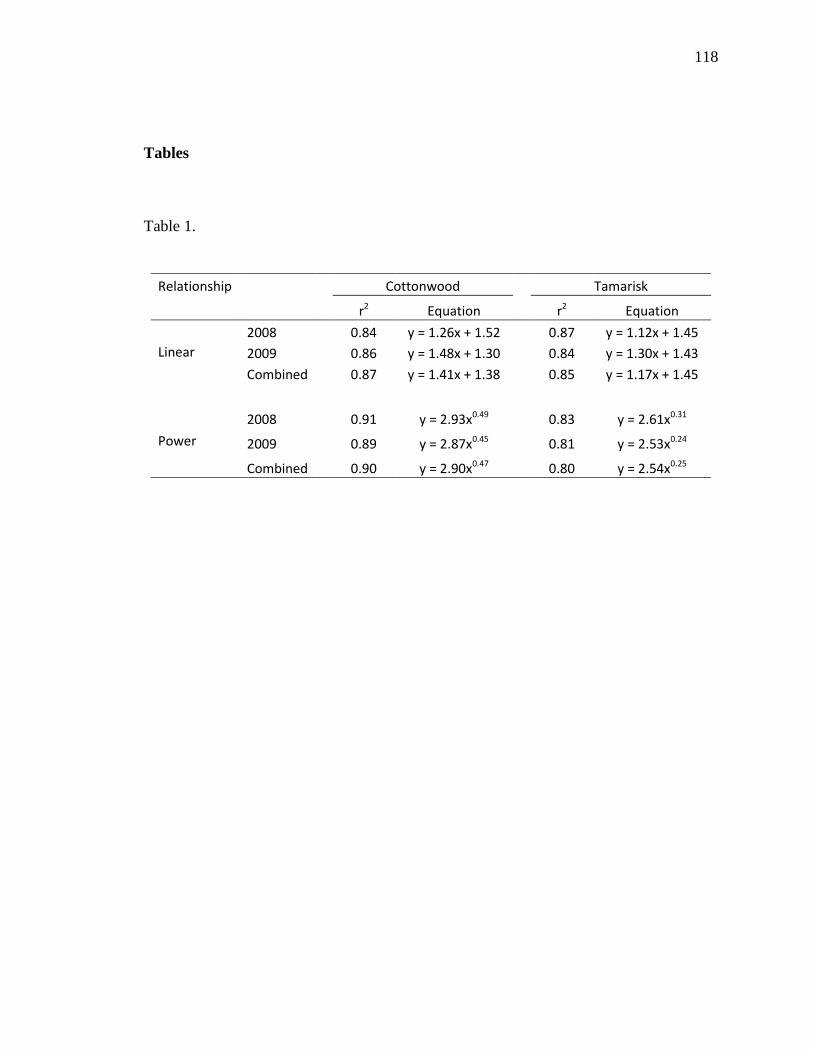
118
Tables
Table 1.
Relationship
Cottonwood
Tamarisk
r2 Equation r2 Equation
Linear
2008
0.84 y = 1.26x + 1.52
0.87 y = 1.12x + 1.45
2009
0.86 y = 1.48x + 1.30
0.84 y = 1.30x + 1.43
Combined
0.87 y = 1.41x + 1.38
0.85 y = 1.17x + 1.45
Power
2008
0.91 y = 2.93x0.49
0.83 y = 2.61x0.31
2009
0.89 y = 2.87x0.45
0.81 y = 2.53x0.24
Combined 0.90 y = 2.90x0.47 0.80 y = 2.54x0.25
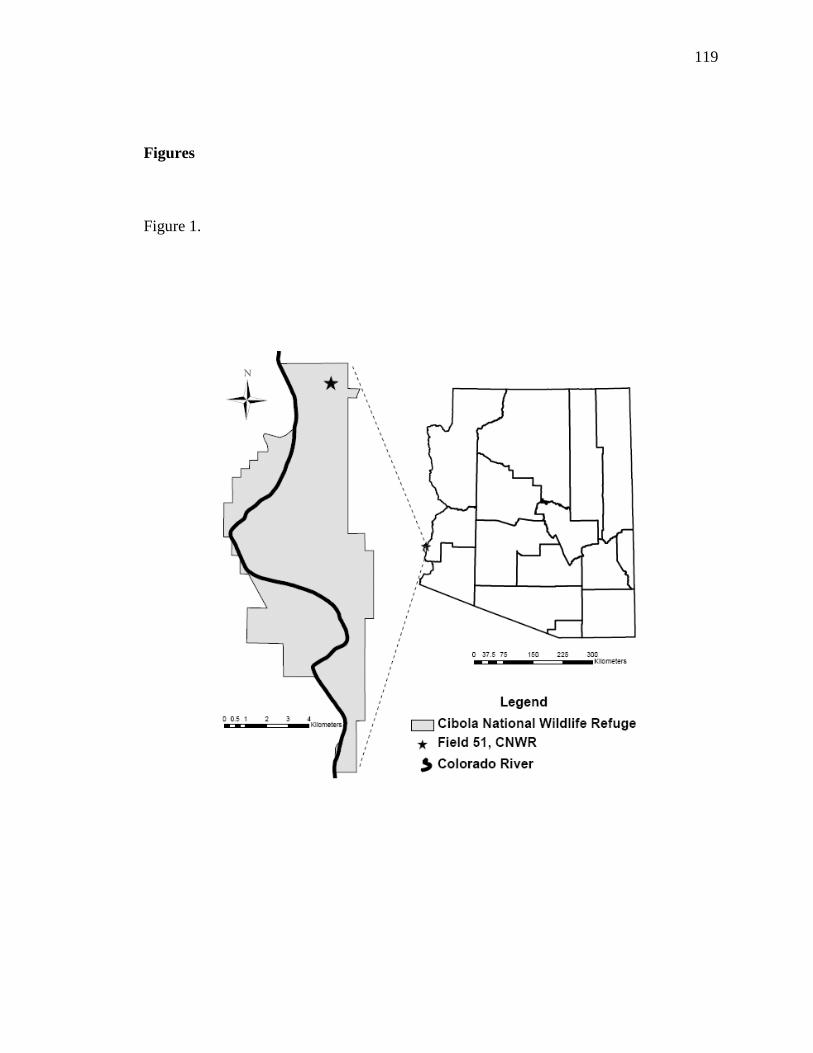
119
Figures
Figure 1.
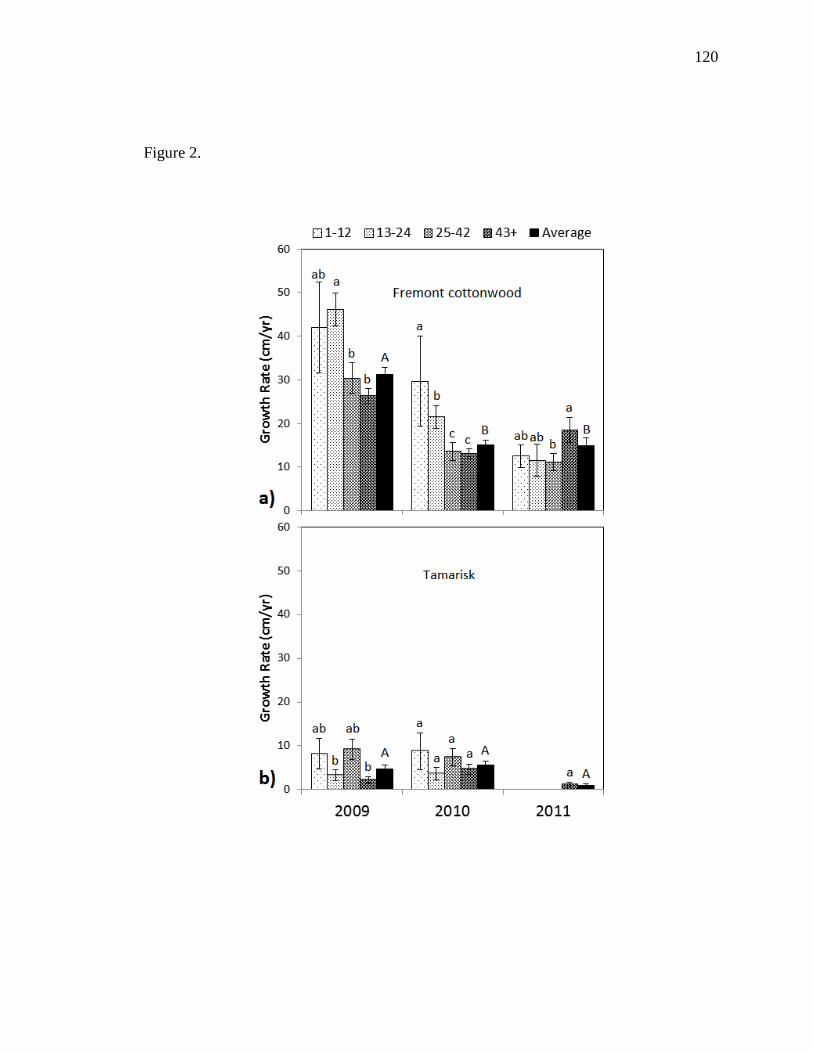
120
Figure 2.
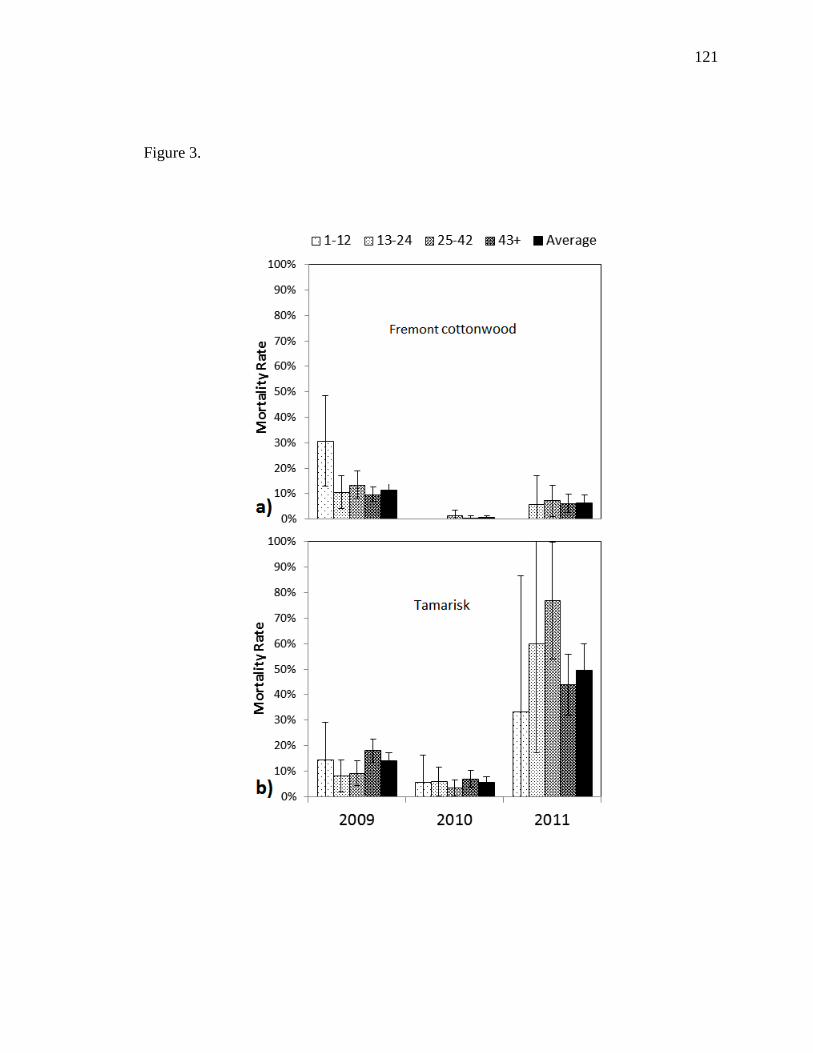
121
Figure 3.
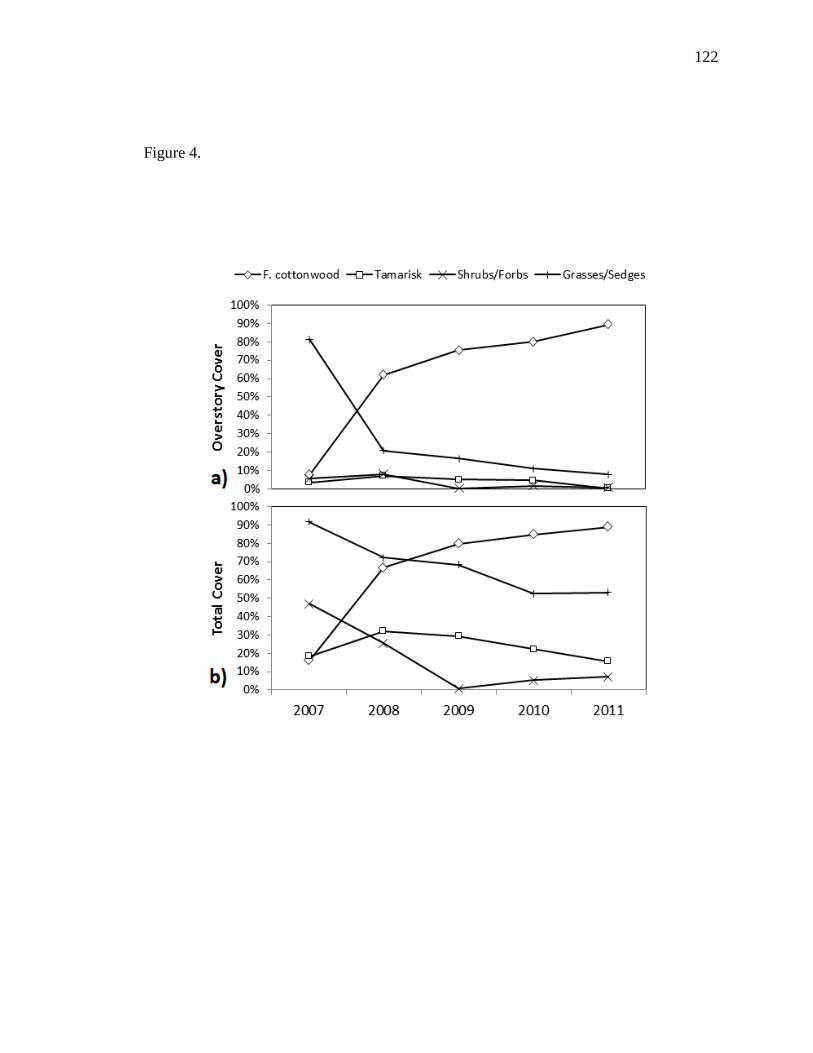
122
Figure 4.
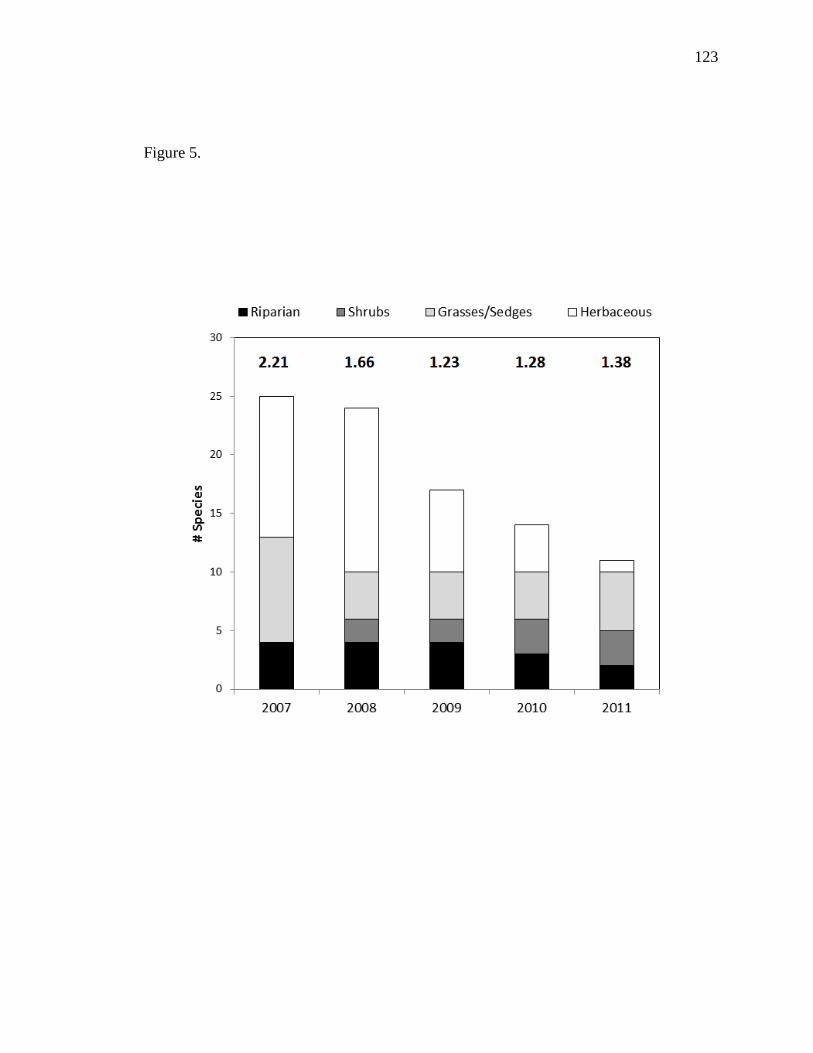
123
Figure 5.
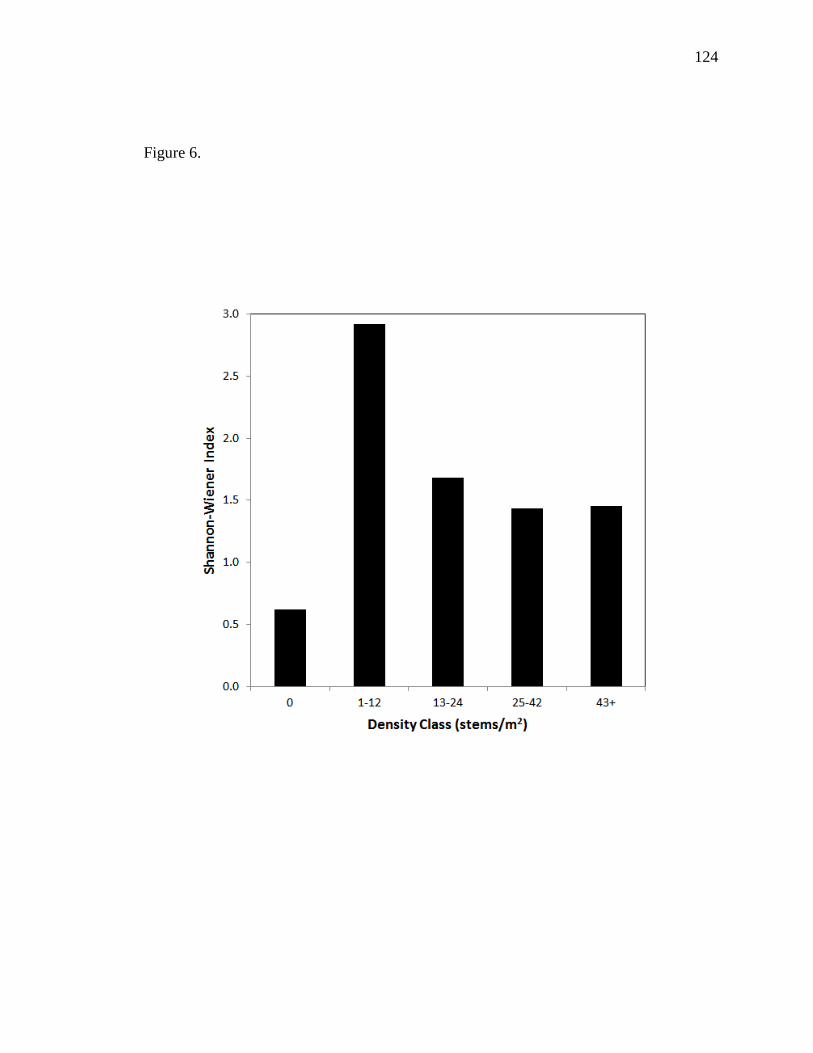
124
Figure 6.
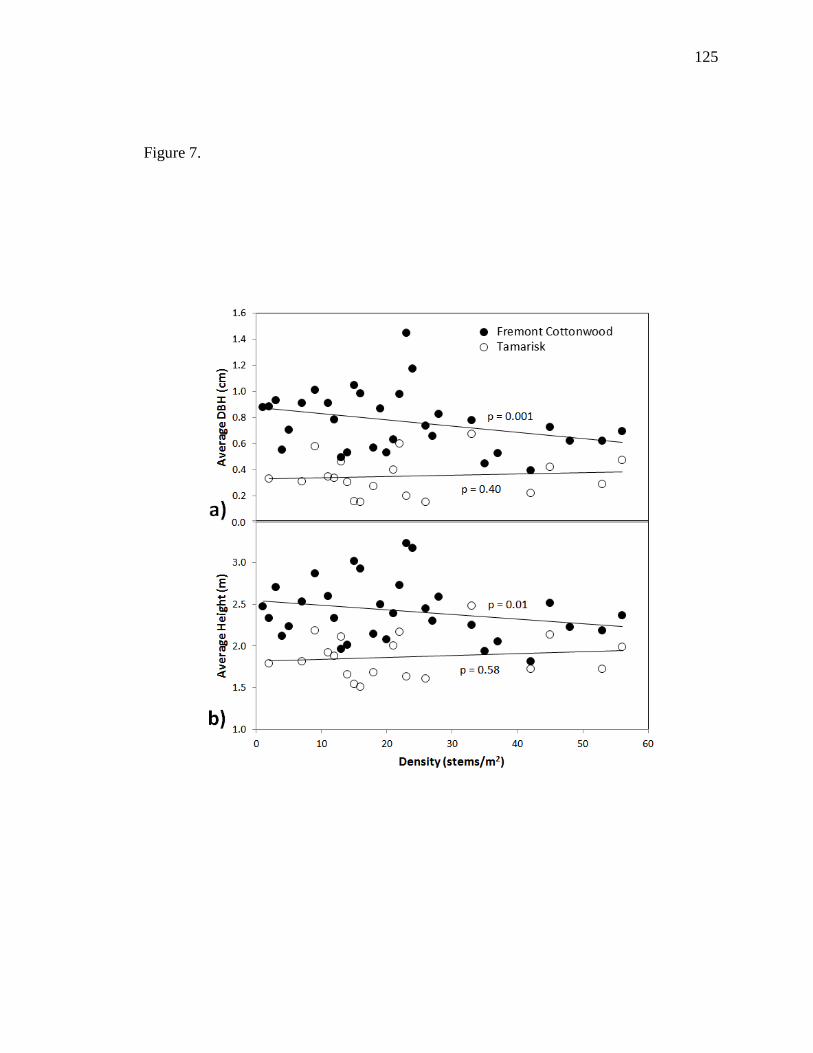
125
Figure 7.
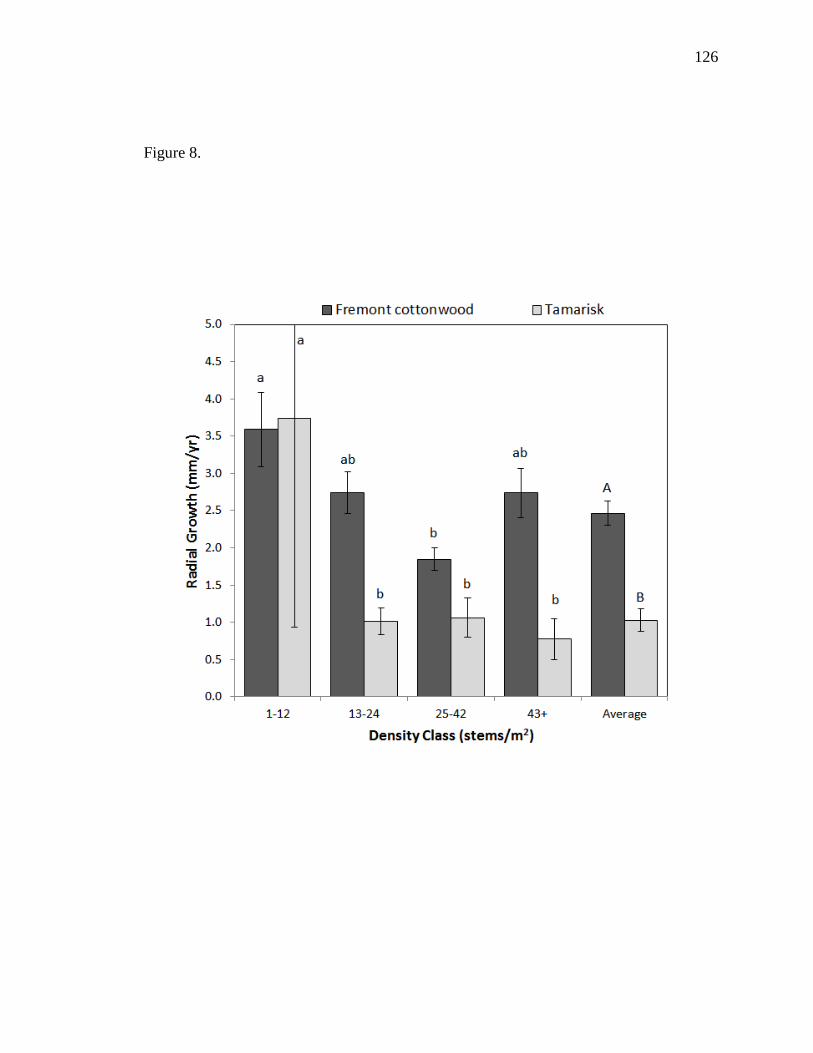
126
Figure 8.
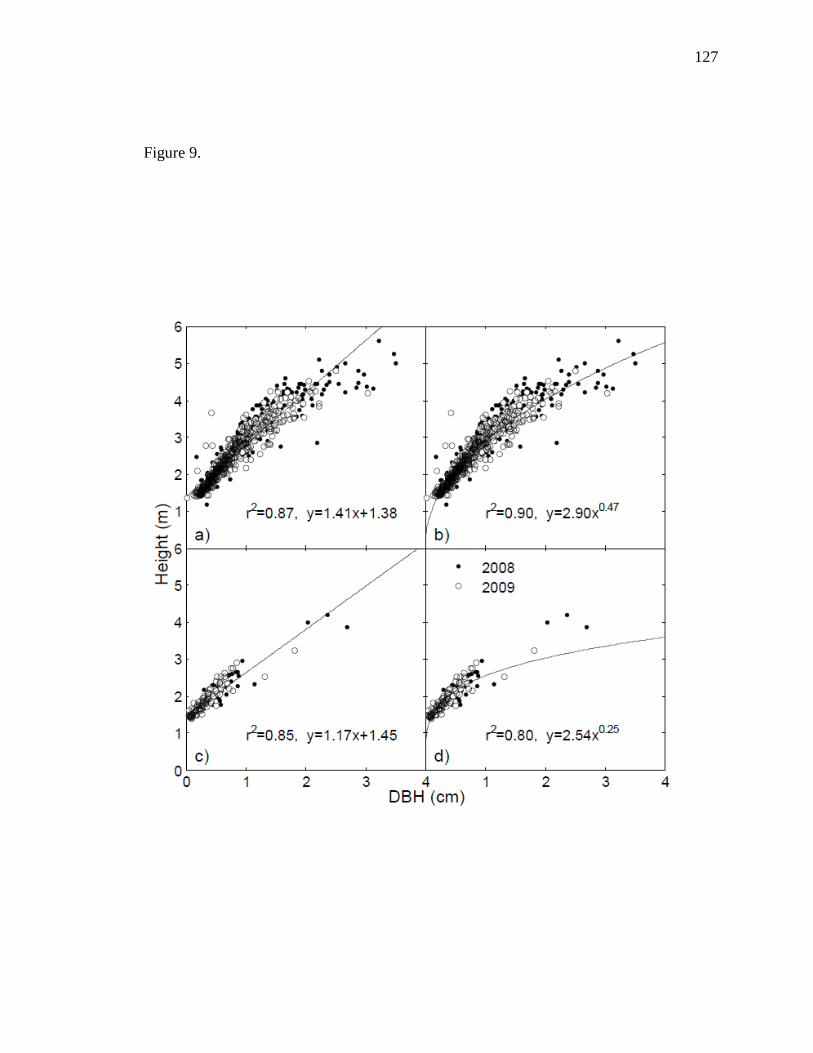
127
Figure 9.
128
APPENDIX C: USING REMOTE SENSING AND EDDY COVARIANCE DATA TO
DETERMINE EVAPOTRANSPIRATION ACROSS A WATER-LIMITATION
GRADIENT
Daniel P. Bunting
1, Shirley A. Kurc
1, Edward P. Glenn
2, Pamela L. Nagler
3, and Russell
L. Scott4
Submitted to the Journal of Water Resources Research
1 School of Natural Resources and the Environment, University of Arizona, Tucson,
Arizona
2 Soil, Water, and Environmental Science, University of Arizona, Tucson, Arizona
3 US Geological Survey, Southwest Biological Science Center, Sonoran Desert Research
Station, University of Arizona, Tucson, Arizona
4 Southwest Watershed Research Center, USDA-ARS, Tucson, Arizona
Daniel P. Bunting. School of Natural Resources and the Environment, University of
Arizona, 304A Biological Sciences East, 1311 E. 4th
St, Tucson, AZ 85721, USA,
Shirley A. Kurc. School of Natural Resources and the Environment, University of
Arizona, 209 Biological Sciences East, P.O. Box 210043, Tucson, AZ 85721, USA,
Edward P. Glenn. Soil, Water, and Environmental Science, University of Arizona,
Environmental Research Laboratory, 2601 E. Airport Drive, Tucson, AZ 85706,
USA, [email protected]
Pamela L. Nagler. U.S. Geological Survey. Southwest Biological Science Center,
Sonoran Desert Research Station 125 Biological Sciences East, University of
Arizona, Tucson, AZ 85721, USA, [email protected]
Russell L. Scott. Southwest Watershed Research Center, USDA-Agricultural Research
Service, 2000 E. Allen Road, Tucson, AZ 85719, USA, [email protected]

129
Abstract
A responsibility for water resource managers is to ensure long-term water
supplies for increasing human populations. Evapotranspiration (ET) is an important
component of the water balance and accurate estimates are important to quantify how
much water can be safely allocated for human use while supporting environmental needs.
ET measurements are often representative of small (<1 km) spatial scales, but scaling up
to basins has been problematic due to spatial and temporal variability. Satellite data,
however, provide spatially distributed remote sensing products that account for seasonal
climate and vegetation variability. We used Moderate Resolution Imaging
Spectroradiometer (MODIS) products [i.e., Enhanced Vegetation Index (EVI) and
nighttime land surface temperatures (LSTn)] to create an empirical ET model calibrated
using measured ET from three riparian-influenced and two upland, water-limited flux
tower sites. Results showed that combining all sites introduced systematic bias, so we
developed separate models to estimate riparian and upland ET. While EVI and LSTn
were the main drivers for ET in riparian sites, precipitation replaced LSTn as the
secondary driver of ET in upland sites. Riparian ET was successfully modeled using an
inverse exponential approach (r2 = 0.92) while upland ET was adequately modeled using
a multiple linear regression approach (r2 = 0.77). These models can be used in
combination to estimate total annual ET at basin scales provided that each region is
classified appropriately and precipitation data is available. This approach improves

130
accuracy of ET estimates at large scales while accounting for daily to seasonal
fluctuations in ET.
Key Words: enhanced vegetation index, flux tower, land surface temperature, MODIS,
riparian, semiarid

131
1.0 Introduction
A common goal for water resource managers in the southwestern United States,
and arid and semiarid regions worldwide, is to ensure long-term water supplies for
increasing human populations. In these regions, evapotranspiration (ET) is an important
component of the water budget [Nichols, 1994; Dahm et al., 2002; Glenn et al., 2010]
and has large implications for water resources management [Jackson et al., 2001;
Newman et al., 2006]. As a result, accurate ET estimates are important to quantify how
much water can be allocated safely for human use while supporting environmental needs
[Hansen and Gorbach, 1997; Congalton et al., 1998; Commission for Environmental
Cooperation, 1999; U.S. Department of Interior, 2002]. Over the last 15 years, much
attention has been given to estimating ET along natural riparian corridors, across
agricultural fields, within disturbed floodplains, or a mixture of each. Although riparian
ET has been well-studied, most ET measurements are made at local scales. Sound water
resource management, however, requires accurate ET estimates at watershed and basin
scales, which have been difficult to obtain due to heterogeneous patterns of land cover as
well as mixed riparian and upland vegetation [McDonnell et al., 2007; Scott et al., 2008].
Spatial variability in such environmental factors as precipitation and below ground water
availability (e.g., groundwater, soil moisture) further complicates the ability to scale ET.
An understanding of water resources and the hydrologic cycling of these
resources within any given system is necessary to effectively scale ET. Determining
actual rates of water consumption by riparian vegetation requires knowledge of
132
interspecies differences in water use, as well as broad-scale estimates over large river
sections [Nagler et al., 2005a]. Bowen ratio and eddy covariance flux towers are now
often used to monitor ET for representative riparian plant associations on southwestern
rivers [e.g., Devitt et al., 1998; Goodrich et al., 2000; Coonrod and McDonnell, 2001;
Cleverly et al., 2002; Dahm et al., 2002; DeMeo et al., 2003; Scott et al., 2004]. At
scales of a hundreds to thousands of square meters, the eddy covariance technique has
been regarded as the best and most reliable method to estimate ET [Rana and Katerji,
2000; Drexel et al., 2004], and many studies have confirmed reasonable estimates of
evaporation using this approach [Barr et al., 2000; Wilson et al., 2001; Schume et al.,
2005; Kosugi and Katsuyama, 2007].
However, the eddy covariance method can only provide measurements
representative of a particular type of vegetation cover when there is an extensive, uniform
area of that vegetation immediately upwind of the tower [Unland et al., 1998; Baldocchi,
2003]. Therefore, directly extrapolating patch-scale ET to larger landscapes may lead to
biased regional estimates because towers may not adequately represent larger areas
[Wylie et al., 2003]. Wylie et al. [2003] recommended that site-specific tower data could
be used in combination with remote sensing and other data sources to develop statistical
algorithms for extrapolating tower data to regional scales. Due to the difficulties
encountered with varying spatial and temporal scales, the use of satellite-based remote
sensing is perhaps the only feasible means of estimating ET over wide areas of mixed
landscape types [Glenn et al., 2010], owing to the fact that it is the only technology that
can provide representative parameters such as radiometric surface temperature, albedo,

133
and vegetation index in a globally consistent and economically feasible manner
[Choudhury, 1989; Kustas and Norman, 1996].
Physically-based remote sensing models using thermal near infrared (NIR) bands
are available for estimating ET at large scales [reviewed in Kalma et al., 2008; (e.g.,
SEBAL, Bastiaanssen et al., 1998; METRIC, Allen et al., 2007; and ReSET, Elhaddad
and Garcia, 2008)]. These methods compute latent heat as a residual of the surface
energy balance and are often preferred because they measure physical properties of the
surface which allow ET estimations across different landscapes on a pixel-by-pixel basis
[Overgaard et al., 2006]. This approach does not require calibration using ground
measurements of ET, but does require micrometeorological data and high spatial
resolution at the cost of low temporal resolution. These methods are often more
appropriate for detecting stress at the level of individual agricultural fields [Nagler et al.,
2009]. Furthermore, these methods may produce erroneous ET estimates in natural
ecosystems because they can falsely assume a constant evaporative fraction when scaling
up instantaneous measurements of ET from a single satellite over pass [Nagler et al.,
2009; Glenn et al., 2010].
Another promising approach, however, has been to find empirical relationships
between flux tower ET and remotely sensed data such as vegetation indices (VIs).
Despite apparent obstacles, a number of successful VI methods have been developed to
estimate ET in a variety of semiarid landscape types across the globe including
agricultural districts [Kim and Hogue, 2008; Gonzalez-Dugo et al., 2009], riparian zones
and desert phreatophyte communities [Guerschman et al., 2009; Nagler et al,. 2005a, b,
134
2009; Groeneveld et al., 2007; Scott et al., 2008; Barz et al., 2009; Murray et al., 2009],
grasslands and savannahs [Cleugh et al., 2007; Alfieri et al., 2009; Guerschman et al.,
2009; Nagler et al., 2009], and water-limited shrublands [Nagler et al., 2007]. Empirical
VI approaches may be more appropriate when estimating highly variable daily and
seasonal ET because flux tower networks record time-series data at high temporal
resolution (i.e., every half-hour) while satellite data provide high temporal resolution and
spatially distributed products that account for seasonal climate and vegetation variability.
A statistical algorithm can then be developed to scale ground measurements of ET to
wide areas (> 1 km) using remote sensing.
As an example, Nagler et al. [2005a] developed a single, empirical equation for
estimating ET across multiple river systems. River-reach ET was estimated by
correlating flux tower ET to the enhanced vegetation index (EVI) acquired from the
Moderate Resolution Imaging Spectroradiometer (MODIS) and maximum daily air
temperature measured from flux tower sites. In a similar study, Scott et al. [2008]
developed an empirical ET model using EVI and nighttime land surface temperature
(LSTn) acquired solely from MODIS products. Such ET models can be used in practical
applications such as quantifying water budgets or determining groundwater use in a
riparian zone or catchment [Scott et al., 2008].
Typical approaches for applying empirical riparian ET models require the desired
river reach to be extracted and digitized. Then, an algorithm can be applied to this area
of interest assuming that the inputs to the ET model can be attributed to each pixel as
necessary. As a potential drawback, the digital images used for these types of analyses

135
inherently include pixels representing upland vegetation or bare soil along with pixels of
common riparian vegetation such as large cottonwood/willow associations or mixed
mesquite woodlands. Models such as the one developed by Scott et al. [2008] are
calibrated using eddy covariance towers located in close proximity to the San Pedro
River and influenced by relatively shallow groundwater (≤ 10-m depth). In practice, the
model generally over-predicts ET when the region of interest consists of mosaic
vegetation (e.g., mixed riparian and upland vegetation) [Scott, pers. comm. 2011]. This
error is likely caused by the presence of pixels characteristic of upland vegetation and/or
bare soil. The algorithm applied to these upland regions is the same as the algorithm
calibrated with and used for adjacent riparian pixels. As a result, overall estimates of
water lost at the catchment or river-reach scale are over-estimated as a function of upland
area or bare soil present in the scene. For this reason, calibrating empirical ET models
such as these with additional data from adjacent, upland landscape types may improve ET
estimates.
Our objective is to develop an empirical ET model to improve basin-scale
estimates of ET in semiarid regions characterized by mosaic vegetation. By re-
calibrating an existing ET model with upland sites and riparian sites spanning a water-
limitation gradient, we aim to produce a model useful for management decisions. To do
this we will incorporate data from two water-limited flux tower sites along with three
riparian sites influenced by shallow groundwater. We will examine whether these upland
sites capture the difference in EVI signal and thus the variation in daily and seasonal ET
observed between upland and riparian sites. Finally, we will evaluate which variables

136
explain the greatest variation in actual ET at each site and investigate how the inclusion
of inputs that address the dependency of upland vegetation on soil moisture, such as
precipitation, affect model predictions.
2.0 Methods
2.1 Study Sites
Five flux tower sites were used for this research including three riparian-
influenced (i.e., all sites have access to shallow groundwater during at least part of any
given year) sites (CM, LM, LS) and two water-limited (i.e., neither site has access to
groundwater reserves) upland sites (KG, SR) in southeastern Arizona, US (Table 1,
Figure 1). These regions extend from the Santa Cruz River Watershed in the west to the
San Pedro River Watershed in the east. All sites are considered to be semiarid with cool
winters and warm summers where rainfall varies spatially and temporally with mean
annual precipitation (MAP) ranging from 250 mm to 390 mm [McClaran et al., 2002;
Scott et al., 2008; Nagler et al., 2007]. Precipitation is characterized by bimodal patterns
in which 50-60% of the total annual rainfall arrives during the summer (July-Sept) as part
of the North American Monsoon [Adams and Comrie, 1997]. MAP was documented at
each of the five sites during the study period (2003-2007; Table 1).
The three riparian sites are located in the San Pedro River Natural Conservation
Area (SPRNCA) within the San Pedro Basin and are influenced by relatively shallow
groundwater supported by intermittent San Pedro River stream flow. Soils consist of

137
sandy loam alluvium with interspersed layers of gravel and clayey materials (Scott et al.,
2008). The Charleston Mesquite Woodland riparian site (CM, N 31.6636 W -110.1778)
is adjacent to the main river channel and had a mean annual temperature of 16.8 ⁰C
during the study period. CM is a dense mesquite woodland dominated by velvet
mesquite (Prosopis velutina) with an understory consisting of perennial sacaton
bunchgrass (Sporobolus airoides), greythorn (Zizyphus obtusifolia), and various summer
annuals. The Lewis Springs Mesquite riparian site (LM, N 31.5658 W -110.1344) is
located within one kilometer of the main channel and had a mean annual temperature of
16.2 ⁰C during the study period. LM is a mesquite shrubland with sparsely distributed P.
velutina, scattered patches of S. airoides, and other various shrubs within the tree
interspaces. The Lewis Springs Sacaton riparian site (LS, N 31.5615 W -110.1403) is
adjacent to the main river channel and had a mean annual temperature of 15.4 ⁰C during
the study period. Dominant vegetation includes dense S. airoides with occasional
summer annuals.
The two upland sites include a grassland and a mesquite savannah. The Kendall
Grassland upland site (KG, N 31.7365 W -109.9419) lies in the northwest portion of the
Walnut Gulch Experimental Watershed and is located over 20 km from the San Pedro
River. The mean annual temperature during the study period was 17.4 ⁰C. Surface soils
are generally very gravelly with sandy to fine sandy loams with some silty clay to clay
loams at depth. Historically, vegetation consisted of diverse patches of native
bunchgrasses including black grama (Bouteloua eriopoda), hairy grama (Bouteloua
hirsuta), curly mesquite grass (Hilaria belangeri), and hook three-awn (Aristida
138
hamulosa). Following the peak of the drought (2003-2006), the dominant vegetation has
been replaced by non-native Lehmann love grass (Eragrostis lehmanniana). The Santa
Rita Mesquite Savannah upland site (SR, N 31.8214 W -110.8661) is located in the Santa
Rita Experimental Range approximately 65 km west of the San Pedro River and 45 km
south of Tucson, AZ. The mean annual temperature during the study period was 19.2 ⁰C
and dominant vegetation includes P. velutina and S. airoides.
2.2 Eddy Covariance Flux Data
The eddy covariance technique was used to estimate daily ET [Moncrieff et al.,
2000]. At each of our sites, typical instruments included three-dimensional sonic
anemometers to measure wind speed and infrared gas analyzers to measure CO2 and H2O
fluxes. Additional instrumentation included net radiometers, ground heat flux plates, and
tipping bucket rain gauges. Methods specific to the San Pedro sites can be found in Scott
et al. [2004, 2008] while the upland sites are described in Scott et al. [2009] and Scott
[2010b].
Daily ET values were estimated by averaging the original half-hourly flux
tower ET measurements. A 16-day average was then computed to match 16-day
composites offered by remote sensing products. Likewise, precipitation was summed for
each 16-day window to match remote sensing products. Due to the lag time associated
with processing and quality-assuring flux tower data, eddy flux data used for this research
included five years of riparian site data (2003-2007) and four years of upland site data
(2004-2007).

139
2.3 Remotely Sensed Data
Pre-processed MODIS products are available through the Oak Ridge National
Laboratory Distributed Active Archive Center (ORNL-DAAC;
http://daac.ornl.gov/MODIS/). Vegetation indices (MOD13Q1 products) were obtained
as 16-day composites with 250-m resolution and land surface temperatures (LSTs,
MOD11A2 products) were obtained as 8-day composites with 1000-m resolution. Single
pixels containing the coordinates for each tower were extracted to match the time period
available from all flux tower sites.
ET models using pre-processed MODIS data acquired from the ORNL-DAAC
have a temporal resolution limited by the 16-day VI products. As such, two 8-day LST
products were averaged to match each 16-day window offered by VI products. The
MOD13Q1 products include calculations of both NDVI and EVI while the MOD11A2
products include measurements of both daytime (LSTd) and LSTn. Coefficients of
determination (r2) were used to determine which MODIS variables explained the most
variation in measured ET, and thus which variables were chosen as inputs for the
empirical ET model.
2.4 ET Models
While many empirical ET models have been created [see Nagler et al., 2005a,
2005b, 2007; Murray et al., 2009], the Scott et al. [2008] model was selected for this
study because inputs can be acquired solely from remote sensing products. This makes it

140
a valuable approach for researchers and managers limited by data acquisition. The
empirical ET model introduced in Scott et al. [2008] is:
ET = a(1-e-bEVI
) + c(edTs
) + e (1)
where a, b, c, d, and e are calibration coefficients, and Ts is LSTn.
This ET model was calibrated using all five study sites combined spanning from
2003-2006. EVI and LSTn were the sole inputs and the model was calibrated using
measured ET from the five flux tower sites. The surface fitting tool in MATLAB (The
Mathworks, Inc., Natick, MA) was used to identify parameters. The new equation with
calibration coefficients took the form:
ET = -14.45(1-e-0.622EVI
) + 0.197(e0.089Ts
) – 1.028 (2)
To validate the model, Equation (2) (r2 = 0.78, RMSE = 0.57) was used to
compute ET predictions for 2007 at each of the five sites. Predicted ET was then
compared to measured ET in 2007. Root mean square error (RMSE) was used to
compare model performance for predicting ET at each study site individually. The
location of predicted ET values with respect to the 1:1 line gave insight to whether a
particular site tended to under- or over-predict ET.
3.0 Results

141
3.1 Estimates of catchment ET using combined approach
Regression analyses were conducted to compare relationships of ET among
selected variables across each site as well as each year of the study period (Table 2).
Excluding the KG site, EVI explained more variation in ET than NDVI at each site.
Similarly, MODIS LSTn was a stronger predictor of ET than average daily temperature
(Tavg) or MODIS LSTd at all sites. These findings were consistent with Scott et al. [2008]
and justified the use of Equation (1) to develop the parameters given in Equation (2).
Equation (2) (r2 = 0.78, RMSE = 0.57) successfully predicted 2007 ET (RMSE = 0.62);
however, values among each site were not evenly distributed along the 1:1 line,
suggesting a bias (Figure 2). Upland sites with the majority of values observed above the
1:1 line tend to over-predict ET, while riparian sites with the majority of values below the
1:1 line tend to under-predict ET when all sites are combined (Figure 2). Plotting
residuals shows an even distribution when all sites are combined; however, when
examining residuals by vegetation association, it is evident that riparian sites have a
positive skew while upland sites have a negative skew. If this model was used in
practice, estimated ET along a river reach would be systematically under- or over-
estimated depending on the dominant vegetation association and plant water status in the
scene.
3.2 Influence of upland vegetation on estimates of catchment ET

142
Actual ET, examined qualitatively with precipitation, showed a much different
trend at riparian sites versus upland sites (Figure 3). Riparian site ET often more than
doubled ET values observed at upland sites and riparian site ET was less affected by
individual rainfall events whereas upland site ET had noticeable spikes in response to
rainfall events. In fact, coefficients of determination (r2) showed that EVI and LSTn were
the strongest predictors of ET for all three riparian sites, but EVI and precipitation
explained most of the variation in ET at the two upland sites (Table 2). These findings
suggest that Equation (1) is better suited for predicting riparian ET. Furthermore,
calibrating Equation (1) with both riparian and upland sites negatively impacts the
model‘s ability to accurately estimate basin-scale ET. Because ET between riparian and
upland sites was differentially affected by precipitation, riparian and upland sites were
separated in effort to improve ET predictions within each association.
3.3 Improving ET models for estimating riparian ET
Equation (1) takes the form of an additive and inverse exponential function to
account for lower and upper ET thresholds [see Nagler et al., 2005; Scott et al., 2008].
This equation assumes that riparian ET approaches zero when winter LSTn and EVI
values reach a minimum, while summer ET reaches full potential, stabilizing when LSTn
and EVI reach optimal levels. Theoretically, ET should be dependent on temperature
(e.g., LST) multiplied by a scaling factor to account for the amount of light intercepted by
the canopy (e.g., EVI) [Nagler et al., 2005]. A multiplicative approach is more realistic
for estimating ET at riparian sites because it accounts for an interaction between LSTn
143
and EVI rather than having additive terms. Furthermore, this approach is analogous to
traditional crop coefficient approaches that multiply potential ET of a reference crop by a
crop coefficient. Replacing crop coefficients with VIs has been explored on a theoretical
basis because VIs give a measure of the actual state of a crop canopy, instead of a crop
coefficient produced by expert opinion [Choudhary et al., 1994; Glenn et al., 2010]. As a
result, we altered Equation (1) to take a multiplicative form in effort to further improve
riparian ET predictions specifically:
ET = a(1-e-bEVI*
)*(ecTs
) + d (3)
Equation (3) also simplifies the model from five to four parameters and scales EVI
between averaged values acquired from bare soil sites (i.e., 0.059) to represent EVImin
and fully vegetated sites (i.e., 0.704) to represent EVImax. The three bare soil sites
included an area under construction and two mine tailings and the three fully vegetated
sites included a golf course, a fully vegetated park, and a grass lawn, all located within
the study region. The following equation was used to scale EVI:
EVI* = 1 – (EVImax - EVI)/(EVImax – EVImin) (4)
Scaled EVI (EVI*) allows ET to reach a minimum (i.e., the intercept) when EVI
*
approaches 0.0 and allows ET to reach full potential when EVI* approaches 1.0.

144
Equation (3) was calibrated with all sites combined, riparian sites only, and upland sites
only to obtain and compare three new empirical ET models, respectively:
ET = 2.587(1-e-1.218EVI*
) * (e0.064LST
) + 0.016 (5)
ET = 1.109(1-e-3.464EVI*
) * (e0.075LST
) + 0.062 (6)
ET = 294.5(1-e-0.001EVI*
) * (e0.164LST
) + 0.318 (7)
Although Equation (5) (r2=0.85, RMSE = 0.47) produced favorable 2007 ET predictions
(RMSE 0.63) and was an improvement from Equation (2) (r2=0.78, RMSE = 0.57), the
model still produced bias and skewed residuals (Figure 4). Equation (6) (r2=0.92, RMSE
= 0.37), as expected, produced the best 2007 riparian ET predictions (RMSE = 0.40) and
values among each riparian site were evenly distributed along the 1:1 line (Figure 5a),
suggesting that the model is unbiased. Furthermore, plotted residuals were randomly
dispersed, validating this approach for estimating riparian ET. Not surprisingly, Equation
(7) (r2=0.67, RMSE = 0.37), calibrated with upland sites only, did not predict 2007
upland ET as well (RMSE = 0.46), suggesting that this empirical model may not be the
most appropriate for estimating ET at water-limited sites (Figure 5b).
3.4 Accounting for rainfall when estimating upland ET
145
Equation (2) produced over-predictions of ET in the upland sites and prompted an
analysis of ET relationships with other variables. Because changes in ET in arid and
semiarid ecosystems are often coupled to growing season moisture inputs that wet upper
soil layers [Scott et al., 2006b; Williams et al., 2006], it was not surprising that
precipitation explained more variation of ET than LSTn at the upland sites. Models in the
form of Equation (1) and Equation (3) are sensitive to temperature and greenness but do
not sufficiently account for near surface soil moisture. However, if ET is strongly
coupled to pulses of moisture in upland ecosystems, then ET models need to have a
variable that explains how soil moisture affects ET. Therefore, a new model was created
in effort to improve upland site ET specifically by using a multiple linear regression
approach with precipitation replacing LSTn as a new model input:
ET = aEVI + bPPT + c (8)
where PPT [mm -16 day
] is precipitation summed over each 16-day window at each flux
tower. Equation (8) was calibrated with all sites combined, riparian sites only, and
upland sites only to obtain three new empirical ET models, respectively:
ET = 12.00EVI + 0.013PPT – 0.956 (9)
ET = 12.43EVI + 0.011PPT – 0.900 (10)

146
ET = 6.93EVI + 0.017PPT – 0.507 (11)
These multiple linear regression models produced favorable r2 values for each case
(Table 3). Equation (9) predicted overall 2007 ET well (RMSE = 0.58, Figure 6), but at
similar performance to Equation (2) (RMSE = 0.62) and Equation (5) (RMSE = 0.63,
Table 4). This model also shows similar bias in which upland sites tend to over-predict
and riparian sites tend to under-predict 2007 ET. Furthermore, unevenly dispersed
residuals among each site suggest that combining all sites together does not create a
robust multiple regression model. Equation (10) did not improve 2007 riparian ET
predictions (RMSE = 0.60, Figure 7a) compared to Equation (6) (RMSE = 0.40),
suggesting that a multiple linear regression model does not improve riparian ET at these
sites. Equation (11), as expected, greatly improved 2007 upland site ET predictions
(RMSE = 0.23, Figure 7b) compared to Equation (7) (RMSE = 0.46). Equation (11) also
produced evenly distributed values along the 1:1 line and residuals were not skewed.
Furthermore, this approach reduced RMSE at both upland sites suggesting that using
multiple linear regression provides the best estimates of ET at water-limited sites.
Statistics were tabulated for all empirical ET models after parameterization (Table
3). The highest r2 was 0.92 which shows that models in the form of Equation (1) and
Equation (3) calibrated by riparian sites only are the best for estimating riparian ET.
Upland site ET, on the other hand, is best estimated by using multiple linear regression
with precipitation as an input calibrated with upland sites only (r2 = 0.77). RMSE for all
validations (i.e., 2007 ET model predictions vs. 2007 measured ET) were broken down
147
among sites (CM, LM, LS, KG, SR) and vegetation associations (riparian, upland) to
observe site-specific trends (Table 4). Smaller RMSE values show the best riparian site
(CM, LM, LS) ET predictions were made using a model in the form of Equation (3)
while upland site (KG, SR) ET predictions were consistently better using a model in the
form of Equation (8).
4.0 Discussion
4.1 Implications of including upland vegetation in current empirical models to estimate
catchment-scale ET
Our modified empirical models that combine riparian and upland vegetation
provide reasonable estimates of overall ET (r2 = 0.78, 0.85, 0.74) and perform similar to
other empirical models in which VIs were used in combination with temperature inputs to
estimate ET in riparian zones [Nagler et al., 2005a (r2 = 0.82); Nagler et al., 2005b (r
2 =
0.76); Nagler et al., 2009 (r2 = 0.80); and Murray et al., 2009 (r
2 = 0.80)]. Our model
represented by Equation (6) is a good predictor of riparian ET, specifically, because
meteorological (e.g., temperature) and vegetation conditions (e.g., leaf area) control ET
when soil moisture is not limiting [Shuttleworth, 1991]. Our riparian sites are composed
of phreatophytic vegetation with extensive root systems that access groundwater reserves.
Phreatophytic vegetation in this region is known to derive 80-100% of their transpiration
water from groundwater and is minimally impacted by monsoon rain events [Snyder and
Williams, 2000; Horton et al., 2001; Yepez et al., 2003]. This is supported by other

148
studies in the region where pre-monsoon physiological responses of phreatophytic
vegetation such as transpiration did not change significantly when near surface soil
moisture increased due to monsoon rainfall events during the growing season [Scott et
al., 2003; Potts et al., 2006]. Because vegetation is not limited by soil moisture at these
sites, the amount of available energy becomes the limiting factor driving ET during the
growing season [Gazal, 2006; Williams et al., 2006; Moore and Heilman, 2011].
In contrast, upland vegetation often depends on pulses of water for productivity
[Noy-Meir, 1973; Sala and Lauenroth, 1982; Scott et al., 2000; Huxman et al., 2004;
Potts et al., 2006]. ET in arid and semiarid regions dominated by upland vegetation is
not limited by available energy, but by near-surface soil moisture supplied by seasonal
rainfall [Kurc and Small, 2004; Serrat-Capdevila et al., 2011; Moore and Heilman,
2011]. In fact, ET in upland ecosystems has been shown to rapidly increase following
rainfall events [Sala and Lauenroth, 1982; Kurc and Small, 2004; Scott et al., 2006b],
which in part explains how >90% of precipitation in semiarid regions can be returned to
the atmosphere via ET [Wilcox et al., 2003]. This is not accounted for, however, in our
modified empirical models represented by Equation (1) and (3) because ET is driven by
increased temperature and greenness, independent of moisture. Consequently, these
models over-predict overall ET along river catchments where upland vegetation
encompasses the majority of pixels in the scene. While pixels characterized by upland
vegetation may have much smaller EVI values, the temperatures are much higher than
adjacent riparian-dominated pixels which may in part be responsible for biased
predictions. Therefore, while models incorporating VIs and temperature may be

149
appropriate for riparian-dominated regions, they do not properly account for the main
drivers of ET in regions dominated by upland vegetation.
We conclude that our modified empirical models combining riparian and upland
sites will not be able to consistently or accurately estimate ET along river reaches or
basins, especially considering that the amount of upland vegetation varies greatly from
catchment to catchment and will continue to change due to desertification in semiarid
systems [Kerley and Whitford, 2000, Archer 1994]. Accounting for shifts in upland
vegetation are exceptionally important for watershed management because these shifts
can alter hydrology at both local and regional scales [Wilcox, 2002; Huxman et al.; 2005].
ET models that cannot effectively incorporate both riparian-influenced and water-limited
upland vegetation are not adequate for making appropriate basin-scale ET estimates.
4.2 Incorporating the sensitivity of upland sites to pulses of moisture in empirical models
ET is limited by soil moisture in arid and semiarid environments when
precipitation is much less than potential ET [Noy-Meir, 1973; Rodriguez-Iturbe, 2000].
Our research shows that ET in our upland sites is highly responsive to rainfall events and
this is supported by relatively high coefficients of determination, especially when
compared to riparian sites (Table 2). Other studies have documented rapid ET response
to rainfall events in upland vegetation and have indicated that near-surface soil moisture
(0-5 cm) from these events is the primary source of water for ET during the summer
monsoon [Sala and Lauenroth, 1982; Kurc and Small, 2004; Scott et al., 2006b].
150
Empirical ET models for upland ecosystems without access to groundwater must account
for these rainfall events that provide plant available moisture at the surface.
As a first iteration, we developed an empirical model that incorporates
precipitation as an input for estimating upland ET specifically. While EVI, as an
indicator of greenness, captures the variation and contribution of transpiration to total ET,
we make the assumption that precipitation accounts for rapid evaporation following
rainfall events. To do this, we acquired precipitation data from tipping-bucket rainfall
gauges installed at each upland flux tower site. A multiple linear regression approach
was then used to create an empirical ET model assuming that EVI can represent total ET
when precipitation is not present and that precipitation is additive when present. We
eliminated the energy input because LSTn did not improve the predictive power of the
model. This multiple regression approach represented by Equation (11) predicted upland
ET adequately (r2 = 0.77) with similar performance to other studies [Nagler et al., 2007
(r2 = 0.74)].
This approach can estimate water lost from upland vegetation along river reaches
where weather stations or rain gauges are available. When precipitation data is not
available, however, the ability to accurately estimate ET is not likely unless rainfall can
be interpolated from nearby rainfall gauges or forecasted using a suitable method or
model for predicting rainfall at the site of interest. Future advancements and accessibility
of satellite-based remote sensing will improve models for estimating basin scale ET. The
National Polar-orbiting Operational Environmental Satellite System (NPOESS) and Soil
Moisture Active-Passive (SMAP) missions aim to improve weather forecasting and will

151
likely improve model predictability. While no remote sensing products are currently
available to measure soil moisture, SMAP, scheduled to launch in 2014, will measure
near-surface soil moisture at high spatial and temporal resolution. The capabilities of
SMAP or other remotely-sensed soil moisture products will improve ET models by
understanding how pulses of moisture from rainfall affect ET across different regions.
4.3 Integrating upland and riparian empirical models to estimate catchment-scale ET
While a single predictive equation is desired to estimate ET at basin scales, this
research suggests that differences in plant function (e.g., the ability or inability to access
and use groundwater) and ecohydrology introduce complications that need to be
addressed to improve ET estimates. However, an approach using multiple models could
estimate ET along riparian reaches if suitable vegetation maps were available or created.
Independent ET models appropriate for each vegetation association could then be applied
to each land surface classification. Unland et al. [1998], for example, estimated ET from
a riparian system in a semiarid environment by classifying five different surfaces and
attributing multiple approaches to best estimate ET for each surface. A similar approach
using multiple empirical ET models to represent the different riparian and upland
vegetation classified along a river reach could be used to improve overall ET estimates
along the entire reach or catchment.
This approach requires adequate flux tower data, both spatially and temporally, to
calibrate models for each vegetation association and assumes that classifying vegetation
along a mosaic corridor into riparian-influenced versus upland, water-limited vegetation
152
is feasible and sufficient for documenting all vegetation within the river reach. By
combining functional groups, this method follows the assumption observed in many
studies that riparian vegetation such as cottonwood, willow, tamarisk, and mesquite have
similar transpiration rates on a leaf area basis and therefore could be combined into one
riparian class [Anderson, 1982; Busch and Smith, 1995; Sala et al., 1996, Glenn et al.,
1998; Nagler et al., 2008]. Accuracy would be improved if riparian classes were broken
into species-specific communities (i.e. cottonwood/willow, tamarisk, mesquite), but
would require additional flux towers to provide patch-specific or monoculture ET data for
calibration as well as remote sensing products with high enough spatial resolution to
discriminate between species. If necessary, a combination using empirical approaches
and other methods (e.g., sap flux, crop coefficient approaches, etc.) for each riparian class
could result in the most appropriate estimates of river reach ET.
4.4 Water resource applications of empirical ET models
Seasonal riparian ET is difficult to estimate over large areas [Nagler et al., 2005;
Devitt et al., 2010], but is often a significant factor in the basin water balance in semiarid
regions [Goodrich et al., 2000; Maddock et al., 2000; Dahm et al., 2002]. Furthermore,
river managers need accurate estimates of consumptive water use (ET) by crops and
riparian species spanning large areas to manage water supplies for human use, primarily
agriculture, and environmental restoration [USBOR, 1997; LCR-MSCP, 2004; Scott et
al., 2006c; Trezza, 2006; Murray et al., 2009]. Improved estimates of riparian ET and its
seasonal distribution are also necessary to improve regional groundwater models for

153
near-term management tools [Goodrich et al., 2000]. Empirical ET models are valuable
for their ability to use VIs over a wide range of temporal and spatial resolutions for
scaling local or patch-scale ET measurements to river-reach and catchment scales [Glenn
et al., 2010]. Using a combination of multiple flux towers and remote sensing products
can produce models that account for temporal and spatial heterogeneity in vegetation
along riparian zones. Growing availability and accessibility of data from eddy flux
networks and improvements in remote sensing products will further increase spatial and
temporal resolutions needed to produce more accurate and near, real-time estimates of ET
in the future.
A degree of uncertainty, however, is inherent when modeling river-reach to basin-
scale ET due to errors propagating through subsequent steps [Devitt et al.; 2010]. Due to
the empirical nature of the approach represented here, we caution that this method
requires model re-calibration using accurate ground measurements of ET representing the
vegetation captured in the satellite products. This study used free MODIS products to
avoid pre-processing raw satellite data. While MODIS data is available almost daily, the
available ORNL-DAAC composites used in this research reduce the temporal resolution
to 8 or 16-day products. ET models can be improved by using remotely sensed products
with better temporal resolution. Likewise, remote sensing products with finer spatial
resolution (e.g., Landsat, 15 to 30 m) would improve empirical methods of modeling ET,
but may sacrifice the temporal resolution necessary to account for seasonal fluctuations in
ET. With the advent of longer-term in situ ET measurements and high-frequency repeat-
154
overpass remote-sensing data, there is great potential for improving empirical methods
for estimating ET in the future.
Acknowledgements
This work is supported by a National Science Foundation Graduate Fellowship. The
authors thank the personal investigators in charge of maintaining and processing eddy
covariance flux tower data used in this research as well as the personnel affiliated with
the MODIS ORNL-DAAC for sharing data associated with this research.
References
Adams, D. K., and A. C. Comrie (1997), The North American Monsoon, Bull. Am.
Meteorol. Soc., 78, 2197-2213.
Alfieri J. G., X. M. Xiao, D. Niyogi, R. A. Pielke, F. Chen, M. A. LeMone (2009),
Satellite-based modeling of transpiration from the grasslands in the Southern
Great Plains, USA, Global Planet. Change, 67:78–86.
Allen, R. G., M. Tasumi, and R. Trezza (2007), Satellite-based energy balance for
mapping evapotranspiration with internalized calibration (METRIC) – Model, J.
Irrig. Drain. E-ASCE, 133, 380–394.
Anderson, J. E. (1982), Factors controlling transpiration and photosynthesis in Tamarix
chinensis, Ecology, 63, 48-56.
Archer, S. 1994. Woody plant encroachment into southwestern grasslands and savannas:
rates, patterns and proximate causes. Pages 13–68 in M. Vavra, W. Laycock, and
R. Pieper, editors. Ecological implications of livestock herbivory in the West, Soc.
Range Manage., Denver, Colorado, USA.

155
Baldocchi, D. D. (2003), Assessing the eddy covariance technique for evaluating carbon
dioxide exchange rate of ecosystem: past, present and future, Global Change
Biol., 9, 479–492.
Barr, A. G., G. V. D. Kamp, R. Schmidt, and T. A. Black (2000), Monitoring the
moisture balance of a boreal aspen forest using a deep groundwater piezometer,
Agric. For. Meteorol., 102, 13–24.
Barz D., R. P. Watson, J. F. Kanneyh, J. D. Roberts, and D. P. Groeneveld (2009),
Cost/benefit considerations for recent saltcedar control, Middle Pecos River, New
Mexico. Environ. Manage., 43,282–298.
Bastiaanssen, W. G. M., M. Menenti, R. A. Feddes, and A. A. M. Holtslag (1998),
Remote sensing surface energy balance algorithm for land (SEBAL): 1.
Formulation. J. Hydrol., 212–213, 198–212.
Busch, D. E., and S. D. Smith (1995), Mechanisms associated with decline of woody
species in riparian ecosystems of the southwestern U.S., Ecol. Monogr., 65, 347-
370.
Choudhury, B. J. (1989), Estimating evaporation and carbon assimilation using infrared
temperature data: vistas in modeling G. Asrar (Ed.), Theor. Appl. Opt. Rem. S.,
Wiley, New York, pp. 628–690.
Choudhary, B., N. Ahmed, S. Idso, R. Reginato, and C. Daughtry (1994), Relations
between evaporation coefficients and vegetation indices studied by model
simulations, Remote Sens. Environ., 50, 1-17.
Cleugh H. A., R. Leuning, Q. Z. Mu, S. W. Running (2007), Regional evaporation
estimates from flux tower and MODIS satellite data, Remote Sens. Environ., 106,
285–304.
Cleverly, J., J. Thibault, D. Gilroy, and J. Coonrod (2002), Seasonal estimates of actual
evapotranspiration from Tamarix ramosissima stands using three-dimensional
eddy covariance, J. Arid Environ., 52, 181-197.
Commission for Environmental Cooperation (1999), Ribbon of life: an agenda for
preserving transboundary migratory bird habitat on the Upper San Pedro River.
Montreal, Canada: Commission for Environmental Cooperation.
Congalton, R., M. Balogh, C. Bell, K. Green, J. Milliken, and R. Ottman (1998),
Mapping and monitoring agricultural crops and other land cover in the Lower
Colorado River Basin, Photogramm. Eng. Rem. S., 64, 1107-1113.
156
Coonrod, J. and D. McDonnell (2001), Using remote sensing and GIS to compute
evapotranspiration in the Rio Grande bosque, 2001 ESRI user conference
proceedings. San Diego, CA: ESRI http://www.wca-infonet.org/id/124504.
Dahm, C., J. Cleverly, J. Coonrod, J. Thibault, D. McDonnell, and D. Gilroy (2002),
Evapotranspiration at the land/water interface in a semi-arid drainage basin,
Freshwater Biol., 47, 831-843.
DeMeo, G. A., R. Laczniak, R. Boyd, J. Smith, and W. Nylund (2003), Estimated
groundwater discharge by evapotranspiration from Death Valley, California,
1997-2001, U.S. Geol. Surv. Sci. Invest. Rep., 03-4254.
Devitt, D., A. Sala, S. Smith, J. Cleverly, L. Shaulis, and R. Hammett (1998), Bowen
ratio estimates of evapotranspiration for Tamarix ramosissima stands on the
Virgin River in southern Nevada, Water Resour. Res., 34, 2407-2414.
Dodd, M., W. Lauenroth, J. Welker (1998), Differential water resource use by
herbaceous and woody plant life-forms in a shortgrass steppe community,
Oecologia, 117, 504-512.
Elhaddad, A., and L. A. Garcia (2008), Surface energy balance-based model for
estimating evapotranspiration taking into account spatial variability in weather, J.
Irrig. Drain. E-ASCE, 134, 681–689.
Gazal, R, R. L. Scott, D. C. Goodrich, and D. G. Williams (2006), Controls on
transpiration in a desert riparian cottonwood forest, Agric. For. Meteorol., 137,
56–67.
Guerschman J. P., A. I. J. M.Van Dijk, G. Mattersdorf, J. Beringer, L. B. Hutley, R.
Leuning, R. C. Pipunic, and B. S. Sherman (2009), Scaling of potential
evapotranspiration with MODIS data reproduces flux observations and catchment
water balance observations across Australia, J. Hydrol., 369, 107–119.
Glenn, E., R. Tanner, S. Mendez, T. Kehret, D. Moore, J. Garcia, and C. Valdes (1998),
Growth rates, salt tolerance and water use characteristics of native and invasive
riparian plants from the delta of the Colorado River, Mexico, J. Arid Environ., 40,
281-294.
Glenn, E. P., P. L. Nagler, and A. R. Huete (2010), Vegetation index methods for
estimating evapotranspiration by remote sensing, Surv. Geophys., 6, 531-555.
Gonzalez-Dugo, M. P., C. M. U. Neale, L. Mateos, W. P. Kustas, M. C. Anderson, and F.
Li (2009), A comparison of operational remote-sensing based models for
estimating crop evapotranspiration, Agric. For. Meteorol., 49, 2082-2097.

157
Goodrich, D.C., R. Scott, J. Qi, B. Goff, C.L. Unkrich, M.S. Moran, D. Williams, S.
Schaeffer, K. Snyder, R. MacNish, T. Maddock, D. Pool, A. Chehbouni, D.I.
Cooper, W.E. Eichinger, W.J. Shuttleworth, Y. Kerr, R. Marsett, and W. Ni,
(2000), Seasonal estimates of riparian evapotranspiration using remote and in situ
measurements, Agric. For. Meteorol., 105, 281-309.
Groeneveld, D. P., W. M. Baugh, J. S. Sanderson, D. J. Cooper (2007), Annual
groundwater evapotranspiration mapped from single satellite scenes. J. Hydrol.,
344, 146-156.
Hansen, S. and C. Gorbach (1997), Middle Rio Grande water assessment: final report.
Albuquerque Area Office, Albuquerque, NM: U. S. Bureau of Reclamation.
Horton, J.L., T. M. Kolb, S. C. Hart (2001), Physiological response to groundwater depth
varies among species and with river flow regulation, Ecol. Appl., 11, 1046–1059.
Huxman, T. E., J. M. Cable, D. D. Ignace, A. J. Eilts, N. B. English, J. Weltzin, and D. G.
Williams (2004), Response of net ecosystem gas exchange to a simulated
precipitation pulse in a semiarid grassland: the role of native versus non-native
grasses and soil texture, Oecologia, 141, 295–305.
Huxman, T. E., B. P. Wilcox, D. D. Breshears, R.L. Scott, K.A. Snyder, E.E. Small, K.
Hultine, W. T. Pockman, R. B. Jackson (2005), Ecohydrological implication of
woody-plant encroachment, Ecology, 86, 308-319.
Jackson R. B., S. R. Carpenter, C.N. Dahm, D. M. McKnight, R. J. Naiman, S. L. Postel,
and S. W. Running (2001), Water in a changing world, Ecol. Appl., 11, 1027–
1045.
Kalma, J. D., T. R. McVicar, and M. F. McCabe (2008), Estimating land surface
evaporation: a review of methods using remotely sensed surface temperature data,
Surv. Geophys., 29, 421-469.
Kerley, G. I. H. and W. G. Whitford (2000), Impact of grazing and desertification in the
Chihuahuan desert: plant communities, granivores and granivory, Am. Midl. Nat.
Journal, 144, 78-91.
Kim, J. Y. and T. S. Hogue (2008), Evaluation of MODIS-based potential
evapotranspiration product at point scale, J. Hydromet., 9, 444-460.
Kosugi, Y. and M. Katsuyama (2007), Evapotranspiration over a Japanese cypress forest.
II. Comparison of the eddy covariance and water budget methods, J. Hydrol., 334,
305–311.

158
Kustas, W. P., K. S. Humes, J. M. Norman, and M. S. Moran (1996), Single- and dual-
source modeling of surface energy fluxes with radiometric surface temperature, J.
Appl. Meteorol., 35, 110–121.
Lower Colorado River Multi-species Conservation Program (2004), Lower Colorado
River Multi-species Conservation Program, Volume III: biological assessment, J
& S., Inc, Sacramento, CA, USA.
Maddock, T., III, R. MacNish, D. Goodrich, D. Williams, J. Shuttleworth, B. Goff, R.
Scott, S. Moran, D., Cooper, L. Hipps, A. Chehbouni, (1998), An overview of
atmospheric and surface water coupling to regional groundwater models in semi-
arid basins, In: Proceedings of the Special Symposium of American Society of
Meteorologists on Hydrology, Phoenix, AZ, January 11–16, pp. 38–42.
McClaran, M.P., D. L. Angell, and C. Wissler (2002), Santa Rita Experimental Range
digital database user‘s guide, USDA Forest Service, Rocky Mountain Research
Station, RMRS-GTR-100. 13 p.
McDonnell, J. J., M. Sivapalan, K. Vache´, S. Dunn, G. Grant, R. Haggerty, C. Hinz, R.
Hooper, J. Kirchner, M. L. Roderick, J. Selker, and M. Weiler (2007), Moving
beyond heterogeneity and process complexity: a new vision for watershed
hydrology, Water Resour. Res., Vol. 43, W07301, doi:10.1029/2006WR005467.
Moncrieff, J. B., J. M. Massheder, H. de Bruin, J. Elbers, T. Friborg, B. Heusinkveld, P.
Kabat, S. Scott, H. Soegaard, A. Verhoef (1997), A system to measure surface
fluxes of momentum, sensible heat, water vapour, and carbon dioxide, J. Hydrol.,
188-189, 589-611.
Moore, G. W. and J. L. Heilman (2011), Ecohydrology bearings – invited commentary:
proposed principles governing how vegetation changes affect transpiration,
Ecohydrology, 4, 351-358.
Murray, R. S., P. L. Nagler, K. Morino, and E. P. Glenn (2009), An empirical algorithm
for estimating agricultural and riparian evapotranspiration using MODIS
Enhanced Vegetation Index and ground measurements of ET. II. Application to
the Lower Colorado River, US, Rem. Sens., 1, 1125-1138.
Nagler, P., J. Cleverly, D. Lampkin, E. Glenn, A. Huete, and Z. Wan (2005a), Predicting
riparian evapotranspiration from MODIS vegetation indices and meteorological
data, Remote Sens. Environ., 94, 17-30.

159
Nagler, P., R. Scott, C. Westenberg, J, Cleverly, E. Glenn, A. Huete (2005b),
Evapotranspiration on western U.S. rivers estimated using the Enhanced
Vegetation Index from MODIS and data from eddy covariance and Bowen ratio
flux towers, Remote Sens. Environ., 97, 337-351.
Nagler, P. L., E. P. Glenn, H. Kim, W. Emmerich, R. L. Scott, T. E. Huxman, and A. R.
Huete (2007), Relationship between evapotranspiration and precipitation pulses in
semiarid rangeland estimated by soil moisture flux towers and MODIS vegetation
indices, J. Arid Environ., 70, 443-462.
Nagler, P. L., K. Morino, K. Didan, J. Erker, J. Osterberg, K. Hultine, and E. P. Glenn
(2008), Removal of saltcedar (Tamarix spp.) will not facilitate the return of native
trees nor save water on the lower Colorado River, Ecohydrology, doi.
10.1002/eco.35.
Nagler P. L., K. Morino, R. Murray, J. Osterberg, E. P. Glenn (2009), An empirical
algorithm for estimating agricultural and riparian evapotranspiration using
MODIS Enhanced Vegetation Index and ground measurements of ET. I.
Description of method, Rem. Sens., 1, 1273-1297.
Newman B. D., B. P. Wilcox, S. R. Archer, D. D. Breshears, C. N. Dahm, C. J. Duffy, N.
G. McDowell, F. M. Phillips, B. R. Scanlon, and E. R. Vivoni (2006),
Ecohydrology of water-limited environments: a scientific vision, Water Resour.
Res., 42, W06302. DOI 10.1029/2005WR004141.
Nichols W. D. (1994), Groundwater discharge by phreatophyte shrubs in the Great Basin
as related to depth to groundwater, Water Resour. Res., 30, 3265–3274.
Noy-Meir, E. (1973), Desert ecosystems: environment and producers. Annu. Rev. Ecol.
Syst., 4, 23-51.
Overgaard, J., D. Rosbjereg, and M. Butts (2006), Land-surface modeling in hydrological
perspective – a review, Biogeosci., 3, 229-241.
Phillips, F. M. (1994), Environmental tracers for water movement in desert soils of the
American Southwest, Soil Sci. Soc. Am. J., 58, 15-24.
Potts, D.L., T. E. Huxman, R. L. Scott, D. G. Williams, D. C. Goodrich (2006), The
sensitivity of ecosystem carbon exchange to seasonal precipitation and woody
plant encroachment, Oecologia, 150, 453-463.

160
Rana, G., N. Keterji (2000), Measurement and estimation of actual evapotranspiration in
the field under Mediterranean climate: a review, Eur. J. Agron., 13, 125-153.
Rodriguez-Iturbe, I. (2000), Ecohydrology: a hydrologic perspective of climate-soil-
vegetation dynamics, Water Resour. Res., 36, 3-9.
Sala, O., W. Lauenroth, W. Parton, and M. Tlica (1981), Water status of soil and
vegetation in a shortgrass steppe, Oecologia, 48, 327-331.
Sala, O. E. and W. K. Lauenroth (1982), Small rainfall events: An ecological role in
semiarid regions, Oecologia, 5, 301-304.
Sala, A., S. D. Smith, and D. A. Devitt (1996), Water use by Tamarix ramosissima and
associated phreatophytes in a Mohave Desert floodplain, Ecol. Appl., 6, 888-898.
Sala, O., et al. (1992), Long-term soil water dynamics in the shortgrass steppe, Ecology,
73, 1175-1181.
Schume, H., H. Hager, and G. Jost (2005), Water and energy exchange above a mixed
European Beech—Norway Spruce forest canopy: a comparison of eddy
covariance against soil water depletion measurement, Theor. Appl. Climatol., 81,
87–100.
Scott, R., W. Shuttleworth, T. Keefer, and A. Warrick (2000), Modeling multiyear
observations of soil moisture recharge in the semiarid American Southwest,
Water Resour. Res., 36, 2233-2247.
Scott, R. L., C. Watts, J. Garatuza-Payan, E. Edwards, D. C. Goodrich, D. Williams, and
W. J. Shuttleworth (2003), The understory and overstory partitioning of energy
and water fluxes in an open canopy, semiarid woodland, Agric. For. Meteorol.,
114, 127-139.
Scott, R., E. Edwards, W. Shuttleworth, T. Huxman, C. Watts, and D. Goodrich (2004),
Inter-annual and seasonal variation in fluxes of water and carbon dioxide from a
riparian woodland ecosystem, Agric. For. Meteorol., 122, 65-84.
Scott, R., T. Huxman, W. Cable, and W. Emmerich (2006a), Partitioning of
evapotranspiration and its relation to carbon dioxide exchange in a Chihuahuan
Desert shrubland, Hydrol. Processes, 20, 3227-3243.
Scott, R. L., T. E. Huxman, D. G. Williams, and D. C. Goodrich (2006b), Ecological
impacts of woody-plant encroachment: seasonal patterns of water and carbon
dioxide exchange within a semiarid riparian environment, Global Change Biol.,
12, 311-324.
161
Scott, R.L., D. G. Williams, D. C. Goodrich, W. L. Cable, L. R. Levick, R. McGuire, R.
M. Gazal, E. A. Yepez, P. Ellsworth, and T. E. Huxman (2006c), Chapter D:
Determining the riparian groundwater use within the San Pedro Riparian National
Conservation Area and the Sierra Vista Subwatershed, Arizona, In Hydrologic
Requirements of and Consumptive Ground-Water Use by Riparian Vegetation
along the San Pedro River, Arizona, U.S. Geological Survey Scientific
Investigations Report 2005-5163, pp. 107-142.
Scott, R. L., W. L. Cable, T. E. Huxman, P. L. Nagler, M. Hernandez, D. C. Goodrich
(2008), Multiyear riparian evapotranspiration and groundwater use for a semiarid
watershed, J. Arid Environ., 72, 1232-1246.
Scott, R.L., G. D. Jenerette, D. L. Potts, and T. E Huxman (2009), Effects of seasonal
drought on net carbon dioxide exchange from a woody-plant-encroached semiarid
grassland, J. Geophys. Res., 114, G04004, doi:10.1029/2008JG000900.
Scott, R. L. (2010a), Using watershed water balance to evaluate the accuracy of eddy
covariance evaporation measurements for three semiarid ecosystems, Agric. For.
Meteorol., 150, 219-225.
Scott, R.L., E. P. Hamerlynck, G. D. Jenerette, M. S. Moran, and G. Barron-Gafford
(2010b), Carbon dioxide exchange in a semidesert grassland through drought-
induced vegetation change, J. Geophys. Res., 115, G03026.
doi:10.1029/2010JG001348.
Serrat-Capdevila, A., R. L. Scott, W. J. Shuttleworth, and J. B. Valdés (2011), Estimating
evapotranspiration under warmer climates: insights from a semi-arid riparian
system, J. Hydrol., 399, 1-11.
Snyder, K. A. and D. G. Williams (2000), Water sources used by riparian trees varies
among stream types on the San Pedro River, Arizona, Agric. For. Meteorol., 105,
227-240.
Trezza, R. (2006), Evapotranspiration from a remote sensing model for water
management in an irrigation system in Venezuela, Interciencia, 31, 417-423.
United States Bureau of Reclamation (1997), Description and assessment of operations,
maintenance, and sensitive species of the lower Colorado River: biological
assessment, United States Bureau of Reclamation, Boulder City, NV, USA.
United States Department of Interior (2002), Lower Colorado River accounting system
demonstration of technology calendar year 2001. Boulder City, NV: U. S.
Department of Interior, Bureau of Reclamation.
162
Unland, H. E., A. M. Arain, C. Harlow, P. R. Houser, J. Garatuza-Payan, P. Scott, O. L.
Sen, and W. J. Shuttleworth (1998), Evaporation from a riparian system in a semi-
arid environment, Hydrol. Processes, 12, 527-542.
Wilcox, B. P. (2002), Shrub control and streamflow on rangelands: a process-based
viewpoint, J. Range Manage., 55, 318-326.
Wilcox, B. P., M. S. Seyfried, and D. D. Breshears (2003), The water balance on
rangelands. Pages 791–794 in B. A. Stewart and T. A. Howell, editors.
Encyclopedia of water science. Marcel Dekker, New York, New York, USA.
Williams, D. G., R. L. Scott, T. E. Huxman, D. C. Goodrich, and G. Lin (2006),
Sensitivity of riparian ecosystems in arid and semiarid environments to moisture
pulses, Hydrol. Processes, 20, 3191-3205.
Wilson, K. B., P. J. Hanson, P. J. Mulholland, D. D. Baldocchi, and S. D. Wullschleger
(2001), A comparison of methods for determining forest evapotranspiration and
its components: sap-flow, soil water budget, eddy covariance and catchment water
balance, Agric. For. Meteorol., 106, 153-168.
Wylie, B., D. Johnson, E. Laca, N. Saliendra, T. Gilmanov, and B. Reed (2003),
Calibration of remotely sensed, coarse resolution NDVI to CO2 fluxes in a
sagebrush-steppe ecosystem, Remote Sens. Environ., 85, 243-255.
Yepez, E. A., D. G. Williams, R. L. Scott, G. Lin (2003), Partitioning overstory and
understory evapotranspiration in a semiarid savanna woodland from the isotopic
composition of water vapor, Agric. For. Meteorol., 119, 53-68.
Zhang, L., W. R. Dawes, and G. R. Walker (2001), Response of mean annual
evapotranspiration to vegetation changes at catchment scale, Water Resour. Res.,
37, 701-708, doi:10.1029/2000WR900325.

163
Table Captions
Table 1. Locations and Descriptions for Five Study Sites
Table 2. Relationships of Evapotranspiration to Selected Variablesa
Table 3. Evapotranspiration Model Statistics Reported after Parameterizationa
Table 4. Root Mean Square Error (RMSE) Reported for each Modela
164
Figure Captions
Figure 1. Locations of the five study sites, including one in the Santa Cruz River
Watershed (Santa Rita Mesquite Savannah, SR). and four in the San Pedro River
Watershed (Charleston Mesquite Woodland, CM; Lewis Springs Mesquite, LM; and
Lewis Springs Sacaton, LS); and Kendall Grassland, KG) in Arizona, USA.
Figure 2. Predicted 2007 ET (ETpredicted) versus measured ET (ETactual) plotted for all sites
along the 1:1 line by calibrating Equation (1) using all sites combined to yield Equation
(2). Locations include three riparian influenced sites (filled symbols): Charleston
Mesquite Woodland (CM), Lewis Springs Mesquite (LM), and Lewis Springs Sacaton
(LS); and two upland, water-limited sites (hollow symbols): Kendall Grassland (KG) and
Santa Rita Mesquite Savannah (SR).
Figure 3. Precipitation and evapotranspiration (ET) plotted over time for all study sites
[Charleston Mesquite Woodland (CM), Lewis Springs Mesquite (LM), and Lewis
Springs Sacaton (LS), Kendall Grassland (KG), and Santa Rita Mesquite Savannah (SR)]
during a 3-yr period. Precipitation was summed over 16-day windows measured using
tipping-bucket rain gauges at each flux tower site and ET was calculated using the eddy
covariance technique and averaged over each 16-day window.

165
Figure 4. Predicted 2007 ET (ETpredicted) versus measured ET (ETactual) plotted for all
sites along the 1:1 line by calibrating Equation (3) using all sites combined to yield
Equation (5). Locations include three riparian influenced sites (filled symbols):
Charleston Mesquite Woodland (CM), Lewis Springs Mesquite (LM), and Lewis Springs
Sacaton (LS); and two upland, water-limited sites (hollow symbols): Kendall Grassland
(KG) and Santa Rita Mesquite Savannah (SR).
Figure 5. Predicted 2007 ET (ETpredicted) versus measured ET (ETactual) plotted along the
1:1 line by calibrating Equation (3) using: 5a) riparian sites only to yield Equation (6),
and 5b) upland sites only to yield Equation (7). Locations include three riparian
influenced sites (filled symbols above): Charleston Mesquite Woodland (CM), Lewis
Springs Mesquite (LM), and Lewis Springs Sacaton (LS); and two upland, water-limited
sites (hollow symbols below): Kendall Grassland (KG) and Santa Rita Mesquite
Savannah (SR).
Figure 6. Predicted 2007 ET (ETpredicted) versus measured ET (ETactual) plotted for all
sites along the 1:1 line by calibrating Equation (8) using all sites combined to yield
Equation (9). Locations include three riparian influenced sites (filled symbols):
Charleston Mesquite Woodland (CM), Lewis Springs Mesquite (LM), and Lewis Springs
Sacaton (LS); and two upland, water-limited sites (hollow symbols): Kendall Grassland
(KG) and Santa Rita Mesquite Savannah (SR).

166
Figure 7. Predicted 2007 ET (ETpredicted) versus measured ET (ETactual) plotted along the
1:1 line by calibrating Equation (8) using: 7a) riparian sites only to yield Equation (10),
and 7b) upland sites only to yield Equation (11). Locations include three riparian
influenced sites (filled symbols above): Charleston Mesquite Woodland (CM), Lewis
Springs Mesquite (LM), and Lewis Springs Sacaton (LS); and two upland, water-limited
sites (hollow symbols below): Kendall Grassland (KG) and Santa Rita Mesquite
Savannah (SR).
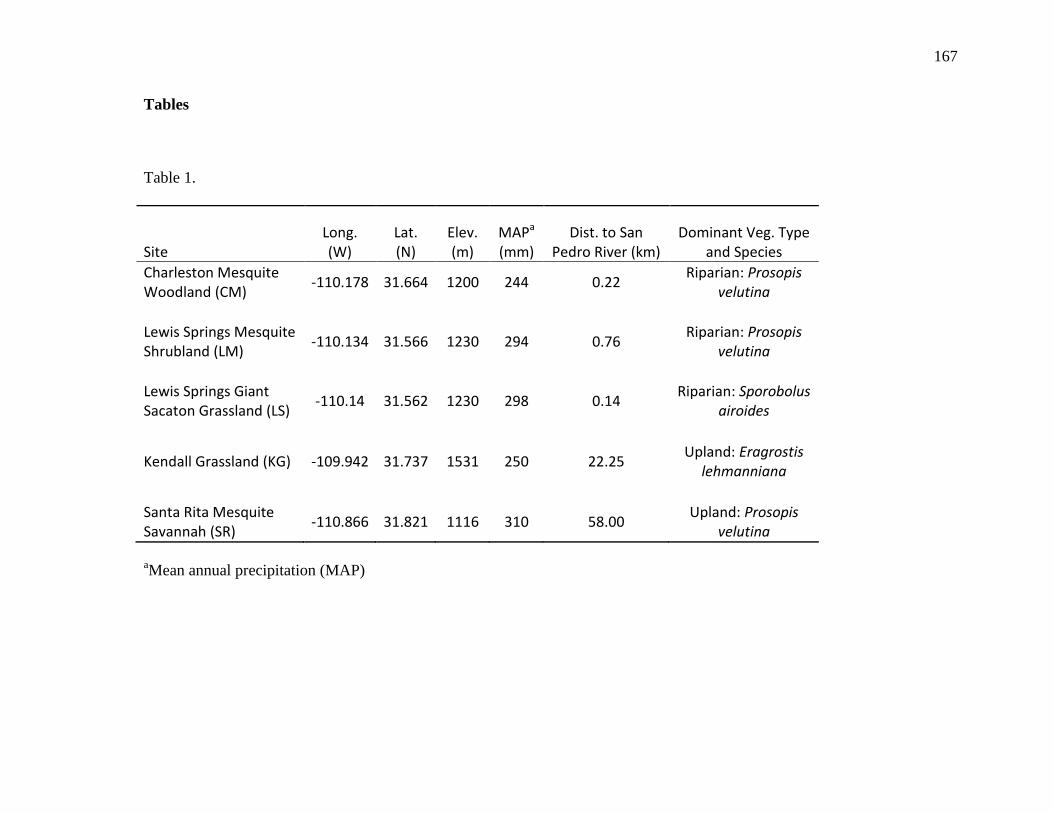
167
Tables
Table 1.
Site Long. (W)
Lat. (N)
Elev. (m)
MAPa (mm)
Dist. to San Pedro River (km)
Dominant Veg. Type and Species
Charleston Mesquite Woodland (CM)
-110.178 31.664 1200 244 0.22 Riparian: Prosopis
velutina Lewis Springs Mesquite Shrubland (LM)
-110.134 31.566 1230 294 0.76 Riparian: Prosopis
velutina Lewis Springs Giant Sacaton Grassland (LS)
-110.14 31.562 1230 298 0.14 Riparian: Sporobolus
airoides
Kendall Grassland (KG) -109.942 31.737 1531 250 22.25 Upland: Eragrostis
lehmanniana
Santa Rita Mesquite Savannah (SR)
-110.866 31.821 1116 310 58.00 Upland: Prosopis
velutina
aMean annual precipitation (MAP)
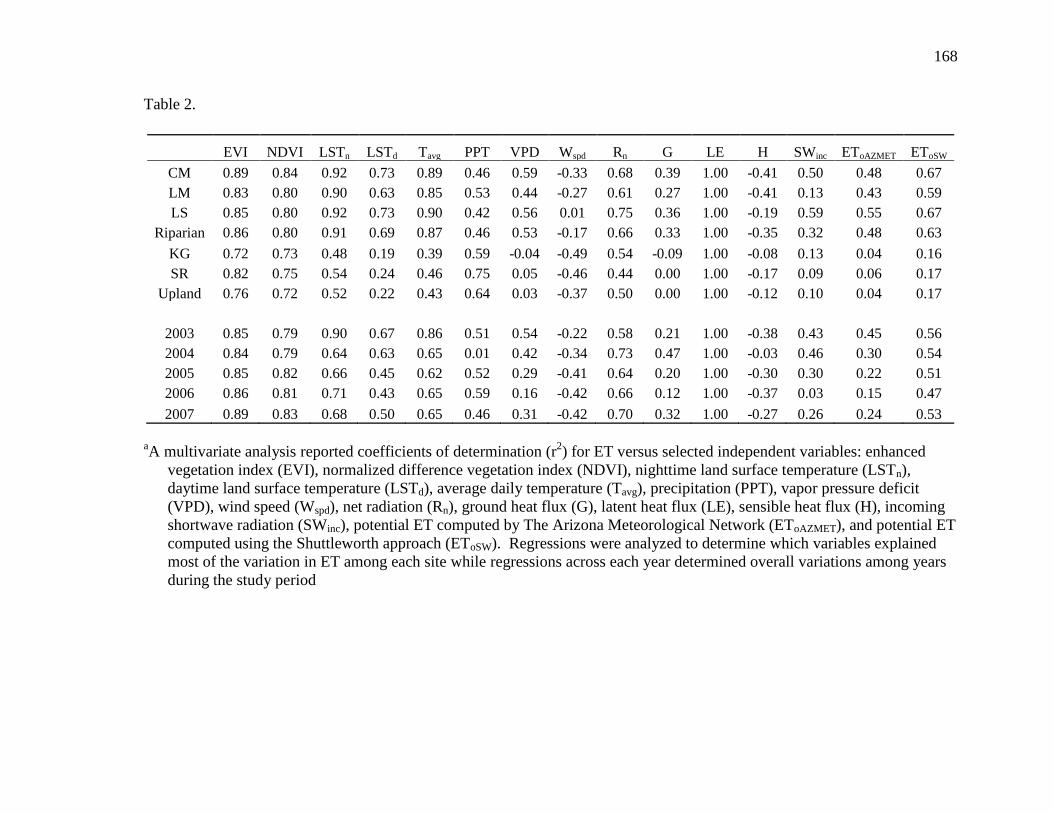
168
Table 2.
EVI NDVI LSTn LSTd Tavg PPT VPD Wspd Rn G LE H SWinc EToAZMET EToSW
CM 0.89 0.84 0.92 0.73 0.89 0.46 0.59 -0.33 0.68 0.39 1.00 -0.41 0.50 0.48 0.67
LM 0.83 0.80 0.90 0.63 0.85 0.53 0.44 -0.27 0.61 0.27 1.00 -0.41 0.13 0.43 0.59
LS 0.85 0.80 0.92 0.73 0.90 0.42 0.56 0.01 0.75 0.36 1.00 -0.19 0.59 0.55 0.67
Riparian 0.86 0.80 0.91 0.69 0.87 0.46 0.53 -0.17 0.66 0.33 1.00 -0.35 0.32 0.48 0.63
KG 0.72 0.73 0.48 0.19 0.39 0.59 -0.04 -0.49 0.54 -0.09 1.00 -0.08 0.13 0.04 0.16
SR 0.82 0.75 0.54 0.24 0.46 0.75 0.05 -0.46 0.44 0.00 1.00 -0.17 0.09 0.06 0.17
Upland 0.76 0.72 0.52 0.22 0.43 0.64 0.03 -0.37 0.50 0.00 1.00 -0.12 0.10 0.04 0.17
2003 0.85 0.79 0.90 0.67 0.86 0.51 0.54 -0.22 0.58 0.21 1.00 -0.38 0.43 0.45 0.56
2004 0.84 0.79 0.64 0.63 0.65 0.01 0.42 -0.34 0.73 0.47 1.00 -0.03 0.46 0.30 0.54
2005 0.85 0.82 0.66 0.45 0.62 0.52 0.29 -0.41 0.64 0.20 1.00 -0.30 0.30 0.22 0.51
2006 0.86 0.81 0.71 0.43 0.65 0.59 0.16 -0.42 0.66 0.12 1.00 -0.37 0.03 0.15 0.47
2007 0.89 0.83 0.68 0.50 0.65 0.46 0.31 -0.42 0.70 0.32 1.00 -0.27 0.26 0.24 0.53
aA multivariate analysis reported coefficients of determination (r
2) for ET versus selected independent variables: enhanced
vegetation index (EVI), normalized difference vegetation index (NDVI), nighttime land surface temperature (LSTn),
daytime land surface temperature (LSTd), average daily temperature (Tavg), precipitation (PPT), vapor pressure deficit
(VPD), wind speed (Wspd), net radiation (Rn), ground heat flux (G), latent heat flux (LE), sensible heat flux (H), incoming
shortwave radiation (SWinc), potential ET computed by The Arizona Meteorological Network (EToAZMET), and potential ET
computed using the Shuttleworth approach (EToSW). Regressions were analyzed to determine which variables explained
most of the variation in ET among each site while regressions across each year determined overall variations among years
during the study period

169
Table 3.
Training Set
Statistical Test
Eq. (1) Modelb
Eq. (5) Modelc
Eq. (9) Modeld
Eq. (2) Eq. (6) Eq. (10)
ALL r2 0.78 0.83 0.74
RMSE 0.57 0.50 0.62
Eq. (3) Eq. (7) Eq. (11)
Riparian r2 0.92 0.93 0.75
RMSE 0.37 0.36 0.66
Eq. (4) Eq. (8) Eq. (12)
Upland r2 0.62 0.62 0.77
RMSE 0.40 0.40 0.31
aEach model was trained by all five sites combined (ALL), riparian sites only (CM, LM,
LS), and upland sites only (KG, SR). bOriginal Scott et al. [2008] model
cModified multiplicative model
dMultiple linear regression model
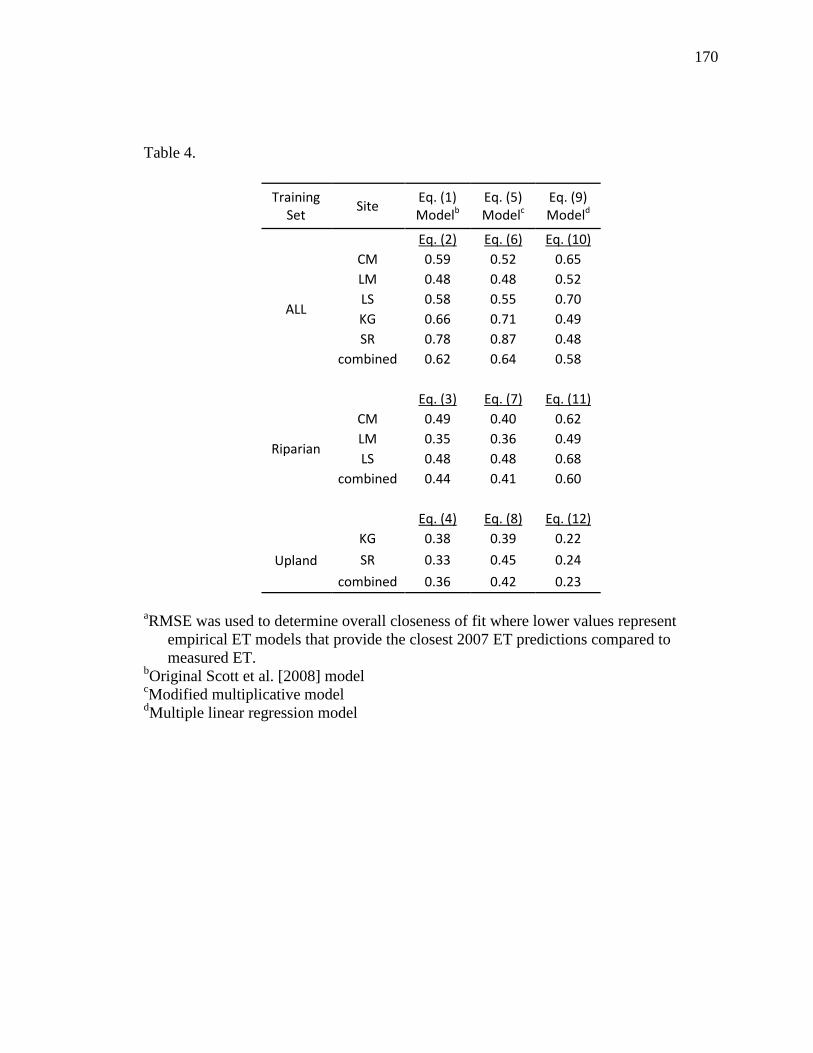
170
Table 4.
Training Set
Site Eq. (1) Modelb
Eq. (5) Modelc
Eq. (9) Modeld
Eq. (2) Eq. (6) Eq. (10)
ALL
CM 0.59 0.52 0.65
LM 0.48 0.48 0.52
LS 0.58 0.55 0.70
KG 0.66 0.71 0.49
SR 0.78 0.87 0.48
combined 0.62 0.64 0.58
Eq. (3) Eq. (7) Eq. (11)
Riparian
CM 0.49 0.40 0.62
LM 0.35 0.36 0.49
LS 0.48 0.48 0.68
combined 0.44 0.41 0.60
Eq. (4) Eq. (8) Eq. (12)
Upland
KG 0.38 0.39 0.22
SR 0.33 0.45 0.24
combined 0.36 0.42 0.23
aRMSE was used to determine overall closeness of fit where lower values represent
empirical ET models that provide the closest 2007 ET predictions compared to
measured ET. bOriginal Scott et al. [2008] model
cModified multiplicative model
dMultiple linear regression model
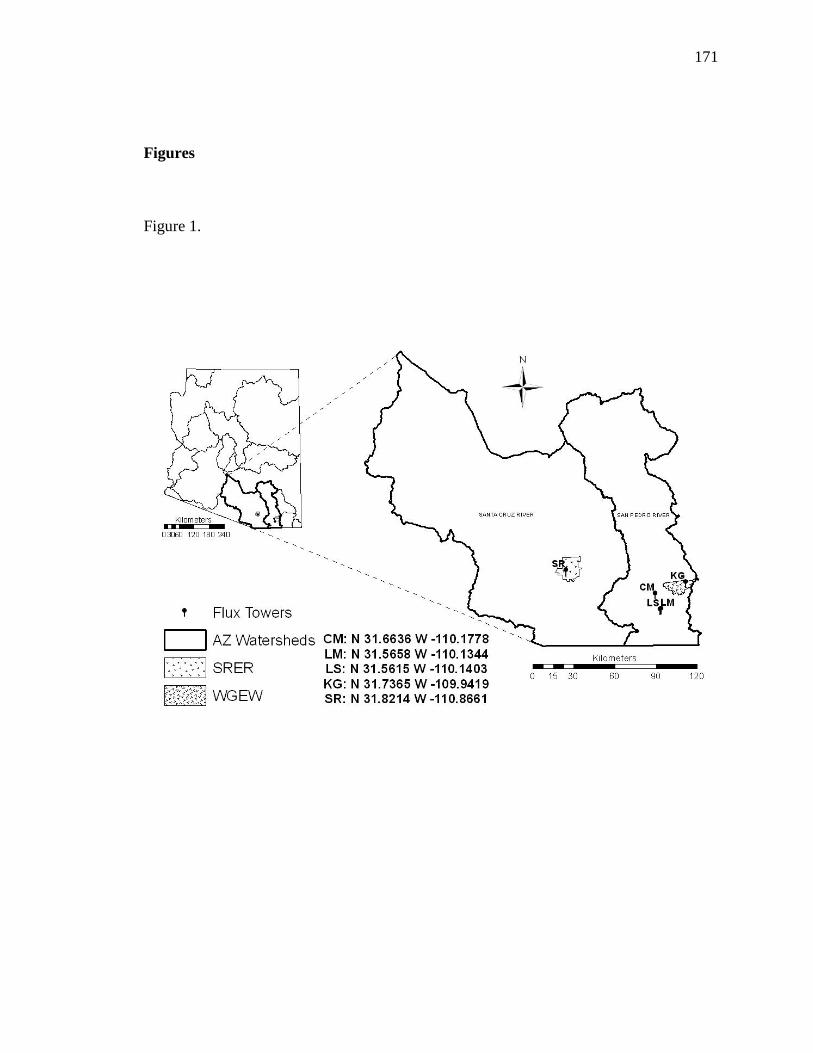
171
Figures
Figure 1.
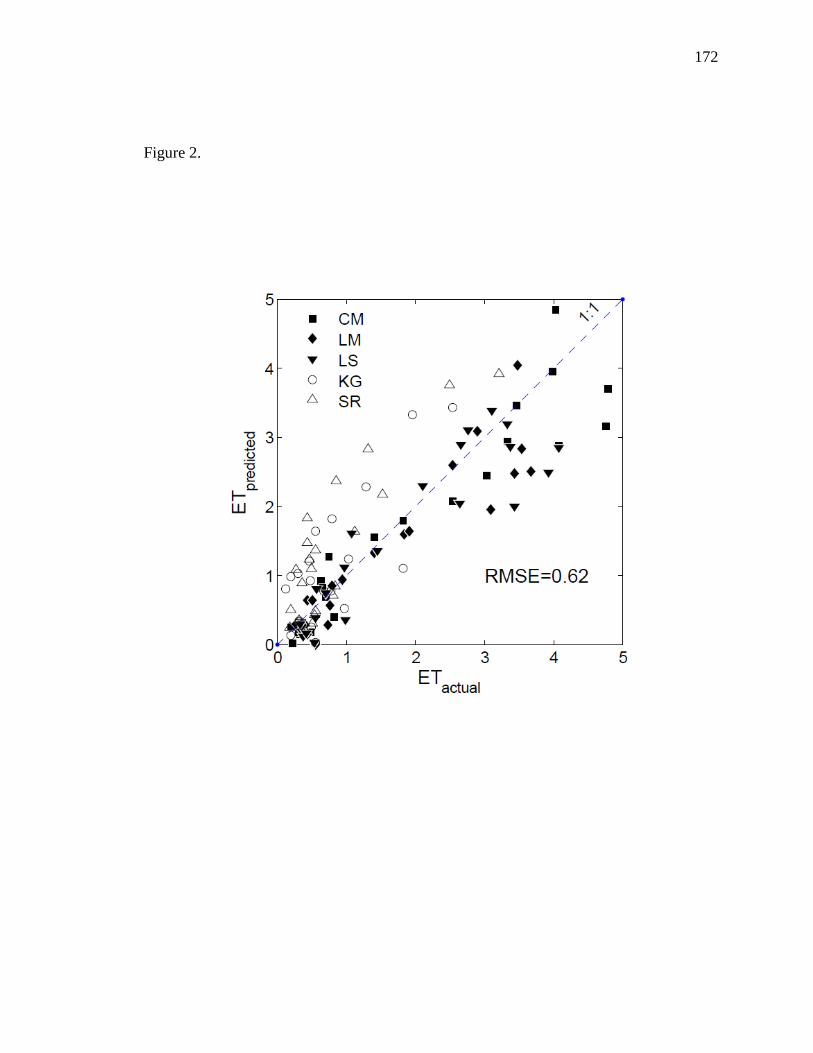
172
Figure 2.
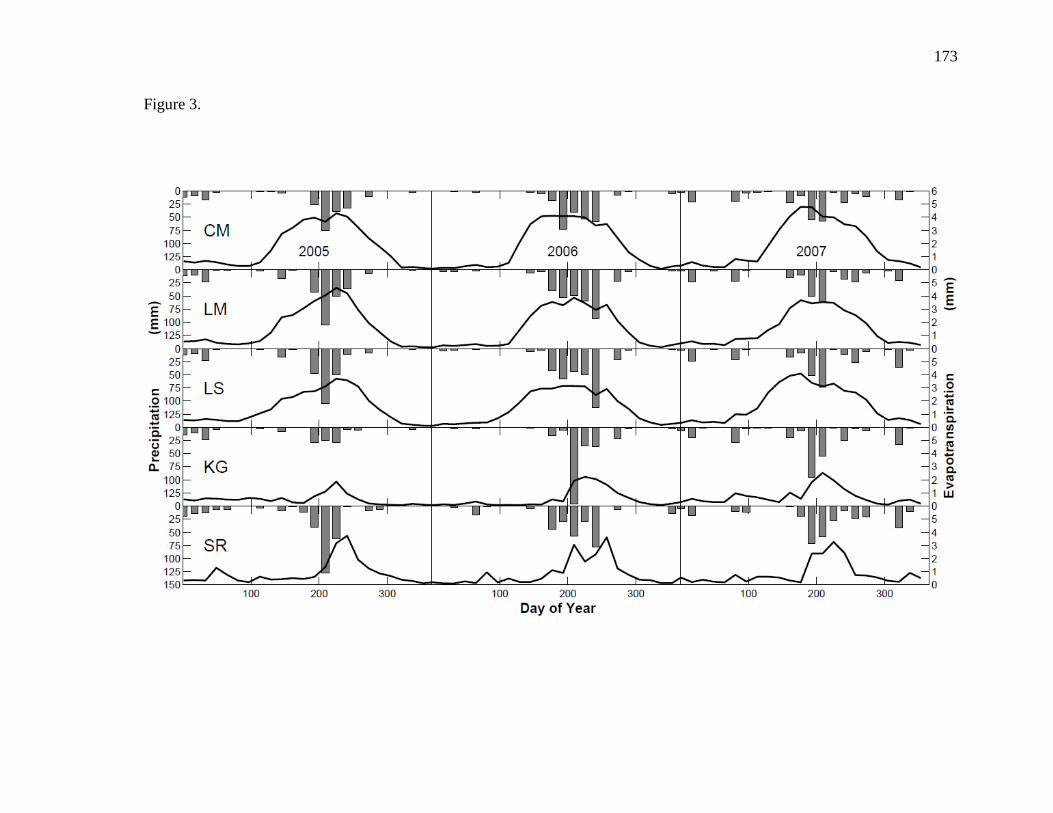
173
Figure 3.
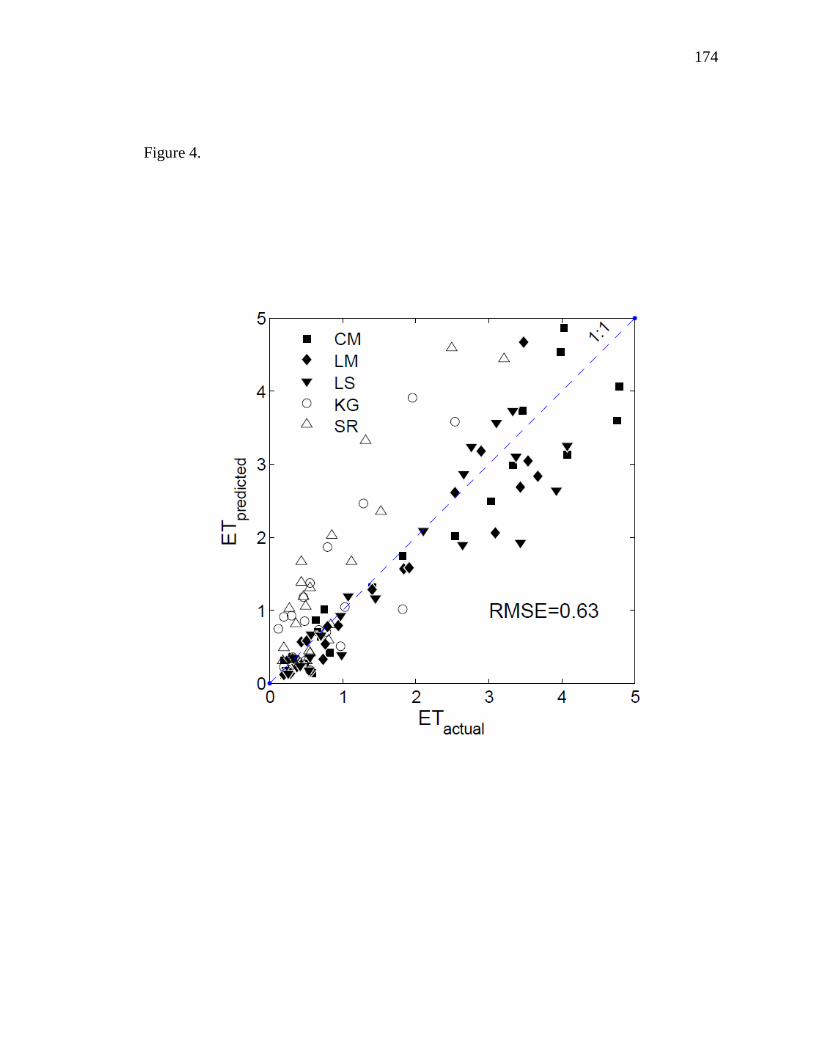
174
Figure 4.
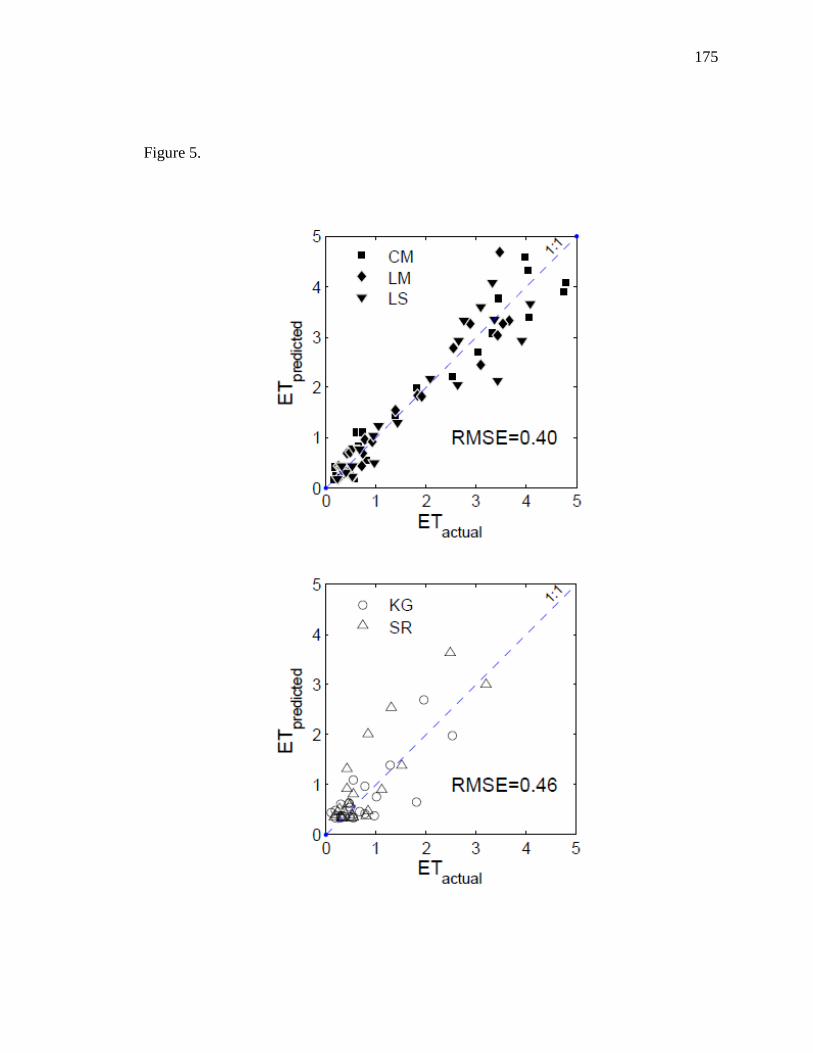
175
Figure 5.
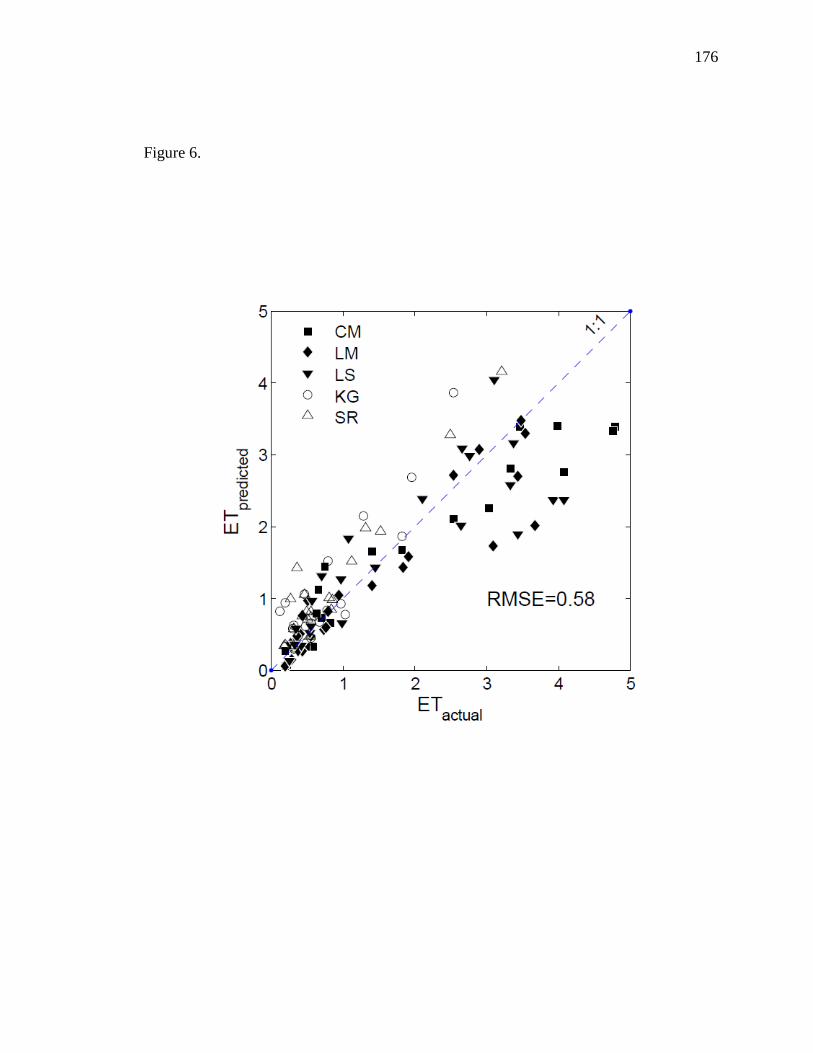
176
Figure 6.
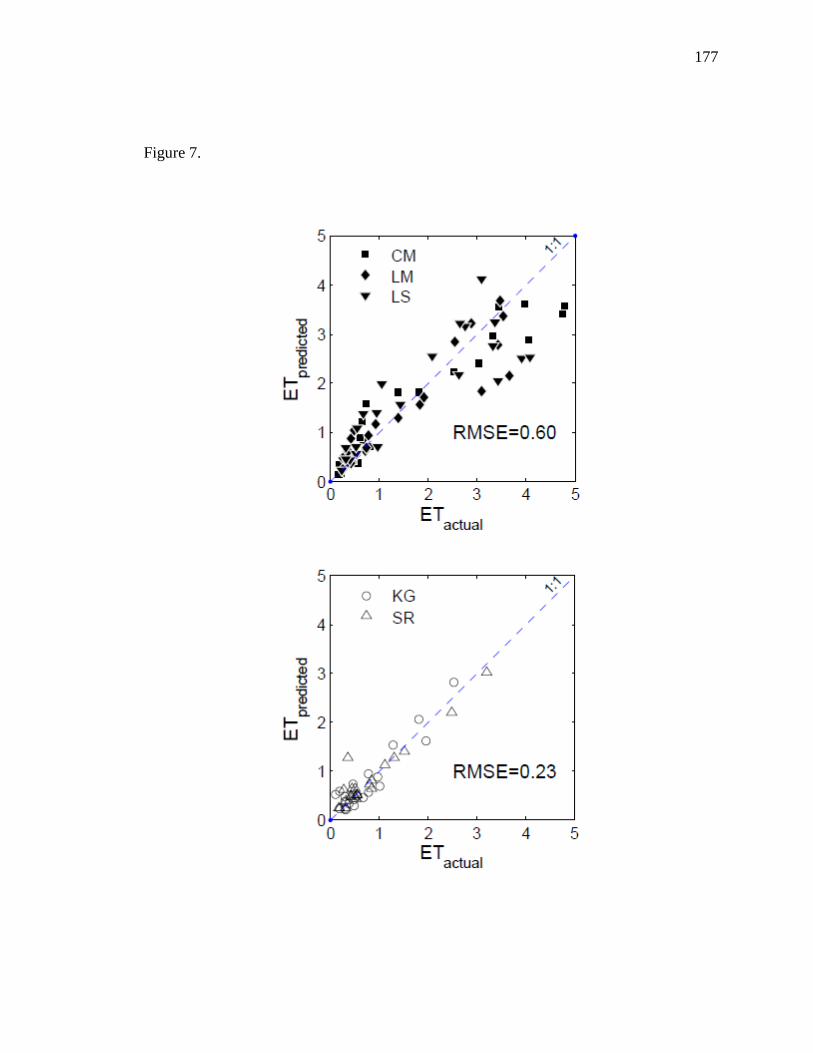
177
Figure 7.