Embed Size (px)
Citation preview
1
The United Kingdom in the European context – top-line reflections from the European Social Survey Rory Fitzgerald and Elissa Sibley1 With the forthcoming referendum on Britain’s membership of the European Union on June 23rd, the spotlight inevitably falls on how similar or different we are to our European neighbours. Concerns regarding the economy, immigration, welfare provision and the UK’s voice within Europe are all issues that have been discussed during the referendum debate. In this short report of top-line findings using the European Social Survey, the authors explore the public’s attitudes towards Europe, democracy, immigration and welfare. By comparing attitudes within the UK to those in other European countries, we consider whether the United Kingdom is different or in fact similar to its neighbours on these salient issues. This short summary of findings introduces data collected by the European Social Survey (www.europeansocialsurvey.org) at various points between 2002 and 2014, in order to shed light on the similarities and differences between those in the UK and their neighbours in other European countries. The European Social Survey is an academically-led biennial cross-national social survey which aims to chart change and stability in the social fabric of Europe. Data is collected in hour-long face-to-face interviews amongst a nationally representative sample of the general population aged 15 and over in countries participating in each round. Due to countries funding their own participation in the ESS, the range of countries participating in each round varies somewhat. The ESS includes countries in the EU, EEA and beyond these areas in geographic Europe.2 In this report we include data from all participating countries, rather than restricting it to only the EU member states since comparisons within and outside of the EU may be equally interesting.3
1 Centre for Comparative Social Surveys, City University London. 2 Israel also participated in some rounds of the ESS. 3 We have excluded Israel from the section examining attitudes towards immigration.
2
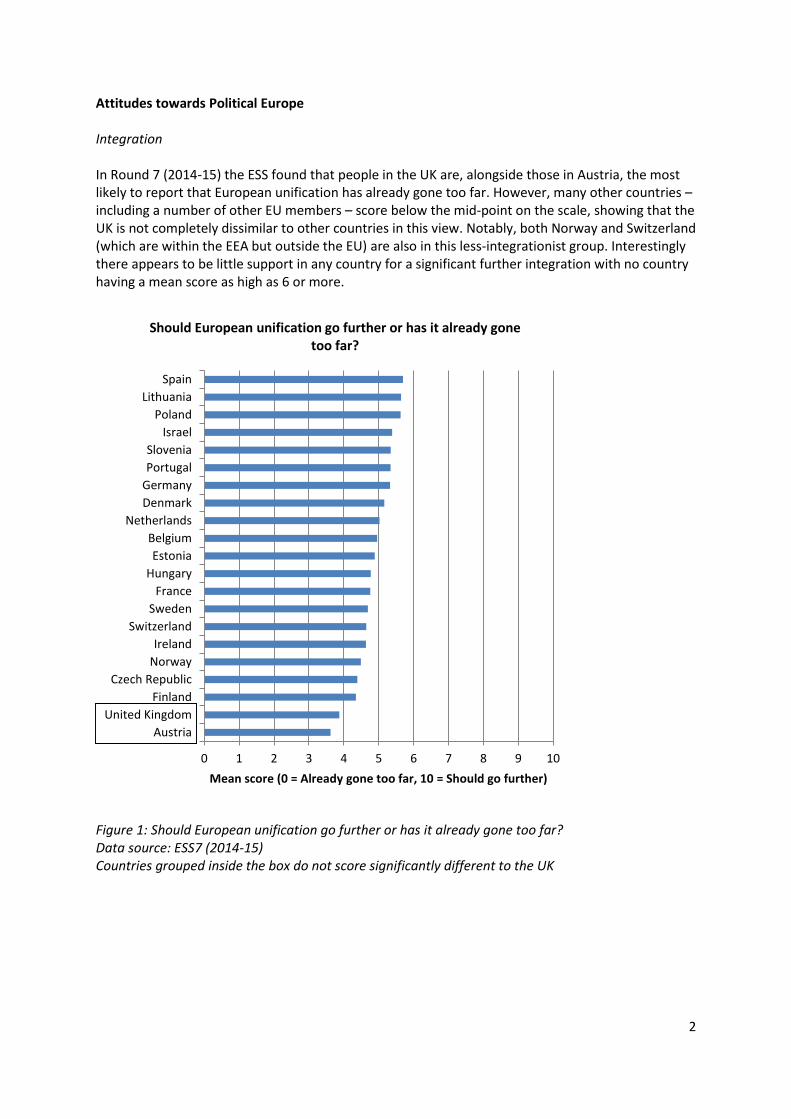
Attitudes towards Political Europe Integration In Round 7 (2014-15) the ESS found that people in the UK are, alongside those in Austria, the most likely to report that European unification has already gone too far. However, many other countries – including a number of other EU members – score below the mid-point on the scale, showing that the UK is not completely dissimilar to other countries in this view. Notably, both Norway and Switzerland (which are within the EEA but outside the EU) are also in this less-integrationist group. Interestingly there appears to be little support in any country for a significant further integration with no country having a mean score as high as 6 or more.
Figure 1: Should European unification go further or has it already gone too far? Data source: ESS7 (2014-15) Countries grouped inside the box do not score significantly different to the UK
0 1 2 3 4 5 6 7 8 9 10
Austria
United Kingdom
Finland
Czech Republic
Norway
Ireland
Switzerland
Sweden
France
Hungary
Estonia
Belgium
Netherlands
Denmark
Germany
Portugal
Slovenia
Israel
Poland
Lithuania
Spain
Mean score (0 = Already gone too far, 10 = Should go further)
Should European unification go further or has it already gone too far?
3
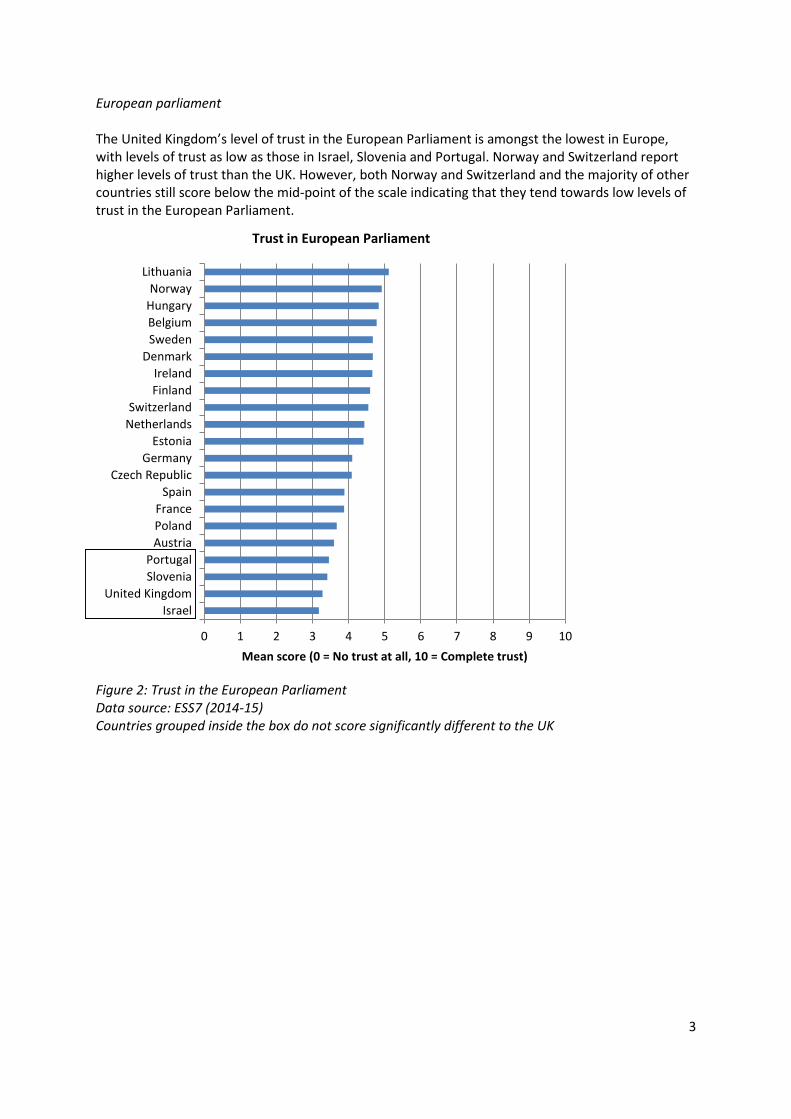
European parliament The United Kingdom’s level of trust in the European Parliament is amongst the lowest in Europe, with levels of trust as low as those in Israel, Slovenia and Portugal. Norway and Switzerland report higher levels of trust than the UK. However, both Norway and Switzerland and the majority of other countries still score below the mid-point of the scale indicating that they tend towards low levels of trust in the European Parliament.
Figure 2: Trust in the European Parliament Data source: ESS7 (2014-15) Countries grouped inside the box do not score significantly different to the UK
0 1 2 3 4 5 6 7 8 9 10
Israel
United Kingdom
Slovenia
Portugal
Austria
Poland
France
Spain
Czech Republic
Germany
Estonia
Netherlands
Switzerland
Finland
Ireland
Denmark
Sweden
Belgium
Hungary
Norway
Lithuania
Mean score (0 = No trust at all, 10 = Complete trust)
Trust in European Parliament
4
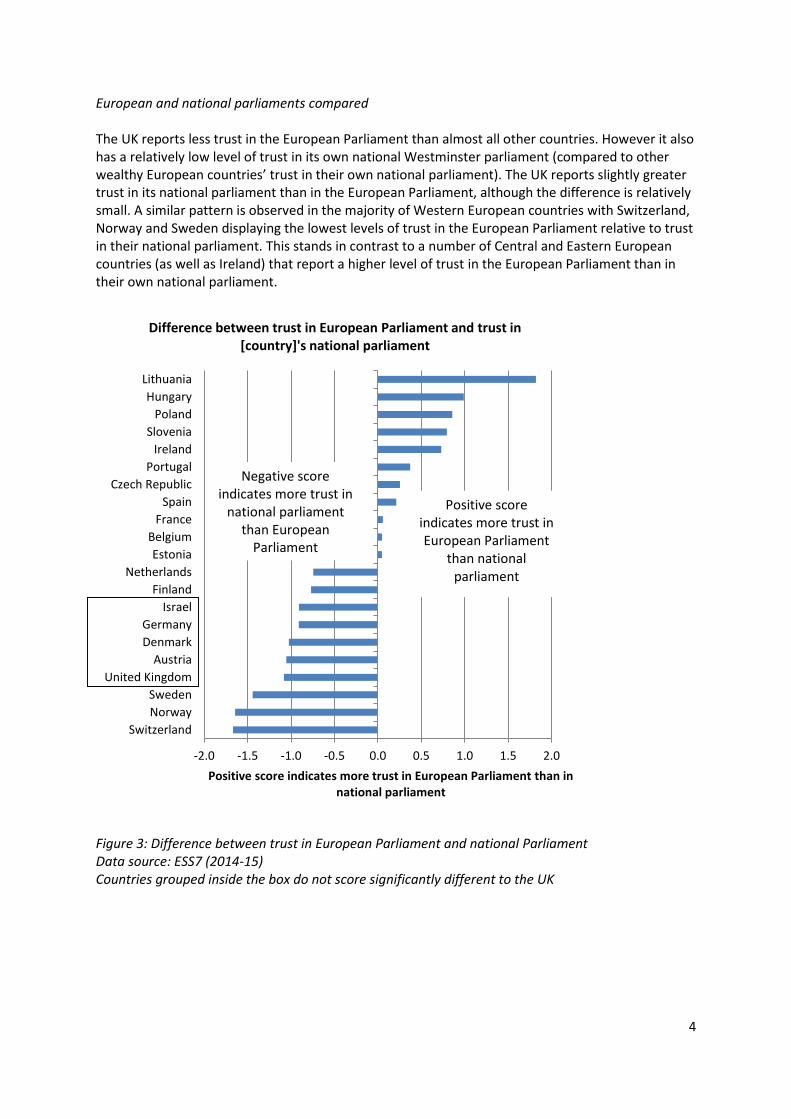
European and national parliaments compared The UK reports less trust in the European Parliament than almost all other countries. However it also has a relatively low level of trust in its own national Westminster parliament (compared to other wealthy European countries’ trust in their own national parliament). The UK reports slightly greater trust in its national parliament than in the European Parliament, although the difference is relatively small. A similar pattern is observed in the majority of Western European countries with Switzerland, Norway and Sweden displaying the lowest levels of trust in the European Parliament relative to trust in their national parliament. This stands in contrast to a number of Central and Eastern European countries (as well as Ireland) that report a higher level of trust in the European Parliament than in their own national parliament.
Figure 3: Difference between trust in European Parliament and national Parliament Data source: ESS7 (2014-15) Countries grouped inside the box do not score significantly different to the UK
-2.0 -1.5 -1.0 -0.5 0.0 0.5 1.0 1.5 2.0
Switzerland
Norway
Sweden
United Kingdom
Austria
Denmark
Germany
Israel
Finland
Netherlands
Estonia
Belgium
France
Spain
Czech Republic
Portugal
Ireland
Slovenia
Poland
Hungary
Lithuania
Positive score indicates more trust in European Parliament than in national parliament
Difference between trust in European Parliament and trust in [country]'s national parliament
Positive score indicates more trust in European Parliament
than national parliament
Negative score indicates more trust in
national parliament than European
Parliament
5
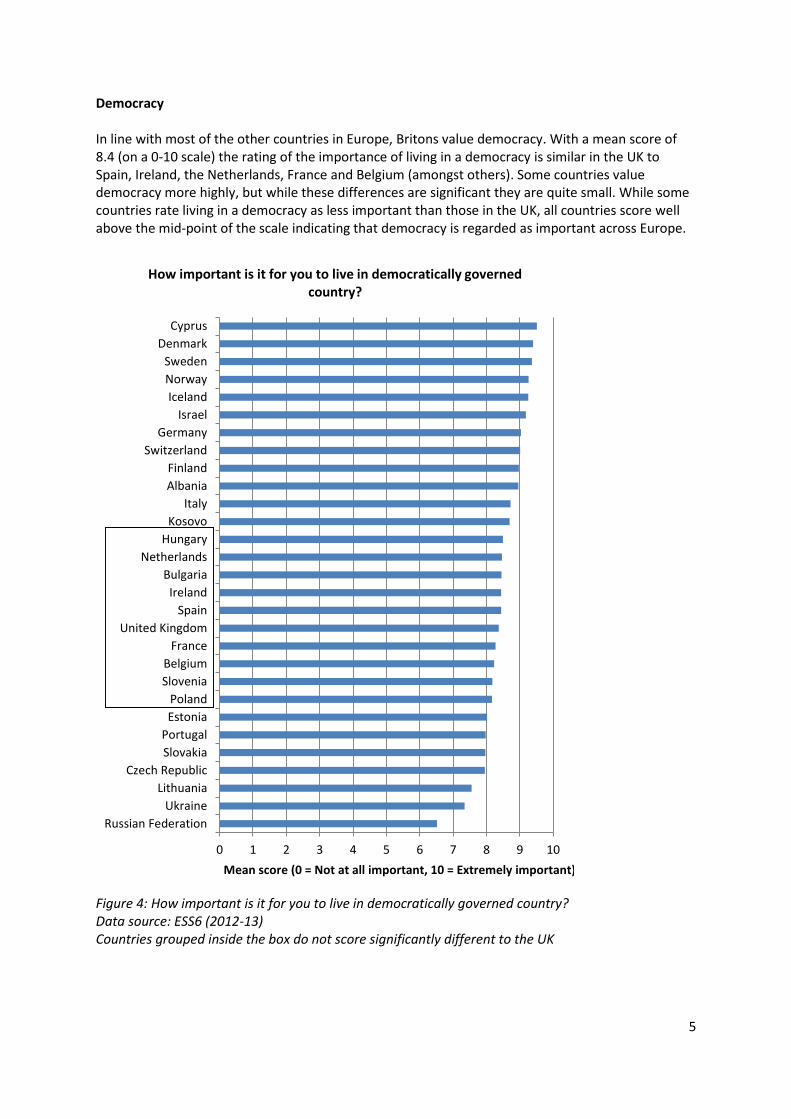
Democracy In line with most of the other countries in Europe, Britons value democracy. With a mean score of 8.4 (on a 0-10 scale) the rating of the importance of living in a democracy is similar in the UK to Spain, Ireland, the Netherlands, France and Belgium (amongst others). Some countries value democracy more highly, but while these differences are significant they are quite small. While some countries rate living in a democracy as less important than those in the UK, all countries score well above the mid-point of the scale indicating that democracy is regarded as important across Europe.
Figure 4: How important is it for you to live in democratically governed country? Data source: ESS6 (2012-13) Countries grouped inside the box do not score significantly different to the UK
0 1 2 3 4 5 6 7 8 9 10
Russian Federation
Ukraine
Lithuania
Czech Republic
Slovakia
Portugal
Estonia
Poland
Slovenia
Belgium
France
United Kingdom
Spain
Ireland
Bulgaria
Netherlands
Hungary
Kosovo
Italy
Albania
Finland
Switzerland
Germany
Israel
Iceland
Norway
Sweden
Denmark
Cyprus
Mean score (0 = Not at all important, 10 = Extremely important)
How important is it for you to live in democratically governed country?
6
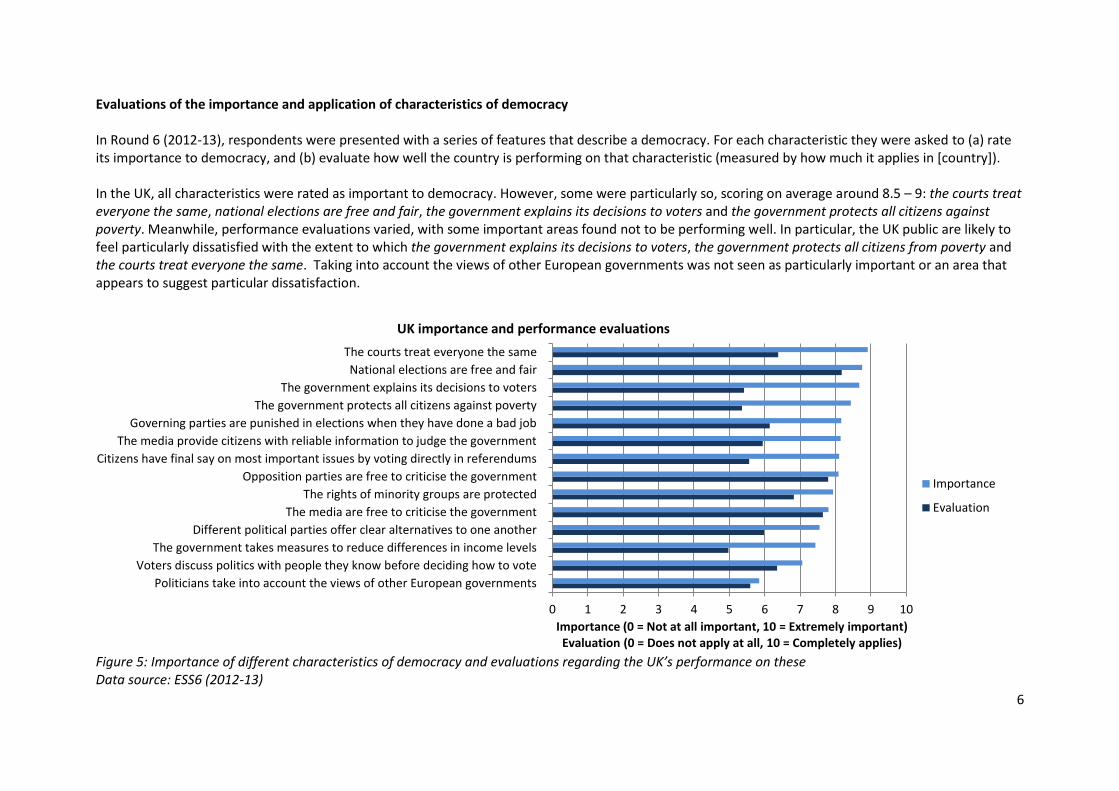
Evaluations of the importance and application of characteristics of democracy In Round 6 (2012-13), respondents were presented with a series of features that describe a democracy. For each characteristic they were asked to (a) rate its importance to democracy, and (b) evaluate how well the country is performing on that characteristic (measured by how much it applies in [country]). In the UK, all characteristics were rated as important to democracy. However, some were particularly so, scoring on average around 8.5 – 9: the courts treat everyone the same, national elections are free and fair, the government explains its decisions to voters and the government protects all citizens against poverty. Meanwhile, performance evaluations varied, with some important areas found not to be performing well. In particular, the UK public are likely to feel particularly dissatisfied with the extent to which the government explains its decisions to voters, the government protects all citizens from poverty and the courts treat everyone the same. Taking into account the views of other European governments was not seen as particularly important or an area that appears to suggest particular dissatisfaction.
Figure 5: Importance of different characteristics of democracy and evaluations regarding the UK’s performance on these Data source: ESS6 (2012-13)
0 1 2 3 4 5 6 7 8 9 10
Politicians take into account the views of other European governments
Voters discuss politics with people they know before deciding how to vote
The government takes measures to reduce differences in income levels
Different political parties offer clear alternatives to one another
The media are free to criticise the government
The rights of minority groups are protected
Opposition parties are free to criticise the government
Citizens have final say on most important issues by voting directly in referendums
The media provide citizens with reliable information to judge the government
Governing parties are punished in elections when they have done a bad job
The government protects all citizens against poverty
The government explains its decisions to voters
National elections are free and fair
The courts treat everyone the same
Importance (0 = Not at all important, 10 = Extremely important) Evaluation (0 = Does not apply at all, 10 = Completely applies)
UK importance and performance evaluations
Importance
Evaluation
7
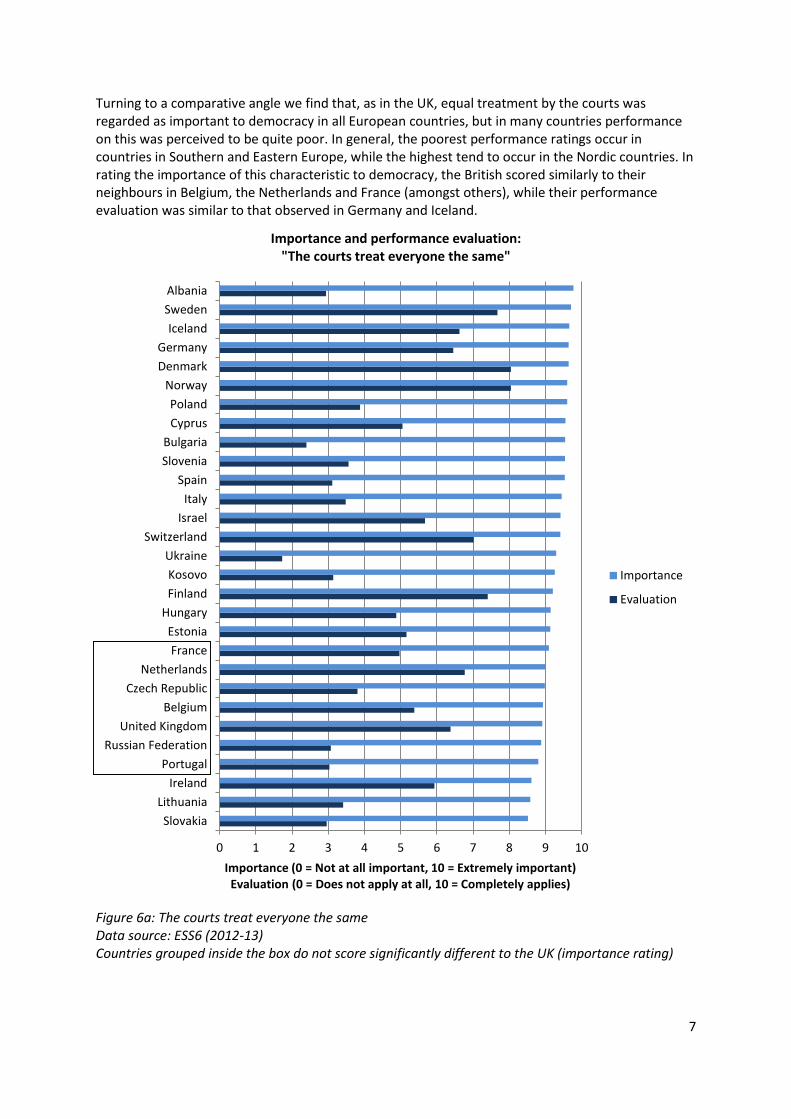
Turning to a comparative angle we find that, as in the UK, equal treatment by the courts was regarded as important to democracy in all European countries, but in many countries performance on this was perceived to be quite poor. In general, the poorest performance ratings occur in countries in Southern and Eastern Europe, while the highest tend to occur in the Nordic countries. In rating the importance of this characteristic to democracy, the British scored similarly to their neighbours in Belgium, the Netherlands and France (amongst others), while their performance evaluation was similar to that observed in Germany and Iceland.
Figure 6a: The courts treat everyone the same Data source: ESS6 (2012-13) Countries grouped inside the box do not score significantly different to the UK (importance rating)
0 1 2 3 4 5 6 7 8 9 10
Slovakia
Lithuania
Ireland
Portugal
Russian Federation
United Kingdom
Belgium
Czech Republic
Netherlands
France
Estonia
Hungary
Finland
Kosovo
Ukraine
Switzerland
Israel
Italy
Spain
Slovenia
Bulgaria
Cyprus
Poland
Norway
Denmark
Germany
Iceland
Sweden
Albania
Importance (0 = Not at all important, 10 = Extremely important) Evaluation (0 = Does not apply at all, 10 = Completely applies)
Importance and performance evaluation: "The courts treat everyone the same"
Importance
Evaluation
8
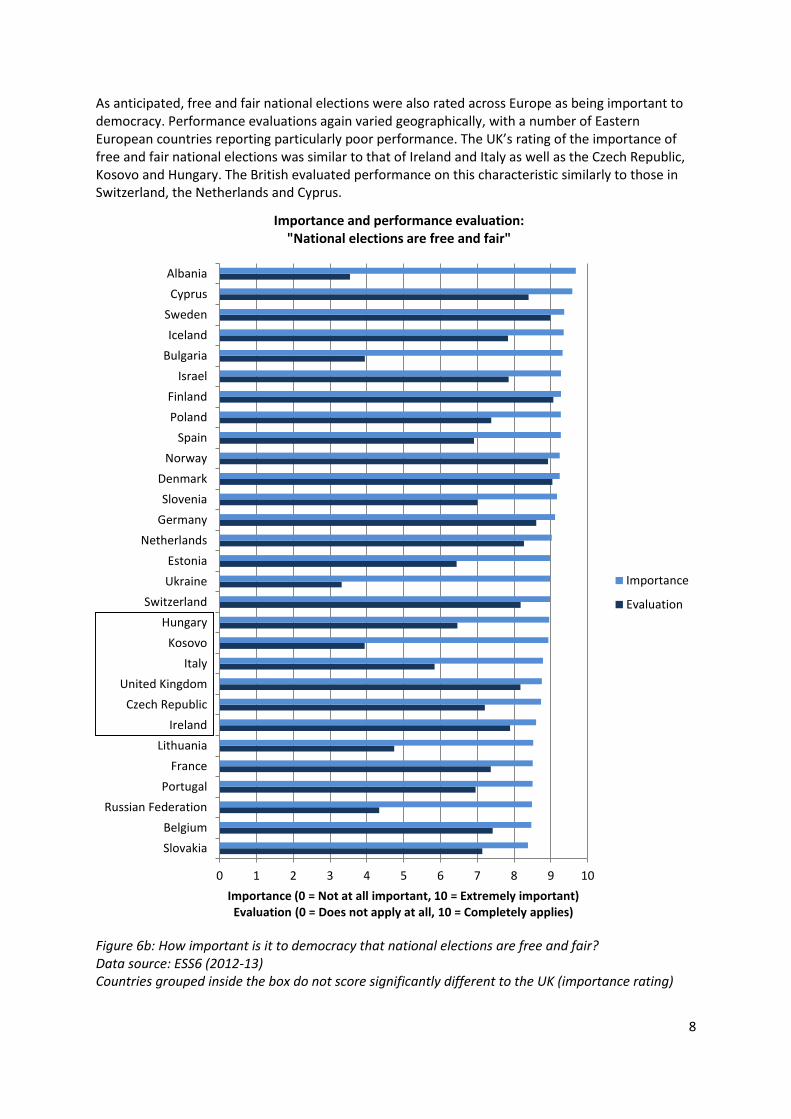
As anticipated, free and fair national elections were also rated across Europe as being important to democracy. Performance evaluations again varied geographically, with a number of Eastern European countries reporting particularly poor performance. The UK’s rating of the importance of free and fair national elections was similar to that of Ireland and Italy as well as the Czech Republic, Kosovo and Hungary. The British evaluated performance on this characteristic similarly to those in Switzerland, the Netherlands and Cyprus.
Figure 6b: How important is it to democracy that national elections are free and fair? Data source: ESS6 (2012-13) Countries grouped inside the box do not score significantly different to the UK (importance rating)
0 1 2 3 4 5 6 7 8 9 10
Slovakia
Belgium
Russian Federation
Portugal
France
Lithuania
Ireland
Czech Republic
United Kingdom
Italy
Kosovo
Hungary
Switzerland
Ukraine
Estonia
Netherlands
Germany
Slovenia
Denmark
Norway
Spain
Poland
Finland
Israel
Bulgaria
Iceland
Sweden
Cyprus
Albania
Importance (0 = Not at all important, 10 = Extremely important) Evaluation (0 = Does not apply at all, 10 = Completely applies)
Importance and performance evaluation: "National elections are free and fair"
Importance
Evaluation
9
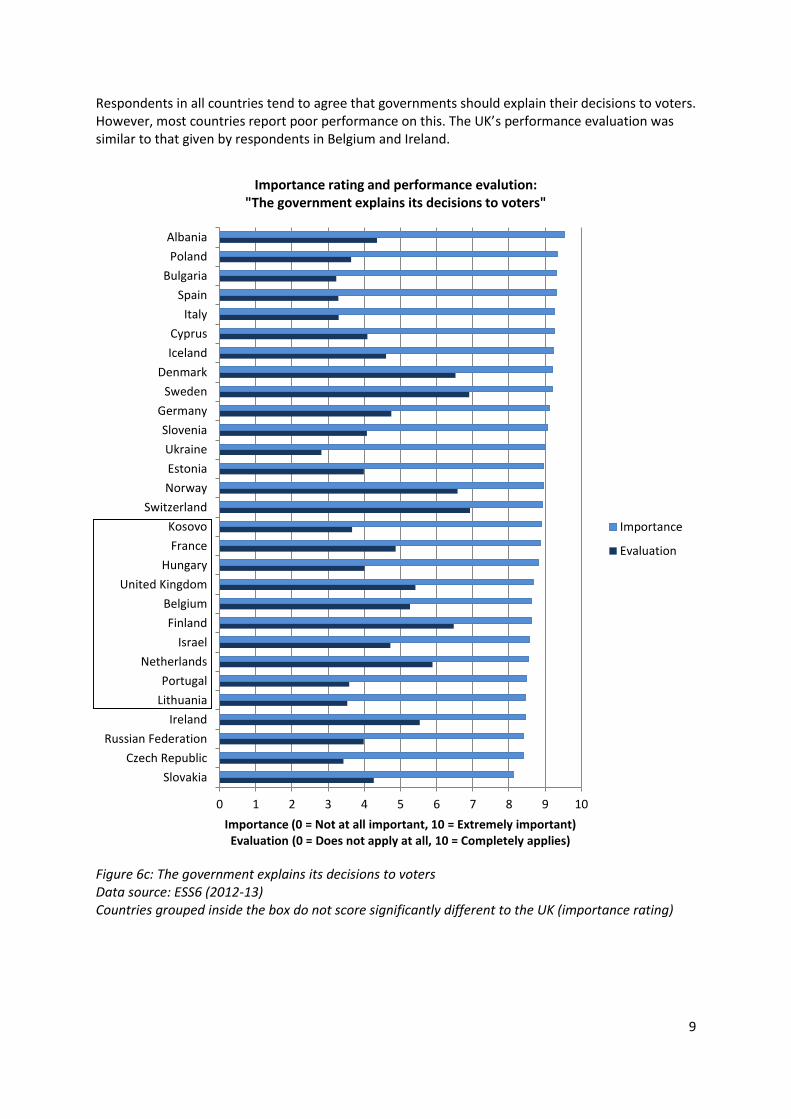
Respondents in all countries tend to agree that governments should explain their decisions to voters. However, most countries report poor performance on this. The UK’s performance evaluation was similar to that given by respondents in Belgium and Ireland.
Figure 6c: The government explains its decisions to voters Data source: ESS6 (2012-13) Countries grouped inside the box do not score significantly different to the UK (importance rating)
0 1 2 3 4 5 6 7 8 9 10
Slovakia
Czech Republic
Russian Federation
Ireland
Lithuania
Portugal
Netherlands
Israel
Finland
Belgium
United Kingdom
Hungary
France
Kosovo
Switzerland
Norway
Estonia
Ukraine
Slovenia
Germany
Sweden
Denmark
Iceland
Cyprus
Italy
Spain
Bulgaria
Poland
Albania
Importance (0 = Not at all important, 10 = Extremely important) Evaluation (0 = Does not apply at all, 10 = Completely applies)
Importance rating and performance evalution: "The government explains its decisions to voters"
Importance
Evaluation
10
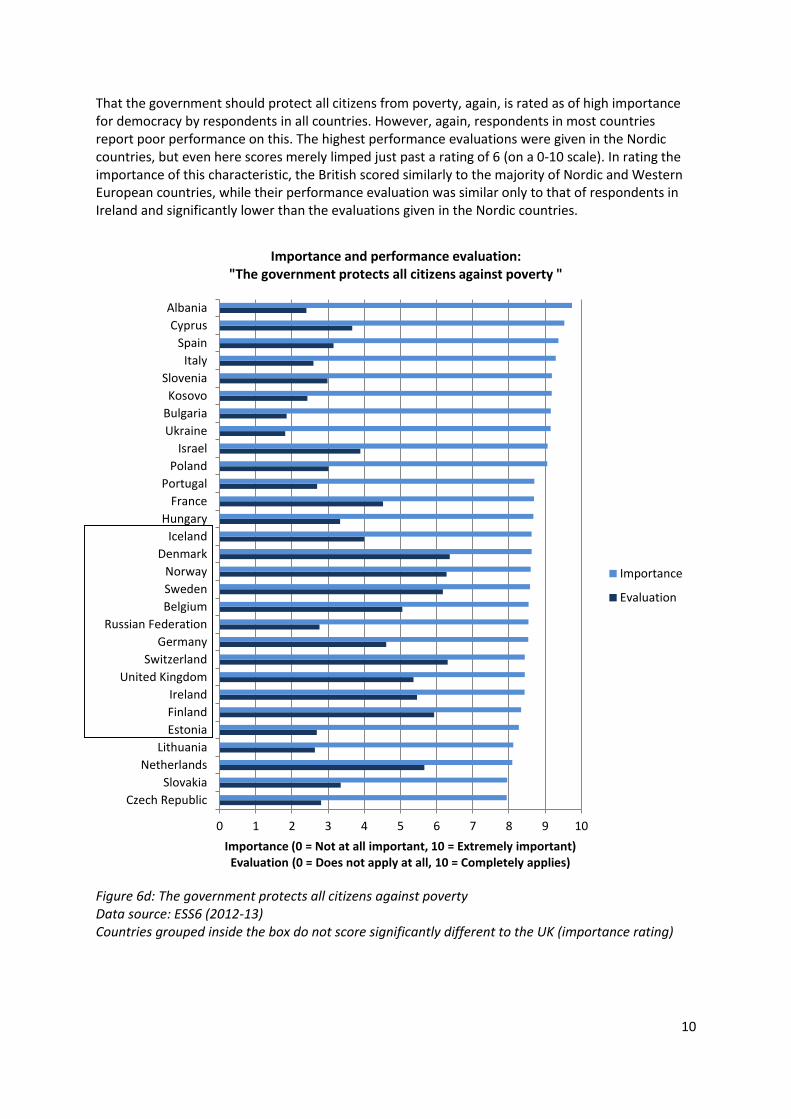
That the government should protect all citizens from poverty, again, is rated as of high importance for democracy by respondents in all countries. However, again, respondents in most countries report poor performance on this. The highest performance evaluations were given in the Nordic countries, but even here scores merely limped just past a rating of 6 (on a 0-10 scale). In rating the importance of this characteristic, the British scored similarly to the majority of Nordic and Western European countries, while their performance evaluation was similar only to that of respondents in Ireland and significantly lower than the evaluations given in the Nordic countries.
Figure 6d: The government protects all citizens against poverty Data source: ESS6 (2012-13) Countries grouped inside the box do not score significantly different to the UK (importance rating)
0 1 2 3 4 5 6 7 8 9 10
Czech Republic
Slovakia
Netherlands
Lithuania
Estonia
Finland
Ireland
United Kingdom
Switzerland
Germany
Russian Federation
Belgium
Sweden
Norway
Denmark
Iceland
Hungary
France
Portugal
Poland
Israel
Ukraine
Bulgaria
Kosovo
Slovenia
Italy
Spain
Cyprus
Albania
Importance (0 = Not at all important, 10 = Extremely important) Evaluation (0 = Does not apply at all, 10 = Completely applies)
Importance and performance evaluation: "The government protects all citizens against poverty "
Importance
Evaluation
11
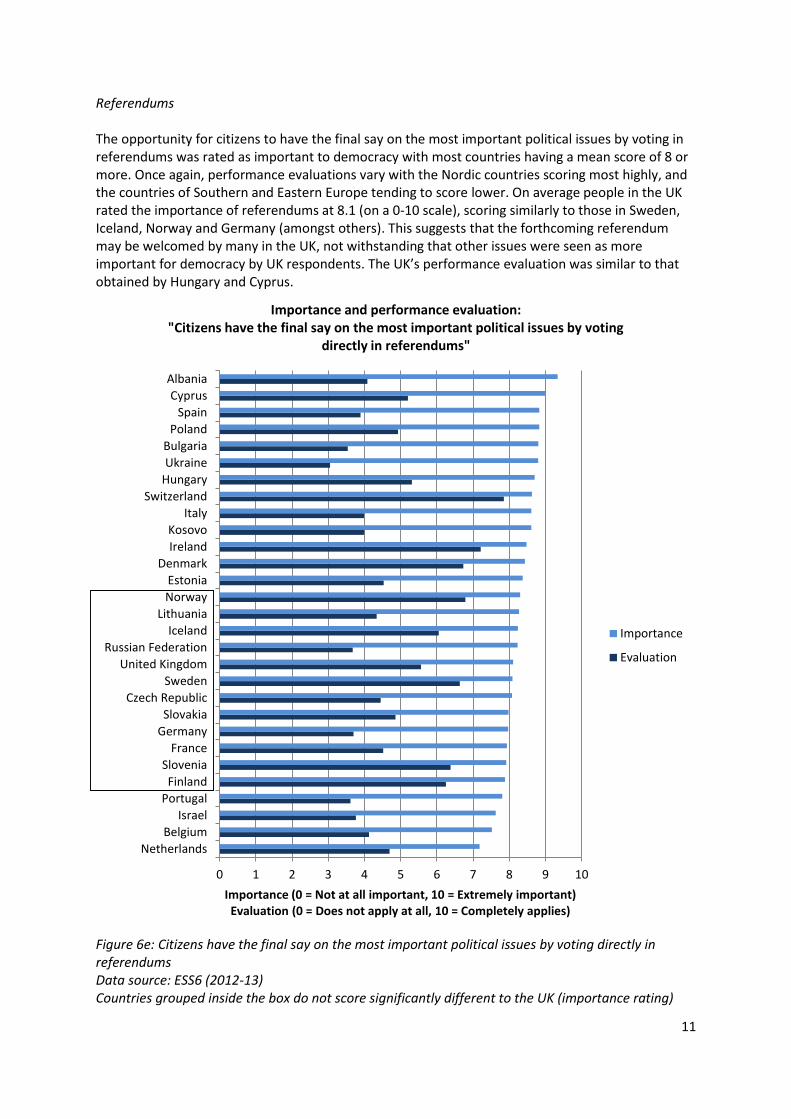
Referendums The opportunity for citizens to have the final say on the most important political issues by voting in referendums was rated as important to democracy with most countries having a mean score of 8 or more. Once again, performance evaluations vary with the Nordic countries scoring most highly, and the countries of Southern and Eastern Europe tending to score lower. On average people in the UK rated the importance of referendums at 8.1 (on a 0-10 scale), scoring similarly to those in Sweden, Iceland, Norway and Germany (amongst others). This suggests that the forthcoming referendum may be welcomed by many in the UK, not withstanding that other issues were seen as more important for democracy by UK respondents. The UK’s performance evaluation was similar to that obtained by Hungary and Cyprus.
Figure 6e: Citizens have the final say on the most important political issues by voting directly in referendums Data source: ESS6 (2012-13) Countries grouped inside the box do not score significantly different to the UK (importance rating)
0 1 2 3 4 5 6 7 8 9 10
Netherlands
Belgium
Israel
Portugal
Finland
Slovenia
France
Germany
Slovakia
Czech Republic
Sweden
United Kingdom
Russian Federation
Iceland
Lithuania
Norway
Estonia
Denmark
Ireland
Kosovo
Italy
Switzerland
Hungary
Ukraine
Bulgaria
Poland
Spain
Cyprus
Albania
Importance (0 = Not at all important, 10 = Extremely important) Evaluation (0 = Does not apply at all, 10 = Completely applies)
Importance and performance evaluation: "Citizens have the final say on the most important political issues by voting
directly in referendums"
Importance
Evaluation
12
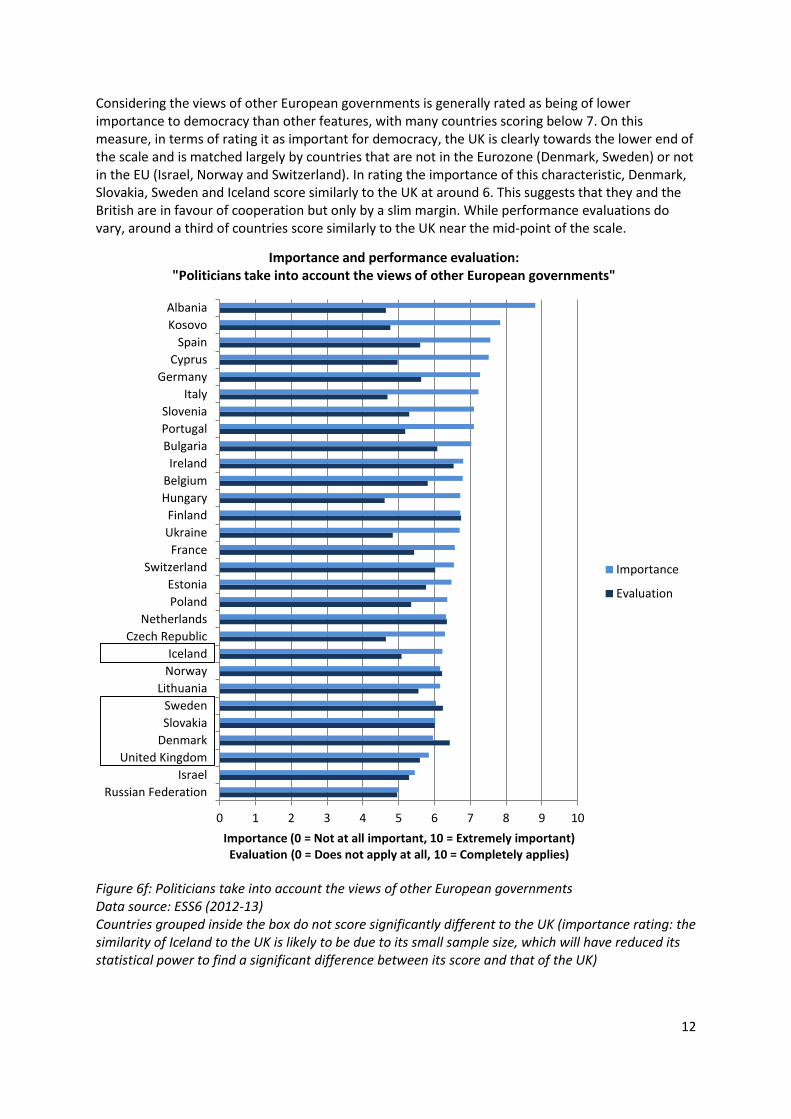
Considering the views of other European governments is generally rated as being of lower importance to democracy than other features, with many countries scoring below 7. On this measure, in terms of rating it as important for democracy, the UK is clearly towards the lower end of the scale and is matched largely by countries that are not in the Eurozone (Denmark, Sweden) or not in the EU (Israel, Norway and Switzerland). In rating the importance of this characteristic, Denmark, Slovakia, Sweden and Iceland score similarly to the UK at around 6. This suggests that they and the British are in favour of cooperation but only by a slim margin. While performance evaluations do vary, around a third of countries score similarly to the UK near the mid-point of the scale.
Figure 6f: Politicians take into account the views of other European governments Data source: ESS6 (2012-13) Countries grouped inside the box do not score significantly different to the UK (importance rating: the similarity of Iceland to the UK is likely to be due to its small sample size, which will have reduced its statistical power to find a significant difference between its score and that of the UK)
0 1 2 3 4 5 6 7 8 9 10
Russian Federation
Israel
United Kingdom
Denmark
Slovakia
Sweden
Lithuania
Norway
Iceland
Czech Republic
Netherlands
Poland
Estonia
Switzerland
France
Ukraine
Finland
Hungary
Belgium
Ireland
Bulgaria
Portugal
Slovenia
Italy
Germany
Cyprus
Spain
Kosovo
Albania
Importance (0 = Not at all important, 10 = Extremely important) Evaluation (0 = Does not apply at all, 10 = Completely applies)
Importance and performance evaluation: "Politicians take into account the views of other European governments"
Importance
Evaluation
13
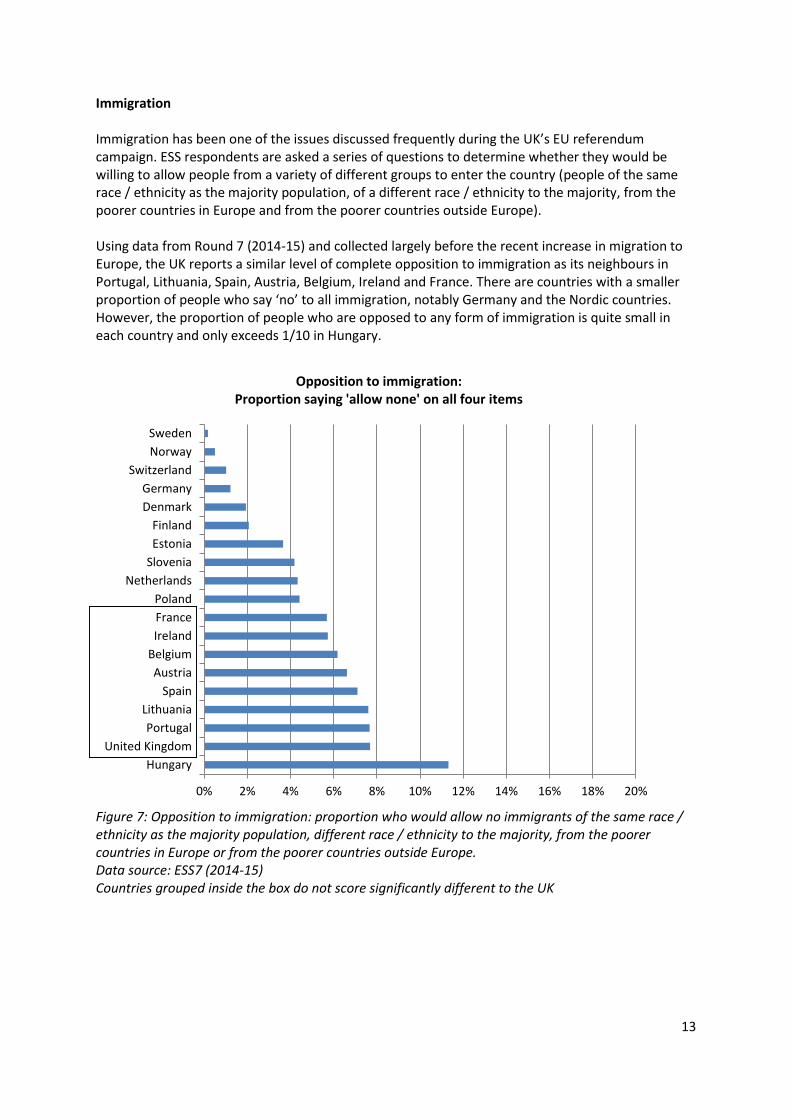
Immigration Immigration has been one of the issues discussed frequently during the UK’s EU referendum campaign. ESS respondents are asked a series of questions to determine whether they would be willing to allow people from a variety of different groups to enter the country (people of the same race / ethnicity as the majority population, of a different race / ethnicity to the majority, from the poorer countries in Europe and from the poorer countries outside Europe). Using data from Round 7 (2014-15) and collected largely before the recent increase in migration to Europe, the UK reports a similar level of complete opposition to immigration as its neighbours in Portugal, Lithuania, Spain, Austria, Belgium, Ireland and France. There are countries with a smaller proportion of people who say ‘no’ to all immigration, notably Germany and the Nordic countries. However, the proportion of people who are opposed to any form of immigration is quite small in each country and only exceeds 1/10 in Hungary.
Figure 7: Opposition to immigration: proportion who would allow no immigrants of the same race / ethnicity as the majority population, different race / ethnicity to the majority, from the poorer countries in Europe or from the poorer countries outside Europe. Data source: ESS7 (2014-15) Countries grouped inside the box do not score significantly different to the UK
0% 2% 4% 6% 8% 10% 12% 14% 16% 18% 20%
Hungary
United Kingdom
Portugal
Lithuania
Spain
Austria
Belgium
Ireland
France
Poland
Netherlands
Slovenia
Estonia
Finland
Denmark
Germany
Switzerland
Norway
Sweden
Opposition to immigration: Proportion saying 'allow none' on all four items
14
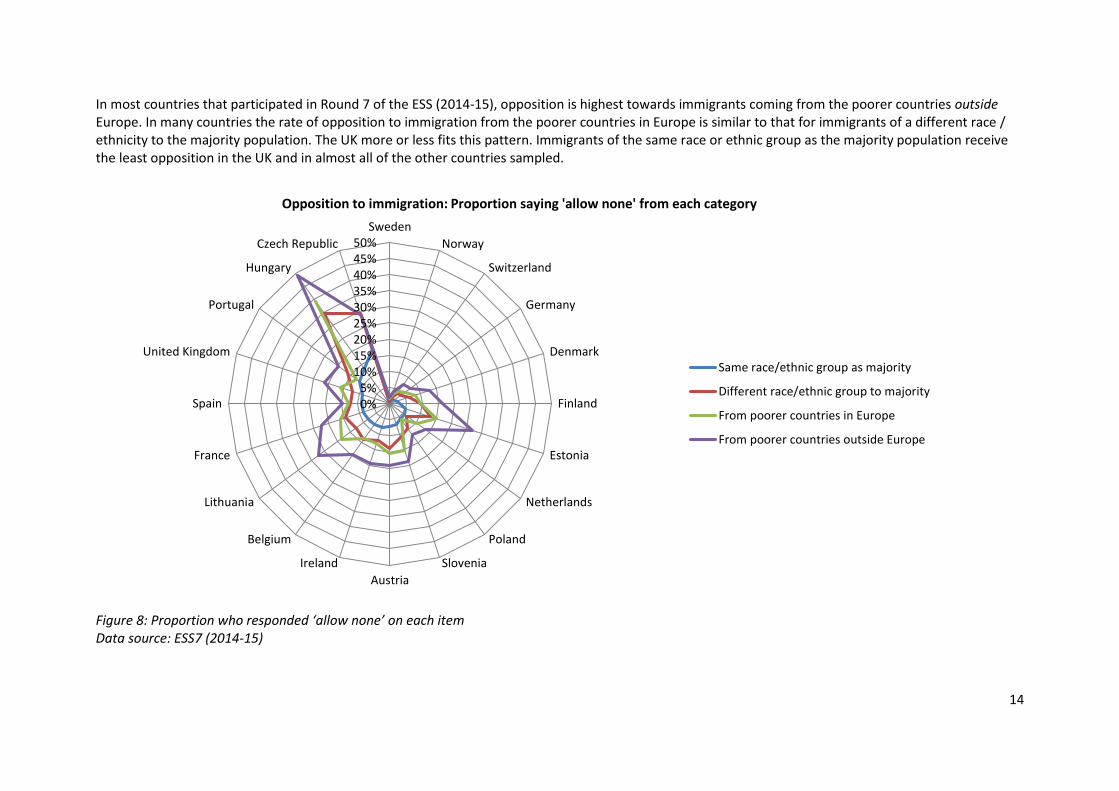
In most countries that participated in Round 7 of the ESS (2014-15), opposition is highest towards immigrants coming from the poorer countries outside Europe. In many countries the rate of opposition to immigration from the poorer countries in Europe is similar to that for immigrants of a different race / ethnicity to the majority population. The UK more or less fits this pattern. Immigrants of the same race or ethnic group as the majority population receive the least opposition in the UK and in almost all of the other countries sampled.
Figure 8: Proportion who responded ‘allow none’ on each item Data source: ESS7 (2014-15)
0%5%
10%15%20%25%30%35%40%45%50%
Sweden
Norway
Switzerland
Germany
Denmark
Finland
Estonia
Netherlands
Poland
Slovenia
Austria
Ireland
Belgium
Lithuania
France
Spain
United Kingdom
Portugal
Hungary
Czech Republic
Opposition to immigration: Proportion saying 'allow none' from each category
Same race/ethnic group as majority
Different race/ethnic group to majority
From poorer countries in Europe
From poorer countries outside Europe
15
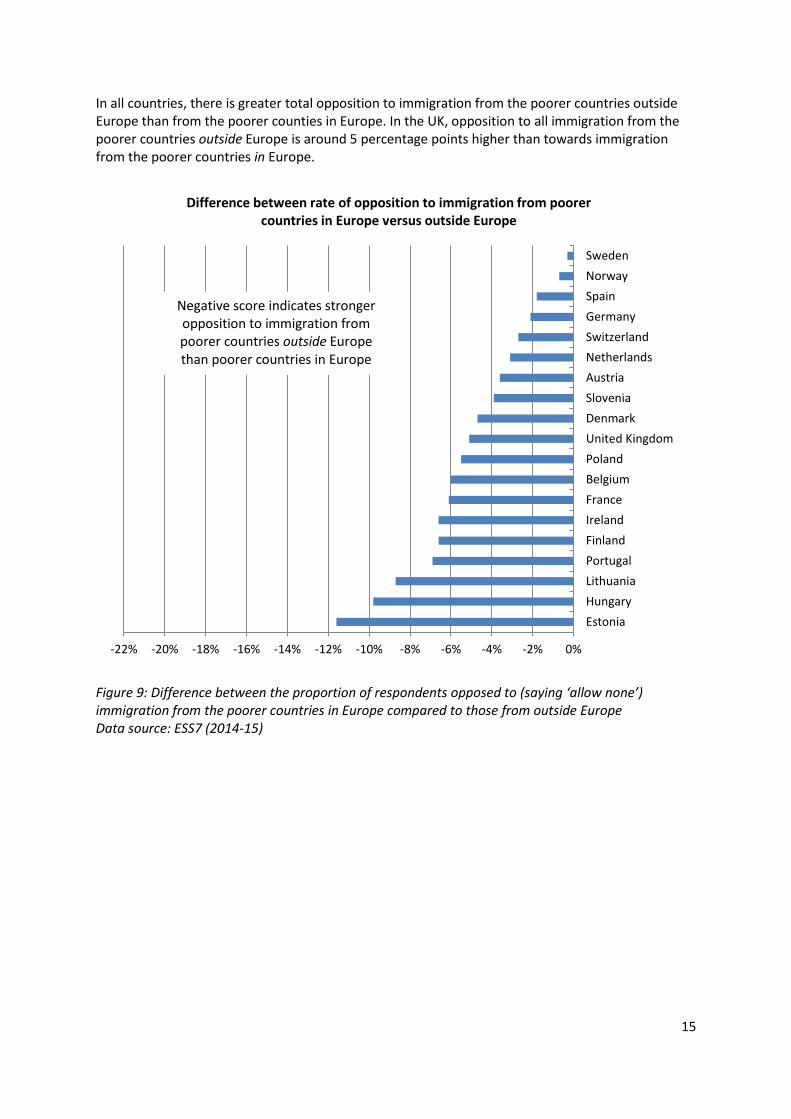
In all countries, there is greater total opposition to immigration from the poorer countries outside Europe than from the poorer counties in Europe. In the UK, opposition to all immigration from the poorer countries outside Europe is around 5 percentage points higher than towards immigration from the poorer countries in Europe.
Figure 9: Difference between the proportion of respondents opposed to (saying ‘allow none’) immigration from the poorer countries in Europe compared to those from outside Europe Data source: ESS7 (2014-15)
-22% -20% -18% -16% -14% -12% -10% -8% -6% -4% -2% 0%
Estonia
Hungary
Lithuania
Portugal
Finland
Ireland
France
Belgium
Poland
United Kingdom
Denmark
Slovenia
Austria
Netherlands
Switzerland
Germany
Spain
Norway
Sweden
Difference between rate of opposition to immigration from poorer countries in Europe versus outside Europe
Negative score indicates stronger opposition to immigration from poorer countries outside Europe than poorer countries in Europe
16
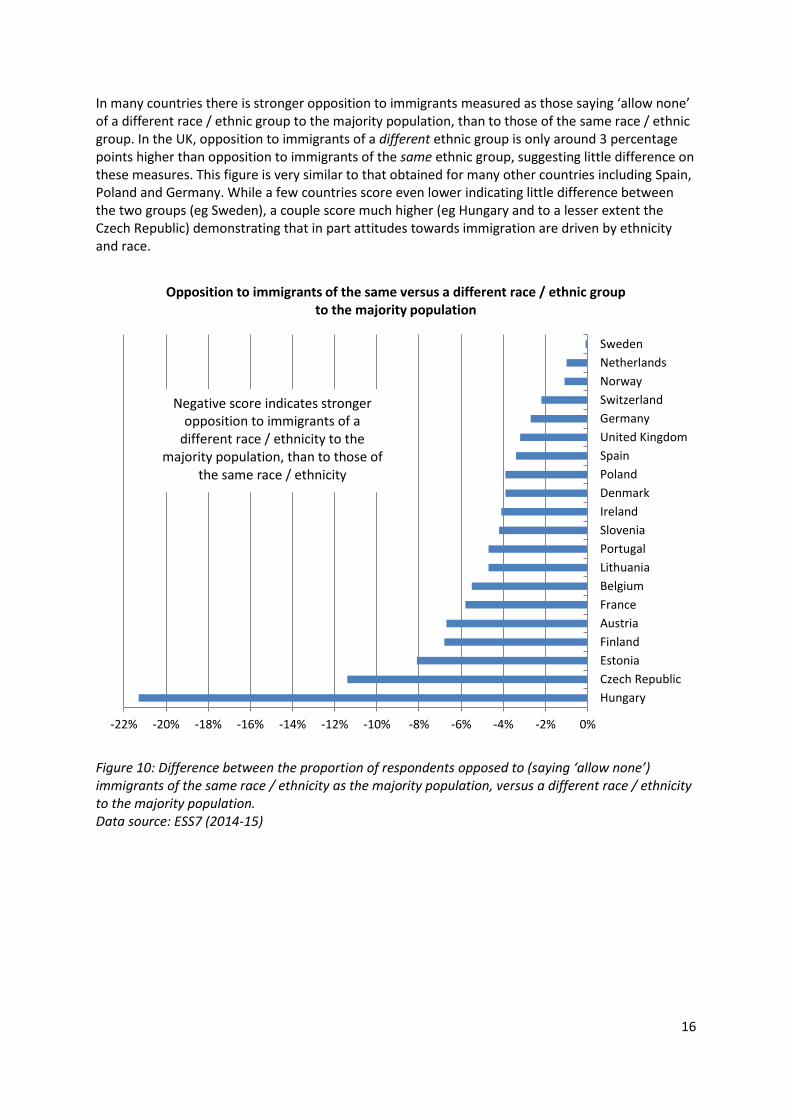
In many countries there is stronger opposition to immigrants measured as those saying ‘allow none’ of a different race / ethnic group to the majority population, than to those of the same race / ethnic group. In the UK, opposition to immigrants of a different ethnic group is only around 3 percentage points higher than opposition to immigrants of the same ethnic group, suggesting little difference on these measures. This figure is very similar to that obtained for many other countries including Spain, Poland and Germany. While a few countries score even lower indicating little difference between the two groups (eg Sweden), a couple score much higher (eg Hungary and to a lesser extent the Czech Republic) demonstrating that in part attitudes towards immigration are driven by ethnicity and race.
Figure 10: Difference between the proportion of respondents opposed to (saying ‘allow none’) immigrants of the same race / ethnicity as the majority population, versus a different race / ethnicity to the majority population. Data source: ESS7 (2014-15)
-22% -20% -18% -16% -14% -12% -10% -8% -6% -4% -2% 0%
Hungary
Czech Republic
Estonia
Finland
Austria
France
Belgium
Lithuania
Portugal
Slovenia
Ireland
Denmark
Poland
Spain
United Kingdom
Germany
Switzerland
Norway
Netherlands
Sweden
Opposition to immigrants of the same versus a different race / ethnic group to the majority population
Negative score indicates stronger opposition to immigrants of a
different race / ethnicity to the majority population, than to those of
the same race / ethnicity

17
Welfare and immigration Looking at data from Round 4 of the survey (2008-9), which included detailed questions on welfare, we see that the UK features within the group of countries most likely to say that the welfare system is a draw to immigrants. Only respondents in Germany were more likely than those in the UK to say that ‘social benefits encourage people to come and live here’. Having said that, people in the UK were slightly more likely to agree strongly with this statement than those in Germany (not shown in Figure 11).
Figure 11: Social benefits / services encourage people from other countries to come and live here (% agree or strongly agree) Data source: ESS4 (2008-9) Countries grouped inside the box do not score significantly different to the UK
0% 10% 20% 30% 40% 50% 60% 70% 80% 90%
Germany
Ireland
United Kingdom
France
Norway
Switzerland
Spain
Denmark
Cyprus
Finland
Belgium
Netherlands
Sweden
Greece
Czech Republic
Portugal
Slovenia
Turkey
Croatia
Romania
Poland
Hungary
Slovakia
Russian Federation
Estonia
Ukraine
Latvia
Bulgaria
Proportion agreeing that 'social benefits / services encourage people from other countries to come and live here'
18
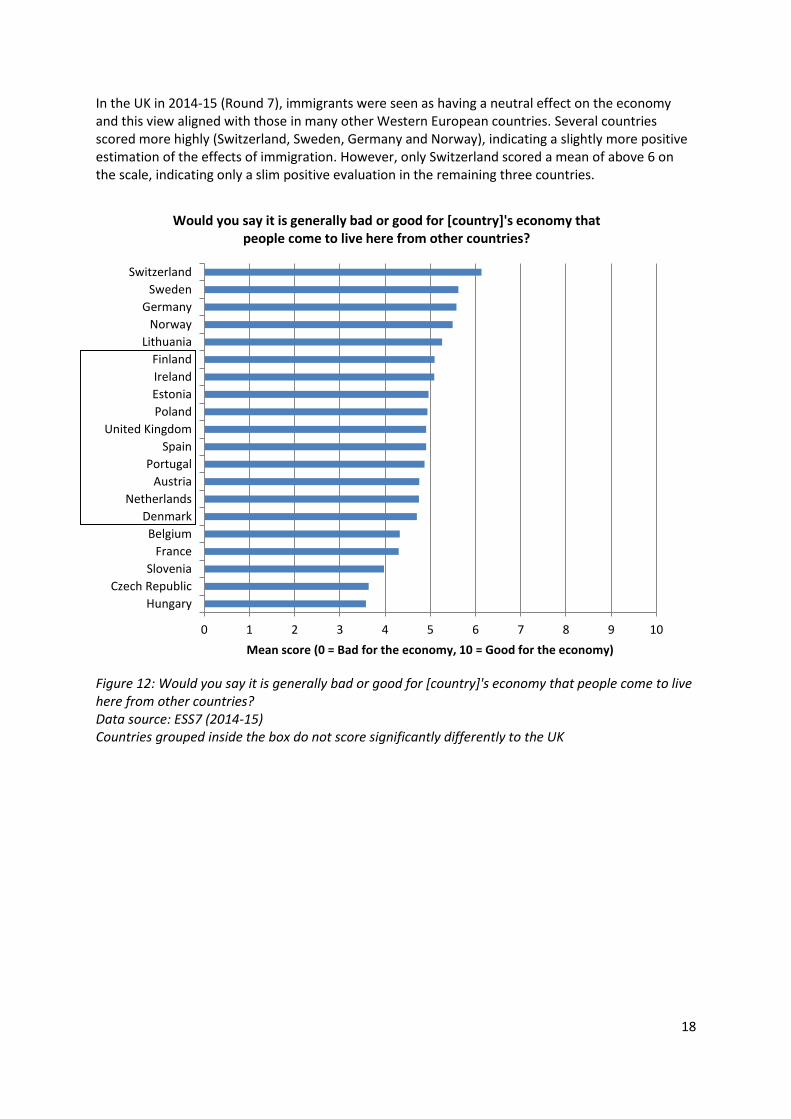
In the UK in 2014-15 (Round 7), immigrants were seen as having a neutral effect on the economy and this view aligned with those in many other Western European countries. Several countries scored more highly (Switzerland, Sweden, Germany and Norway), indicating a slightly more positive estimation of the effects of immigration. However, only Switzerland scored a mean of above 6 on the scale, indicating only a slim positive evaluation in the remaining three countries.
Figure 12: Would you say it is generally bad or good for [country]'s economy that people come to live here from other countries? Data source: ESS7 (2014-15) Countries grouped inside the box do not score significantly differently to the UK
0 1 2 3 4 5 6 7 8 9 10
Hungary
Czech Republic
Slovenia
France
Belgium
Denmark
Netherlands
Austria
Portugal
Spain
United Kingdom
Poland
Estonia
Ireland
Finland
Lithuania
Norway
Germany
Sweden
Switzerland
Mean score (0 = Bad for the economy, 10 = Good for the economy)
Would you say it is generally bad or good for [country]'s economy that people come to live here from other countries?
19
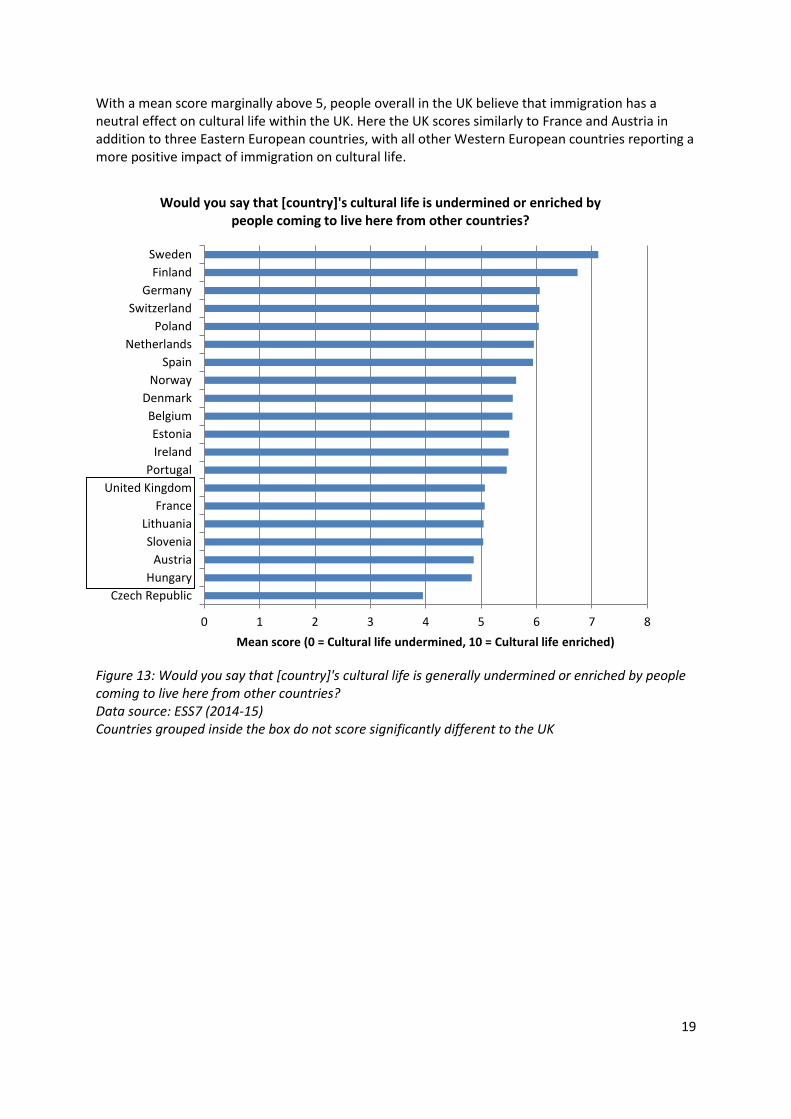
With a mean score marginally above 5, people overall in the UK believe that immigration has a neutral effect on cultural life within the UK. Here the UK scores similarly to France and Austria in addition to three Eastern European countries, with all other Western European countries reporting a more positive impact of immigration on cultural life.
Figure 13: Would you say that [country]'s cultural life is generally undermined or enriched by people coming to live here from other countries? Data source: ESS7 (2014-15) Countries grouped inside the box do not score significantly different to the UK
0 1 2 3 4 5 6 7 8
Czech Republic
Hungary
Austria
Slovenia
Lithuania
France
United Kingdom
Portugal
Ireland
Estonia
Belgium
Denmark
Norway
Spain
Netherlands
Poland
Switzerland
Germany
Finland
Sweden
Mean score (0 = Cultural life undermined, 10 = Cultural life enriched)
Would you say that [country]'s cultural life is undermined or enriched by people coming to live here from other countries?
20
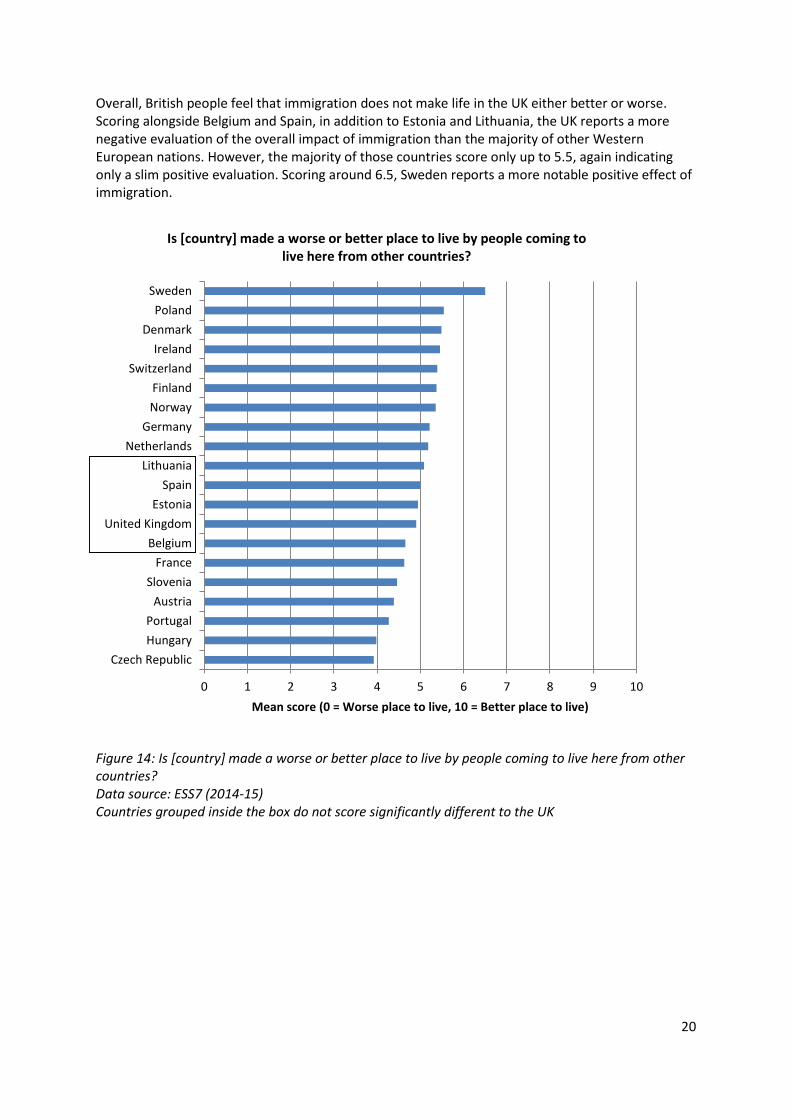
Overall, British people feel that immigration does not make life in the UK either better or worse. Scoring alongside Belgium and Spain, in addition to Estonia and Lithuania, the UK reports a more negative evaluation of the overall impact of immigration than the majority of other Western European nations. However, the majority of those countries score only up to 5.5, again indicating only a slim positive evaluation. Scoring around 6.5, Sweden reports a more notable positive effect of immigration.
Figure 14: Is [country] made a worse or better place to live by people coming to live here from other countries? Data source: ESS7 (2014-15) Countries grouped inside the box do not score significantly different to the UK
0 1 2 3 4 5 6 7 8 9 10
Czech Republic
Hungary
Portugal
Austria
Slovenia
France
Belgium
United Kingdom
Estonia
Spain
Lithuania
Netherlands
Germany
Norway
Finland
Switzerland
Ireland
Denmark
Poland
Sweden
Mean score (0 = Worse place to live, 10 = Better place to live)
Is [country] made a worse or better place to live by people coming to live here from other countries?
21
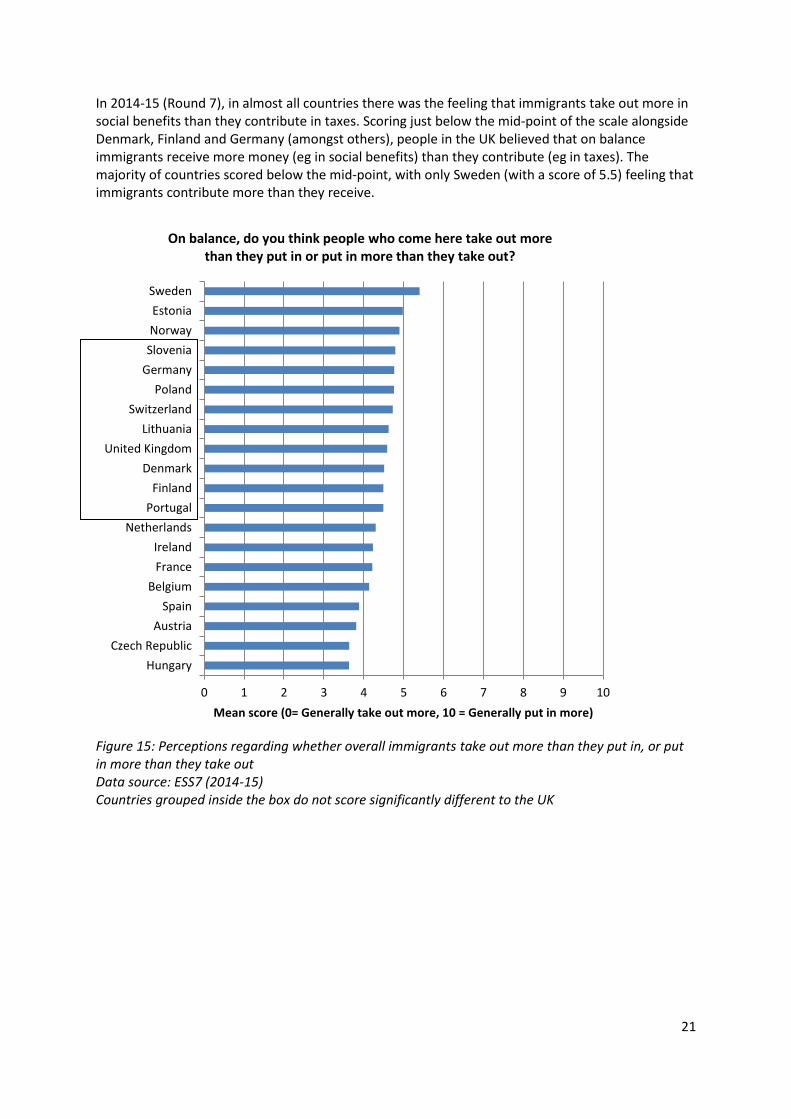
In 2014-15 (Round 7), in almost all countries there was the feeling that immigrants take out more in social benefits than they contribute in taxes. Scoring just below the mid-point of the scale alongside Denmark, Finland and Germany (amongst others), people in the UK believed that on balance immigrants receive more money (eg in social benefits) than they contribute (eg in taxes). The majority of countries scored below the mid-point, with only Sweden (with a score of 5.5) feeling that immigrants contribute more than they receive.
Figure 15: Perceptions regarding whether overall immigrants take out more than they put in, or put in more than they take out Data source: ESS7 (2014-15) Countries grouped inside the box do not score significantly different to the UK
0 1 2 3 4 5 6 7 8 9 10
Hungary
Czech Republic
Austria
Spain
Belgium
France
Ireland
Netherlands
Portugal
Finland
Denmark
United Kingdom
Lithuania
Switzerland
Poland
Germany
Slovenia
Norway
Estonia
Sweden
Mean score (0= Generally take out more, 10 = Generally put in more)
On balance, do you think people who come here take out more than they put in or put in more than they take out?
22
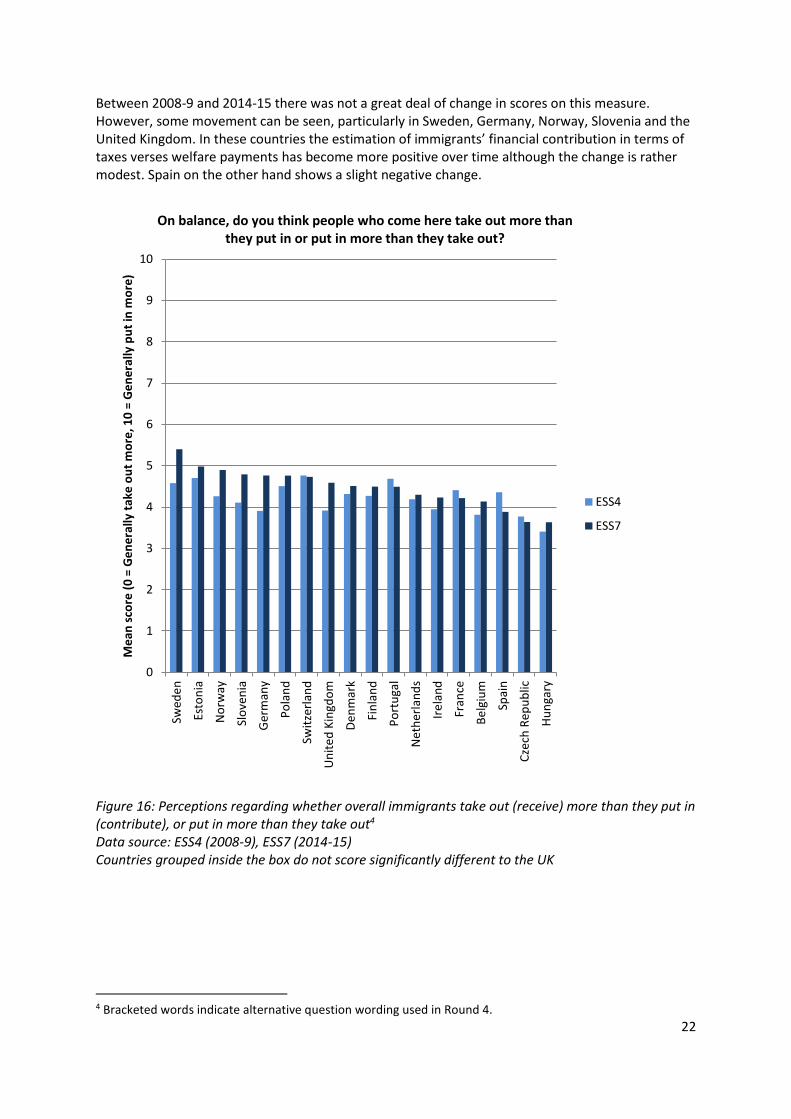
Between 2008-9 and 2014-15 there was not a great deal of change in scores on this measure. However, some movement can be seen, particularly in Sweden, Germany, Norway, Slovenia and the United Kingdom. In these countries the estimation of immigrants’ financial contribution in terms of taxes verses welfare payments has become more positive over time although the change is rather modest. Spain on the other hand shows a slight negative change.
Figure 16: Perceptions regarding whether overall immigrants take out (receive) more than they put in (contribute), or put in more than they take out4 Data source: ESS4 (2008-9), ESS7 (2014-15) Countries grouped inside the box do not score significantly different to the UK
4 Bracketed words indicate alternative question wording used in Round 4.
0
1
2
3
4
5
6
7
8
9
10
Swed
en
Esto
nia
No
rway
Slo
ven
ia
Ger
man
y
Po
lan
d
Swit
zerl
and
Un
ite
d K
ingd
om
De
nm
ark
Fin
lan
d
Po
rtu
gal
Net
her
lan
ds
Ire
lan
d
Fran
ce
Be
lgiu
m
Spai
n
Cze
ch R
epu
blic
Hu
nga
ry
Me
an s
core
(0
= G
en
era
lly t
ake
ou
t m
ore
, 10
= G
en
era
lly p
ut
in m
ore
)
On balance, do you think people who come here take out more than they put in or put in more than they take out?
ESS4
ESS7
23
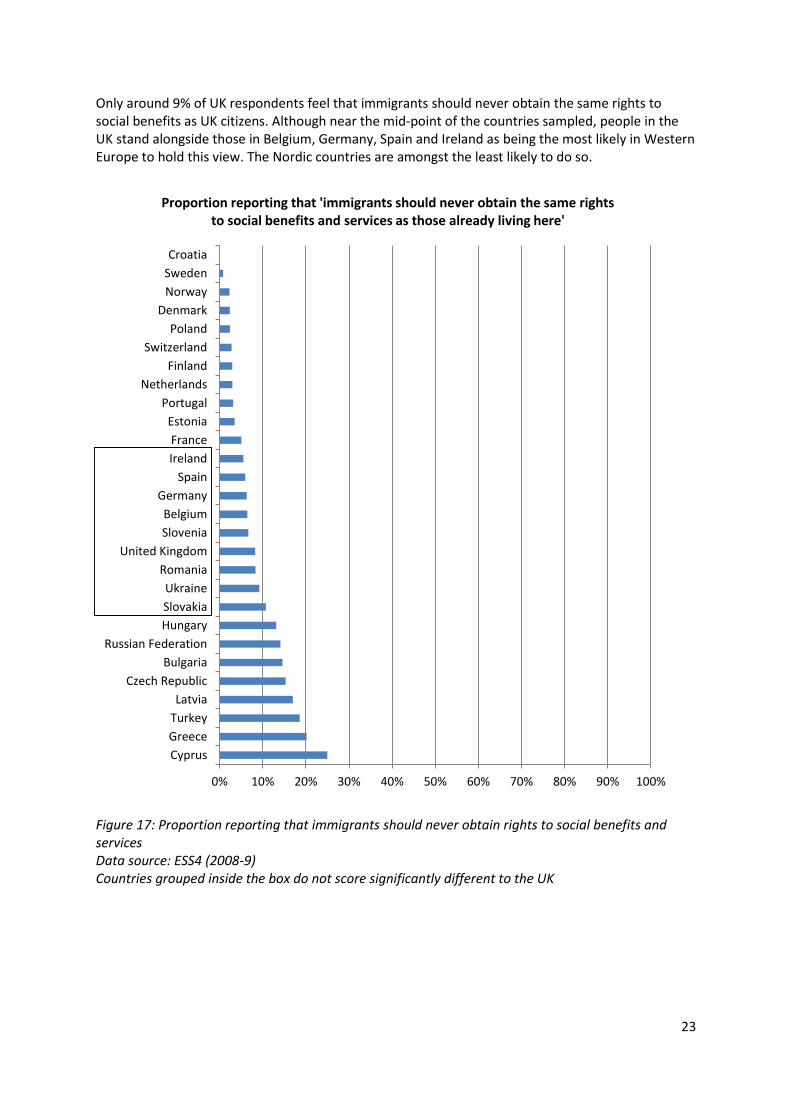
Only around 9% of UK respondents feel that immigrants should never obtain the same rights to social benefits as UK citizens. Although near the mid-point of the countries sampled, people in the UK stand alongside those in Belgium, Germany, Spain and Ireland as being the most likely in Western Europe to hold this view. The Nordic countries are amongst the least likely to do so.
Figure 17: Proportion reporting that immigrants should never obtain rights to social benefits and services Data source: ESS4 (2008-9) Countries grouped inside the box do not score significantly different to the UK
0% 10% 20% 30% 40% 50% 60% 70% 80% 90% 100%
Cyprus
Greece
Turkey
Latvia
Czech Republic
Bulgaria
Russian Federation
Hungary
Slovakia
Ukraine
Romania
United Kingdom
Slovenia
Belgium
Germany
Spain
Ireland
France
Estonia
Portugal
Netherlands
Finland
Switzerland
Poland
Denmark
Norway
Sweden
Croatia
Proportion reporting that 'immigrants should never obtain the same rights to social benefits and services as those already living here'
24
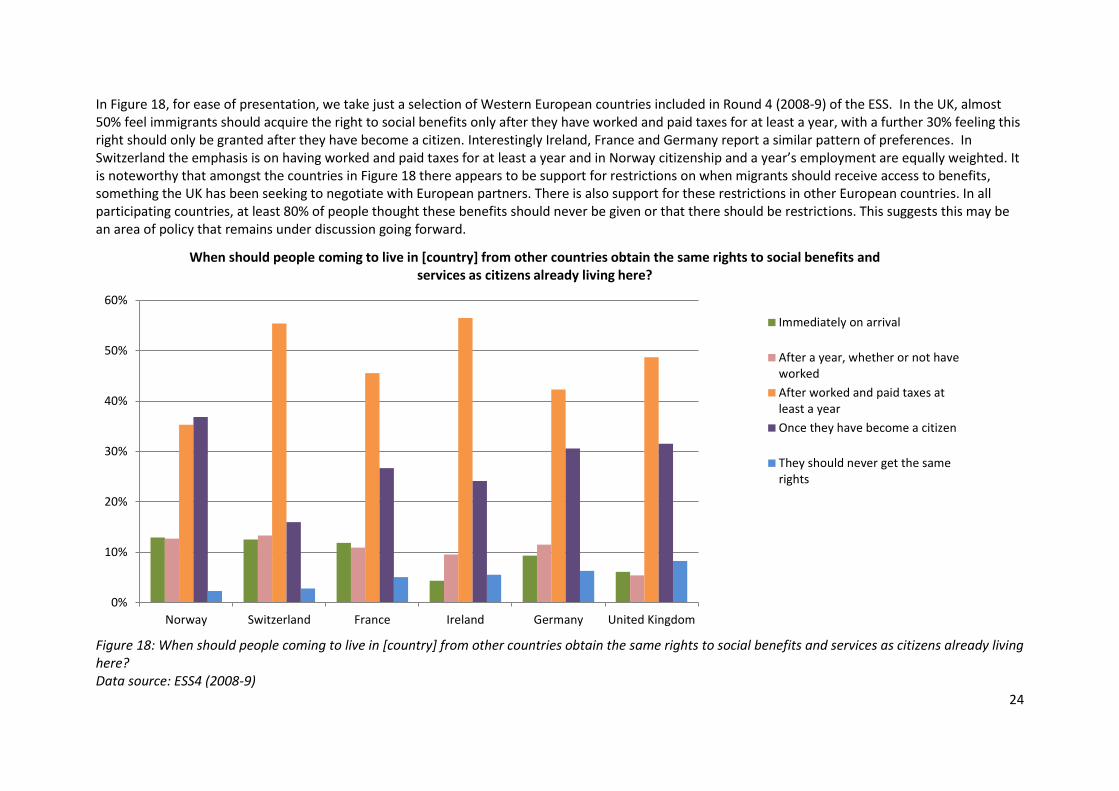
In Figure 18, for ease of presentation, we take just a selection of Western European countries included in Round 4 (2008-9) of the ESS. In the UK, almost 50% feel immigrants should acquire the right to social benefits only after they have worked and paid taxes for at least a year, with a further 30% feeling this right should only be granted after they have become a citizen. Interestingly Ireland, France and Germany report a similar pattern of preferences. In Switzerland the emphasis is on having worked and paid taxes for at least a year and in Norway citizenship and a year’s employment are equally weighted. It is noteworthy that amongst the countries in Figure 18 there appears to be support for restrictions on when migrants should receive access to benefits, something the UK has been seeking to negotiate with European partners. There is also support for these restrictions in other European countries. In all participating countries, at least 80% of people thought these benefits should never be given or that there should be restrictions. This suggests this may be an area of policy that remains under discussion going forward.
Figure 18: When should people coming to live in [country] from other countries obtain the same rights to social benefits and services as citizens already living here? Data source: ESS4 (2008-9)
0%
10%
20%
30%
40%
50%
60%
Norway Switzerland France Ireland Germany United Kingdom
When should people coming to live in [country] from other countries obtain the same rights to social benefits and services as citizens already living here?
Immediately on arrival
After a year, whether or not haveworked
After worked and paid taxes atleast a year
Once they have become a citizen
They should never get the samerights
25
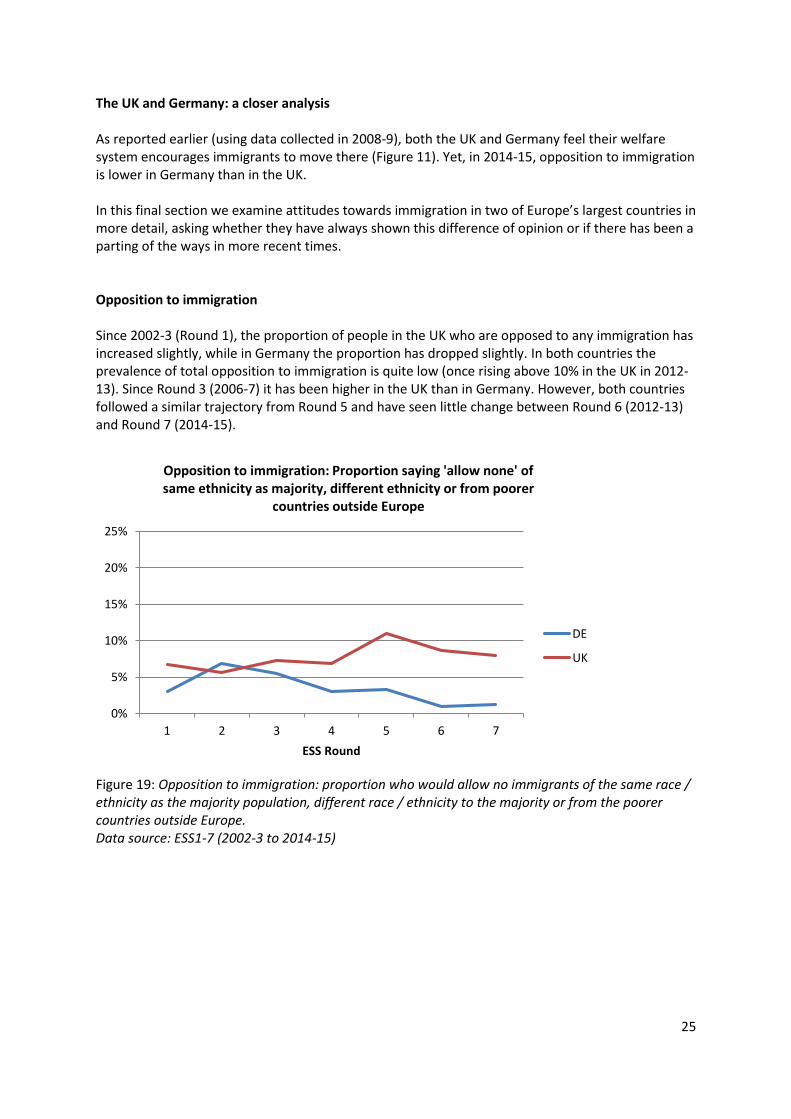
The UK and Germany: a closer analysis As reported earlier (using data collected in 2008-9), both the UK and Germany feel their welfare system encourages immigrants to move there (Figure 11). Yet, in 2014-15, opposition to immigration is lower in Germany than in the UK. In this final section we examine attitudes towards immigration in two of Europe’s largest countries in more detail, asking whether they have always shown this difference of opinion or if there has been a parting of the ways in more recent times. Opposition to immigration Since 2002-3 (Round 1), the proportion of people in the UK who are opposed to any immigration has increased slightly, while in Germany the proportion has dropped slightly. In both countries the prevalence of total opposition to immigration is quite low (once rising above 10% in the UK in 2012-13). Since Round 3 (2006-7) it has been higher in the UK than in Germany. However, both countries followed a similar trajectory from Round 5 and have seen little change between Round 6 (2012-13) and Round 7 (2014-15).
Figure 19: Opposition to immigration: proportion who would allow no immigrants of the same race / ethnicity as the majority population, different race / ethnicity to the majority or from the poorer countries outside Europe. Data source: ESS1-7 (2002-3 to 2014-15)
0%
5%
10%
15%
20%
25%
1 2 3 4 5 6 7
ESS Round
Opposition to immigration: Proportion saying 'allow none' of same ethnicity as majority, different ethnicity or from poorer
countries outside Europe
DE
UK

26
Looking at the rate of opposition specifically to immigrants of the same ethnicity as the majority population (Figure 20), we see that the two countries become a little less similar, with almost no-one in Germany saying there should be no immigration of this type by Round 7 (2014-15) but almost 10% still saying this in the UK.
Figure 20: Opposition to immigration: proportion who would allow no immigrants of the same race / ethnicity as the majority population Data source: ESS1-7 (2002-3 to 2014-15) While maintaining a similar overall pattern (the UK reporting a higher rate of opposition than Germany; Figure 21), a higher proportion of people in both countries are opposed to allowing immigrants of a different race or ethnic group to the majority population compared to those of the same race or ethnic group.
Figure 21: Opposition to immigration: proportion who would allow no immigrants of a different race / ethnicity to the majority population Data source: ESS1-7 (2002-3 to 2014-15)
0%
5%
10%
15%
20%
25%
1 2 3 4 5 6 7
ESS Round
Allow no immigrants of same race / ethnicity as majority
DE
UK
0%
5%
10%
15%
20%
25%
1 2 3 4 5 6 7
ESS Round
Allow no immigrants of different race / ethnicity to majority
DE
UK
27
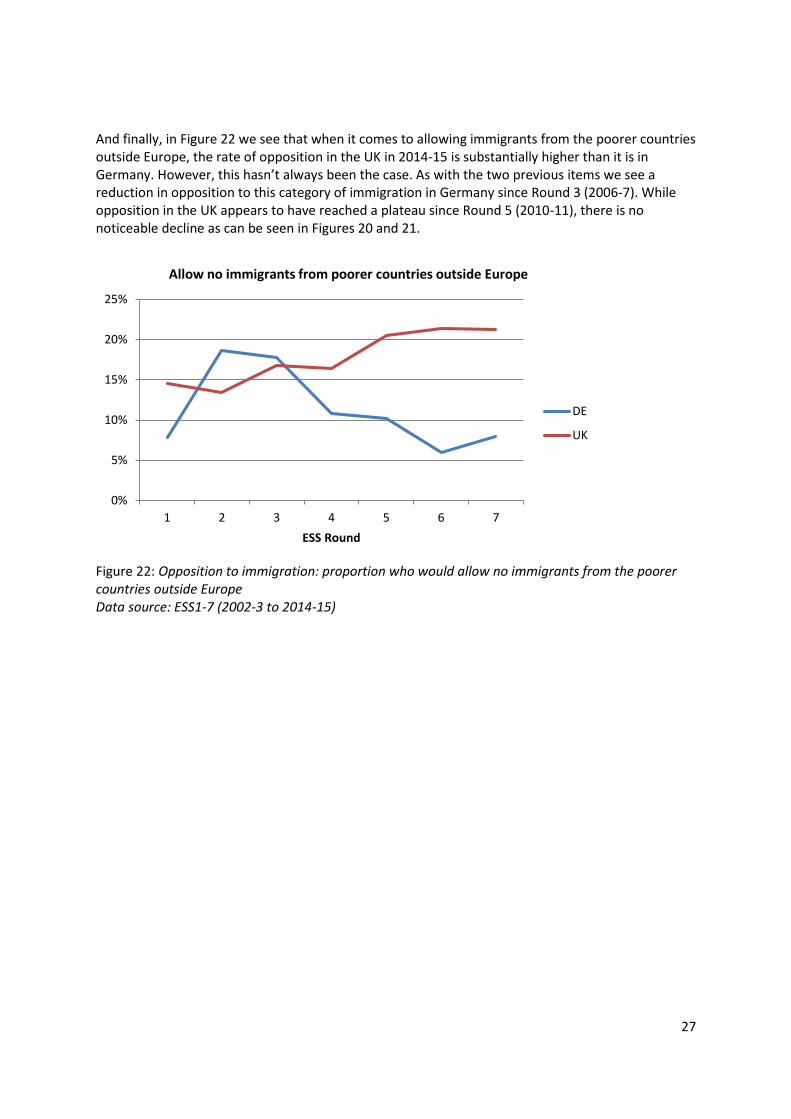
And finally, in Figure 22 we see that when it comes to allowing immigrants from the poorer countries outside Europe, the rate of opposition in the UK in 2014-15 is substantially higher than it is in Germany. However, this hasn’t always been the case. As with the two previous items we see a reduction in opposition to this category of immigration in Germany since Round 3 (2006-7). While opposition in the UK appears to have reached a plateau since Round 5 (2010-11), there is no noticeable decline as can be seen in Figures 20 and 21.
Figure 22: Opposition to immigration: proportion who would allow no immigrants from the poorer countries outside Europe Data source: ESS1-7 (2002-3 to 2014-15)
0%
5%
10%
15%
20%
25%
1 2 3 4 5 6 7
ESS Round
Allow no immigrants from poorer countries outside Europe
DE
UK
28
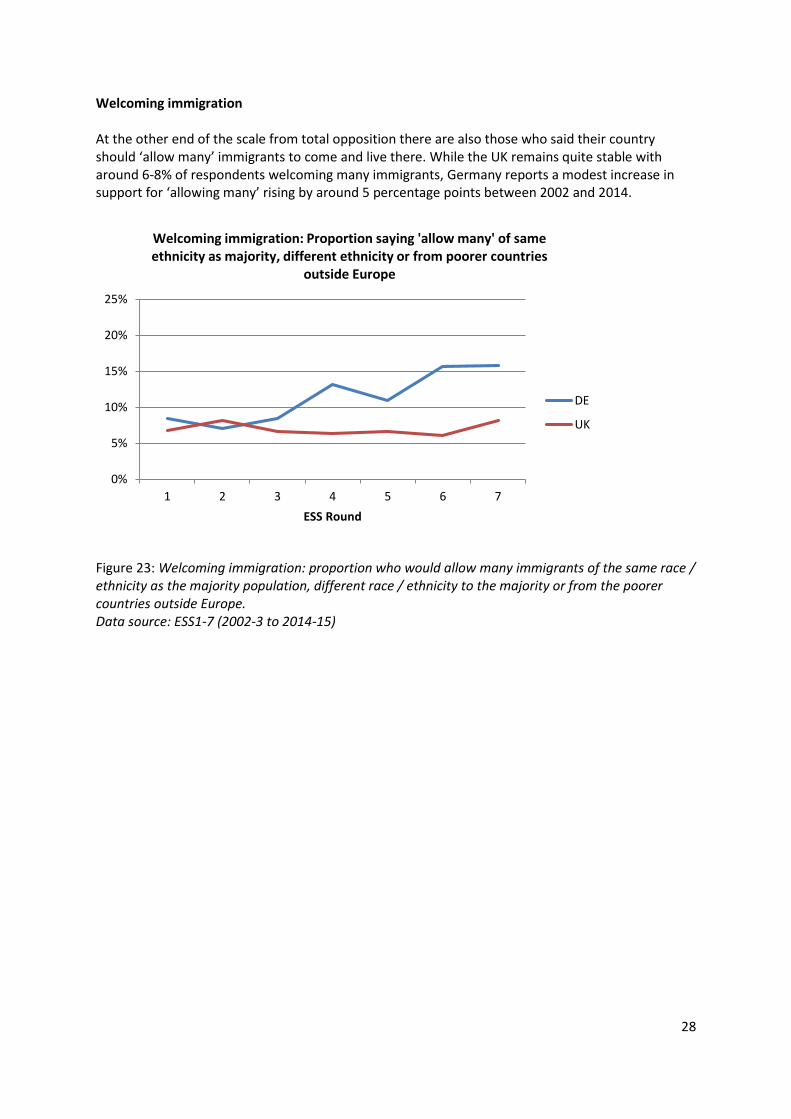
Welcoming immigration At the other end of the scale from total opposition there are also those who said their country should ‘allow many’ immigrants to come and live there. While the UK remains quite stable with around 6-8% of respondents welcoming many immigrants, Germany reports a modest increase in support for ‘allowing many’ rising by around 5 percentage points between 2002 and 2014.
Figure 23: Welcoming immigration: proportion who would allow many immigrants of the same race / ethnicity as the majority population, different race / ethnicity to the majority or from the poorer countries outside Europe. Data source: ESS1-7 (2002-3 to 2014-15)
0%
5%
10%
15%
20%
25%
1 2 3 4 5 6 7
ESS Round
Welcoming immigration: Proportion saying 'allow many' of same ethnicity as majority, different ethnicity or from poorer countries
outside Europe
DE
UK
29
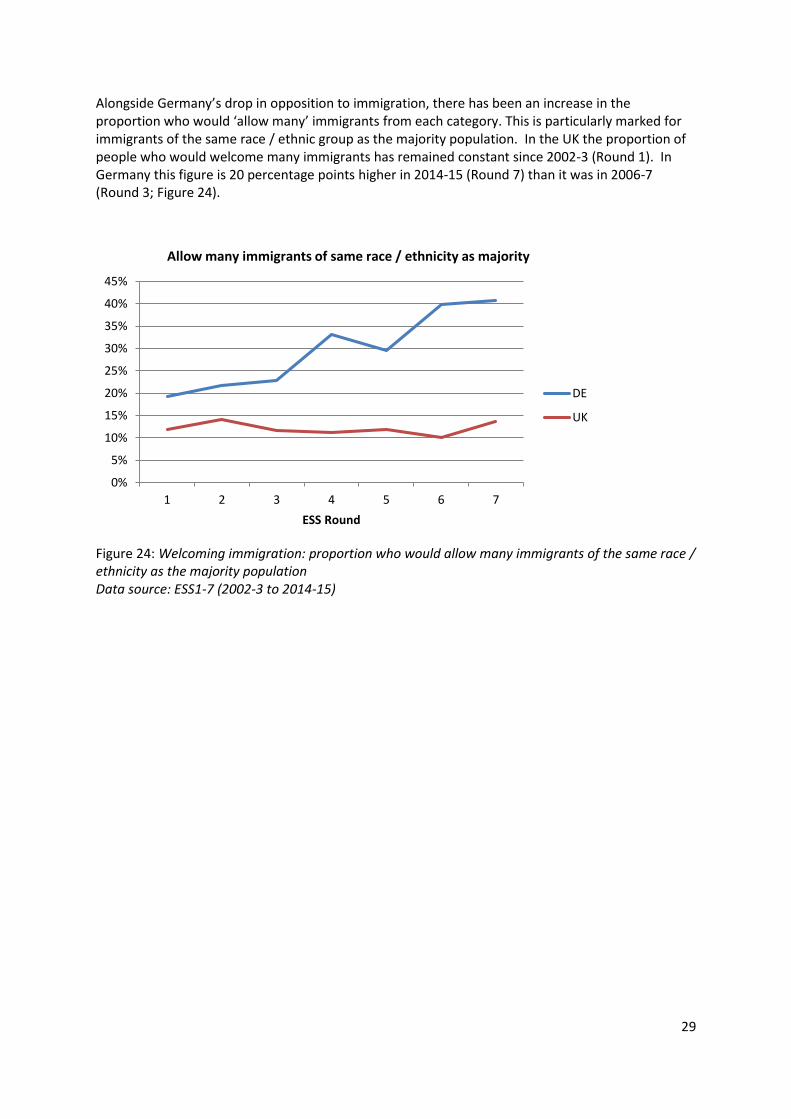
Alongside Germany’s drop in opposition to immigration, there has been an increase in the proportion who would ‘allow many’ immigrants from each category. This is particularly marked for immigrants of the same race / ethnic group as the majority population. In the UK the proportion of people who would welcome many immigrants has remained constant since 2002-3 (Round 1). In Germany this figure is 20 percentage points higher in 2014-15 (Round 7) than it was in 2006-7 (Round 3; Figure 24).
Figure 24: Welcoming immigration: proportion who would allow many immigrants of the same race / ethnicity as the majority population Data source: ESS1-7 (2002-3 to 2014-15)
0%
5%
10%
15%
20%
25%
30%
35%
40%
45%
1 2 3 4 5 6 7
ESS Round
Allow many immigrants of same race / ethnicity as majority
DE
UK

30
In Figure 25 we see that similar patterns emerge when looking at the proportion who would welcome many immigrants of a different race or ethnic group, although in both countries the prevalence of reporting ‘allow many’ is lower overall. In fact, in Germany the increase in support for immigration has been driven largely by a preference for those from the same race or ethnic group (see Figure 24).
Figure 25: Welcoming immigration: proportion who would allow many immigrants of a different race / ethnicity to the majority population Data source: ESS1-7 (2002-3 to 2014-15)
0%
5%
10%
15%
20%
25%
30%
35%
40%
45%
1 2 3 4 5 6 7
ESS Round
Allow many immigrants of different race / ethnicity to majority
DE
UK
31
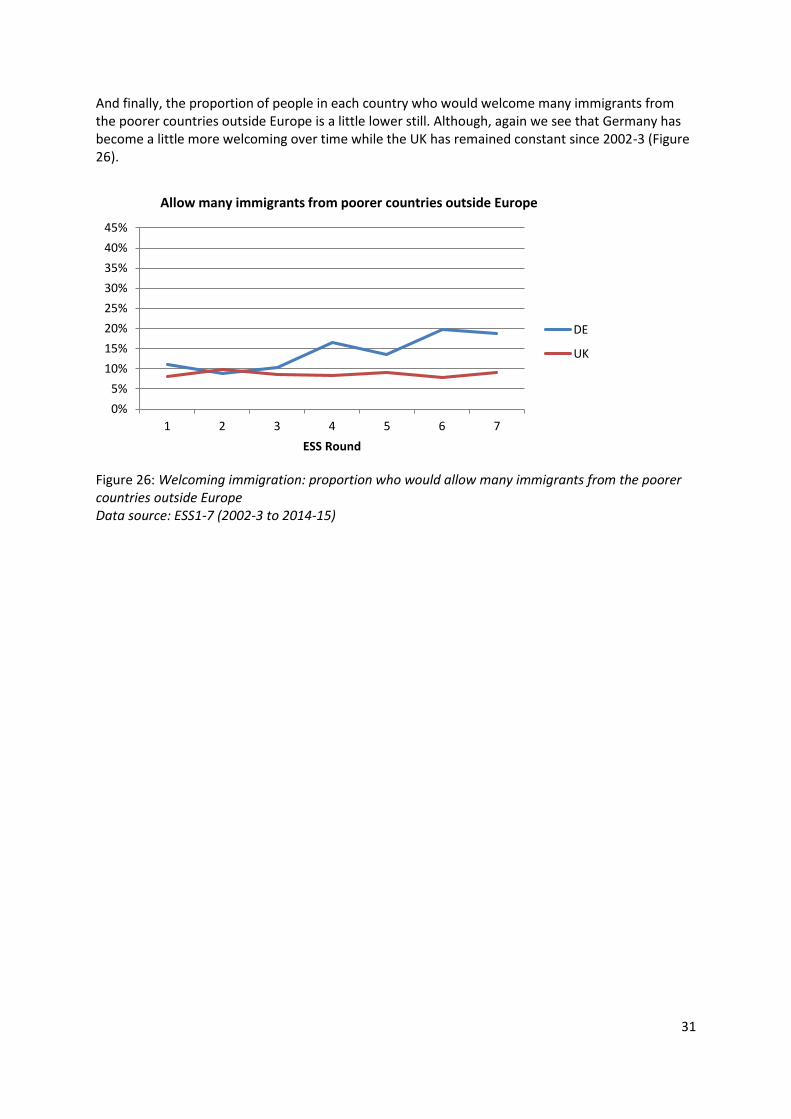
And finally, the proportion of people in each country who would welcome many immigrants from the poorer countries outside Europe is a little lower still. Although, again we see that Germany has become a little more welcoming over time while the UK has remained constant since 2002-3 (Figure 26).
Figure 26: Welcoming immigration: proportion who would allow many immigrants from the poorer countries outside Europe Data source: ESS1-7 (2002-3 to 2014-15)
0%
5%
10%
15%
20%
25%
30%
35%
40%
45%
1 2 3 4 5 6 7
ESS Round
Allow many immigrants from poorer countries outside Europe
DE
UK

32
The item measuring attitudes towards immigration from the poorer countries in Europe has only been fielded in Round 1 (2002-3) and Round 7 (2014-15). Figure 27 compares scores in the UK and Germany in these two rounds, across the response scale. Overall, the UK has shown a slightly more negative attitude than Germany, with slightly weaker endorsement of the more welcoming response options and stronger endorsement of ‘allow a few’ and ‘allow none’. In the UK we see slight increases over time in the proportions saying ‘allow many’ and ‘allow none’, while in Germany we see a slight reduction (to varying degrees) in endorsement of the three less welcoming responses, and an increase in the proportion saying ‘allow many’.
Figure 27: Attitudes to immigration from the poorer countries in Europe: across time in the UK and Germany Data source: ESS1 (2002-3) and ESS7 (2014-15)
0%
10%
20%
30%
40%
50%
60%
Germany UnitedKingdom
Germany UnitedKingdom
Germany UnitedKingdom
Germany UnitedKingdom
Allow many Allow some Allow a few Allow none
Allow how many from the poorer countries in Europe?
Round 1 (2002-3)
Round 7 (2014-15)
33
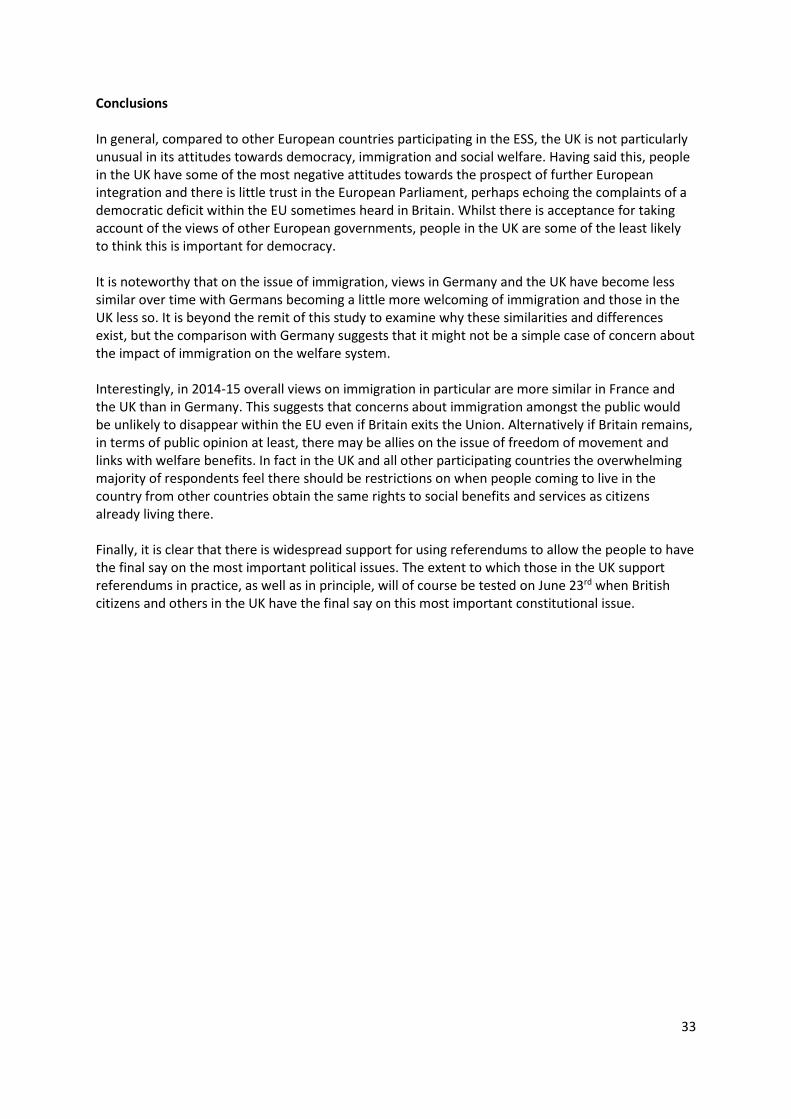
Conclusions In general, compared to other European countries participating in the ESS, the UK is not particularly unusual in its attitudes towards democracy, immigration and social welfare. Having said this, people in the UK have some of the most negative attitudes towards the prospect of further European integration and there is little trust in the European Parliament, perhaps echoing the complaints of a democratic deficit within the EU sometimes heard in Britain. Whilst there is acceptance for taking account of the views of other European governments, people in the UK are some of the least likely to think this is important for democracy. It is noteworthy that on the issue of immigration, views in Germany and the UK have become less similar over time with Germans becoming a little more welcoming of immigration and those in the UK less so. It is beyond the remit of this study to examine why these similarities and differences exist, but the comparison with Germany suggests that it might not be a simple case of concern about the impact of immigration on the welfare system. Interestingly, in 2014-15 overall views on immigration in particular are more similar in France and the UK than in Germany. This suggests that concerns about immigration amongst the public would be unlikely to disappear within the EU even if Britain exits the Union. Alternatively if Britain remains, in terms of public opinion at least, there may be allies on the issue of freedom of movement and links with welfare benefits. In fact in the UK and all other participating countries the overwhelming majority of respondents feel there should be restrictions on when people coming to live in the country from other countries obtain the same rights to social benefits and services as citizens already living there. Finally, it is clear that there is widespread support for using referendums to allow the people to have the final say on the most important political issues. The extent to which those in the UK support referendums in practice, as well as in principle, will of course be tested on June 23rd when British citizens and others in the UK have the final say on this most important constitutional issue.
34
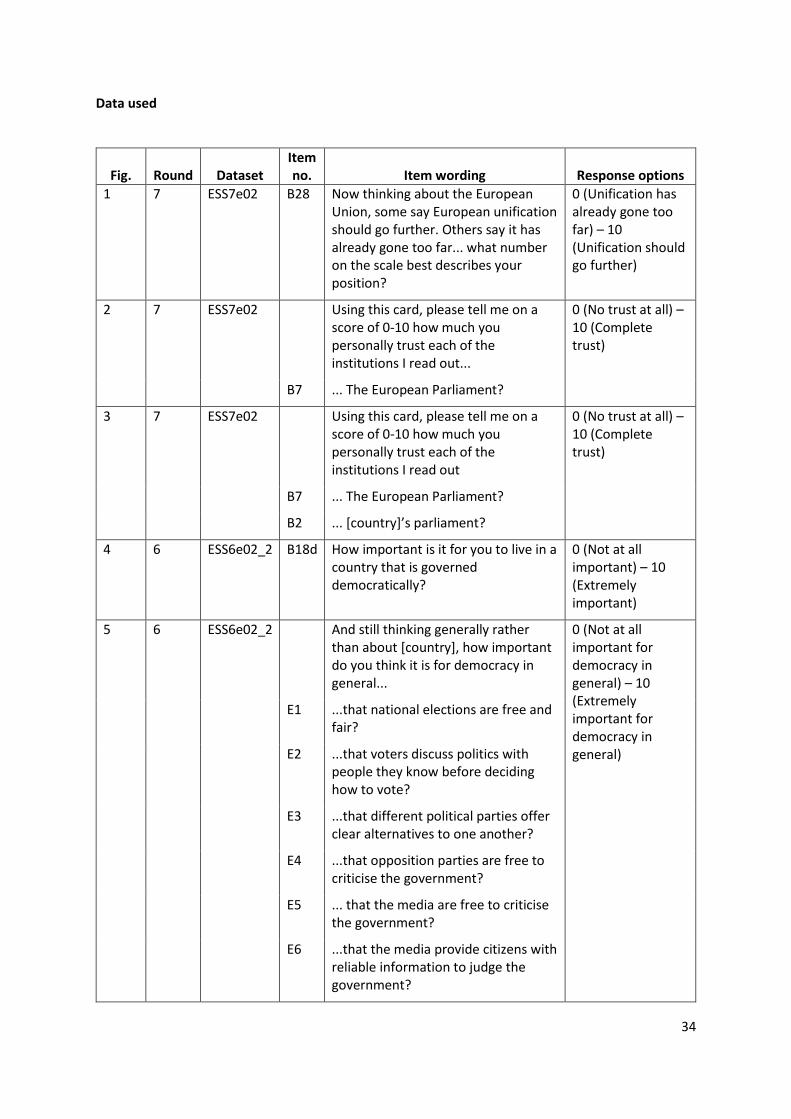
Data used
Fig. Round Dataset Item no. Item wording Response options
1 7 ESS7e02 B28 Now thinking about the European Union, some say European unification should go further. Others say it has already gone too far... what number on the scale best describes your position?
0 (Unification has already gone too far) – 10 (Unification should go further)
2 7 ESS7e02 Using this card, please tell me on a score of 0-10 how much you personally trust each of the institutions I read out...
0 (No trust at all) – 10 (Complete trust)
B7 ... The European Parliament?
3 7 ESS7e02 Using this card, please tell me on a score of 0-10 how much you personally trust each of the institutions I read out
0 (No trust at all) – 10 (Complete trust)
B7 ... The European Parliament?
B2 ... [country]’s parliament?
4 6 ESS6e02_2 B18d How important is it for you to live in a country that is governed democratically?
0 (Not at all important) – 10 (Extremely important)
5 6 ESS6e02_2 And still thinking generally rather than about [country], how important do you think it is for democracy in general...
0 (Not at all important for democracy in general) – 10 (Extremely important for democracy in general)
E1 ...that national elections are free and fair?
E2 ...that voters discuss politics with people they know before deciding how to vote?
E3 ...that different political parties offer clear alternatives to one another?
E4 ...that opposition parties are free to criticise the government?
E5 ... that the media are free to criticise the government?
E6 ...that the media provide citizens with reliable information to judge the government?
35
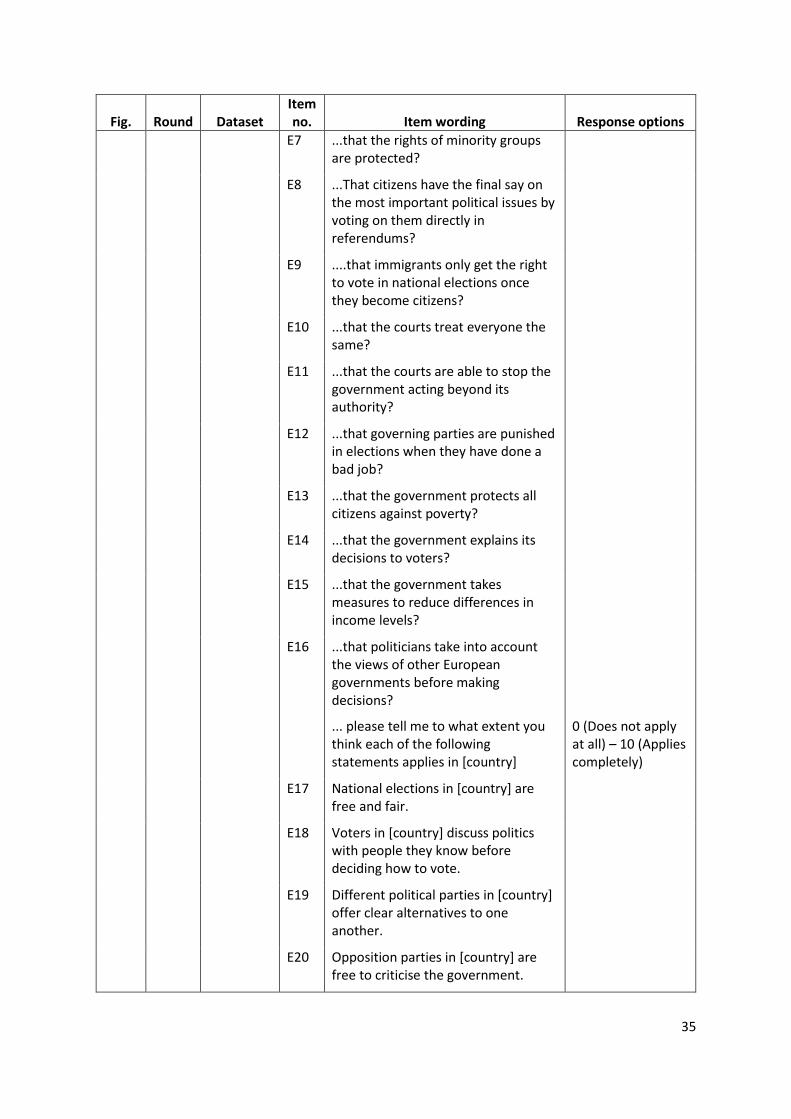
Fig. Round Dataset Item no. Item wording Response options
E7 ...that the rights of minority groups are protected?
E8 ...That citizens have the final say on the most important political issues by voting on them directly in referendums?
E9 ....that immigrants only get the right to vote in national elections once they become citizens?
E10 ...that the courts treat everyone the same?
E11 ...that the courts are able to stop the government acting beyond its authority?
E12 ...that governing parties are punished in elections when they have done a bad job?
E13 ...that the government protects all citizens against poverty?
E14 ...that the government explains its decisions to voters?
E15 ...that the government takes measures to reduce differences in income levels?
E16 ...that politicians take into account the views of other European governments before making decisions?
... please tell me to what extent you think each of the following statements applies in [country]
0 (Does not apply at all) – 10 (Applies completely)
E17 National elections in [country] are free and fair.
E18 Voters in [country] discuss politics with people they know before deciding how to vote.
E19 Different political parties in [country] offer clear alternatives to one another.
E20 Opposition parties in [country] are free to criticise the government.
36
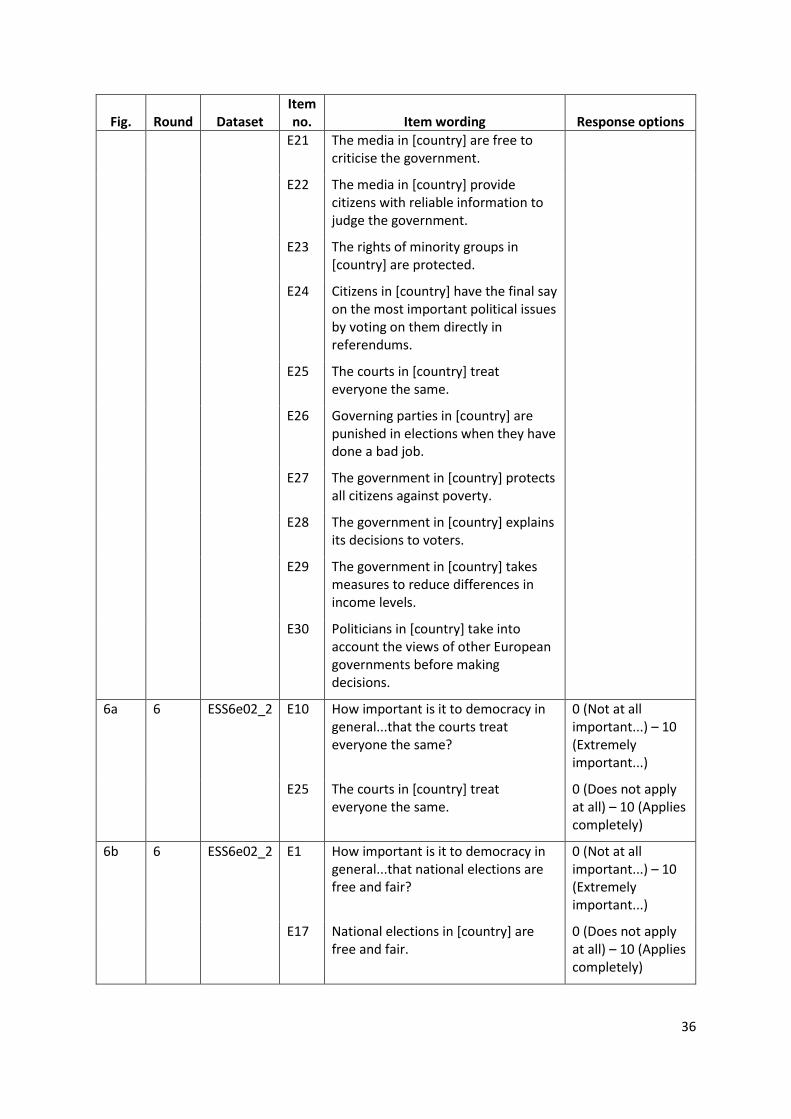
Fig. Round Dataset Item no. Item wording Response options
E21 The media in [country] are free to criticise the government.
E22 The media in [country] provide citizens with reliable information to judge the government.
E23 The rights of minority groups in [country] are protected.
E24 Citizens in [country] have the final say on the most important political issues by voting on them directly in referendums.
E25 The courts in [country] treat everyone the same.
E26 Governing parties in [country] are punished in elections when they have done a bad job.
E27 The government in [country] protects all citizens against poverty.
E28 The government in [country] explains its decisions to voters.
E29 The government in [country] takes measures to reduce differences in income levels.
E30 Politicians in [country] take into account the views of other European governments before making decisions.
6a 6 ESS6e02_2 E10 How important is it to democracy in general...that the courts treat everyone the same?
0 (Not at all important...) – 10 (Extremely important...)
E25 The courts in [country] treat everyone the same.
0 (Does not apply at all) – 10 (Applies completely)
6b 6 ESS6e02_2 E1 How important is it to democracy in general...that national elections are free and fair?
0 (Not at all important...) – 10 (Extremely important...)
E17 National elections in [country] are free and fair.
0 (Does not apply at all) – 10 (Applies completely)
37
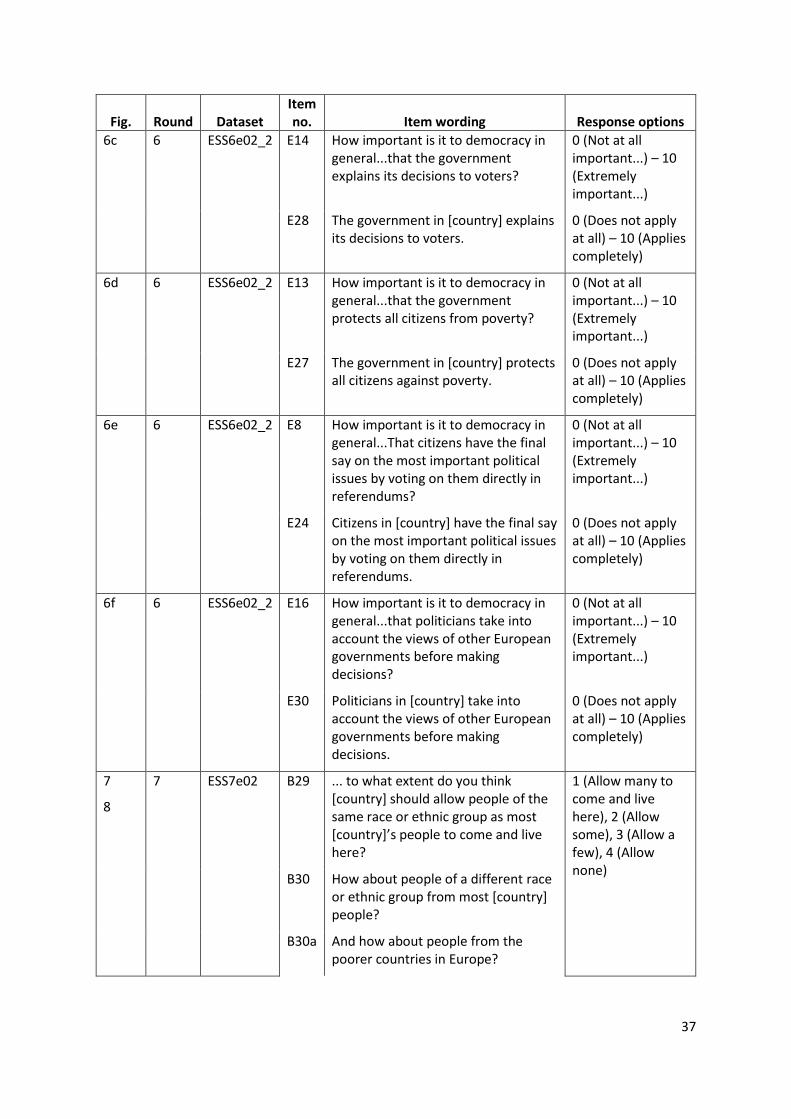
Fig. Round Dataset Item no. Item wording Response options
6c 6 ESS6e02_2 E14 How important is it to democracy in general...that the government explains its decisions to voters?
0 (Not at all important...) – 10 (Extremely important...)
E28 The government in [country] explains its decisions to voters.
0 (Does not apply at all) – 10 (Applies completely)
6d 6 ESS6e02_2 E13 How important is it to democracy in general...that the government protects all citizens from poverty?
0 (Not at all important...) – 10 (Extremely important...)
E27 The government in [country] protects all citizens against poverty.
0 (Does not apply at all) – 10 (Applies completely)
6e 6 ESS6e02_2 E8 How important is it to democracy in general...That citizens have the final say on the most important political issues by voting on them directly in referendums?
0 (Not at all important...) – 10 (Extremely important...)
E24 Citizens in [country] have the final say on the most important political issues by voting on them directly in referendums.
0 (Does not apply at all) – 10 (Applies completely)
6f 6 ESS6e02_2 E16 How important is it to democracy in general...that politicians take into account the views of other European governments before making decisions?
0 (Not at all important...) – 10 (Extremely important...)
E30 Politicians in [country] take into account the views of other European governments before making decisions.
0 (Does not apply at all) – 10 (Applies completely)
7
8
7 ESS7e02 B29 ... to what extent do you think [country] should allow people of the same race or ethnic group as most [country]’s people to come and live here?
1 (Allow many to come and live here), 2 (Allow some), 3 (Allow a few), 4 (Allow none)
B30 How about people of a different race or ethnic group from most [country] people?
B30a And how about people from the poorer countries in Europe?
38
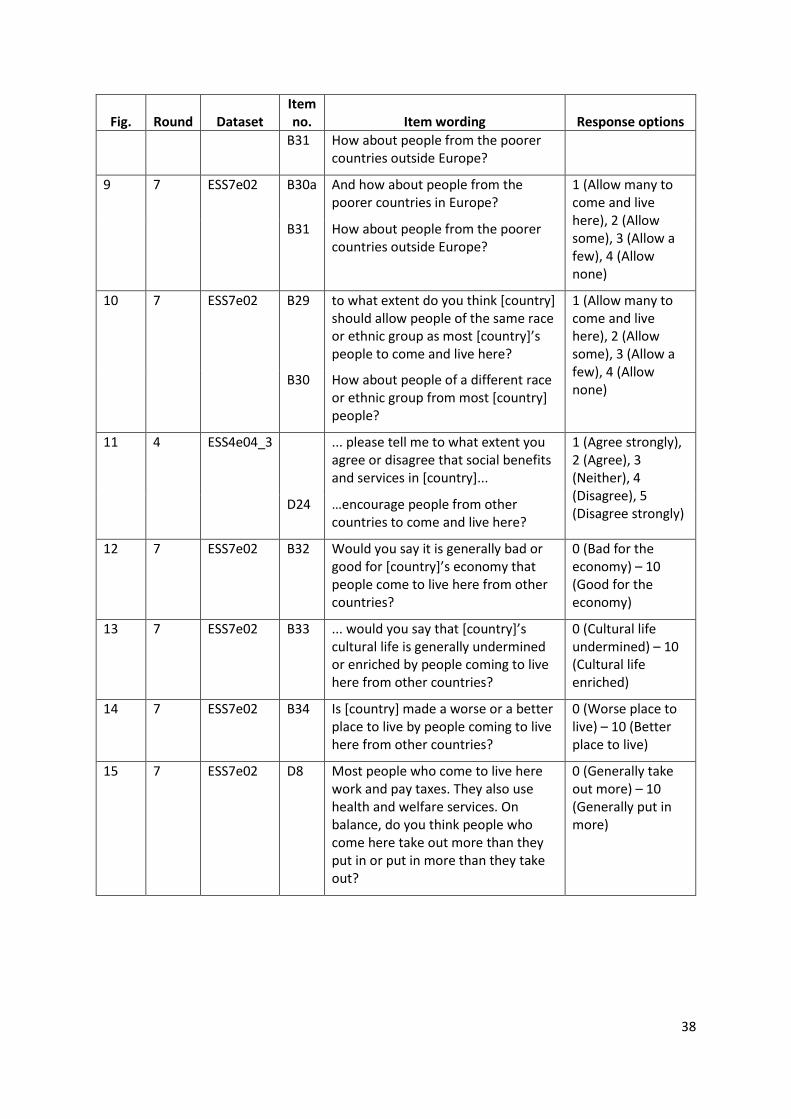
Fig. Round Dataset Item no. Item wording Response options
B31 How about people from the poorer countries outside Europe?
9 7 ESS7e02 B30a And how about people from the poorer countries in Europe?
1 (Allow many to come and live here), 2 (Allow some), 3 (Allow a few), 4 (Allow none)
B31 How about people from the poorer countries outside Europe?
10 7 ESS7e02 B29 to what extent do you think [country] should allow people of the same race or ethnic group as most [country]’s people to come and live here?
1 (Allow many to come and live here), 2 (Allow some), 3 (Allow a few), 4 (Allow none)
B30 How about people of a different race or ethnic group from most [country] people?
11 4 ESS4e04_3 ... please tell me to what extent you agree or disagree that social benefits and services in [country]...
1 (Agree strongly), 2 (Agree), 3 (Neither), 4 (Disagree), 5 (Disagree strongly)
D24 …encourage people from other countries to come and live here?
12 7 ESS7e02 B32 Would you say it is generally bad or good for [country]’s economy that people come to live here from other countries?
0 (Bad for the economy) – 10 (Good for the economy)
13 7 ESS7e02 B33 ... would you say that [country]’s cultural life is generally undermined or enriched by people coming to live here from other countries?
0 (Cultural life undermined) – 10 (Cultural life enriched)
14 7 ESS7e02 B34 Is [country] made a worse or a better place to live by people coming to live here from other countries?
0 (Worse place to live) – 10 (Better place to live)
15 7 ESS7e02 D8 Most people who come to live here work and pay taxes. They also use health and welfare services. On balance, do you think people who come here take out more than they put in or put in more than they take out?
0 (Generally take out more) – 10 (Generally put in more)
39
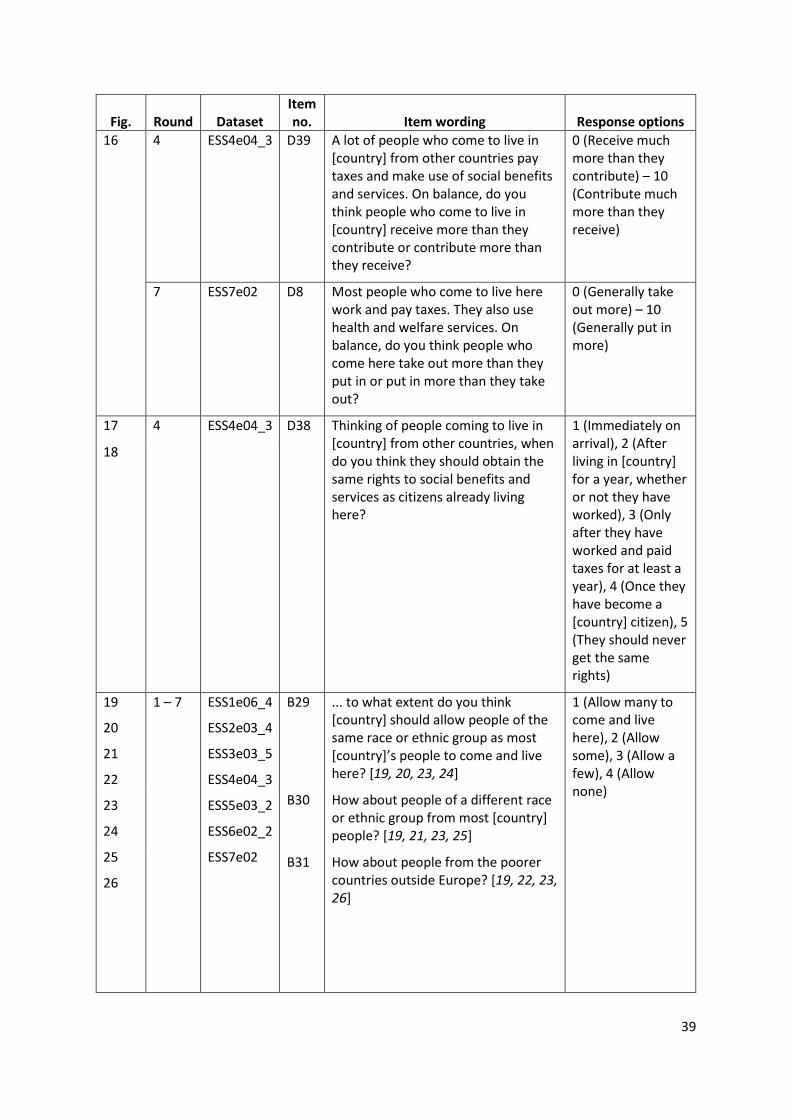
Fig. Round Dataset Item no. Item wording Response options
16 4 ESS4e04_3 D39 A lot of people who come to live in [country] from other countries pay taxes and make use of social benefits and services. On balance, do you think people who come to live in [country] receive more than they contribute or contribute more than they receive?
0 (Receive much more than they contribute) – 10 (Contribute much more than they receive)
7 ESS7e02 D8 Most people who come to live here work and pay taxes. They also use health and welfare services. On balance, do you think people who come here take out more than they put in or put in more than they take out?
0 (Generally take out more) – 10 (Generally put in more)
17 4 ESS4e04_3 D38 Thinking of people coming to live in [country] from other countries, when do you think they should obtain the same rights to social benefits and services as citizens already living here?
1 (Immediately on arrival), 2 (After living in [country] for a year, whether or not they have worked), 3 (Only after they have worked and paid taxes for at least a year), 4 (Once they have become a [country] citizen), 5 (They should never get the same rights)
18
19
20
21
22
23
24
25
26
1 – 7 ESS1e06_4
ESS2e03_4
ESS3e03_5
ESS4e04_3
ESS5e03_2
ESS6e02_2
ESS7e02
B29 ... to what extent do you think [country] should allow people of the same race or ethnic group as most [country]’s people to come and live here? [19, 20, 23, 24]
1 (Allow many to come and live here), 2 (Allow some), 3 (Allow a few), 4 (Allow none)
B30 How about people of a different race or ethnic group from most [country] people? [19, 21, 23, 25]
B31 How about people from the poorer countries outside Europe? [19, 22, 23, 26]

40
Fig. Round Dataset Item no. Item wording Response options
27 1, 7 ESS1e06_4
ESS7e02
B30a And how about people from the poorer countries in Europe?
1 (Allow many to come and live here), 2 (Allow some), 3 (Allow a few), 4 (Allow none)
B31 How about people from the poorer countries outside Europe?

41
Notes All data were weighted using post-stratification weights. Text relating to scale variables (eg 0 – 10) discusses the mean score for each country, while text relating to categorical variables (eg ‘allow none’ as a measure of opposition to immigration) discusses crosstabs. The significance of cross-national differences was assessed using ANOVA with Games-Howell post-hoc tests. The Games-Howell test is robust to unequal group sizes and unequal variances. All analyses assumed a simple random sample and the differences in terms of complex sampling designs implemented were not accounted for. Sample sizes. The total unweighted sample size varies by round to reflect the number of participating countries. Excluding Israel (who were not included in the immigration analysis) the sample size across all rounds was 324,611. The was broken down as follows 39860 (Round 1), 47537 (Round 2), 43000 (Round 3) 54262 (Round 4), 50164 (Round 5), 52165 (Round 6) and 37623 (Round 7).

42
Data ESS Round 7: European Social Survey Round 7 Data (2014). Data file edition 2.0. NSD - Norwegian Centre for Research Data, Norway – Data Archive and distributor of ESS data for ESS ERIC. ESS Round 6: European Social Survey Round 6 Data (2012). Data file edition 2.2. NSD - Norwegian Centre for Research Data, Norway – Data Archive and distributor of ESS data for ESS ERIC. ESS Round 5: European Social Survey Round 5 Data (2010). Data file edition 3.2. NSD - Norwegian Centre for Research Data, Norway – Data Archive and distributor of ESS data for ESS ERIC. ESS Round 4: European Social Survey Round 4 Data (2008). Data file edition 4.3. NSD - Norwegian Centre for Research Data, Norway – Data Archive and distributor of ESS data for ESS ERIC. ESS Round 3: European Social Survey Round 3 Data (2006). Data file edition 3.5. NSD - Norwegian Centre for Research Data, Norway – Data Archive and distributor of ESS data for ESS ERIC. ESS Round 2: European Social Survey Round 2 Data (2004). Data file edition 3.4. NSD - Norwegian Centre for Research Data, Norway – Data Archive and distributor of ESS data for ESS ERIC. ESS Round 1: European Social Survey Round 1 Data (2002). Data file edition 6.4. NSD - Norwegian Centre for Research Data, Norway – Data Archive and distributor of ESS data for ESS ERIC.