Embed Size (px)
Citation preview

Policy Research Working Paper 5937
The Unexpected Global Financial Crisis
Researching Its Root Cause
Justin Yifu LinVolker Treichel
The World BankOffice of the Chief EconomistDevelopment Economics Vice PresidencyJanuary 2012
WPS5937P
ublic
Dis
clos
ure
Aut
horiz
edP
ublic
Dis
clos
ure
Aut
horiz
edP
ublic
Dis
clos
ure
Aut
horiz
edP
ublic
Dis
clos
ure
Aut
horiz
edP
ublic
Dis
clos
ure
Aut
horiz
edP
ublic
Dis
clos
ure
Aut
horiz
edP
ublic
Dis
clos
ure
Aut
horiz
edP
ublic
Dis
clos
ure
Aut
horiz
ed

Produced by the Research Support Team
Abstract
The Policy Research Working Paper Series disseminates the findings of work in progress to encourage the exchange of ideas about development issues. An objective of the series is to get the findings out quickly, even if the presentations are less than fully polished. The papers carry the names of the authors and should be cited accordingly. The findings, interpretations, and conclusions expressed in this paper are entirely those of the authors. They do not necessarily represent the views of the International Bank for Reconstruction and Development/World Bank and its affiliated organizations, or those of the Executive Directors of the World Bank or the governments they represent.
Policy Research Working Paper 5937
The world is currently still struggling with the aftermath of the worst economic crisis since the Great Depression. Following a description of the eruption, evolution and consequences of the global crisis, this paper reviews alternative hypotheses for the causes of the global financial crisis as well as their empirical evidence. The paper refutes the frequently voiced view that the global crisis was caused by global imbalances that reflected economic policies of East Asian countries. Instead, it argues that global imbalances were the result of excess demand in the United States, resulting from both the public debt in the United States arising from the Afghanistan and Iraqi wars and tax cuts and the overconsumption by households supported by the wealth effect from the housing bubble in the United States. The housing bubble itself was the outcome of the Federal
This paper is a product of the Office of the Chief Economist, Development Economics Vice Presidency. It is part of a larger effort by the World Bank to provide open access to its research and make a contribution to development policy discussions around the world. Policy Research Working Papers are also posted on the Web at http://econ.worldbank.org. The author may be contacted at [email protected].
Reserve's low interest rate policy in the aftermath of the burst of the “dot-com” bubble in 2001, the lack of appropriate financial regulation, and housing policies aimed at expanding the mortgage market to low-income borrowers. It was possible to maintain the large trade deficits of the United States for such a long period of time because of the dollar’s reserve currency status. When the housing bubble in the United States burst, the global crisis ensued. The paper also analyzes why China’s trade surplus increased significantly in general and with the United States in particular in recent years, and argues that this increase was caused by both the relocation of the labor-intensive tradable sector of East Asian economies to China and high corporate saving rates in China as a result of its dual-track approach to reform.

THE WORLD BANK GROUP
The Unexpected Global Financial Crisis: Researching Its
Root Cause
Justin Yifu Lin and Volker Treichel1
JEL Classification: E61, E63, E65
Keywords: Global financial crisis, financial sector deregulation, real estate bubble, China‘s trade
surplus.
Sector Board: EPOL
1The authors wish to thank James Trevino for outstanding research assistance.

2
The Unexpected Global Financial Crisis
I. Introduction
1. The world is currently still struggling with the aftermath of the worst economic crisis
since the Great Depression. While a handful of economists predicted the crisis, it was largely
unforeseen. As late as April 2007, the IMF in its World Economic Outlook concluded that risks
to the global economy had become extremely low, and that, for the moment, there were no great
concerns. Despite large and widening global imbalances before the crisis, optimism on the
robustness of the world economy emanated from confidence in the United States‘ system of
financial regulation, its financial and political system and the fact that it had the world‘s largest
capital markets.2 Global imbalances were viewed as sustainable, given that rapidly growing
developing economies needed a secure place to invest their funds for diversification purposes
and increased global financial integration was deepening global capital markets and allowing
countries to sustain higher debt burdens over the long term. In addition, the U.S. was considered
to have superior monetary policy institutions and monetary policy makers.3
Only a few
economists did not share these views and expressed concern about a disorderly unwinding of
rising global imbalances, as well as of the housing bubble.4
2. The concerns of these economists were dramatically validated by the unfolding of the
global financial crisis since September 2008. The coordinated policy response by the G-20
nations helped the world avoid a global depression. According to the IMF, these interventions
involved cash infusions, debt guarantees, and other assistance to the tune of a staggering
$10 trillion.5
3. However, economic growth remains fragile. Recovery is taking place at two different
paces: on the one hand, there are the high-income countries that are experiencing a sluggish
recovery. On the other hand, there are the developing countries whose economic performance is
far superior to that of the advanced countries. The recovery of the world economy is threatened
by high unemployment in the advanced economies, high levels of sovereign debt and the crisis in
2 See Reinhart and Rogoff: “This Time is Different”, p. 214. 3 Bernanke (2005a): “The Global Savings Glut and the U.S. Current Account Deficit”. Speech given at the Homer Jones lecture, St. Louis, Missouri. 4 These economists included Nouriel Roubini; e.g., in “The Rising Risk of a Systematic Financial Meltdown: The Twelve steps to Financial Disaster”, February 5, 2008, online at www.roubini.com/analysis/44763.php. In addition, Raghuram Rajan, the Chief Economist of the IMF, warned of a collapse of the financial system in his Jackson Hole speech in August 2005. 5“The State of Public Finances Cross-Country Fiscal Monitor; November 2009,” IMF Staff Position Note, November 3, 2009 (Tables 3 and 4).

3
the Euro-zone.6 Moreover, the severity of the recent global crisis has highlighted the need to
revisit basic policy recommendations, e.g., in the area of capital flows, the supervision of the
financial sector, and macroeconomic management.7
And with emerging and developing
economies recovering from the global economic crisis much faster than advanced countries, it
also reinforced a trend toward a new multi-polar world economy with several growth poles, a
trend that had already become apparent before the crisis.
4. The precise genesis of the global crisis remains subject to debate. While global
imbalances are widely viewed to have played an important role in its evolution, some economists
consider them to be the primary cause of the crisis, while others view them as only facilitating its
development.8 A correct diagnosis of the genesis and driving forces behind the crisis is, however,
important in order to draw appropriate conclusions to prevent its recurrence.
5. Section II describes the world economy before the crisis, and the eruption, evolution and
consequences of the global crisis. Section III reviews alternative hypotheses for the causes of the
global economic crisis as well as their empirical evidence. We will refute the frequently voiced
view that the global crisis was caused by global imbalances that reflected the export-oriented
strategy of East Asian countries, the accumulation of international reserves for self-insurance
motives by countries with surpluses, China‘s undervaluation of its exchange rate and the global
savings glut. Instead, we will argue that global imbalances were the result of the large excess
demand in the U.S. over an extended period—the financing of which was made possible by the
reserve currency status of the US dollar. This excess demand resulted from both the public debt
in the U.S. arising from the Afghanistan and Iraqi wars, tax cuts and the overconsumption by
households supported by the wealth effect from the housing bubble in the U.S. The housing
bubble itself was the outcome of the Fed‘s low interest rate policy in the aftermath of the burst of
the ―dot-com‖ bubble in 2001, the lack of appropriate financial regulation after the deregulation
in the 1980s and housing policies aimed at expanding the mortgage market to low-income
borrowers which was primarily a result of lobbying by the financial sector aimed at increasing
profits through further deregulation. When the housing bubble in the U.S. burst, the global crisis
ensued. Section IV discusses why China‘s trade surplus increased significantly in general and
with the U.S. in particular in recent years. We will argue that this increase was caused by both
the high corporate saving rates in China as a result of its dual-track approach to reform and the
relocation of the labor-intensive tradable sector of East Asian economies to China, which started
in the 1980s but accelerated after China‘s accession to WTO in 2001. Finally, the paper reflects
on the lessons for policy prescriptions from the crisis.
6 Global Economic Prospects 2011. 7 The need for changing the thinking and policy of macroeconomic management is discussed in the paper Beyond Keynesianism (chapter 3). 8 See Portes (2009) and Krugman (2009) for the former hypothesis. Rajan (2010), Lin (2010), Roubini and Mihm (2010), Laibson and Mollerstrom (2011) and Obstfeld and Rogoff (2010) for the latter.

4
II. The World Economy before the Crisis
6. The global economic crisis that began in 2007 was largely unexpected. Just before the
crisis, the IMF in its bi-annual World Economic Outlook announced that risks to the global
economy had become extremely low, given that capital inflows pushed up borrowing and asset
prices, while reducing spreads on risky assets.9 Also, since 2000, the world economy had
continuously expanded at high rates. High growth of the world economy was spread across
advanced, emerging and developing countries and allowed unemployment and poverty to decline
(Figure 1). High demand from fast-growing developing and emerging markets led to high
commodity prices that benefited growth in natural resource-rich countries.
9 IMF World Economic Outlook, April 2007.
0%
1%
2%
3%
4%
5%
6%
7%
1980-1999 2000-2008
Figure 1: Average Growth Rates Before the Crisis
World
Advanced Economies
Emerging & Developing Economies
Source: International Monetary Fund, World Economic Outlook.

5
7. Optimism on economic prospects and the sustainability of the strong growth performance
also emanated from the fact that the volatility of the business cycles in advanced industrial
countries had been declining (Figure 2). On the one hand, recessions had a less severe overall
impact and were of shorter duration. For example, the 1987 stock market crash in the U.S. did
not cause a recession; also, the 1990–91recession was relatively short and shallow. Similarly, the
burst of the ―dot-com‖ bubble had a relatively limited effect in the form of a mild recession and a
sluggish recovery. On the other hand, expansions lasted longer. This success in stabilizing the
business cycles has been referred to as the ―Great Moderation‖, defined as an era of low
inflation, high growth and modest recessions.10
8. The ―Great Moderation‖ was considered to be the result of several developments: for one,
business and financial deregulation as well as financial innovation had created a more flexible
and adaptable economic system. Financial assets were considered to be less risky than before,
giving rise to higher levels of financial intermediation which in turn helped fuel growth as well
as greater financial innovation, especially through hedge funds. Volatility of business cycles had
also declined because the world experienced abundant liquidity—partly reflecting surplus
savings in a number of emerging markets—giving the false sense that stability was due to some
structural improvement in the financial system. Also, growing globalization and free trade, partly
10 The term “Great Moderation” was coined by James Stock and Mark Watson (2002): “Has the Business Cycle Changed and why?”
0%
1%
2%
3%
4%
5%
6%
7%
8%
9%
10%
Figure 2: Standard Deviation of U.S. Gross National Product Growth
Sources: Bureau of Economic Analysis; National Bureau of Economic Research, "The American Business Cycle: Continuity and Change," edited by Robert Gordon.

6
boosted by China‘s entry into the World Trade Organization in 2001, as well as the buoyant
growth of China and other newly emerging economies was expected to keep inflation at bay
even as global growth accelerated.11
9. Moreover, many economists had expected that economic turbulences in one country
could not easily spread because decoupling had taken place to some extent. The decoupling
thesis argued that the booming economies of Brazil, Russia, India and China would rely on
domestic demand and would therefore not be affected by the meltdown of the subprime market.12
Also, many policymakers were not aware of the extent of inter-linkages in the financial
industries of Europe and the United States that contributed to the spread of the crisis.
10. Accompanying the period of strong expansion of the world economy was the emergence
of significant global imbalances, characterized by large current account surpluses in East Asia
and Europe and a widening current account deficit in the United States. Views on the importance
of these global imbalances differed sharply. Some economists (such as Fred Bergsten and
Miranda Xafa) viewed them as a threat to the world economy. In a testimony before the United
States Congress, Bergsten (2007) stated: ―The global imbalances probably represent the single
largest current threat to the continued growth and stability of the U.S. and world economies.‖
Similarly, Xafa (2007) argued before the crisis that ―The rising U.S. current account deficit has
increased concerns among policymakers about a possible abrupt disruption and disorderly
unwinding, involving a major sell-off of dollar assets, a sharp increase in US interest rates, and
an associated sharp reduction in U.S. absorption. Such an abrupt unwinding of imbalances,
triggered by a sudden loss of market confidence in the dollar, would obviously have negative
spillover market effects on financial markets and the global economy.‖ Others (such as Bernanke
2005a) considered imbalances to be the natural outcome of the underdevelopment of the
financial system in developing countries which prompted sustained increases in the demand for
U.S. dollar-denominated financial assets. With asymmetries in the demand for financial assets
between developing and emerging markets on the one hand and advanced economies on the
other hand unlikely to disappear any time soon, this view considered global imbalances to be
sustainable and therefore unlikely to present a risk to the global economy.
11 Roubini and Mihm 2010 , p. 26-31. 12 Roubini and Mihm 2010, p.115. The idea was first promoted by Jim O’Neil of Goldman Sachs, and then rapidly became the consensus. For example, in September 2008, German Minister of Finance Peer Steinbrueck declared: “The crisis is above all an American problem. The other G-7 ministers share this opinion.”

7
III. Eruption, Evolution and Consequences of the Crisis
Eruption
11. The global financial crisis erupted in September 2008 with the collapse of Lehman
Brothers, largely as a result of accumulating defaults on mortgages and derivative products. The
ensuing financial sector crisis quickly led to a significant decline in credit to the private sector as
well as to a sharp rise in interest rates. The resulting collapse in U.S. financial institutions led to
a collapse of equity markets (Figure 3) and of international trade and industrial production and
spread to other advanced economies as well as to emerging markets and developing countries.
Real growth around the world declined sharply below projections and advanced economies,
including the U.S., entered into a recession (Figure 4). Only China and developing Asia
maintained strong growth.
0
50
100
150
200
250
300
350
2000 2001 2002 2003 2004 2005 2006 2007 2008 2009 2010 2011Equ
ity
Mar
ket
Ind
ice
s, 2
00
0=1
00
Figure 3: Collapse of Equity MarketsUnited States
Japan
United Kingdom
China
Hong Kong SAR, China
Canada
Source: World Bank, Global Economic Monitor database.

Figure 4a: Regional Growth Rates
Source: International Monetary Fund, World Economic Outlook.
-4%
-2%
0%
2%
4%
2005 2006 2007 2008 2009 2010 2011
Advanced Economies
Actual Projected
0%
2%
4%
6%
8%
10%
2005 2006 2007 2008 2009 2010 2011
Developing and Emerging Economies
Actual Projected
-4%
-2%
0%
2%
4%
6%
2005 2006 2007 2008 2009 2010 2011
United States
Actual Projected
0%
5%
10%
15%
2005 2006 2007 2008 2009 2010 2011
China
Actual Projected
-6%
-4%
-2%
0%
2%
4%
2005 2006 2007 2008 2009 2010 2011
Euro Area
Actual Projected
0%
5%
10%
15%
2005 2006 2007 2008 2009 2010 2011
Developing Asia
Actual Projected

9
Figure 4b: Regional Growth Rates, Developing World
Source: International Monetary Fund, World Economic Outlook.
-5%
0%
5%
10%
2005 2006 2007 2008 2009 2010 2011
Central & Eastern Europe
Actual
Projected
-10%
-5%
0%
5%
10%
2005 2006 2007 2008 2009 2010 2011
Commonwealth of Independent States
Actual
Projected
-5%
0%
5%
10%
2005 2006 2007 2008 2009 2010 2011
Latin America & Caribbean
Actual
Projected
0%
2%
4%
6%
8%
2005 2006 2007 2008 2009 2010 2011
Middle East & North Africa
Actual
Projected
0%
2%
4%
6%
8%
2005 2006 2007 2008 2009 2010 2011
Sub-Saharan Africa
Actual
Projected

10
12. By many measures, the impact of the crisis reached proportions never before seen in
previous crises in modern history. The fall in GDP, the collapse of world trade, the rise in
unemployment, the credit slump that followed and the plummeting of the stock markets were
more severe than in any other crisis since World War II (Figure 5).
Figure 5: Comparison of Global Crisis to Great Depression
Equity Markets World Output Trade Volume
Source: Eichengreen and O’Rourke (2010).

11
The evolution of the global economic crisis
13. How did the crisis evolve? At the nucleus of the crisis was the burst of the bubble in the
U.S. real estate market. While house prices began falling precipitously only in the second quarter
of 2007, the growth rate of housing prices had been declining since 2005. In the late 1990s
housing prices had begun to rise sharply and increasingly deviated from their fundamentals.
Following their peak in April 2006, the bubble began to burst, also as a result of tightening of
monetary policy by the Federal Reserve (Figure 6). With signs that the incessant rise in real
estate was coming to an end, banks decided to end teaser rates on subprime mortgages and ask
borrowers of the so-called ―NINJA‖ loans—i.e., loans that had been made without any
declaration of income from the borrower—to start paying off debt. However, as the downturn in
house prices intensified, mortgage delinquencies, charge-offs and defaults accelerated (Figure 6).
The liquidation of foreclosed housing further accelerated the decline in the real estate market.
Banks that had overextended themselves on the housing market and were aware of a housing
glut, drastically reduced offering mortgages and the housing boom ended. In a downward spiral,
the decline in prices pushed more and more borrowers with adjustable-rate mortgages to default,
thus further endangering the position of banks and other financial institutions that had collected
subprime loans securitized through new instruments, in particular Collateralized Debt
Obligations (CDO‘s).13
14. The loss of value of CDO‘s led to large-scale sell-offs of these instruments and of assets
that were somehow connected to these defaults.14
This affected in particular hedge funds that had
become highly leveraged, with the riskiest having a debt-to-equity ratio of twenty to one. As a
case in point, when in the summer of 2007 the market began to fear that subprime CDO‘s might
lose much, if not most, of their value, two hedge funds run by Bear Stearns, which had invested
several billion U.S. dollars of short-term loans into highly illiquid subprime CDO tranches
started to lose most of their value. As a result, banks made margin calls and effectively withdrew
the short-term financing upon which the hedge funds had relied. The collapse of those two funds
portended the fate not only of hundreds of other hedge funds but also of the shadow banking
system as a whole—consisting of financial institutions, such as money market mutual funds,
mutual funds, and hedge funds, that perform the roles of banks, but are not regulated as such
(Roubini and Mihm 2010, p. 91).
13 See paragraph 74 for detailed discussion of these derivatives. 14 Lewis (2010).

12
Figure 6: Housing Price Declines and Mortgage Charge-offs and Delinquency in U.S.
15. The first signs of a serious crisis had already emerged in late 2007, when as a result of
growing defaults on mortgages a German and a British bank (IKB Deutsche Industriebank and
Northern Rock, respectively) collapsed. In response to these events, the Central Banks of the
United States, European Union, Canada and Switzerland had in December 2007 announced a
plan to provide at least $90 billion in short-term financing to banks and shortly afterwards the
European Central Bank injected $500 billion into the financial system.
16. In March 2008, Bear Stearns filed for bankruptcy and was bought by JPMorgan for less
than a tenth of its pre-crisis value. In September 2008, the crisis erupted with full force, when
Merrill Lynch, Lehman Brothers, and the insurance companies AIG and HBOS filed for
bankruptcy. Lehman Brothers‘ collapse was the largest bankruptcy in U.S. history. The collapse
of Lehman Brothers and other banks and insurance companies happened largely as a result of
their exposure to the bursting of the bubble in the real estate market.15
The banks had a highly
leveraged position that was vulnerable to a small decline in housing-related markets.
17. Lehman‘s fall led to a complete halt of credit between financial institutions, as the
uncertainty of their balance sheet positions made lending between them too risky (Figure 7). The
sudden halt of intra-bank lending triggered a liquidity crisis as well as bank runs.
15 Roubini and Mihm (2010).

13
Figure 7: LIBOR-OIS Spread
Sources: Bullard (2010), Financial Times, and Reuters. The LIBOR-OIS Spread (London Interbank Offer Rate -
overnight indexed swap) measures the risk of default associated with lending to other banks.
18. The U.S. government quickly responded through a $700 billion bank bailout to rescue the
financial sector from complete collapse as the leading financial institutions (banks, insurance
companies, pension funds) faced bankruptcy. Under the Troubled Assets Relief Program (TARP)
the US Treasury had the permission to insure or purchase up to $700 billion of commercial or
residential mortgage securities or any other financial instrument related to them to promote
financial market stability and encourage banks to resume lending, both between banking
institutions and to consumers and businesses. AIG, the largest insurance company, was also
saved from a liquidity crisis by an intervention from the Federal Reserve Board. To help
financial institutions restore credit, the Fed lowered its effective rate to a nominal rate of almost
0 percent. Shortly before the collapse of Lehman Brothers, the government had already taken
over Fannie Mae and Freddie Mac, which were in a difficult position given their operations as
sellers of mortgage securities in the secondary mortgage market.

14
19. The real economy was severely affected by the financial crisis. The recession affected
first the financial system and the housing sector, but it quickly spread through the rest of the real
economy. Consumer credit, which had been growing steadily during the boom years, fell sharply
(Figure 8). Companies that had expansion plans could not raise the capital necessary to finance
it. The number of new start-ups in the U.S. and worldwide fell considerably, as lending for new
projects became too risky (Figure 9).
Figure 8: U.S. Consumer Credit during the Crisis
Source: International Financial Statistics.

15
Figure 9: One Year Growth in New Firms
Source: Klapper and Love (2010).
20. The U.S. recession started in December 2007 and lasted for 18 months, when growth
began slowly to pick up (Figure 10). The crisis brought about a jump in U.S. gross debt from
62.2 percent of GDP before the crisis to 93.5 percent of GDP in 2010, largely reflecting a sharp
downturn in tax revenue.16
Figure 10: U.S. GDP During the Crisis
16 IMF. 2011 Article IV Consultation with the United States.

16
21. Demand fell across all sectors, but the decline was larger for goods than for services.
Retail sales collapsed as uncertain consumers postponed durable goods purchases and their
holidays. The automotive industry observed a sharp fall in demand, which led to large-scale
restructuring, with considerable job losses (Figure 11). Chrysler and General Motors filed for
bankruptcy (in May and June 2009, respectively) and the U.S. Treasury rescued the companies
by becoming equity shareholders, as part of the $787 billion fiscal stimulus package put in place
by the U.S. government.
22. Capacity utilization rates fell sharply during the crisis. Starting in September 2008, the
production and capacity utilization levels for manufacturing declined abruptly (Figure 12). As
demand for durable goods collapsed, capacity utilization rates in manufacturing plummeted. The
automobile sector was hit particularly hard, as its capacity utilization rates reached historic low
levels, below 40 percent. The restructuring of most automobile companies was inevitable given
the low levels of capacity utilization and the bankruptcy filing of many of them.
50
55
60
65
70
75
80
330
340
350
360
370
380
390
2006-01 2007-01 2008-01 2009-01 2010-01 2011-01
US$
, mill
ion
s
US$
, mill
ion
s
Figure 11: U.S. Monthly Retail Sales
Monthly retail sales, total Motor Vehicle and Part Dealers (right)
Source: Federal Reserve.
(right axis)

17
Figure 12: Capacity Utilization
Source: Federal Reserve.
23. Employment levels declined precipitously in the goods-producing sector of the economy,
while the services sector was more resilient to the crisis (Figure 13). Job losses in the American
economy totaled more than 7 million jobs, almost 7 percent of total U.S. employment. The
construction sector employed, at the trough of the crisis, almost 30 percent fewer people than at
the beginning of the recession.
Figure 13: U.S. Employment Levels
24. Unemployment rose nationwide, but its distribution was uneven across sectors, skills and
states. The construction and durable goods sectors were the most severely hit. The downturn was

18
even more drastic in states that had experienced a large housing boom, or in the rust belt where
the relative size of manufacturing is important. Unemployment increased more for workers
without qualifications, as they were dominating sectors hit by the crisis (construction, leisure and
transportation). Average unemployment duration is still increasing, and the share of long-term
unemployed has reached unprecedented levels (Figure 14).
Figure 14: U.S. Unemployment Trends
25. The resulting recession in the U.S. quickly spread to other advanced economies as well as
to emerging markets and developing countries, triggering fears of a renewed depression. A few
0%
5%
10%
15%
20%
25%
30%
Un
em
plo
yme
nt
rate
a) Unemployment by Sector
Construction ManufacturingDurable Goods Wholesale & RetailHospitality
Source: Bureau of Labor Statistics.Note: Unemployment data not seasonally adjusted.
0%
2%
4%
6%
8%
10%
12%
14%
16%
18%
Un
em
plo
yme
nt
rate
b) Unemployment by Educational Level
Less than High School High SchoolLess than College CollegeNational
Source: Bureau of Labor Statistics.Note: Unemployment data seasonally adjusted.
0%
10%
20%
30%
40%
50%
2%
4%
6%
8%
10%
12%
Jan 1950 Nov 1956 Sep 1963 Jul 1970 May 1977 Mar 1984 Jan 1991 Nov 1997 Sep 2004 Jul 2011
Un
em
plo
yme
nt
rate
Un
em
plo
yme
nt
rate
c) Long Term Unemployment
National (left axis) Share Unemployed more than 27 weeks
Source: Bureau of Labor Statistics.Note: Unemployment data seasonally adjusted.

19
statistics demonstrate the depth of the crisis: in 2009, world GDP fell by 1.9 percent. In high
income countries it fell by 3.4 percent (2.6 percent in the US, 5.2 percent in Japan, 4.9 percent in
the U.K. and 4.3 percent in the EU). In emerging markets, GDP growth fell to about 0.5 percent,
while developing countries maintained a reasonably good growth performance of above 4
percent. World trade in 2009 was around 65 percent lower than in the previous year (see Figure
15). Equity markets collapsed (as shown in Figure 3). Unemployment around the world rose
sharply (Figure 16). It surpassed 15 percent in countries like Spain and Greece that already had
high levels of unemployment before the crisis (Figure 17).
-40%
-30%
-20%
-10%
0%
10%
20%
30%
40%
4
6
8
10
12
14
16
18
Jan
-00
Jul-
00
Jan
-01
Jul-
01
Jan
-02
Jul-
02
Jan
-03
Jul-
03
Jan
-04
Jul-
04
Jan
-05
Jul-
05
Jan
-06
Jul-
06
Jan
-07
Jul-
07
Jan
-08
Jul-
08
Jan
-09
Jul-
09
Jan
-10
Jul-
10
Cu
rre
nt
US$
, tr
illio
ns
Figure 15: World Imports and Exports
World Exports Percent Change (right axis)
Source: International Monetary Fund, Direction of Trade Statistics.

20
26. The global slowdown in growth heightened vulnerabilities that had already been in place
before the crisis. Notably, countries that had their own housing booms, like Ireland and Iceland,
or had high fiscal deficits before the crisis, like Greece and Portugal, now teetered on the brink
of a sovereign debt crisis and required support from the European Central Bank (ECB) and
International Monetary Fund. At present, the fiscal crisis in peripheral Euro countries has already
turned into a sovereign debt crisis in the Euro zone, with potentially significant consequences for
the world economy as a whole.
0%
2%
4%
6%
8%
10%
12%
14%
1999 2000 2001 2002 2003 2004 2005 2006 2007 2008 2009
Figure 16: Unemployment Rates in World Regions Developing Europe & Central Asia
European Union
Latin America & Caribbean
Middle East & North Africa
North America
Industrialized East Asia
Sources: International Monetary Fund, Middle East and Central Asia Regional Economic Outlook April 2011 and World Economic Outlook Database April 2011; International Labour Organization,
Key Indicators of the Labour Market database.
0%
5%
10%
15%
20%
25%
Q1 2000 Q1 2002 Q1 2004 Q1 2006 Q1 2008 Q1 2010
Figure 17: Unemployment Rate in Crisis Economies
Spain
Portugal
Ireland
Greece
United States
Source: International Monetary Fund, International Financial Statistics.

21
The spread of the crisis
27. What were the channels that allowed the crisis to spread? One channel was money
markets. The collapse of Lehman Brothers on September 15, 2008, made the short-term debt that
it had issued effectively worthless, triggering panic among the various investors and the funds
that held it. This panic resulted in a run on the money market funds that provided lending to the
commercial paper market, increased perceptions of default risk, and sowed further panic
throughout the global financial system (see also Figure 7). Consequently, commercial banks
significantly decreased lending rates following concerted efforts by central banks to inject
liquidity into the system.
28. In addition, letters of credit and commercial paper to guarantee that goods in transit
between trading partners would be paid for when they reached the final destination were no
longer available following the collapse of Lehman Brothers—resulting in the freezing of credit
markets (Figure 18).17
As a result, global trade came to a standstill. At the peak of the crisis in
early 2009, exports fell—on a year-to-year basis—by 30 percent in China and Germany, and by
37 percent or even 45 percent in Singapore and Japan, respectively.
29. Also, while total remittances dropped only marginally, remittances from some groups of
workers, in particular migrant workers from Central American countries in the construction
17 Roubini and Mihm 2010, p. 118.
0
200
400
600
800
1000
1200
1400
2001-01 2002-07 2004-01 2005-07 2007-01 2008-07 2010-01
US$
, bill
ion
s
Figure 18: U.S. Commercial Paper Outstanding
Asset backed Non-asset-backed
Source: Federal Reserve.
Subprime Crisis
Lehman Brothers

22
sector in the U.S. – who had been laid off in the wake of the crisis – stopped sending money
home, causing a drop-off in aggregate demand in these countries, many of which were highly
dependent on inflows (Figure 19). The drop in remittances caused a significant slide in growth in
these Central American countries (see also Figure 4b). Furthermore, the tight relationship of the
U.S. housing market and remittances to Mexico has become somewhat more tenuous, as workers
shifted to other sectors (Figure 20).
Figure 20: Decoupling of Remittances to Mexico and U.S. Housing
0.0%
0.5%
1.0%
1.5%
2.0%
2.5%
0
10
20
30
40
50
60
70
1990 1992 1994 1996 1998 2000 2002 2004 2006 2008
Cu
rre
nt
US$
, b
illio
ns
Figure 19: Remittances to Latin America and the Caribbean
Current US$, billions % of GDP (right axis)
Source: World Bank staff estimates based on International Monetary Fund balance of payments data, and World Bank and Organization of Economic Co-operation and Development GDP estimates.

23
30. A further factor driving the international contagion was the collapse in international
commodity prices, especially oil, as a result of the fall in demand in the advanced economies.
This led to a serious fiscal crisis in most oil-exporting countries. As illustrated in Figure 21, oil
prices had initially reached a real price, in 2005 dollars, of about $110 per barrel, up from $60 a
year earlier. In the run-up to the crisis, the commodity price hikes further compounded the effect
of the collapse in the financial sector and pushed these advanced countries further into recession.
Loose monetary policy also triggered these commodity price increases, as it diverted demand
away from U.S. Treasury bills.18 In environments with tight commodity markets and declining
interest rates, there is a perverse incentive to convert commodities into assets.
18 Caballero, Farhi, and Gourinchas (2008).
0
20
40
60
80
100
120
Q1 1959
Q1 1962
Q1 1965
Q1 1968
Q1 1971
Q1 1974
Q1 1977
Q1 1980
Q1 1983
Q1 1986
Q1 1989
Q1 1992
Q1 1995
Q1 1998
Q1 2001
Q1 2004
Q1 2007
Q1 2010
Pri
ce p
er
bar
rel,
20
05
US$
Figure 21: Real Price of Brent Crude
Sources: International Monetary Fund, International Financial Statistics; and U.S. Department of Commerce, Bureau of Economic Analysis.

24
III. What Was the Root Cause of the Crisis?
31. The root causes of the crisis are subject to considerable debate. The debate largely
revolves around the role of global imbalances, as well as the importance of domestic versus
international factors in the emergence of the U.S. housing bubble. This section tries to structure
the two main competing hypotheses and assess supporting evidence.
32. All attempts to explain the global financial crisis center on the burst of the housing
bubble in the United States and differ on the role played by global imbalances in its genesis and
their cause. The first hypothesis argues that the global imbalances were brought about by
economic policies of East Asian economies, including their export-led growth strategy, the
accumulation of international reserves driven by a self-insurance motive and the undervaluation
of the Chinese exchange rate. The argument for the export-led growth strategy holds that East
Asian countries‘ systematic promotion of exports through a variety of macroeconomic and
microeconomic policies, including dumping, was crucial in creating the global imbalances. The
self-insurance motive hypothesis argues that the desire of East Asian countries to accumulate
international reserves as a protection against a repeat of their balance of payments crises in 1998
– in which many countries were forced to request assistance from the International Monetary
Fund – was a critical factor in creating the current account surpluses. Lastly, the perception that
the Chinese authorities were maintaining an artificially low level of the RMB and thereby
supporting the country‘s export competitiveness has been repeatedly mentioned as a key factor
behind China‘s rising trade surplus and global imbalances. All three types of policies were
credited with creating the global savings glut, which in turn was regarded as the key condition
bringing about low world interest rates, unbridled growth in the financial sector and ultimately
the housing bubble whose burst triggered the global financial crisis.
33. The second hypothesis argues that the emergence of the housing bubble in the U.S. was
primarily homemade, reflecting the expansion of the mortgage market to low-income segments
of the population, the loose stance of monetary policy following the burst of the ―dot-com‖
bubble, and failures in the regulation, incentive, design and structure of the mortgage and
financial markets, including the rise of a shadow banking system largely outside the purview of
bank regulators (e.g., Roubini and Mihm 2010).19, 20
The overconsumption of households made
possible by the wealth effect resulting from the housing bubble on the one hand and the public
debts brought about by the fiscal policy of the United States as a result of the Iraq and
19 Laibson and Mollerstrom (2010). 20 For a similar view, see also Obstfeld and Rogoff (2010) who find that both global imbalances and the financial crisis originate primarily in economic policies followed in a number of countries in the 2000s (including in the United States) and in distortions that influenced the transmission of these policies through U.S. and ultimately through global financial markets. Specifically, they argue that it was the interaction among the Fed’s monetary stance, global real interest rates, credit market distortions, and financial innovation that created the toxic mix of conditions making the U.S. the epicenter of the global financial crisis.

25
Afghanistan wars and the Bush tax cuts on the other hand led to large current account deficits in
the U.S. These deficits could be financed because of the U.S. dollar‘s reserve currency status.
This hypothesis essentially attributes the crisis to a range of policies pursued by the United States
(monetary, fiscal, housing) that encouraged unsustainable overconsumption in the United States,
triggering global imbalances and catalyzing the creation of the real estate bubble. The following
section analyzes each of these hypotheses in detail.

26
III.1 Hypothesis I: Global Imbalances Led to the Housing Bubble and the Global
Financial Crisis
Policies of East Asian countries
34. As mentioned above, three types of policy choices of East Asian countries have been
proposed as causes of global imbalances: (i) East Asian economies‘ export-led growth strategy21
;
(ii) the self-insurance motivation for foreign currency reserve accumulation after the East Asian
financial crisis22
; and (iii) China‘s exchange rate policy23
. All three policies have in common that
they create artificially high trade and current account surpluses in East Asian countries: the
export-led growth strategy through microeconomic and macroeconomic policies aimed at
increasing exports; the self-insurance argument as a result of the deliberate accumulation of
international reserves by the Central Bank; and China‘s exchange rate policy by maintaining the
exchange rate of the RMB to the U.S. dollar at an artificially low level. An export-led growth
strategy has been pursued by the East Asian economies at least since the 1960s. If this hypothesis
was true, it should have caused trade surpluses from the time the strategy was pursued and
should have caused other countries competing with East Asian economies‘ exports to reduce
their trade surplus, possibly even resulting in trade deficits. If the self-insurance argument as a
key explanation for global imbalances was accurate, global imbalances should be primarily the
result of a rise in trade surpluses of countries that have accumulated reserves for the purpose of
self-insurance and countries that do not have to be concerned about a balance of payments crisis
because their currency is a reserve currency should not see a marked rise in their trade surpluses.
Lastly, if China‘s exchange rate policy is to blame for global imbalances, the evolution of its
external surplus should be correlated with changes in its exchange rate. Moreover, other
developing countries competing with China‘s exports should have reduced their trade surplus or
even encountered trade deficits.
35. East Asian economies’ export-led growth strategy: Indeed, the trade surpluses in East
Asian economies have increased dramatically in recent years. However, the East Asian
economies had already adopted an export-led growth strategy since the 1960s. In fact, a
sustainable export-led growth strategy is not based upon targeting an ever-expanding trade
surplus, but rather on pursuing a continuously greater integration with international markets that
leads to an expansion of both exports and imports, generating higher quality jobs in the tradable
sector than before. Given that this type of strategy has been pursued for decades and led to a
21 Klein and Cukier (2009) exemplifies this argument. 22 Aizenman (2008) and Aizenman and Lee (2008) provide evidence of self-insurance motives in East Asia. Ben-Bassat and Gottlieb (1992) also supports this viewpoint with a general model tested with Israeli data. 23 Goldstein and Lardy (2009) offers a review of this viewpoint and argues that a 40 percent appreciation could eliminate China’s global current account surplus. Jeanne (2011) presents a model in which savings and capital controls are used to undervalue the real exchange rate.

27
secular increase in both exports and imports, it cannot possibly have been the root cause of large
global imbalances in 2000 and onwards (Figures 22 and 23).
-20%
-15%
-10%
-5%
0%
5%
10%
15%
20%
25%
19
60
19
62
19
64
19
66
19
68
19
70
19
72
19
74
19
76
19
78
19
80
19
82
19
84
19
86
19
88
19
90
19
92
19
94
19
96
19
98
20
00
20
02
20
04
20
06
20
08
20
10
Figure 22: Ratio of Trade Balance to GDP in Asian countries
Japan
Korea
Taiwan
China
Sources: International Monetary Fund, World Economic Outlook database; Organization for Economic Co-operation and Development National Accounts data files; Taiwan Statistical Databook; and World Bank national accounts data.
-0.8
-0.6
-0.4
-0.2
0
0.2
0.4
0.6
0.8
1960 1964 1968 1972 1976 1980 1984 1988 1992 1996 2000 2004 2008
Imp
ort
s o
ver
GD
P
E
xpo
rts
ove
r G
DP
Figure 23: Decomposition of Ratio of Trade Balance over GDP
Japan
Korea
Taiwan
China
Sources: International Monetary Fund, World Economic Outlook database; Organization for Economic Co-operation and Development National Accounts data files; Taiwan Statistical Databook; and World Bank national accounts data.

28
36. The self-insurance motive: After the financial crisis in the late 1990s, emerging market
economies in East Asia increased their current account surplus substantially and consequently
experienced rising levels of international reserves. The self-insurance hypothesis argues that this
rise in the international reserve position was primarily motivated by a desire to avoid recourse to
international lenders in the case of a further balance of payments crisis, i.e., as an insurance
against future contingencies and that these countries deliberately pursued policies to increase
trade surpluses with a view to facilitating this reserve accumulation, hence causing global
imbalances. However, the self-insurance motive is not a credible argument in that other countries
like Germany and the Netherlands that do not have a need for self-insurance, given that their
currencies are fully convertible hard currencies, have also substantially increased their trade
surpluses and therefore also contributed to rising global imbalances (Figure 24). Attributing the
emergence of growing global imbalances to the self-insurance motive would thus not explain the
important role in the evolution of these imbalances played by the widening trade surpluses of
other economies that do not have a self-insurance motive. Moreover, at more than $3 trillion,
China‘s reserves are now well beyond what could be justified by a self-insurance motive. In fact,
Obstfeld and Rogoff (2010) attribute the rise in reserves to hot money inflows as well as foreign
direct investment which augmented the impact of growing current account surpluses.

29
Figure 24: Total Reserves and Net Trade
Germany
The Netherlands
China
Source: World Bank, World Development Indicators.
050
100150200250300
US$
, bill
ion
s
a) Levels
Total Reserves, nominal
Net trade in goods, nominal
0%
2%
4%
6%
8%
10%
Pe
rce
nta
ge
b) As a Percentage of GDP
Total reserves to GDP
Net trade to GDP
0
20
40
60
80
US$
, bill
ion
s
c) Levels
Total Reserves, nominal
Net trade in goods, nominal
0%
5%
10%
15%P
erc
en
tage
d) As a Percentage of GDP
Total reserves to GDP
Net trade to GDP
-500
0
500
1000
1500
2000
2500
US$
, bill
ion
s
e) Levels
Total Reserves, nominal
Net trade in goods, nominal
-10%
0%
10%
20%
30%
40%
50%
Pe
rce
nta
ge
f) As a Percentage of GDP
Total reserves to GDP
Net trade to GDP

30
37. China’s exchange rate policy has been blamed since 2003 as a root cause of global
imbalances; the argument is that the Chinese authorities‘ objective to maintain the renminbi at an
artificially low level in order to boost exports and reduce imports was the key reason for the
build-up in global imbalances.24
The bill co-sponsored by Senators Charles Schumer and Lindsey
Graham in 2005, which called for a 27.5 percent tariff on all imports from China, is just one
example of this type of claim. While the bill was later withdrawn, the sentiment it represents
broadly corresponds to public opinion in the United States and other countries. However, those
arguments are questionable:
38. First, the extent of over- or under-valuation of the renminbi is subject to considerable
debate. Estimates of the undervaluation of the RMB vary to a significant degree and range from
3 percent (Funke and Rahn 2005) to 50 percent (Ferguson and Schularick 2009). They are also
highly dependent on the model that is being employed: Most empirical calculations of the
undervaluation rely on the theory of purchasing power parity (PPP), the theory that the same
good should have the same price in two different countries. Although this is an intuitively
appealing theoretical concept, it has proven to be unreliable in reality: prices are consistently
lower in developing countries than in industrialized countries. At the same time, capital-intensive
goods will be more costly to produce in developing than in developed countries. Some estimates
aim at defining what the RMB‘s value would be by attempting to control for predictable
divergences from PPP, but even such divergences are subject to a high degree of uncertainty.
39. Another approach is based on the fundamental equilibrium exchange rate method. It aims
at assessing the extent to which an exchange rate would have to adjust in order to attain the value
of the current account that is in line with its fundamental value.25
Obviously, estimates will be
highly subjective depending on the judgment about the fundamental value of the current account
as well as the relationship between a change in the value of the exchange rate and the current
account balance. Overall, there seems little consensus on the extent to which the renminbi
deviates from its equilibrium value.
40. Moreover, the theoretical underpinnings for an expected exchange rate appreciation of
the RMB are unclear: one of the major theoretical foundations for the claim that the RMB is 24 For example, Paul Krugman (2010a, 2010b), argued that the undervaluation of the renminbi (RMB) caused the large US trade deficit and that the consequent Chinese purchase of US Treasury bonds lowered interest rates in the United States and caused the real estate and equity bubbles that subsequently led to the financial crisis. Low real interest rates also provided investment banks with a strong incentive to structure new and complex financial instruments that during the crisis helped to multiply the effect of failing mortgages throughout the entire financial system. Also Lardy (2005): “Exchange Rate and Monetary Policy in China,” Cato Journal. 25 The FEER was introduced by Williamson (1983): “Exchange Rate System—Policy Analyses in International Economics 5,” Institute for International Economics, Washington DC. For an application of the FEER model to China, see Wang (2004): “Exchange Rate Dynamics,” in Eswar Prasad, ed.: “China’s growth and integration in the World Economy.” International Monetary Fund, Occasional Paper 232, Ch.4.

31
undervalued is the Balassa-Samuelson theorem. The Balassa-Samuelson theorem postulates that
rapidly growing economies have a long-run trend of a real appreciation of the exchange rate. A
recent paper by Lin, Ju and Liu (2011), however, shows in a multi-sector model, that with large
surplus labor in the traditional sector the real exchange rate of a rapidly growing country may not
appreciate, until surplus labor has been depleted. Given China‘s continued abundant labor supply
from rural parts of the country, the fact that the exchange rate has not been appreciating
significantly is thus not a sign of exchange rate manipulation.
41. More fundamentally, some economists (e.g., McKinnon 2010) argue that the effect of an
exchange rate appreciation on the current account may be ambiguous. In his view, the exchange
rate plays little role in the adjustment of the current account, as the current account simply
reflects savings-investment balances and these balances are determined by structural factors that
may not be systematically related to the exchange rate. McKinnon argues that under financial
globalization, forcing a creditor country such as China to appreciate its currency is neither
necessary nor helpful for reducing its trade surplus. The trade balance is by necessity equal to the
difference between savings and investments, but savings and investments are related to
macroeconomic balances. Therefore, a focus on the exchange rate as determining savings and
investments is misguided. For example, one cannot presume that U.S. net saving will rise when
the U.S. dollar is devalued.
42. Moreover, if the undervaluation of the RMB was the reason for the global imbalance, we
should see three empirical phenomena:
When the RMB appreciated by 20 percent in 2005-2008, the U.S. trade deficit with China
should have declined.
The US‘s trade deficit with other countries competing with China should have declined,
causing other countries to reduce their trade surplus.
China‘s trade surplus with other countries should increase.
43. First, the U.S.-China current account deficit increased constantly until 2007, despite the
20 percent appreciation of the renminbi since 2005 (Figures 25 and 26). Partly, this reflected the
fact that prices of U.S. imports remained unchanged—in spite of the appreciation of the RMB—
as the large and growing export share of Chinese producers gave them rising market power and
allowed them to pass on the rising cost in dollars to wholesalers. 26
At the same time, it would
have been even more expensive for the U.S. to import from other countries than from China. In
addition, global imbalances already began to grow in 2002, and China has been accused of
26 Goldstein and Lardy (2008): p. 24.

32
causing the imbalance by sustaining a large undervaluation of its real exchange rate only since
2003. Nevertheless, China‘s trade surplus did not become large until 2005, and its global trade
surplus in 2003 was smaller than that in 1997 and 1998 (Figures 27 and 28). Interestingly, in
1998, at a time when the RMB was still pegged to the U.S. dollar, China‘s currency was viewed
as substantially overvalued (Lardy 2005).
4.0
4.5
5.0
5.5
6.0
6.5
7.0
7.5
8.0
8.5
9.0
0.0
0.2
0.4
0.6
0.8
1.0
1.2
1.4
1.6
1.8
1994 1995 1996 1997 1998 1999 2000 2001 2002 2003 2004 2005 2006 2007 2008 2009 2010
RM
B p
er
US$
US$
, tri
lion
s
Figure 25: Global Trade of China
Exports Imports Trade Balance Chinese Exchange Rate (right axis)
Source: International Monetary Fund, International Financial Statistics.

33
44. Second, if indeed the undervaluation of the RMB was the main reason for the rising U.S.
trade deficit and China‘s trade surplus, the trade deficit of the United States of other countries
that compete with China should have declined. However, most other developing countries also
increased their current account surpluses and reserves substantially in the same period (see
figures 27 and 28 below).
95
100
105
110
115
120
125
-500
-400
-300
-200
-100
0
100
200
1999 2000 2001 2002 2003 2004 2005 2006 2007 2008 2009 2010
20
05
=10
0
US$
, bill
ion
sFigure 26: China-US Bilateral Trade
and Balance on Current Account
Exports of Goods and Services and Income receipts
Imports of Goods and Services and Income Payments
Balance on Goods and Services
Balance on Current Account
RMB Real effective exchange rate (right axis)
Sources: Bureau of Economic Analysis; IMF, International Financial Statistics

34
-3%
-2%
-1%
0%
1%
2%
3%
1996 1997 1998 1999 2000 2001 2002 2003 2004 2005 2006 2007 2008 2009 2010
Pe
rce
nt
of
wo
rld
GD
PFigure 27: Current Account Global Imbalances
United States Oil Exporters Germany and Japan OCADCChina and EMA Rest of World Discrepancy
Source: International Monetary Fund, World Economic Outlook.Note: OCADC is composed of Bulgaria, Croatia, Czech Republic, Estonia, Greece, Hungary, Ireland, Latvia, Lithuania, Poland, Portugal, Romania, Slovak Republic, Slovenia, Spain Turkey, and the United Kingdom.; EMA is composed of Hong Kong SAR, China; Indonesia; Korea; Malaysia; Phiippines; SIngapore; Taiwan, China; and Thailand.

35
45. Third, if indeed the RMB undervaluation was the main reason for the trade deficit of the
United States and China‘s trade surplus with other countries – such as Japan; Korea; Taiwan,
China; and Germany – China‘s trade surplus with these countries should have widened.
However, to the contrary, China‘s trade surplus with other advanced countries turned into a
deficit (Figure 29).
0
1
2
3
4
5
6
1995 1996 1997 1998 1999 2000 2001 2002 2003 2004 2005 2006 2007 2008 2009 2010
US$
, tri
llio
ns
Figure 28: Foreign Exchange Reserves of Developing Countries
Other Developing China Russia India Brazil
Source: World Bank, World Development Indicators.

36
46. The above evidence shows that the exchange rate does not seem to be a significant
determining factor for the evolution of the U.S.-China current account deficit. Over the last
decade, the rise in U.S. imports from China has been continuous and stable. Those slow trends
are not affected by the depreciation of the U.S. dollar-renminbi real effective exchange rate in
2001-2004, or by its appreciation in 2005-2008. Key reasons are structural changes in the
economy of China and, related to that, of other Asian economies as well as US monetary and
fiscal policies (as discussed in section IV).
47. The above three hypotheses all imply that the East Asian economies are driving the
global imbalances. If any of the three or the combination of all three represents the causes of the
global imbalance, the share of the US‘s trade deficits with the East Asian economies in its total
deficits should have increased. However, while the United States‘ trade deficits with China
increased substantially, the share of the U.S. trade deficit with East Asian economies as a region
actually declined significantly (Figure 30). The above evidence indicates that the three
commonly accepted causes may have contributed to but cannot be the main cause of the global
imbalances.
-140
-120
-100
-80
-60
-40
-20
0
20
2000 2001 2002 2003 2004 2005 2006 2007 2008 2009 2010
US$
, bill
ion
sFigure 29: Chinese Trade Balance with East Asia
Taiwan, China
Korea
Japan
Source: United Nations Comtrade, World Integrated Trade Solution; authors' calculations.

37
Figure 30: Average Share of Trade Deficit of East Asian Countries in U.S. Trade Deficit
Source: United Nations Comtrade, World Integrated Trade Solution.
Global savings glut and interest rates
48. One of the most important channels through which global imbalances are considered to
have caused the global economic crisis is through the impact on interest rates (Krugman 2009;
Summers 2008). The hypothesis is that the global savings glut put extreme downward pressure
on interest rates and thereby catalyzed the real estate boom in many countries and the risky
innovations in the financial sector that were crucial to the global contagion of the financial crisis.
However, recent research27
highlights that the global savings glut or ―excess savings‖ may not be
related to the downward pressure on world interest rates and the financing of the booms in those
countries.
49. A paper by Borio and Disyatat (2011) on the relationship between excess savings
associated with current account imbalances and world interest rates concludes that this link may
be tenuous. The authors stress that only financial flows can have an impact on world interest
rates. However, current accounts and net capital flows say little about financing, as they do not
allow statements on the underlying changes in gross flows and their contributions to existing
stocks, including the transactions involving trade in financial assets. As a result, current account
imbalances provide little information on the role a country plays in international borrowing,
lending and financial intermediation, about the degree to which its real investments are financed
from abroad and about the impact of cross-border capital flows on domestic conditions.
27 Borio and Disyatat (2011), Bank for International Settlements. Laibson and Mollerstrom (2010).
East Asian
Countries51%
Other Countries
49%
1990-1999
East Asian
Countries38%
Other Countries
62%
2000-2009

38
50. Also, the link between current account balances and long-term interest rates appears
tenuous. For example, U.S. dollar long-term interest rates tended to increase between 2005 and
2007 with no apparent reduction in either the US current account deficit or net capital outflows
from surplus countries, such as China (Figure 31). Moreover, the sharp fall in U.S. long-term
interest rates since 2007 has taken place against a backdrop of improvements in the U.S. current
account deficit, and hence smaller net capital flows (Figure 32).28
28 Obstfeld and Rogoff (2010) also note that data do not support a claim that the proximate cause of the fall in global real interest rates starting in 2000 was a contemporaneous increase in desired global saving, given that global saving fell between 2000 and 2002 by 1.8 percent of world GDP and aggregate global saving rose only later in the decade.

39
Figure 31: Global Current Account Balance and Net Capital Flows
Sources: Borio and Disyatat (2011); International Monetary Fund.
Figure 32: U.S. Current Account and Financial Variables
Sources: Borio and Disyatat (2011); Bloomberg; and International Monetary Fund.

40
51. Moreover, the link between the U.S. current account deficit and global savings appears to
be weak. While the deficit began its trend deterioration in the early 1990s, the world savings rate
actually trended downward toward the end of 2003. In contrast, the stabilization and reductions
in the U.S. current account deficit since 2006 have occurred against the backdrop of a continued
upward drift in emerging market saving rates (Figure 33). 29
Furthermore, there does not seem to
be a clear link between the global savings rate and real interest rates or term premia. Both real
world long-term interest rates as well as term premia have trended downward irrespective of
developments in the global saving rate.
Figure 33: Global Savings Rate, Interest Rates, and GDP Growth
Sources: Borio and Disyatat (2011); International Monetary Fund; and Organization for Economic Co-operation and Development.
52. Doubts on the impact of the global savings glut on the housing bubble in the United
States are also raised by Laibson and Mollerstrom (2010). The authors show that global savings
rates did not show a robust upward trend during the period of the expansion of the bubble.
Moreover, if there had been a global savings glut there should have been a large investment
boom—to the tune of at least 4 percent of GDP—as U.S. households should have chosen to
invest a substantial share of those funds to help make the interest payments. However, the U.S.
investment rate did not rise between 1995 and 2005, and in 2005 ended only 1.6 percentage
points higher than in 1995. Moreover, when Bernanke formulated his global savings glut
hypothesis, the investment rate was lower than in 1996. In fact, there was no investment boom,
but a consumption boom (Figure 34).
29 The point about falling interest rates coinciding with a falling global savings rate is also made by Laibson and Mollerstrom (2010).

41
53. To summarize, there is considerable evidence that the global savings glut did not cause
the global imbalances.
III.2 Hypothesis II: U.S. Policies Led to the Housing Bubble, Global Imbalance and the
Global Financial Crisis
54. Instead, it appears that global imbalances reflected policies and structural factors
affecting savings in the United States. Lin, Dinh and Im (2010) argue that the housing bubbles
were triggered by the Fed‘s low interest rate policy following the burst of the ―dot-com‖ bubble
in 2001 and magnified by the financial deregulation in the 1980s, which will be discussed later.
In combination with a range of policies aimed at expanding the availability of mortgages to low-
income borrowers in the subprime market, the above policy changes led to excessive risk-taking
and higher leverage, resulting in excess liquidity, and ―bubbles‖ in both housing and equity
markets in the United States. The wealth effect of these bubbles enabled US households to over-
consume, which, together with the public debts arising from the Afghanistan and Iraqi wars and
a range of tax cuts, increased the United States‘ current account deficits. If this hypothesis is
correct, a causal link needs to exist between monetary, fiscal and housing policies of the United
States, and its large and growing current account imbalance.
55. The Fed‘s monetary policy had been loose from the 1980s and turned extremely
expansionary when the burst of the technology bubble in early 2000 caused a recession. In the
run-up to the bubble‘s burst, and as stock prices continued to rise, the Fed did not intervene.
However, when the bubble burst, consumers experienced a significant wealth loss. With
0
1
2
3
4
5
6
7
8
9
10
19
47
-01
-01
19
49
-07
-01
19
52
-01
-01
19
54
-07
-01
19
57
-01
-01
19
59
-07
-01
19
62
-01
-01
19
64
-07
-01
19
67
-01
-01
19
69
-07
-01
19
72
-01
-01
19
74
-07
-01
19
77
-01
-01
19
79
-07
-01
19
82
-01
-01
19
84
-07
-01
19
87
-01
-01
19
89
-07
-01
19
92
-01
-01
19
94
-07
-01
19
97
-01
-01
19
99
-07
-01
20
02
-01
-01
20
04
-07
-01
20
07
-01
-01
20
09
-07
-01
20
05
US$
, tri
llio
ns
Figure 34: US Real Consumption Expenditures
Source: U.S. Department of Commerce, Bureau of Economic Analysis.

42
consumption and economic activity falling and the economy heading toward a recession, the
U.S. Federal Reserve adopted an aggressive monetary policy to mitigate these effects, reducing
the funds rate 27 times from 6.5 percent in March 2001 to 1 percent in June 2003 (see Figure 35
for the evolution of the Federal Funds rate).30
Testifying before Congress on July 15, 2003,
Federal Reserve Chairman Alan Greenspan stated that the economy was not ―showing
convincing signs of a sustained pickup of growth,‖ such that a further interest rate easing could
encourage growth without ―ultimately stoking inflationary pressures‖. Other events in the U.S.
also contributed to the Federal Reserve‘s decision to maintain the low interest rate policy. For
instance, after the 9/11 terrorist attacks, U.S. stock markets responded with a sharp decline,
raising concerns about the health of the U.S. economy after the terrorist attacks. As a result of the
active monetary policy, the U.S. economy recovered quickly and the ―dot-com‖ recession was
short-lived.31
32
56. The Fed‘s monetary policy and low interest rates had a significant impact on the housing
market. A 2008 paper by the Federal Reserve Bank of St. Louis finds that ―monetary policy has
significant effects on housing investment and house prices and that easy monetary policy
designed to stave off the perceived risks of deflation in 2002-2004 has contributed to a boom in
30 Rajan (2010). 31
According to the National Bureau of Economic Research, the 2001 recession lasted 8 months from March 2001 to
November 2001 (shorter than the average duration of a recession in the US in the post-war era). 32 The expansionary stance of monetary policy, however, does not explain why real interest rates stayed low after the expansionary monetary policy was scaled back after 2004. One of the factors explaining the persistence of low interest rates may also be the substantial asset reallocation from equities to fixed income instruments during and after the bursting of the tech bubble. This trend was further enhanced by the decision of monetary authorities to invest in US treasuries (e.g., the People’s Bank of China, Japan and other countries as shown also in Figure 25). Also, global asset scarcity caused by the Asian Financial Crisis of 1997-98 contributed to a fall in US interest rates. Also, there was a growing consensus that the developed economies had become less risky—as a result of the “Great Moderation”—which also contributed to low interest rates.
0%
5%
10%
15%
20%
25%
Jul-
54
Jul-
56
Jul-
58
Jul-
60
Jul-
62
Jul-
64
Jul-
66
Jul-
68
Jul-
70
Jul-
72
Jul-
74
Jul-
76
Jul-
78
Jul-
80
Jul-
82
Jul-
84
Jul-
86
Jul-
88
Jul-
90
Jul-
92
Jul-
94
Jul-
96
Jul-
98
Jul-
00
Jul-
02
Jul-
04
Jul-
06
Jul-
08
Jul-
10
Figure 35: Long-term Effective Federal Funds Rate
Source: Federal Reserve.
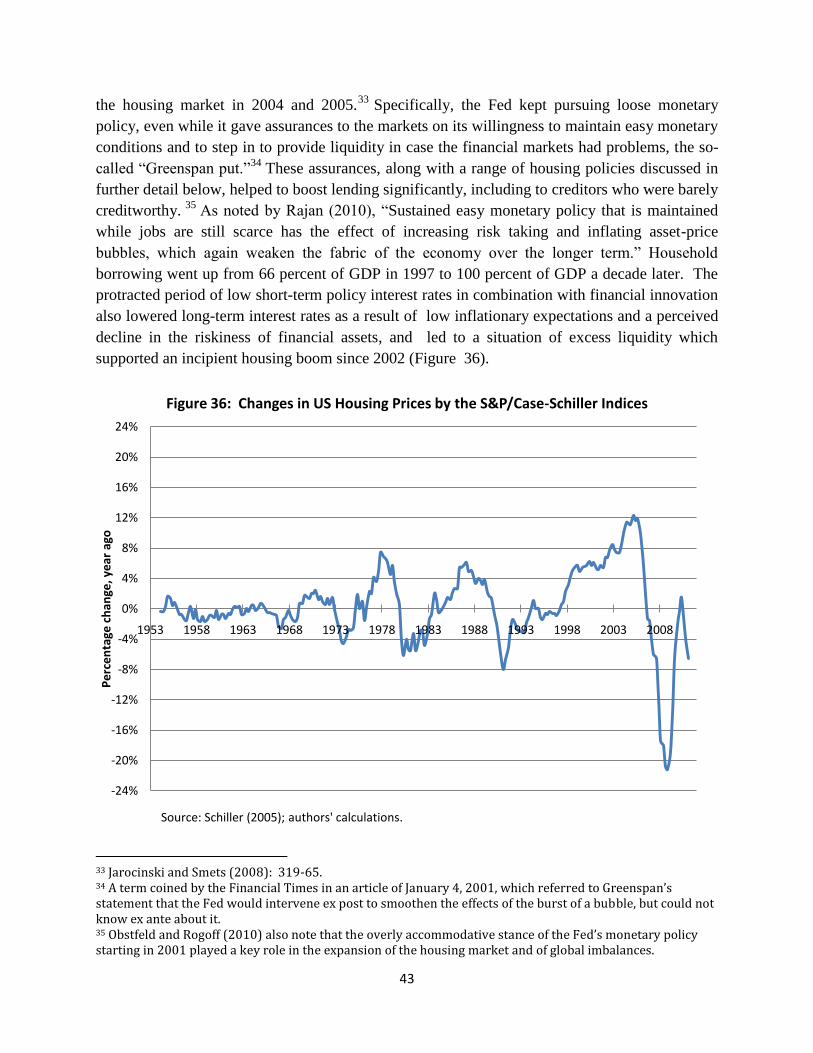
43
the housing market in 2004 and 2005.33
Specifically, the Fed kept pursuing loose monetary
policy, even while it gave assurances to the markets on its willingness to maintain easy monetary
conditions and to step in to provide liquidity in case the financial markets had problems, the so-
called ―Greenspan put.‖34
These assurances, along with a range of housing policies discussed in
further detail below, helped to boost lending significantly, including to creditors who were barely
creditworthy. 35
As noted by Rajan (2010), ―Sustained easy monetary policy that is maintained
while jobs are still scarce has the effect of increasing risk taking and inflating asset-price
bubbles, which again weaken the fabric of the economy over the longer term.‖ Household
borrowing went up from 66 percent of GDP in 1997 to 100 percent of GDP a decade later. The
protracted period of low short-term policy interest rates in combination with financial innovation
also lowered long-term interest rates as a result of low inflationary expectations and a perceived
decline in the riskiness of financial assets, and led to a situation of excess liquidity which
supported an incipient housing boom since 2002 (Figure 36).
33 Jarocinski and Smets (2008): 319-65. 34 A term coined by the Financial Times in an article of January 4, 2001, which referred to Greenspan’s statement that the Fed would intervene ex post to smoothen the effects of the burst of a bubble, but could not know ex ante about it. 35 Obstfeld and Rogoff (2010) also note that the overly accommodative stance of the Fed’s monetary policy starting in 2001 played a key role in the expansion of the housing market and of global imbalances.
-24%
-20%
-16%
-12%
-8%
-4%
0%
4%
8%
12%
16%
20%
24%
1953 1958 1963 1968 1973 1978 1983 1988 1993 1998 2003 2008
Pe
rce
nta
ge c
han
ge, y
ear
ago
Figure 36: Changes in US Housing Prices by the S&P/Case-Schiller Indices
Source: Schiller (2005); authors' calculations.

44
57. Real estate and equity investment increased rapidly, and the housing boom turned into a
bubble, with housing prices reaching well beyond what economic fundamentals would otherwise
indicate.36
The increased availability of mortgages led to a departure of the housing prices from
fundamentals. Between 1997 and 2006, the price of the typical American house increased by 124
percent. During the two decades ending in 2001, the national median home price ranged from 2.9
to 3.1 times median household income. This ratio rose to 4.0 in 2004, and 4.6 in 2006.37
Schiller
in his article on ―Irrational Exuberance‖ shows how far housing prices deviated from what would
have been suggested by economic fundamentals (Figure 37).
36
World Economic Outlook, October 2008 (Chapter 1), International Monetary Fund. According to the WEO: ―The
countries that have experienced the largest unexplained increases in house prices over the past decade are
Australia, Ireland, and the United Kingdom; house prices in these countries were 20 to 30 percent higher in 2007
than can be attributed to fundamentals. A group of other countries -including France, Italy, the Netherlands, and
Spain- have house price gaps of between 10 percent and 20 percent. The gap estimate for the United States –per
about 7 percent- is smaller than for most other countries and has been narrowing compared with earlier estimates,
partly reflecting the decline in U.S. house prices over the past 18 months.‖ 37 US Census Bureau.
0
100
200
300
400
500
600
700
800
900
1000
0
50
100
150
200
250
1880 1900 1920 1940 1960 1980 2000 2020
Po
pu
lati
on
, mill
ion
s
Ind
ex
or
Inte
rest
Rat
e
Figure 37: Home Prices and Economic Fundamentals
Home Prices
Building Costs
Population Real Interest
Source: Schiller (2005).

45
58. In general, housing and real estate property represent an important share of household
wealth in total household net worth.38
Wealth effects from the real estate market and the recovery
of the equity market made households feel richer, and hence, consume more. Financial
innovations allowed households to refinance their mortgages, and capitalize their wealth gains in
the housing markets.
59. Consumption, as well as household debt, increased rapidly during this period. Figure 38
shows that in 2001, U.S. household debt as a percentage of household disposable income was
100 percent. By 2007, it had increased to 132 percent. This 32 percentage point increase in
household debt was mainly used to support household consumption. The boom was not only
limited to the housing market. The U.S. stock market also increased by more than 50 percent
from June 2003 to October 2007.39
Figure 39 shows the evolution of households‘ net worth
relative to disposable personal income. Disposable personal income has been constantly
increasing over 1986-2009. However, net worth fell from 1999-2002 to rise again from 2002-
2006. Hence, during 2002-2006 households saw their wealth increase as a consequence of
soaring housing and equity markets.
38
Data from the Flow of Funds Accounts of the United States of the US Federal Reserve indicate that the share of
real estate in total net worth for households and non-profit organizations was less than 30% in 2000, peaked at 40%
in 2005 to drop to 37% and 34% in 2008 and 2009 (Q3), respectively. 39
World Bank staff estimates (2010).
80%
90%
100%
110%
120%
130%
19
90
19
91
19
92
19
93
19
94
19
95
19
96
19
97
19
98
19
99
20
00
20
01
20
02
20
03
20
04
20
05
20
06
20
07
20
08
Figure 38: Household Debt as a Percentage of Personal Disposable Income
Sources: Bureau of Economic Analysis Data (2009), Federal Reserve, Flow of Funds Account (2009).

46
60. Greenspan and Kennedy (2008) show that the increase in housing prices contributed
substantially to the consumption boom, primarily via home equity loans and mortgage
refinancing cash-outs. Empirical evidence for the link between housing wealth and consumption
is found by Bostic et al. (2006), which uses micro-data to estimate the elasticity of consumption
to both housing and financial wealth in the United States over the period 1989-2001. They find a
substantially larger marginal propensity to consume from housing wealth than from financial
wealth. In addition, Case et al. (2005), using panel data for 14 countries, report: ―The importance
of housing market wealth and financial wealth in affecting consumption is an empirical
matter….[] We find at best weak evidence of a stock market wealth effect. However, we do find
strong evidence that variations in housing market wealth have important effects upon
consumption. [The results…] support the conclusion that changes in housing prices should be
considered to have a larger and more important impact than changes in stock market prices in
influencing household consumption in the U.S. and in other developed countries.‖
61. Equity can be extracted from houses through three channels: (i) free cash available to
home sellers, which is equal to the value of existing home sale minus mortgage debt paid off at
the time of sale and closing costs; (ii) home equity loans40, which are equal to originations minus
repayments resulting from other forms of equity extraction, and (iii) cash-out refinancing, which
is refinance originations minus repayments of first liens resulting from refinancing. Greenspan
40 Home equity loans are a type of loan in which the borrower uses the equity in their home as collateral. A home equity loan creates a lien against the borrower's house, and reduces actual home equity.
0%
100%
200%
300%
400%
500%
600%
700%
0
10
20
30
40
50
60
70
US$
, th
ou
san
ds
Figure 39: U.S. Household Disposable Income and Net Worth
Disposable personal income
Net Worth of Households and Non-profit Organizations
Household net worth as percentage of disposable personal income
Source: Federal Reserve, Flow of Funds Account.
(right axis)

47
and Kennedy (2008) estimate that during the 1991-2006 period, free cash resulting from these
liquidity channels alone averaged about $590 billion annually. Equity extracted through sales of
existing homes accounted for about two-thirds of total free cash; home equity loans accounted
for close to 20 percent; and cash-out refinancing about 13 percent.
62. The nexus between the asset price boom, consumption and the current account balances
is studied empirically in a model by Laibson and Mollerstrom (2010). The authors find that asset
price movements explain a substantial share of the cross-sectional variation in international
financial flows (Figure 40). Using regressions with real housing price appreciation as the
independent variable and the accumulated balance of trade as the dependent variable, they find
for a sample of 18 OECD countries plus China that movements in residential home prices alone
explain around 50 percent of the variation in accumulated current account deficits. The authors
acknowledge that their regressions do not answer the question of causality; they point, however,
to some preliminary evidence showing that the causality runs from asset bubbles to current
account deficits, notably the fact that the consumption boom was largely financed by loans taken
out on real estate.
Figure 40: Housing Price Appreciation vs. Balance of Trade Accumulation, 1996 to peak of housing market
Source: Laibson and Mollerstrom (2010).
63. One additional factor contributed to the large U.S. current account deficits: the U.S.
public sector dis-saving. The wars in Afghanistan starting in 2001, and in Iraq, starting in 2003,
and the tax cuts enacted by the Bush administration in 2001 and 2003, compounded by the

48
effects of the recession on tax revenue, turned the U.S. government budget from a surplus of
almost 1 percent of GDP in 2000 to a deficit of 4.5 percent41
of GDP in 2008 (Figure 41). All
else equal, this increase in the budget deficit implies a fall in public sector savings and national
savings, and a corresponding swing of 5.5 percentage points of US GDP in the current account.
64. To summarize, loose monetary policy that was enacted to counteract the burst of the I.T.
bubble and the 9/11 attacks created conditions of excess liquidity in which the housing and
equity bubble could develop. This bubble increased households‘ wealth and consumption. As a
result, the U.S. economy boomed. However, U.S. domestic production was not able to meet the
increase in domestic consumption, which led to current account deficits with countries providing
consumer goods to the U.S., including oil-exporting countries and consumer goods-exporting
countries. As China had become the major producer of labor-intensive processed consumer
goods by 2000, the United States ran an increasingly large deficit with China, which in turn ran
trade deficits with many other East Asian economies that provided intermediate products to
China.
41
Office of Management and Budget (2010). The deficit is defined here without Social Security funds.
-6%
-5%
-4%
-3%
-2%
-1%
0%
1%
2%
0%
2%
4%
6%
8%
10%
12%
14%
16%
18%
20%
On
-bu
dge
t su
rplu
ses
(+)
or
de
fici
ts (
-) a
s a
% o
f G
DP
On
-bu
dge
t re
ceip
ts a
nd
ou
tlay
s as
a %
of
GD
P
Figure 41: US Budget Receipts, Outlays, and Surpluses or Deficits
Surplus or Deficit(−) Receipts Outlays
Source: Office of Management and Budget.

49
65. The above-mentioned loose monetary policy and low short- and long-term interest rates
not only helped bring about the housing bubble in the U.S., but also encouraged aggressive
search for higher yields on a global scale reflected in record high volumes of capital flows to
developing countries, which rose from $200 billion in 2000 to $1.2 trillion in 2007 (Figure 42).
Large capital flows to developing countries are also attributable to the deep structural reforms in
many developing countries that were undertaken during the 1990s and contributed to record-high
investment-led growth in many developing countries in the same period (Figure 43).42
The
accelerated growth in many countries resulted in a sharp increase in the demand for (and prices
of) natural resources, as well as trade surpluses in natural resource-exporting countries. This
prompted a boom in commodity prices, which in turn further accelerated growth in natural
resource-exporting developing countries (Figure 44). The investment-led growth in developing
countries resulted in large trade surpluses in many advanced capital-goods exporting countries,
such as Germany. Since the United States is the reserve currency issuing country, the foreign
reserves accumulated through trade and capital account surpluses in other countries will return
back to the U.S., in the form of purchasing Treasury bills or other investments, and this led to the
capital account surplus in the United States.43
42 The Global Economic Prospects of 2010 notes that the fall in borrowing costs during the 2003-07 period was associated with almost 70 percent of the increase in capital flows into developing countries and 80 percent of the increase in domestic consumption. Also, on average, between 2000 and 2007 investment-to-GDP ratios in developing countries increased by 5.2 percentage points compared with their 2000 levels. The GEP also indicates that more than half of the 1.4 percentage point increase in potential output growth rates in developing countries between 2003 and 2007 is directly attributable to the capital deepening during this period. 43 Most scholars emphasize the high demand for US treasuries from trade surplus countries allowed the U.S. government to borrow more cheaply than otherwise, a phenomenon often referred to as the “exorbitant privilege” (Eichengreen 2010). However, more important than this privilege, is that as long as the US dollar is an accepted reserve currency, the funds to support the trade deficits will recycle back to the US either by purchasing treasury bill or other forms of investments and become US’s capital account surplus to offset the current account deficits. This may appear that the investors have a preference for the US dollars (Bernanke 2005a, Bernanke et al. 2011). But in fact it is because the U.S. dollar is a reserve currency that the current account deficit financed by the reserve currency-issuing country must recycle back to that country.

50
Figure 42: Total Capital Inflows to Developing Economies
Source: World Bank, Global Economic Prospects.
Figure 43: Trend and Cyclical GDP Growth
Source: World Bank, Global Economic Prospects.

51
Figure 44: Selected Commodity Prices
Source: World Bank, Prospects Group.
1000
2000
3000
4000
2000M01 2005M01 2010M01
$/m
tAluminum
0
5000
10000
2000M01 2005M01 2010M01
$/m
t
Copper
0
100
200
2000M01 2005M01 2010M01
¢/m
t
Iron ore
50
150
250
350
2000M01 2005M01 2010M01
$/m
t
Barley
0
50
100
150
2000M01 2005M01 2010M01
$/b
bl
Crude Oil, West Texas Intermediate
0
100
200
300
400
2000M01 2005M01 2010M01
¢/kg
Lead
100
200
300
400
500
2000M01 2005M01 2010M01
$/m
t
Wheat, Hard Red Winter
0
500
1000
1500
2000M01 2005M01 2010M01
$/m
t
Diammonium Phosphate Fertilizer
200
550
900
1250
1600
2000M01 2005M01 2010M01
$/m
t
Soybean Oil
0
100
200
300
400
500
2000M01 2005M01 2010M01
¢/kg
Zinc

52
66. Aggregate demand pressures emanating from the accommodative monetary policy were
initially reflected in oil and other commodity prices, and finally led to an increase in headline
inflation. The consequent tightening of monetary policy resulted in a correction of housing
prices, triggered defaults on subprime loans, large losses for banks and financial institutions,
sharp increases in risk aversion and complete lack of confidence and trust among market
participants, and substantial deleveraging and large capital outflows from emerging markets.
The earlier financial excesses were thus reversed in a disruptive manner.
III.3 Financial Deregulation, the Housing Bubble, and the Global Financial Crisis
67. The expansionary monetary and fiscal policy of the United States was the key factor in
the emergence of the global imbalances. However, it was housing and financial sector policies
aimed at expanding the mortgage market to borrowers that had up to that point not been
considered creditworthy—the evolution of the so-called subprime mortgage market—and the
financial innovations to support the subprime mortgages that were the primary causes for the
burst of the bubble which had such a large unexpected systemic effect. Notably, the emergence
of new financial instruments and derivatives initially seemed to lower the risk profile, but
ultimately turned out to increase it substantially. As a result, when the housing bubble burst, the
new financial innovations also led to a systemic financial crisis in the U.S. and the world. In this
section, we will review the evolution of U.S. financial regulations and housing policies, as well
as how the financial innovations led to the unexpected systemic risk.
68. Starting in the 1970s, U.S. government policy had emphasized deregulation to encourage
business, which resulted in less oversight of activities and less disclosure of information about
new activities undertaken by banks and other evolving financial institutions. One of the first
steps in this direction was the creation of Money Market Mutual Funds (MMMFs). MMMFs had
been established in response to interest rate ceilings on demand deposits (Regulation Q) and did
not have restrictions on interest rates. A key regulation supporting the growth of the MMMFs
was the Garn-St. Germain Act of 1982, which authorized banks to issue short-term deposit
accounts with some transaction features, but no interest rate ceiling, thus effectively bypassing
Regulation Q. While the Garn-St. Germain Act was intended to benefit the thrift industry (the so-
called Savings and Loan associations largely aimed at financing real estate), it also allowed these
firms to embark on types of financial transactions with new and higher risks.
69. Savings and loan (S&L) associations specialized in taking deposits with short-term
maturity and making mortgage loans with long-term maturity. This asset-liability mismatch
made them especially vulnerable to the costs of high interest rates; so when the Federal Reserve

53
increased interest rates to combat inflation in the late 1970s, most thrift institutions reported
large losses. By 1982, the net worth of the entire industry approached zero. As a result, many
institutions failed, but no large-scale action was taken, partly because of lack of funds at the
Federal Savings and Loan Insurance Corporation, as well as inadequate banking supervision by
the Federal Home Loan Bank Board.44
70. Notwithstanding these signs of increasing financial distress, the S&L industry underwent
rapid expansion between the years 1982 and 1985. The reason was that investors saw substantial
potential for profits in the new investment powers granted to thrifts, and invested in
condominiums and other commercial real estate. Consequently, the investment portfolio of S&L
associations shifted away from traditional home mortgage loans into higher-risk loans. These
loans were funded by the rapidly growing supply of deposits that were attracted through above-
market interest rates.
71. However, by the mid-1980s the boom in real estate went bust, partly as a result of the
passage of the Tax Reform Act of 1986, which eliminated many of the tax shelters that had made
real estate an attractive investment in the first place. As a result, many deposits were withdrawn
and hundreds of institutions failed. The subsequent bailout of the savings and loan industry
proceeded for several years and cost about $210 billion.
72. The rise in increasingly risky financial transactions went hand in hand with growing
consolidation in the financial industry. Banks realized that their prospects of being bailed out by
the government, in case their increasingly risky businesses failed, rose dramatically the larger
they had become—meaning they became ―too big to fail‖. Consequently, since the early 1990s
they absorbed other banks as a way to become more immune against risks.45
Between1990 and
1998, the number of banking institutions decreased by 27 percent as banks continued to merge.
An important legislative step in support of greater banking consolidation was the Riegle-Neal
Interstate Banking and Branching Efficiency Act of 1994, which eliminated previous restrictions
on interstate banking and branching.46
73. An even more important legislative step encouraging the adoption of riskier financial
products in the financial industry was the repeal in 1999 of the Glass-Steagall Act and its
replacement by the Gramm-Bliley-Leach Act. This repeal essentially eliminated the separation
between commercial banks (which had traditionally conservative policies) and investment banks
44 Sherman (2009). 45 Mallaby (2010): p. 11. 46 One example of consolidation occurred in April 1998 when Travelers Insurance Group and Citicorp, the parent of Citibank, announced plans to merge and form Citigroup, Inc, taking in the combination of banking and securities dealing. Albeit not entirely compliant with the spirit of the Glass-Steagall act, bank executives structured the merger in a way that conformed to the Fed’s increasingly liberal interpretation of the act.

54
(which had more of a risk-taking culture).47
As a result of the adoption of the Gramm-Bliley-
Leach Act, large banks could be a commercial bank, an insurance company, an asset manager, a
hedge fund and a private equity fund at the same time. Consequently, banks with access to
deposit insurance and Central Bank support pursued high-risk activities, thus endangering the
soundness of the financial system as a whole.
74. Also, in 2004, the U.S. Securities and Exchange Commission relaxed the net capital rule
which enabled investment banks to substantially increase the level of debt they could assume,
fueling the growth in mortgage-backed securities supporting subprime mortgages. Mortgage-
backed securities became increasingly popular in the 1980s; but it was not until the 1990s that
they really took off. These securities include Collateralized Mortgage Obligations, Collateralized
Debt Obligations (CDO‘s) and Collateralized Loan Obligations (CLO‘s), as well as CDO‘s of
CDO‘s of CDO‘s (CDO3) which assembled a bunch of credit default swaps to mimic an
underlying CDO.48
These new instruments assembled a multiplicity of tranches, each of which
represented a certain level of risk tolerance. They and the risk they implied became difficult to
value; as a result, the financial system became prone to a high level of risk. The lack of
transparency associated with financial innovation through securitization allowed even quasi-
public institutions like Fannie Mae and Freddie Mac and prospective borrowers to avoid careful
scrutiny. In this context, it became increasingly common for borrowers to misrepresent their
income and to fail to provide written confirmation about their salary (the so-called NINJA
loans).
75. Unlike stocks, bonds and options, there was no clearinghouse for trades in most of the
new derivative instruments. Moreover, the Commodity Futures Modernization Act of 2000
ensured that derivatives remained unregulated. In such conditions, derivatives trading expanded
quickly, increasing from a total outstanding nominal value of $106 trillion in 2001 (1039 percent
of U.S. GDP, and 331 percent of world GDP), to a value of $531 trillion in 2008 (3688 percent
of U.S. GDP and 868 percent of world GDP). 49 However, the legal and technological
infrastructure of the industry was inadequate to handle such an explosion of the volume of
derivatives, which worsened the impact of the lack of regulation of derivatives.50
76. The development of mortgage-backed securities was largely driven by the shadow
banking system (Figure 45), which experienced dramatic growth in the run-up to the crisis. The
growth of the shadow banking system was partly the result of the perceived decline in the profit-
47 Roubini and Mihm (2010): p.74. 48 CDO’s essentially bundled high-risk subprime mortgages and then sliced them into tranches (equity, mezzanine and senior). Purchasers of the equity tranche had the highest return and highest risk, while purchasers of mezzanine and senior tranches had correspondingly less return and less risk. If any homeowner in the underlying pool defaulted, the holders of equity tranches would see the highest loss. 49 Bank of International Settlements, Semiannual OTC derivatives statistics at end-June 2011. 50 Goodman, Peter S.: “Taking hard new look at a Greenspan legacy,” New York Times, October 8, 2008.

55
making opportunities of traditional commercial banks that faced competition from nonbanks and
their products, such as junk bonds and commercial paper. As a result, commercial banks began
exiting the regulated sector.51
The shadow banking system included nonbank mortgage lenders,
structured investment vehicles (SIVs) and conduits, investment banks and broker dealers, money
market funds, hedge funds and private equity funds and state- and local government-sponsored
pools of auction-rate securities and tender option bonds. The common denominator of these new
institutions was that they acted as banks, but were not regulated as such, further encouraging
non-transparency in the financial system.52
77. This non-transparency was of even greater concern, as all institutions operating as part of
the shadow banking system had in common that they borrowed in short-term, liquid markets, but
invested in long-term illiquid assets. For example, structured investment vehicles were financed
through short-term commercial paper and money market funds relied on short-term funds from
investors. The vulnerabilities emanating from this severe maturity mismatch between assets and
liabilities were compounded by the fact that none of the institutions in the shadow banking
51 Gorton and Metrick (2010): “Regulating the Shadow Banking System.” Brookings Institution Press. 52 Roubini and Mihm (2010): p. 76-80.
Figure 45: Traditional and Shadow Banking Systems
Source: The Financial Crisis Inquiry Report (2011); Federal Reserve, Flow of Funds Report.Note: Shadow banking funding includes commercial paper and other short-term borrowing (bankers acceptances), repo, net securities loaned, liabilities of asset-backed securities issuers, and money market mutual fund assets.
US$
, tri
llio
ns

56
system had access to a lender of last resort, nor to a deposit insurance system. As a result, the
threat from bank runs for the viability of the institution significantly increased, a fact that
explains the collapse of the shadow banking system in the wake of the crisis.
78. The vulnerabilities of the shadow banking system were not appreciated by the rating
agencies—on account of three factors. First was the fact that a significant part of the transactions
had been moved off-balance sheet and therefore eluded the attention of the rating agencies.
Second, ratings agencies found it increasingly difficult to assess the risk involved with new
instruments, and resorted to mathematical models to value them that relied on optimistic
assumptions minimizing measured risk.53
Third, ratings were also skewed upward because rating
agencies depended on the financial institution for employment and future contracts. As a result,
excessive risk-taking was not recognized by rating agencies, effectively encouraging even riskier
behavior.
79. Excessive risk-taking was further encouraged by a variety of moral hazard problems. For
instance, a trader would be rewarded for placing a bet on a CDO, but would not be punished if
this bet failed. In addition, rather than simply paying employees a salary, the traders and bankers
who worked at the investment banks, hedge funds and other financial services firms were
rewarded for their performance via a system of annual bonuses that consistently increased on an
annual basis. These bonuses largely depended on whether the returns generated by the
investment exceeded those of a risk-appropriate benchmark (also referred to as ―alpha‖).
Investment banks found that such returns were more likely if the investment was associated with
tail risk that means with an event that was very unlikely to occur. However, it is in the nature of a
tail risk event that the likelihood of it occurring increases exponentially when more and more
individuals undertake actions that are based on the assumption that it will not occur.54
The Fed’s approach to bubbles—The Greenspan put
80. A further element in the fabric of creating a flawed governance framework was the
reluctance of the Fed to regulate markets. This tendency had already been apparent through the
prompt actions the Fed had undertaken to limit the market crash in 1987 as well as the effects of
the liquidity crunch in 1998, in both cases by cutting interest rates and pumping in liquidity.55
Monetary policy was considered not to be sufficiently effective to control bubbles at a time of
exuberant expectations. In a speech on risk and uncertainty in monetary policy, Greenspan
(2004) said in reference to the technology bubble: ―Instead of trying to contain a putative bubble
by drastic actions with largely unpredictable consequences, we chose, as we noted in our mid-
1999 congressional testimony, to focus on policies ‗to mitigate the fallout when it occurs, and
53 Roubini and Mihm (2010): p. 67. 54 Rajan (2010): p. 136. 55 Miller, Weller and Zhang (2002).

57
hopefully ease the transition to the next expansion.‘‖ This conclusion was based on the view that
the degree of uncertainty about the nature of the economic environment in which monetary
policy was operating had significantly risen owing to a number of structural economic changes,
in particular rising productivity. Consequently, Greenspan advocated an approach to monetary
policy that basically viewed the risks of intervention in potential bubbles to significantly
outweigh the benefits. This view was based on an extremely optimistic assessment of the
American economy and its long-term prospects driven by deep and positive structural change.
81. The Fed Chairman‘s statement that it was not possible to know a priori whether a bubble
existed and it was therefore only possible to intervene ex post created the so-called ―Greenspan
put‖, essentially a belief among traders that the government would always bail out traders that
needed to be rescued after a bubble had burst, but not intervene to stop it from rising.56
So,
effectively the Fed was providing insurance against the possibility of a market crash, a situation
referred to as ―meta moral hazard‖ by Miller, Weller and Zhang (2002).
82. Miller et al. cite evidence for such a meta moral hazard from: (i) a small survey of major
fund managers and chief economists in London and New York carried out in early 2000 and (ii)
a national opinion survey by the Securities Investor Protection Corporation (SIPC) of more than
2,000 individual investors. The former investigated the hypothesis that ―confidence in an ever-
increasing stock market is due to the belief that monetary policy will be used to support the
market and that corrections will elicit reductions in interest rates until the market turns around‖.
The result was that respondents believed that the Fed reacted more to a fall of the stock market
than to its rise, and all except two believed that this type of reaction was in part responsible for
the high valuations on the U.S. market.57
It was this rather asymmetric conduct of the monetary
authorities that reduced the risk premium and played a key role in lifting the whole market. It
was as if investors came to believe that diversified equity instruments were insured subject to a
deductible, i.e., with a market floor somewhat below current prices, but no ceiling.58
In the
particular case of the subprime market, the Fed refused to intervene in the market even after the
Fed had received relevant warnings.59
The subprime market was considered to be a good thing,
the natural consequence of letting markets go free.
83. The system resulting from these financial innovations was characterized by (i) lack of
transparency; (ii) underestimation of risk; and (iii) lack of understanding about how new
56 Financial Times, January 4, 2001. 57 Cecchetti et al. (2000): p. 75. 58 Miller, Weller and Zhang (2002) provide empirical evidence for a decline in the risk premium. Survey was conducted by the company Securities Investor Protection Corporation (SIPC). 59 “For example, Bronx-based Fair Finance Watch commented to the Federal Reserve about the practices of now-defunct non-bank subprime lender New Century, when U.S. Bancorp bought warrants for 24% of New Century's stock. The Fed, rather than take any action on New Century, merely waited until U.S. Bancorp sold off some of the warrants, and then said the issue was moot.” Quote from Inner City Press of September 28, 2008.

58
financial products might behave when subjected to significant stress. The conditions above
created a favorable environment for the housing and mortgage bubble to build. Essentially by
injecting vast amounts of easy money into the economy and keeping it there for too long, the Fed
muted the effect of the collapse of the technology bubble by inflating an entirely new one.
However, the critical condition for the global economic crisis to build as it did was the expansion
of the subprime mortgage market.
Subprime mortgage market
84. Policies aimed at making housing mortgages increasingly available for low-income
households had been pursued for a long time, but gained significant prominence in the early
1990s. Steps toward operationalizing new low-income mortgage policies included the passing of
the Federal Housing Safety and Soundness Act (1992), which aimed partly at reforming the
regulation of the agencies and partly at promoting home-ownership for low–income and minority
groups explicitly. In addition, the Department of Housing and Urban Development (HUD) was
asked to develop affordable housing goals for the agencies and monitor progress.60
As discussed
further below, lobbying by the financial sector seems to have played a major role in bringing
about legislative changes in support of lending to the subprime market.61 Igan and Mishra (2011)
explore the link between the political influence of the financial industry and financial regulation
in the run-up to the global economic crisis and find strong evidence that spending on lobbying by
the financial industry and network connections between lobbyists and the legislators were
positively linked to the probability of a legislator changing positions in favor of deregulation.
85. A key tool within the government‘s policy framework to promote lending to the subprime
borrowers was Freddie Mac and Fannie Mae. Freddie and Fannie guaranteed an increasingly
large share of mortgage-backed securities, and enjoyed an implicit guarantee by the U.S.
Treasury. As a result, foreign investors treated these securities as almost equivalent to buying
U.S. Treasury bills. From the start, both Freddie and Fannie were subject to loose supervision.
The regulator was subject to congressional appropriation which ensured that any effort by the
60 Already in the mid-1990s HUD had loosened mortgage restrictions, so first-time buyers could qualify for loans that they were not able to get before. In 1995, Freddie Mac and Fannie Mae began receiving affordable housing credit for purchasing mortgage-backed securities, which included loans to low-income borrowers. As a result, the agencies began purchasing subprime securities. In 1996, HUD directed Freddie and Fannie to provide at least 42 percent of their mortgage financing to borrowers with income below the median in their area. The target was further increased to 50 percent in 2000 and 52 percent in 2005. In addition, HUD required Freddie and Fannie to provide 12 percent of their portfolio to “special affordable” loans (loans to borrowers with less than 60 percent of their area’s median income. These targets increased over the years, with a 2008 target of 28 percent. In 2004, HUD increased the affordable housing goal from 50 to 56 percent. 61 Rajan (2010) argues that the expansion of lending to the subprime mortgage market was the result of rapidly growing income inequality. However, there is little empirical evidence in support of a causal link between the rising income inequality and the expansion of subprime lending and in the United States.

59
regulator to enforce quality standards could result in budget cuts for the regulator. The
combination of an activist Congress, government-supported private firms and a weak regulator
allowed for the subprime market to boom.
86. Importantly, as housing boomed, the agencies found the high rates available on low-
income lending particularly attractive, and the benign environment and lack of historical
experience with low-income lending allowed them to ignore the additional risk. Under the
Clinton administration, HUD steadily increased the amount of funding it required the agencies to
allocate to low-income housing. Moreover, enforcement of the Community Reinvestment Act
(CRA), which had already been enacted in 1977, was sharply enhanced under the Clinton
administration,62
leading to further increases in mortgages to low-income segments of the
population, especially in the highly visible and politically sensitive metropolitan areas where
banks were most likely to be scrutinized.
87. The boom in the subprime market was further significantly ratcheted up under the Bush
administration. The Bush administration pushed up the low-income lending mandate on Freddie
and Fannie to 56 percent of their assets in 2004, even as the Fed started increasing interest rates
and expressing worries about the housing boom.63
One factor explaining the huge increase in
lending in subprime mortgages was the concern by Freddie and Fannie about the impact of
accounting scandals that had been exposed in 2004 and made them more pliant to Congress‘s
demands for more low-income lending.64
88. But lending from government-sponsored agencies does not explain the boom in the
subprime mortgage market that led to the real estate bubble whose burst was at the core of the
global financial crisis. As more money from government–sponsored agencies flooded into
financing or supporting low-income housing, real estate prices began to generate ever higher
returns, while the new financial derivatives developed in the shadow banking system created the
impression that risks associated with mortgage lending had fallen. Perceptions of lower risk and
higher returns in a booming real estate market—to a significant extent encouraged by the new
financial derivatives—encouraged further expansion of lending by the private sector to low-
income segments. In fact, while Freddie and Fannie played an important role in setting the stage
for an expansion of the mortgage market to low-income households, by 2006, the vast majority
of subprime mortgages (84 percent) came from private lending institutions and the share of
subprime loans insured by Fannie and Freddie decreased as the bubble grew (from a high of
62 Bhutta (2008). 63 Federal Register Vol. 69 (211). HUD’s Housing Goals for Fannie Mae and Freddie Mac. Also, see HUD news release No. 04-133: “HUD finalizes rule on new housing goals for Fannie Mae and Freddie Mac”. The new policy foresaw a target of lending to low- and moderate–income households of 56 percent by the year 2008. 64 “The Financial Crisis Inquiry Report,” Final Report of the National Commission on the Causes of the Financial and Economic Crisis in the United States. January 2011.

60
insuring 44 percent in 2003 to insuring 22 percent of all subprime loans in 2005).65
Mian and
Sufi (2009) show that the number of mortgages obtained in a zip code was negatively correlated
with household income growth. At its prime in 2006, 25 million out of 55 million mortgages
were subprime mortgages.66
This vastly expanding role of the private sector in providing
subprime mortgages was motivated by its high profitability and the expectation of an implicit
government bailout.67
89. In addition, it was encouraged by a range of new government policies favoring lending to
subprime borrowers. These policies had been catalyzed by lobbying of the financial sector which
realized that policies aimed at expanding the mortgage market to low-income households would
appeal to politicians representing low-income constituencies. An empirical study of the political
economy of the subprime mortgage credit expansion carried out by Mian, Sufi and Trebbi (2011)
finds that special interests, as measured by campaign contributions from the mortgage industry
and constituent interests, and measured by the share of subprime borrowers in a congressional
district, influenced U.S. government policy toward the housing sector during the subprime
mortgage credit expansion from 2002 to 2007.68
Specifically, from 2002, mortgage industry
campaign contributions increasingly targeted U.S. Representatives from districts with a large
fraction of subprime borrowers. The researchers find evidence that both subprime mortgage
lenders and subprime mortgage borrowers influenced government policy toward housing finance
during the subprime mortgage credit expansion. While the empirical evidence shows an
influence of both factors, it does not determine their relative weight, i.e., whether the strong
influence of constituents from low-income households or the campaign contributions by
lobbyists were the key factors explaining the voting behavior of congressmen. However, given
that the composition of congressmen‘s constituencies has been unchanged for a long time, while
the support through lobbyists for key legislative changes peaked around 2003-2006, one may
conclude that influence by lobbies representing the financial sector was the most important factor
explaining the expanding government support for the subprime market in the run-up to the
crisis.69
90. The subprime mortgage market was also fuelled by both public and private sector
investments from Germany, Japan, China and a range of emerging economies that had large
65 New York Times: October 4, 2008: “Pressured to take risk, Fannie reached tipping point.” 66 Mian and Sufi (2010). 67 This is the so-called “Greenspan Put”. See also paragraph 80. 68 Key legislation adopted by congress includes the American Dream Downpayment Act of 2003, which aimed to increase homeownership among low-income communities by providing down payment and closing cost assistance. In addition, a number of laws that would have prevented predatory lending and weakened protection by the government in the case of default were discussed, but never put up for votes, including the Responsible Lending Act of 2005, the Prohibit Predatory Lending Act of 2005 and the Federal Housing Finance Reform Act (2005). 69 Rajan (2010) argued that it was the increasing income disparity since the 1990s that led politicians to expand the mortgage market to low-income households so as to obtain the low-income constituencies’ support. The empirical evidence here does not support his argument.

61
surplus savings as a result of the United States‘ current account deficits, as argued previously.
Given that government debt had very low returns, the investment was mostly directed to the
subprime market. Between 40 to 50 percent of the securities generated by American financial
institutions were bought by foreigners. 70
Investors‘ confidence was boosted by the high ratings
assigned by rating agencies to instruments such as mortgage-backed securities and collateralized
debt obligations which securitized subprime mortgages and derived their value from mortgage
payments and housing prices.
91. The U.S. financial system, especially the shadow banking system, was also a key element
in the transmission of the crisis to Ireland and Iceland. Prior to the crisis, both Iceland and
Ireland had relied on the U.S. financial system for funds, usually in the form of short-term debt,
foreign-owned bank deposits, or foreign-owned portfolio equity. Fuelled by a rapid expansion of
credit, the housing markets of both countries began expanding in 2000, resulting in a boom in
property investment and construction. The wealth effect from this boom spurred higher levels of
consumption and helped sustain high growth rates. Boosted by the real estate boom, Ireland's
banking system ballooned to five times the size of the economy, and its external debt to over
1000 percent of GDP at the end of 2010.71
92. When in the wake of the crisis funds from the U.S. dried up, the banking system
experienced a liquidity crunch, thus slowing credit to the real estate market. As borrowing
became more expensive, the demand for housing started to decline, resulting in a fall in prices
and an oversupply of housing. This put pressure on the balance sheets of banks, many of which
had relied extensively on profitable mortgage loans to boost their earnings. The bailout or
purchase of failing banks led to a crisis of confidence, leading to outflows of foreign assets in
some economies. Figure 46 shows how many nations, in particular Ireland and Iceland,
experienced major withdrawals of foreign-owned funds. The crisis exposed Ireland's
vulnerabilities to financial contagion. The collapse of Iceland preceded that of Ireland by a few
months, mostly because Ireland used the opportunity to refinance through the European Central
Bank.72
70 Reinhart and Rogoff (2009): pp. 242-45. 71 IMF 2011 Article IV consultation with Ireland. 72 Lane (2011).

62
93. To summarize, U.S. housing, monetary and fiscal policies were at the core of the U.S.
low savings rates and the asset bubble in the real estate market. This asset bubble fuelled an
extended consumption boom and rising current account deficits, which could be financed as a
result of the reserve currency status of the U.S. dollar and were the key driver for global
imbalances. Housing policies were influenced by the financial sector, which realized that the
subprime market offered extensive opportunities for higher profits. The financial deregulation
and low interest rates brought about by the Federal Reserve‘s monetary policy fostered
expansion and innovation of the financial sector. Increasingly complex financial derivatives
allowed the risks associated with the new instruments to be underestimated. When the housing
bubble burst, this had significant implications for the U.S. financial system as a whole.
94. The so-called global savings glut brought about by economic policies of China and other
East Asian countries was not the cause of low interest rates and the financial innovation boom. In
fact, it was the excess liquidity created by countries with a reserve currency, in particular the
United States through its expansionary monetary and fiscal policies, as well as housing policies
that led to the U.S. current account deficits and to global imbalances. With the U.S. dollar being
the main reserve currency, the reserves held by the central banks of surplus countries will
primarily be invested in U.S. dollar assets. But what has been the role of China‘s policies and its
savings rates in the evolution of the global economic crisis?
0%
20%
40%
60%
80%
100%
120%
140%
160%
180%
200%
1996 1998 2000 2002 2004 2006 2008 2010
Pe
rce
nta
ge o
f G
DP
Figure 46: Foreign-owned Bank Sector Liabilities
Ireland
Iceland
Greece
Portugal
Sources: Bank for International Settlements; International Monetary Fund, World Economic Outlook.

63
IV. Why Did China’s Surplus Increase So Much?73
95. The large increase in China‘s current account surplus in general and with the U.S. in
particular has attracted much attention. In this section, we will argue that these were caused by
both the high corporate saving rate in China as a result of its dual track approach to reform and
the relocation of the labor-intensive tradable sector of East Asian economies to China, which
started in the 1980s but accelerated after China‘s accession to WTO in 2001.
96. First, China‘s large current account surplus reflects its high savings relative to its
investment rates. Chinese savings and investment rates have been extremely high in recent years.
With its current account surplus in excess of 0.5 percent of global GDP since 2005, China has
accumulated foreign reserves in excess of the total reserves held by all other industrial countries
combined.
97. Breaking down savings into household and corporate savings shows that, while
household savings are at a high level, they broadly correspond to those of other Asian countries,
such as India. The distinctive feature explaining very high savings in China are corporate
savings. China‘s corporate savings rate is significantly above that of other Asian countries and
other emerging markets. At about 20 percent of GDP—double the share of corporate savings in
the U.S. and France—retained earnings finance more than one-half of enterprise investment.
What explains the high savings rates in China‘s corporate sector?74
98. One of the main factors behind the high savings rates of China‘s corporate sector is the
fact that China did not carry out all the necessary reforms at the same time. And those sectors
that have not been reformed still have distortions which turned into unfavorable income
distribution and concentration of wealth in the large state and private-owned enterprises. It is this
income distribution and large concentration of wealth in the corporate sector that is an important
factor behind the high savings rate in China (Lin 2011).
99. Since the 1990s, income disparity in China has become larger and larger. Figure 47
shows the evolution of income inequality in rural and urban areas and nationally for China
during 1980-2000.75
While China has attained significant progress against poverty (the
proportion of the population living in poverty fell from 53 percent to 8 percent during 1981-
200176
), income inequality has increased over the years—although not continuously—in rural
and urban areas as well as in China as a whole. In general, the marginal propensity to consume of
low-income people is higher; whereas the marginal propensity to consume of high-income
people is lower. Therefore, if wealth is concentrated among high-income people, they will not 73 Lin, Dinh and Im (2009):. 74 Serven (2011). 75
Ravallion and Chen (2007). 76
Ravallion and Chen (2007).

64
consume as much, saving more and turning savings into investment. On the other hand, low-
income people have a high marginal propensity to consume, but do not have enough funds. This
represents an important reason for high household savings.
100. What is the origin of the increase in income disparity and concentration of wealth in the
large corporate sector in China? Income disparity and high corporate savings in China can be
explained by three components of its current economic structure: the financial sector, the
resource sector, and monopolies in the telecommunications and financial sectors. Figure 48
shows the evolution of saving in China from 1995 to 2006. Total savings as a share of GDP were
below 40 percent until 2003. Household savings were high, but still were not very different from
other countries such as India. But since 2004, savings increased significantly. This discrete jump
was mainly driven by the hike in corporate savings.77
Four reasons explain this development.
77
See also Prasad (2011).
0%
5%
10%
15%
20%
25%
30%
35%
40%
45%
1980 1982 1984 1986 1988 1990 1992 1994 1996 1998 2000
GIN
I In
de
x
Figure 47: Income Inequality in China
Rural Urban National
Source: Ravallion and Chen (2007).

65
101. First, large state-owned enterprises have kept their profits as corporate savings.78
In 1994,
during the reform of taxation, a decision was taken that the government would not collect profit
from SOEs for an unspecified period of time. In this context, a number of factors may have
played a role. For one, this decision seemed a natural extension of the logic prevailing in SOE
reform in the 1980s, which emphasized the independence of SOEs from the government. Second,
the central theme of SOE reform during 1992-1994 was to increase managerial autonomy and
reduce government intervention, as was evident in the State Council decision on ―Regulation on
Transformation of Management Mechanisms of SOEs‖ in 1992. Collecting dividends from SOEs
would appear naturally as moving in the opposite direction. Third, without corporatization and
some minimum progress in corporate governance, it would be practically difficult for the
government to determine an acceptable rate of dividend without reopening the negotiation with
the management of each SOE on profit division. Fourth, SOEs as a whole were in a poor
financial situation in early 1990s. What the government could collect was not much, while the
need for new capital injection was perceived as urgent and large. In 1994, the total profit of
industrial SOEs was only 1.8 percent of GDP, which compared with 3.3 percent of GDP in 2003.
102. Second, China‘s financial structure is dominated by four big state-owned banks (Figure
49). Those big banks and China‘s equity market only provide access to financial services to large
enterprises, either owned by the state or by wealthy individuals. Small and medium enterprises,
which are very labor intensive, do not have access to any financial services.79
This situation
generates two implications for income distribution. On the one hand, China has an abundant
78 Kuijs, Mako and Zhang (2005).. 79 Lardy (2007).
0%
10%
20%
30%
40%
50%
60%
1995 1996 1997 1998 1999 2000 2001 2002 2003 2004 2005 2006
Figure 48: Chinese Corporate, Government, and Household Savings to GDP
Government savings Household savings Corporate savings
Source: Flow of Funds Account Tables, China Statistical Yearbook, various issues; NationalBureau of Statistics of China.

66
labor force, but the development of labor-intensive small and medium-sized enterprises is
repressed because they do not have access to financial services. As their growth is repressed,
fewer job opportunities will be available, dampening wages in China. For poor people, the only
source of income, other than transfers, is their own labor. The financial structure artificially
reduces these job opportunities as well as wages, lowering the income of low-income people.
Table 1: Chinese Interest Rates on Debt
2001 2002 2003 2004 2005
State Owned Enterprises 2.46 2.23 2.67 2.86 2.61
Private Enterprises 4.84 4.64 4.61 3.81 4.57
Difference -2.38 -2.41 -1.94 -0.95 -1.96
Source: Ferri and Liu (2009).
103. The World Bank Enterprise Survey conducted in 2004 provides further evidence for the
concentration of lending. While among large firms, 65 percent had a loan from a bank or
financial institution, only 32 percent of medium-sized firms and 20 percent of small firms had a
loan. Reflecting this lack of bank finance, many of the non-state sectors face a high degree of
credit constraints and have to resort to the informal lending market. Also, survey data from the
IFC for China (Investment Climate Surveys Draft Country Profile-2003) show that SMEs are
less reliant on banks for financing and more reliant on informal sources.
104. The highly concentrated financial structure also artificially lowers the cost of credit and
capital, acting as a subsidy to those enterprises with access to financial services (Table 1). The
subsidy is mainly financed by people who hold deposits in financial institutions but cannot
0
2
4
6
8
10
12
14
16
2003 2004 2005 2006 2007 2008 2009 2010
Cu
rre
nt
RM
B, b
illio
ns
Figure 49: Total Financial Assets of China
Total China less Big 4 Big 4
Source: Bankscope.

67
borrow from them, the relatively poor. Therefore, the financial structure is in effect asking the
poor people to subsidize the investment of rich people or large corporations. This exacerbates the
skewed income disparity and concentration of income in large corporations in China.
105. Third, the low royalty levy on natural resources boosts corporate savings. In particular,
due to the scarcity of natural resources in China, their prices are relatively high. However, the
Chinese government imposes little royalty levy on these resources. Domestic and foreign
petroleum companies are exempt from royalty taxes on crude oil for levels of production less
than 1 million tons. For crude oil production above this threshold, taxes range from 4 percent to
12.5 percent depending on the level of production. Royalty rates for natural gas are much lower:
Companies are exempt from taxes for natural gas production less than 2 billion cubic meters, and
pay taxes at rates of 1 to 3 percent for larger volumes.80
To put this into perspective, the United
States requires payment of royalties at a rate of 12.5 percent for onshore crude oil and natural gas
production, and 16.7 percent for offshore production, regardless of the amount of the resource
being extracted.81
It is clear that state-owned and private mining companies in China benefit
greatly from the low royalty payments. Thus, this also leads to a transfer of wealth to a small
group of people.
106. Fourth, monopoly power in financial institutions and in the telecommunications industry
makes these industries extremely profitable, with only a limited number of people having access
to these monopoly rents. For example, the top five banks in China have experienced a 536
percent increase in profits in the past 7 years, recording RMB 545 billion in profits in 2010.
Notably, the Agricultural Bank of China enjoyed an impressive 4,838 percent increase in profits
during this period (Figure 50). In the telecommunications sector, China Mobile has had a 24-
fold increase in profits during the past decade (Figure 51), and maintains a market share of 69.3
percent.82
Since the ‗抓大放小‘- reforms83
SOE‘s have not been required to pay out dividends to
their shareholders. With industrial profits increasing to trillions of RMB (Figure 52), corporate
savings have increased as well. These are the four most important sources explaining the high
rate of savings in China.
80 These rates are stipulated in the “Provisional Regulations on the Payment by Sino-Foreign Cooperative Joint Ventures of Royalties for the Exploitation of Onshore Oil Resources,” updated last in 1995. 81 American Petroleum Institute, “The Facts about the U.S. Royalty Collection System.” June 6, 2011. 82 China Mobile Limited Annual Report 2010, pg 3. 83 A broad term meaning “grasping the big, letting go of the small” which refers to the reforms described above.

68
0
100
200
300
400
500
600
2003 2004 2005 2006 2007 2008 2009 2010
RM
B, b
illio
ns
Figure 50: Profits for the 5 Largest State-owned Chinese Banks
Industrial & Commercial Bank of China China Construction Bank
Bank of China Agricultural Bank of ChinaBank of Communcation
Source: Bankscope.
0
20
40
60
80
100
120
140
1999 2000 2001 2002 2003 2004 2005 2006 2007 2008 2009 2010
RM
B, b
illio
ns
Figure 51: Profits for China Mobile
Source: China Mobile, Annual Investor Reports.

69
107. This analysis suggests that without addressing the root causes of income disparity and
corporate savings in China, consumption will be hard to increase, and excess savings and the
large current account surplus would be hard to eliminate. In order to tackle its current account
surplus, China needs to undertake a range of macroeconomic and microeconomic policy
reforms.84
108. Corporate governance should be strengthened and dividend policies reviewed with a
view to lowering retained earnings by enterprises. Requiring state-owned enterprises to issue
dividends would reduce their retained earnings and possibly also increase households‘
consumption.
109. Financial sector reform: With a view to improving access by SMEs to credit, more
competition needs to be introduced in the banking system, possibly by strengthening banking
supervision, imposing a minimum share of large banks‘ loans granted to SMEs, and liberalizing
the entry of small local banks. At this point, large corporations have access to loans at subsidized
rates, but do not pay dividends.
110. Royalty rates for coal companies and gas and other minerals: Earnings are extremely
high, but royalty levels are low. Therefore, royalties on state-owned and private enterprises
should be increased.
84 Kuijs (2006).
0
500
1000
1500
2000
2500
3000
RM
B, b
illio
ns
Figure 52: Chinese Real Industrial Sector Profits
Sources: CEIC; Organization for Economic Co-operation and Development national accounts data; UBS; and World Bank national accounts data.Note: Industrial sector coverage is of enterprises with annual revenue above 5 million RMB.

70
111. The current account balance of a country reflects its savings-investment balance. The
above analysis explains China‘s large current account surplus. The reasons for the large and
growing trade imbalance between the U.S. and China were, however, mainly the relocation of
many of the low value-added labor-intensive products from other East Asian economies to
China. The U.S. has long had a trade deficit with East Asia because of imports of labor-intensive
products. This relocation concentrates the trade surplus of East Asia with the U.S. on China,
which can be observed in the changing patterns of the United States‘ trade deficits with Japan
and China from 1985 to 2009 (Figure 53).
112. This relocation as well as the regional integration through production networks also
caused China‘s trade deficit with other East Asian economies. Figure 54 illustrates the rising
importance of China in U.S. imports from East Asia. Related to this, Figure 29 above shows how
China‘s trade balance with other East Asian economies deteriorated, as China increasingly
imported raw materials and semi-finished products from these countries. Many subcomponents
of these commodities are produced in advanced countries and assembled in China, as a result of
relocation of labor-intensive production to China. Figure 55 shows the decomposition of the
production of an iPhone assembled in China, which illustrates the small share of value added in
China versus inputs from other countries, notably Japan, Korea, Germany and the United States.
0%
5%
10%
15%
20%
25%
30%
35%
40%
45%
50%
19
89
19
90
19
91
19
92
19
93
19
94
19
95
19
96
19
97
19
98
19
99
20
00
20
01
20
02
20
03
20
04
20
05
20
06
20
07
20
08
20
09
20
10
Figure 53: Share of US-Japan and US-China Trade Deficits in Total US trade Deficit
China
Japan
Source: United Nations Comtrade, World Integrated Trade Solution database; authors' calculations.

71
0%10%20%30%40%50%60%70%80%90%
100%
1996 1997 1998 1999 2000 2001 2002 2003 2004 2005 2006 2007 2008 2009 2010
Figure 54: East Asian Exports for Simple Manufactured* Products to US
Taiwan
Singapore
Korea
Japan
Hong Kong
China
Source: U.S. Department of Commerce and U.S. International Trade Commission.*Simple manufactured products correspond to SITC Revision 4 codes 6 and 81–85, covering paper, textiles, rubber, metal, and clothing products.
Japan
Korea
Germany
USA China
Figure 55: The Production Value Chain of an iPhone
Components:$10.75
$60.60
$22.96
$30.15
$48.04
Assembly:$6.50
iPhone: $179.00
Retail Price:$500.00
(Profit Margin: 64%)
Source: Rassweiler (2009).
Rest of World

72
V. Concluding Remarks
113. The global financial crisis caused the greatest crisis in the global economy since the Great
Depression. Through the coordinated efforts of the G20 countries, the world economy has
avoided the worst possible scenario. However, the world economy remains fragile as a result of
high unemployment and large excess capacity in the advanced economies, high levels of
sovereign debt and the crisis in the Euro-zone. What are some of the key findings and lessons to
be learned from the global financial crisis?
114. First, this paper concludes that the global imbalance and the real estate asset bubble in the
United States were largely brought about by U.S. domestic policy. The loose monetary policy
that started in 2001 after the ―dot-com‖ bubble burst, magnified by the financial deregulation and
the subsequent various financial innovations, resulted in an exuberant boom in the U.S. housing
market. The wealth effect from the housing boom and the financial innovation that allowed
households to capitalize their gains in housing prices led to U.S. households‘ overconsumption
and over indebtedness. The U.S.‘s large current account deficit, made possible by its reserve
currency status, was a result of both the households‘ over-consumption and the public debts due
to the Afghanistan and Iraq wars.
115. Second, the analysis shows that whether a policy is successful should not be judged only
by its immediate effects but also its longer-term and overall effects. The use of monetary policy
to cope with the recession brought out by the burst of the ―dot-com‖ bubble in 2001 could have
been justifiable. However, with hindsight the policy was overused and extended for too long.
Moreover, when the symptom of a problem appears, it is important to have a good analysis of the
real cause of the problem. If in 2003 when the global imbalance, or specifically the U.S. trade
deficit, first became an issue the attention was to understand the reasons for the U.S.‘s over-
demand instead of pointing the finger to other countries for the U.S.‘s trouble, the exuberant
boom in the U.S. housing market could have been restrained and the financial regulation in the
U.S. could have been tightened much earlier. The global crisis could have been avoided or at
least its adverse effect could have been reduced.
116. Third, any new policy initiative needs to be evaluated from both its positive effects and
potential risk and negative effects. The crisis highlights the risks emanating from uncontrolled
financial deregulation. The subprime mortgage crisis, as well as the collapse of the shadow
banking system, illustrates the risks of lack of supervision of new financial instruments.
Developing countries need to be vigilant in adopting appropriate levels of banking supervision
that will prevent a recurrence of such a crisis. Most fundamentally, financial instruments and
their interaction with one another need to be fully understood before they should be adopted.

73
Bibliography
Aizenman, Joshua. 2008. ―Large Hoarding of International Reserves and the Emerging Global
Economic Architecture.‖ The Manchester School 5:487-503.
Aizenman, Joshua, and Jaewoo Lee. 2008. ―Financial versus Monetary Mercantilism: Long-run
View of Large International Reserves Hoarding.‖ The World Economy 593-611.
American Dream Downpayment Assistance Act of 2003. S. 811, 108th Congress, 1st Session.
American Petroleum Institute. 2011. ―The facts about the U.S. royalty collection system.‖ June
6. Washington DC:American Petroleum Institute.
Banking Act of 1933. H.R. 5661, 73rd Congress, 1st Session.
Bank of International Settlements. 2011. BIS Quarterly Review. September. Basel: Bank of
International Settlements.
Ben-Bassat, Avraham and Daniel Gottlieb. 1992. ―Optimal International Reserves and Sovereign
Risk.‖ Journal of International Economics 33:345-62.
Bergsten, C. Fred. 2007. ―The Dollar and the Renminbi.‖ Statement before the Hearing on U.S.
Economic Relations with China: Strategies and Options on Exchange Rates and Market Access,
Subcommittee on Security and International Trade and Finance, Committee on Banking,
Housing and Urban Affairs, United States Senate, Washington DC, May 23.
Bernanke, Ben. 2005a. ―Global Imbalances: Recent Developments and Prospects.‖ Speech at the
Bundesbank Lecture, Berlin, Germany, September 11.
Bernanke, Ben. 2005b. ―The Global Savings Glut and the U.S. Current Account Deficit.‖ Speech
at the Homer Jones Lecture, St. Louis, Missouri, April 14.
Bernanke, Ben, Carol Bertaut, Laurie Ponder DeMarco and Steven Kamin. 2011. ―International
Capital Flows and the Returns to Safe Assets in the United States, 2003-2007‖. International
Finance Discussion Papers 1014. February. Washington DC: Board of Governors of the Federal
Reserve System.
Bhutta, Neil. 2008. ―Giving Credit Where Credit is Due? The Community Reinvestment Act and
Mortgage Lending in Lower-Income Neighborhoods,‖ Federal Reserve Working Paper 2008-61.
Washington, DC: Board of Governors of the Federal Reserve System.
Borio, Claudio, and Piti Disyatat. 2011. ―Global Imbalances and the Financial Crisis: Link or no
Link?‖ BIS Working Papers 346. May. Basel: Bank for International Settlements.
Bostic, R., Gabriel, S., and Painter, G. 2006. ―Housing Wealth, Financial Wealth, and
Consumption: New Evidence from Micro Data,‖ Lusk Center for Real Estate, Marshall School

74
of Business and School of Policy, Planning and Development, University of Southern California,
draft, April.
Bullard, James. 2010. ―Three Lessons for Monetary Policy from the Panic of 2008.‖ Federal
Reserve Bank of St. Louis Review 92(3):155–63.
Caballero, Ricardo J., Emmanuel Farhi, and Pierre-Olivier Gourinchas. 2008. ―Financial Crash,
Commodity Prices, and Global Imbalances.‖ Brookings Papers on Economic Activity (2):1-55.
Case, K.E., Quigley, J.M. and Shiller, R. J. (2005), ‗Comparing Wealth Effects: The Stock
Market versus the Housing Market‘, Advances in Macroeconomics, 5(1), Article 1.
Cecchetti, S.G., H. Genberg, J. Lipsky and S. Wadhwani. 2000. ―Asset Prices and Central Bank
Policy,‖ Geneva Reports on the World Economy 2. Geneva: International Center for Monetary
and Banking Studies, London: Centre for Economic Policy Research.
China Mobile Limited. 2011. ―Annual Report 2010.‖ Hong Kong: China Mobile Limited.
Commodity Futures Modernization Act of 2000. H.R. 5660, 106th Congress, 2nd Session.
Community Reinvestment Act of 1977. H.R. 6655, 95th Congress, 1st Session.
Duhigg, Charles. 2008. ―Pressured to Take More Risk, Fannie Reached Tipping Point.‖ New
York Times. October 4.
Eichengreen, Barry. 2011. Exorbitant Privilege: The Rise and Fall of the Dollar and the Future
of the International Monetary System. New York: Oxford University Press.
Eichengreen, Barry, and Kevin H. O‘Rourke. 2010. ―A Tale of Two Depressions: What Do the
New Data Tell Us?‖ VoxEU.org, March 8.
http://www.voxeu.org/index.php?q=node/3421#jun09
Federal Housing Enterprises Financial Safety and Soundness Act of 1992. H.R. 5334, 102nd
Congress, 2nd Session.
Federal Housing Finance Reform Act of 2005. H.R. 1461, 109th Congress, 1st Session.
Federal Reserve. 2009. ―Flow of Funds Accounts of the United States.‖ Federal Reserve
Statistical Release March. Washington DC: Board of Governors of the Federal Reserve System.
Ferguson, Niall, and Moritz Schularick. 2009. ―The End of Chimerica.‖ Harvard Business
School Working Paper 10-037. October. Cambridge: Harvard Business School.
Ferri, Giovanni, and Li-Gang Liu. 2009. ―Honor Thy Creditors Beforan Thy Shareholders: Are
the Profits of Chinese State-Owned Enterprises Real?‖ HKIMR Working Paper 16/2009. April.
Hong Kong: Hong Kong Institute for Monetary Research.

75
Financial Crisis Inquiry Commission. 2011. The Financial Crisis Inquiry Report: Final Report of
the National Commission on the Causes of the Financial and Economic Crisis in the United
States. New York: Public Affairs.
Financial Times. 2001. ―Lex - The Greenspan Put‖, January 4.
Funke, Michael and Jörg Rahn. 2005. ―Just How Undervalued is the Chinese Renminbi?‖ The
World Economy 28: 465-489.
Garn-St. Germain Depository Institutions Act of 1982. H.R. 6267, 97th Congress, 2nd Session.
Goldstein, Morris, and Nicholas R. Lardy. 2009. ―The Future of China‘s Exchange Rate Policy.‖
Policy Analyses in International Economics 87. Washington DC: Peterson Institute for
International Economics.
Goldstein, Morris, and Nicholas R. Lardy, editors. 2008. Debating China’s Exchange Rate
Policy. Washington DC: Peter G. Peterson Institute for International Economics.
Goodman, Peter S. 2008. ―Taking Hard New Look at a Greenspan Legacy.‖ New York Times.
October 8.
Gordon, Robert J., editor. 1990. The American Business Cycle: Continuity and Change. Chicago:
University of Chicago Press.
Gorton, Gary B., and Andrew Metrick. 2010. ―Regulating the Shadow Banking System.‖
Brookings Papers on Economic Activity (2): 261-312.
Gramm-Leach-Bliley Act. S. 900, 106th Congress, 1st Session.
Greenspan, Alan. 2003. ―Monetary Policy Report to Congress.‖ Testimony submitted to
Congress by the Board of Governors of the Federal Reserve System, Washington, DC, July 15.
Greenspan, Alan. 2004. ―Risk and Uncertainty in Monetary Policy.‖ The American Economic
Review 94(2): 33-40.
Greenspan, Alan and James E. Kennedy. 2008. ―Sources and Uses of Equity Extracted from
Homes.‖ Oxford Review of Economic Policy, 24:120-144.
Igan, Deniz and Prachi Misra. 2011. ―Three‘s Company: Wall Street, Capitol Hill, and K
Street.‖ IMF Working Paper (forthcoming) International Monetary Fund, Washington, DC.
International Finance Corporation. 2005. Investment Climate Survey Country Profile: China
2003. Washington, DC: World Bank Group.
International Monetary Fund. 2007. World Economic Outlook: Spillovers and Cycles in the
Global Economy. April. Washington, DC: International Monetary Fund.

76
International Monetary Fund. 2008. World Economic Outlook: Financial Stress, Downturns, and
Recoveries. October. Washington, DC: International Monetary Fund.
International Monetary Fund. 2009. ―The State of Public Finances Cross-Country Fiscal
Monitor: November 2009‖ IMF Staff Reports. November 3. Washington, DC: International
Monetary Fund.
International Monetary Fund. 2010. ―United States: 2011 Article IV Consultation‖ IMF Country
Report No. 11/201. July/ Washington, DC: International Monetary Fund.
International Monetary Fund. 2011. Middle East and Central Asia Regional Economic Outlook.
April. Washington, DC: International Monetary Fund.
International Monetary Fund. 2011. Article IV Consultation with Ireland. Washington, DC:
International Monetary Fund.
Jarocinski, Marek, and Frank R. Smets. 2008. ―Housing Prices and the Stance of Monetary
Policy.‖ Federal Reserve Bank of St. Louis Review 90:339-65.
Jeanne, Olivier. 2011 ―Capital Account Policies and the Real Exchange Rate.‖ Working Paper.
February.
Klapper, Leora and Inessa Love. 2010. ―The Impact of the Financial Crisis on New Firm
Registration.‖ Policy Research Working Paper Series 5444. Washington, DC: World Bank
Group.
Klein, Brian P., and Kenneth Neil Cukier. 2009. ―Tamed Tigers, Distressed Dragon: How
Export-Led Growth Derailed Asia's Economies.‖ Foreign Affairs 88(4): 8-16.
Krugman, Paul. 2009. ―Revenge of the Glut.‖ The New York Times, March 2.
Krugman, Paul. 2010a. ―Chinese New Year.‖ New York Times. January 1.
Krugman, Paul. 2010b. ―Taking on China.‖ The New York Times, March 15.
Kuijs, Louis. 2006. ―How Will China‘s Saving-Investment Balance Evolve.‖ World Bank Policy
Research Working Paper 3958. July. Washington, DC: World Bank Group.
Kuijs, Louis, William Mako, and Chunlin Zhang. 2005. ―SOE Dividends: How much and to
whom?‖ World Bank Policy Note 56651. October 17.
Laibson, David, and Johanna Mollerstrom. 2010. ―Capital Flows, Consumption Booms and
Asset Bubbles: A Behavioral Alternative to the Savings Glut Hypothesis.‖ Economic Journal
120: 354-374.

77
Lane, Phillip R. 2011. ―The Irish Crisis‖, Center for Economic Policy Research Discussion
Paper Series 8287. March. London:Center of Economic Policy Research.
Lardy, Nicholas R. 2005. ―Exchange Rate and Monetary Policy in China.‖ Cato Journal 25: 41-
47.
Lardy, Nicholas R. 2007. ―China: Rebalancing Economic Growth.‖ In The China Balance Sheet
in 2007 and Beyond. Washington, DC: Center for Strategic and International Studies.
Lee, Matthew R. 2008. ―Subprime Stoked by Deregulation and Bipartisan Greed, not
Community Reinvestment Act.‖ Inner City Press. September 28.
Lewis, Michael. 2010. The Big Short: Inside the Doomsday Machine. New York: W.W. Norton
& Company.
Lin, Justin Yifu. 2010. ―Global Imbalances, Reserve Currency and Global Economic
Governance.‖ Paper presented at the Brookings Institute, Washington, DC, October 7.
Lin, Justin Yifu. 2011. Demystifying the Chinese Economy. Cambridge: Cambridge University
Press.
Lin, Justin Yifu, Hinh Dinh, and Fernando Im. 2010. ―U.S.-China External Imbalance and the
Global Financial Crisis.‖ China Economic Journal 3(1): 1-24.
Lin, Justin Yifu, Jiandong Ju, and Qing Lu. 2011. ―Real Exchange Rates and Current Account
Imbalances in an Economy with Excess Supply of Labor.‖ Working Paper. January.
Mallaby, Sebastian. 2010. More Money than God: Hedge Funds and the Making of a New Elite.
New York: Penguin Press.
McKinnon, Ronald I. 2010. ―Why Exchange Rate Changes Will Not Correct Global Trade
Imbalances.‖ SIEPR Policy Brief. June. Stanford: Stanford Institute for Economic Policy
Research.
Mian, Atif, and Amir Sufi. 2009. ―The Consequences of Mortgage Credit Expansion: Evidence
from the U.S. Mortgage Default Crisis.‖ The Quarterly Journal of Economics 124(4):1449–96.
Mian, Atif, Amir Sufi, and Francesco Trebbi. 2010. ―The Political Economy of the U.S.
Mortgage Default Crisis.‖ The American Economic Review 100(5): 1967–98.
Miller, Marcus, Paul Weller, and Lei Zhang. 2002. ―Moral Hazard and the U.S. Stock Market:
Analyzing the ‗Greenspan Put‘.‖ The Economic Journal. 112(3):C171:86.
Mohan, Rakesh. 2009. ―Global financial crisis—causes, impact, policy responses and lessons‖.
BIS Review 54/2009.

78
National Bureau of Economic Research. 2010. ―U.S. Business Cycle Expansions and
Contractions.‖ Last modified September 20. http://www.nber.org/cycles/cyclesmain.html.
National Bureau of Statistics of China. 2010. Statistical Yearbook of China 2010. Beijing: China
Statistics Press.
Obstfeld, Maurice and Kenneth Rogoff. 2010. ―Global Imbalances and the Financial Crisis:
Products of Common Causes.‖ In Asia and the Global Financial Crisis, eds. Reuven Glick and
Mark Spiegel, 131-172. San Francisco, CA: Federal Reserve Bank of San Francisco.
(Proceedings of the Federal Reserve Bank of San Francisco Asia Economic Policy conference,
―Asia and the Global Financial Crisis,‖ Santa Barbara, CA, October 19-20, 2009).
Office of Management and Budget. 2010. Historical Tables, Budget of the U.S. Government,
Fiscal Year 2011.Washington, DC: U.S. Government Printing Office.
People‘s Republic of China Ministry of Finance. 1995. ―Provisional Regulations on the Payment
by Sino-Foreign Cooperative Joint Ventures of Royalties for the Exploitation of Onshore Oil
Resources <中外合作开采陆上石油资源缴纳矿区使用费暂行规定>.‖ July 28.
Portes, Richard. 2009. ―Global Imbalances.‖ In Macroeconomic Stability and Financial
Regulation: Key Issues for the G20, edited by Mathias Dewatripont, Xavier Freixas, and Richard
Portes, 19-26. London: Centre for Economic Policy Research.
Prasad, Eswar S. 2011. ―Rebalancing Growth in Asia.‖ International Finance 14(1):27-66.
Prohibit Predatory Lending Act of 2005. H.R. 1182, 109th Congress, 1st Session.
Rajan, Raghuram G. 2005. ―The Greenspan Era: Lessons for the Future.‖ Speech at the
Symposium Sponsored by the Federal Reserve Bank of Kansas City, Jackson Hole, Wyoming,
August 27.
Rajan, Raghuram G. 2010. Fault Lines: How Hidden Fractures Still Threaten the World
Economy. Princeton, New Jersey: Princeton University Press.
Rassweiler, Andrew. 2009. ―iPhone 3G S Carries $178.96 BOM and Manufacturing Cost,
iSuppli Teardown Reveals.‖ iSuppli. June 24.
Ravallion, Martin, and Shaohua Chen. 2007. ―Absolute Poverty Measures for the Developing
World, 1981–2004.‖ Proceedings of the National Academy of Sciences 104(43):16757–62.
Reinhart, Carmen M. and Kenneth S. Rogoff. 2009. This Time is Different: Eight Centuries of
Financial Folly. Princeton, New Jersey: Princeton University Press.
Responsible Lending Act of 2005. H.R. 1295, 109th Congress, 1st Session.

79
Riegle-Neal Interstate Banking and Branching Efficiency Act of 1994. H.R. 3841, 103rd
Congress, 2nd Session.
Roubini, Nouriel, 2008. ―The Rising Risk of a Systemic Financial Meltdown: The Twelve Steps
to Disaster.‖ Last updated February 5. http:www.roubini.com/analysis/44763.php.
Roubini, Nouriel and Stephen Mihm. 2010. Crisis Economics: A Crash Course in the Future of
Finance. New York: Penguin Press.
Schiller, Robert. 2005. Irrational Exuberance. Princeton, New Jersey: Princeton University
Press.
Schumer, Charles E. et al. 2005. ―S.295 - To authorize appropriate action if the negotiations with
the People‘s Republic of China regarding China‘s undervalued currency are not successful.‖
Submitted to the 109th Congress, Washington, DC, February 3.
Serven, Luis. 2011. ―The Global Dimensions of Saving in China.‖ Presentation at the China and
the World Economy conference held at the Graduate School of Economics of the Getulio Vargas
Foundation in Rio de Janeiro, Brazil, March 18.
Sherman, Matthew. 2009. ―A Short History of Financial Deregulation in the United States.‖ July.
Washington, DC: Center for Economic and Policy Research.
Spiegel Online. 2008. ―German Finance Minister Warns of Crisis Fallout: ‗Our Economy Will
Also Suffer.‘ September 25.
http://www.spiegel.de/international/germany/0,1518,580501,00.html.
Stock, James H. and Mark W. Watson. 2003. ―Has the Business Cycle Changed and Why?‖ In
NBER Macroeconomics Annual 2002, edited by Mark Gertler and Kenneth Rogoff, 17:159-230.
Cambridge, Massachusetts: MIT Press.
Summers, Lawrence H. 2008. ―Commentary.‖ In Debating China’s Exchange Rate Policy,
edited by Morris Goldstein and Nicholas R. Lardy. 349-353. Washington DC: Peter G. Peterson
Institute for International Economics.
Tax Reform Act of 1986. H.R. 3838, 99th Congress, 2nd Session.
U.S. National Archives and Records Administration. 2004. ―HUD‘s Housing Goals for the
Federal National Mortgage Association (Fannie Mae) and the Federal Home Loan Mortgage
Corporation (Freddie Mac) for the Years 2005–2008 and Amendments to HUD‘s Regulation of
Fannie Mae and Freddie Mac; Final Rule.‖ Federal Register 69: 63579–887 April.
Wang, Tao. 2004. ―Exchange Rate Dynamics.‖ In China’s Growth and Integration into the
World Economy: Prospects and Challenges, edited by Eswar Prasad, Occasional Paper 232:21–
28. Washington DC: International Monetary Fund.

80
Williamson, John. 1983. ―The Exchange Rate System.‖ Policy Analyses in International
Economics 5. Washington DC: Institute for International Economics.
World Bank. 2010. Global Economic Prospects 2010: Fiscal Headwinds and Recovery.
Washington, DC: World Bank Group.
World Bank. 2011. Global Economic Prospects 2011: Navigating Strong Currents. Volume 2.
Washington, DC: World Bank Group.
Xafa, Miranda. 2007. ―Global Imbalances: Do They Matter.‖ Cato Journal 7(1):59–68.


![Crisis communication [Read-Only] - NDSURisk and Crisis Communication Crisis •“A specific, unexpected, and non‐routine…event or series of events which creates high levels of](https://img.pdfslide.us/doc/110x75/5ed2781ea41023427a34f714/crisis-communication-read-only-ndsu-risk-and-crisis-communication-crisis-aaoea.jpg)