Embed Size (px)
Citation preview
The Unequal Effects of Liberalization: Evidence from Dismantling the License Raj in India∗
Philippe Aghion,† Robin Burgess,‡ Stephen Redding,§Fabrizio Zilibotti¶
The Suntory Centre Suntory and Toyota International Centres for Economics and Related Disciplines London School of Economics and Political Science Houghton Street London WC2A 2AE
DEDPS 45 December 2005 Tel: (020) 7955 6674
∗ We are grateful to Timothy Besley, Rachel Gri¢ th, Elhanan Helpman, Ethan Kaplan and seminar participants at Berkeley, Canadian Institute for Advanced Research, LSE, NBER Summer Institute, Macarthur Inequality Workshop, Society for Economic Dynamics 2004 Florence Meeting, Stanford, UCL, Yale and University of Zurich for useful comments and suggestions. Arunish Chawla, Ashwini Natraj, Juan Pablo Rud and Kwok Tong Soo provided excellent research assistance. We thank the CEPR, Leverhulme Trust, the Bank of Sweden Tercentenary Foundation STICERD, LSE and UC Berkeley Department of Economics for financial support. † Department of Economics, Harvard University and CEPR ‡ Department of Econoimcs, LSE, CEPR and NBER § Department of Economcis, LSE and CEPR ¶ IIES, Stockholm University and CEPR
Abstract
This paper investigates whether the effects, on registered manufacturing out-put, employment, entry and investment, of dismantling the ‘license raj’ - a system of central controls regulating entry and production activity in this sector - vary across Indian states with different labor market regulations. The effects are found to be unequal depending on the institutional environment in which industries are embedded. In particular, following delicensing, industries located in states with pro-employer labor market institutions grew more quickly than those in pro-worker environments. Our results emphasize how local institutions matter for whether industry in a region benefits or is harmed by the nationwide delicensing reform.
Development Economics Discussion Paper Series
This series is published by the Economic Organisation and Public Policy Programme (EOPP) located within the Suntory and Toyota International Centres for Economics and Related Disciplines (STICERD) at the London School of Economics and Political Science. The programme was established in October 1998 as a successor to the Development Economics Research Programme. The work of the programme is mainly in the fields of development economics, public economics and political economy. It is directed by Tim Besley, Oriana Bandiera, Robin Burgess, Maitreesh Ghatak and Andrea Prat. Further details about the programme and its work can be viewed on our web site at http://sticerd.lse.ac.uk/research/eopp. Our Discussion Paper series is available free of charge. To subscribe to DEDPS, please contact Leila Alberici on:
Telephone: UK+20 7955 6674 Fax: UK+20 7955 6951 Email: l.alberici @lse.ac.uk Web site: http://sticerd.lse.ac.uk/dedps
Tim Besley Oriana Bandiera Robin Burgess Maitreesh Ghatak Andrea Prat © The authors. All rights reserved. Short sections of text, not to exceed two paragraphs, may be quoted without explicit permission provided that full credit, including © notice, is given to the source.
1 Introduction
In the post-war period, planned industrialization became a major doctrine for tacklingeconomic backwardness in developing countries. The theoretical argument was thatmassive state investment would help kick start development and state coordination ofeconomic activities would ensure the rapid and sustained growth of domestic industries(Rosenstein-Rodan, 1943 and 1961; Rostow, 1952). Policy-makers translated these prin-ciples into a variety of policies. In countries where private initiative was not altogethersuppressed, a cornerstone of the development strategy was the requirement for �rms toobtain a license to begin or expand production. The goal of this policy was to placeindustrial development under the control of central governments, allowing them to al-locate plan targets to �rms and to address inequities across regions. Trade restrictionswere also part of the same package: tari¤s would shelter nascent domestic industriesfrom foreign competition, and help promote the industrialization process according tothe objectives of the plan.These views remained in�uential among policy-makers until the 1970�s. However,
amidst growing dissatisfaction about its results, the consensus shifted in the 1980s fromplanned industrialization to liberalization and laissez-faire. Many developing countriesprogressively abandoned central planning, dismantled government controls over industry,and liberalized trade. This paradigm change has been the source of a passionate debate.Most mainstream economists have welcomed it as a key step to achieve growth andpoverty eradication, while skeptics have warned, among other things, that liberalizationmight exacerbate income inequality within countries.1 In recent research, Acemoglu,Aghion and Zilibotti (2006) argue that understanding how competition enhancing poli-cies and other institutions interact is key to designing growth enhancing reforms.In this paper we examine the interaction between product market deregulation and
the organization of labor markets. We focus on India, and look at the e¤ects of aparticular internal liberalization episode �the dismantling of industrial licensing duringthe 1980�s and 1990�s. We exploit the fact that Indian states have a considerable degree ofpolitical and policy autonomy, resulting in a large variation of institutional environmentswith which the nationwide industrial policy reform interacts. In particular, we focus oncross-state di¤erences in labor market regulations.After independence, India�s industrial policy had been shaped by the 1951 Industries
(Development and Regulation) Act which introduced a system of industrial licensing thatregulated and restricted entry of new �rms and expansion of existing ones and becameknown as the �license raj�. The persistent stagnation of the Indian economy promptedthe government to undertake a set of liberalization reforms as of the 1980�s. About athird of three-digit industries were exempted from industrial licensing, or delicensed, in1985 (with few extensions in 1986 and 1987), whereas most of the remaining industrieswere delicensed in 1991. Trade barriers (tari¤s) were also slashed in the 1990�s. Labormarket institutions also started from a common nationwide framework, the Industrial
1Among the critical views, see Haussman and Rodrik (2002), Rodrik and Rodriguez (2000), Stiglitz(2002), and Rodrik et al., (2004). The e¤ects on income inequality are stressed by Banerjee and Newman(2003), and Attanasio et al. (2005). Goldberg and Pavcnik (2004) provide a summary of the empiricalevidence on the e¤ects of liberalization on inequality.
2
Disputes Act, approved in 1947, which regulated industrial relations in the registeredor organized manufacturing sector. However, under the Indian constitution states wereentitled to amend the Act, and amendments were in fact extensively introduced. Asa result, labor market institutions gradually evolved, and there was a large extent ofheterogeneity across Indian states at the time of the industrial policy reforms of the1980�s and 1990�s.To guide the analysis, we construct a simple model of an economy where �rms are
heterogenous in productivity as in Melitz (2003), but with subregions (or states) whichdi¤er in terms of their labor market institutions. We analyze how the removal of entryor size restrictions induces entry, exit, and production reallocations between states withdi¤erent labor market institutions. The theory predicts that a reform slashing barriersto entry and expansion would bene�t states where labor market institutions are morebusiness-friendly, and possibly harm states there are biased in favor of workers.To examine this idea empirically we track manufacturing industries using a three-
digit state-industry panel from the Annual Survey of Industries for the sixteen mainstates of India (covering over 95% of the Indian population). Our data span 1980-1997and thus cover the the main period of delicensing in India. For each of these years wehave state-speci�c industrial outcomes for an average of 85 three-digit industries in eachyear yielding about twenty-four thousand observations. We have also information onthe year in which the delicensing reform was introduced in each industry. To measurestate-speci�c labor market regulations, we extend the data of Besley and Burgess (2004)who coded state amendments Industrial Disputes Act as �pro-employer�, �pro-worker�and �neutral�. State-industries within a three-digit sector are heterogeneous in termsof the state regulatory environments in which they are embedded. Both state laborregulations and the nationwide delicensing reforms apply to the organized manufacturingsector surveyed by the Annual Survey of Industries allowing us to make inferences aboutthe interaction between product market and labor market regulation.Our main �nding is that, consistent with the prediction of the theory, the response
to delicensing varies signi�cantly depending on the labor markets conditions prevailingin di¤erent Indian states. Within each industry, pro-employer states bene�tted fromthe reform relative to pro-worker states in terms of output, employment,number of fac-tories and capital accumulation. In pro-worker states we �nd that delicensing actuallydepressed industrial performance relative to what would have happened had the licenseraj remained in place. Our results stand up to a wide variety of robustness checks. We�nd a similar interaction e¤ect between labor market institutions and a measure of theextent of the trade liberalization that was mainly carried out in the early 1990�s.In previous work we have documented descriptively that the process of reform in
the 1980�s and 1990�s was associated with increasing cross-state inequality in industrialperformance (Aghion et al.. 2005b). There, we showed that the timing and the variationacross industries of the inequality trends is associated with the process of delicensing. Inparticular, inequality started growing earlier for industries that delicensed in 1985, whileit only grew later for industries that delicensed in 1991, and does not grow for industriesthat never delicensed. The results of this paper emphasize that institutional di¤erencesacross states are an important factor in the unequal response of state-industries, and
3
illustrate the importance of the interaction between fast-moving product market dereg-ulation (delicensing, trade liberalization) and slow-moving labor market regulation inexplaining the evolution of cross-state industrial performance.2
Our work on the interaction between product and labor market regulation relatesto several strands of literature. First, a number of recent papers have focused on therole of labor and entry regulation as a determinant of economic performance (Holmes,1998; Caballero and Hammour, 1998; Bertrand and Kramarz, 2002; Djankov et al,2002; Besley and Burgess, 2004; Caballero et al, 2004). Another set of papers arguethat the e¤ectiveness and desirability of pro-competitive reforms depends on the stateof technology. These include Acemoglu et al. 2006, Aghion et al. (2004 and 2005aand 2005b) and Aghion and Gri¢ th (2005). Aghion et al (2005a), for example, showusing a UK �rm-level panel data, that innovation incentives respond more positivelyto increased market competition in industries that are closer to the technology frontierthan in industries that are far below it. In a similar spirit the recent trade literature hasstudied how heterogeneous �rms and industries react di¤erently to trade liberalization(Tybout et al., 1991; Hay, 2001, Krishna and Mitra, 1998, Levinsohn, 1999, Pavcnik,2002; Melitz, 2003, Muendler, 2004, Tre�er, 2005, Hsieh and Woo, 2005 and Verhoogen2005). Finally the paper relates to a small but growing recent literature that analyzes theinteraction between product market and labor market regulations (Rama, 1997, Ramaand Tabellini, 1999; Blanchard and Giavazzi, 2002, Cunat and Melitz, 2005; Harrison,2005, Topalova, 2005).The paper is structured as follows. Section 2 reports on the history of the license raj
in India. Section 3 presents a simple model of industry equilibrium. Section 4 provides adescription of the data. Section 5 contains the main empirical analysis. Finally, section6 concludes.
2 The Rise and Fall of the License Raj
After independence in 1947 India embarked on a period of centrally planned industrial-ization. The centerpiece of the planning regime was the Industries (Development andRegulation) Act of 1951 which states that �it is expedient in the public interest thatthe Union should take under its control the industries in First Schedule�.3 This Actintroduced a system of industrial licensing to control the pace and pattern of industrialdevelopment across the country which became known as the �license raj�. Licensing be-came the key means of allocating production targets set out in the �ve-year plans to�rms. Both state and private �rms in the registered manufacturing sector were coveredunder the licensing regime (Hazari, 1966). State control over industrial developmentvia licensing was intended to accelerate industrialization and economic growth and to
2The distinction between fast moving and slowmoving institutions is discussed in Roland (1994),who, however, refers to social norms and values as slow-moving institutions.
3Union refers to central government. The First Schedule lists all key manufacturing industries in1951 and is subsequently revised to encompass new products. This central planning act e¤ectivelybrings all key industries in the organised manufacturing sector under central government control vialicensing (Malik, 1997).
4
reduce regional disparities in income and wealth.4
The development of the organized manufacturing sector became tightly regulated.Under the 1951 Industries Act an industrial license was required to (i) establish a newfactory, (ii) carry on business in an existing unlicensed factory (iii) signi�cantly expandan existing factory�s capacity, (iv) start a new product line and (iv) change location.Applications for industrial licenses were made to the Ministry of Industrial Developmentand then reviewed by an inter-ministerial Licensing Committee.The bureaucratic nature of the licensing process imposed a substantial administrative
burden on �rms.5 There was also considerable uncertainty as to whether license appli-cations would be approved and within what time frame. For example, 35% of licenseapplications in 1959 and 1960 were rejected, with the rejected applicants accounting foraround 50% of the investment value of all applications (Hazari, 1966).6 Delays in theapproval process were common and of indeterminate length. No explicit criteria for theaward of industrial licenses were provided to applicants. Since the Licensing Commit-tee reviewed applications on a sequential, �rst-come, �rst-served basis, and since the�ve-year plans laid down targets or ceilings for industrial capacity, this provided anincentive for preemptive license applications. This system tended to favor the largerindustrial houses (e.g. Birla, J.K. and Tata) which were better informed and organizedand submitted multiple early applications as a means of foreclosing on plan capacity.Recognition of these problems led to various reforms in the 1970s which attempted
to streamline the application process and to raise exemption and expansion limits. Bythis time it had become apparent that industrial licensing had failed to bring about therapid industrial development that had been anticipated in the 1950s. Wholesale reformof the licensing system, however, was delayed until the 1980s. The Congress Partywhich had been the dominant political force in the country su¤ered a severe defeat inboth, state and central elections in the late 1970s. The heightened political competitionwhich followed led to pressure for dismantling of government controls including theindustrial licensing system. The Congress leader Indira Gandhi responded via the 1980Statement on Industrial Policy which signalled a renewed emphasis on economic growth(see Government of India, 1980). Large scale delicensing, however did not occur until herson Rajiv Gandhi unexpectedly came to power following his mother�s assassination in1984. He was an unknown quantity �an airline pilot with no political experience �whoturned out be a fervent reformer and was responsible for moving India in a pro-businessdirection (Rodrik and Subramaniam, 2004). Twenty �ve broad categories of industries
4Other objectives included the development of small-scale and cottage industries and preventing con-centration of economic power in the hands of small numbers of individuals (Industrial Policy Resolution,1956).
5Successful license applicants were required to submit a G-return to the Ministry of Industrial Devel-opment every six months outlining progress in implementing licensed capacity. Even once a license hadbeen granted, further expansion of capacity, changes in the article produced or changes in the locationof manufacture would require an additional license application under the terms of the 1951 IndustriesAct.
6License applications are themselves a selected sample of potential undertakings. Some investmentsthat would have incurred in the absence of industrial licensing may not have even reached the licenseapplication stage.
5
were entirely exempted from industrial licensing, or delicensed, in March 1985. In late1985 and 1986, there followed further relaxations of the industrial licensing system.In May 1991, Rajiv Gandhi was assassinated in the midst of an election campaign
that subsequently carried his Congress Party to victory. Narasimha Rao was appointedas his successor in the post of Prime Minister, and he in turn appointed Manmohan Singhas Finance Minister. Rising external debt, exacerbated by the increase in oil prices dueto the Gulf War, resulted in macroeconomic crisis and India was obliged to requesta stand-by arrangement with the International Monetary Fund (IMF). The �nancialassistance was made conditional upon the implementation of a structural adjustmentprogramme.In response to this external pressure the Rao administration implemented a large
scale liberalization of the Indian economy. As with Rajiv Gandhi the depth of reformisttendencies of the Rao/Singh team were largely unanticipated (Rodrik and Subrama-niam, 2004; Topalova, 2005). In 1991 industrial licensing was abolished except for asmall number of industries where licensing was retained �for reasons related to securityand strategic concerns, social reasons, problems related to safety and over-riding en-vironmental issues, manufacture of products of hazardous nature and articles of elitistconsumption.�(Government of India, 1991). Additional industries were removed fromthe provisions of the 1951 Industries in the post-1991 period. From 1991 onwards, tari¤and non-tari¤ barriers were also slashed as India opened its economy to the outsideworld (Topalova 2004, 2005). The stated rationale for the liberalization of industrialpolicy was �to actively encourage and assist Indian entrepreneurs to exploit and meetthe emerging domestic and global opportunities and challenges. The bedrock of anypackage of measures must be to let the entrepreneurs make investment decisions on thebasis of their own commercial judgment.�(Government of India, 1991).The two waves of delicensing in 1985 and 1991 brought central government control
over industrial development to a close. The license raj which had been in place for fortyyears had collapsed. Both waves of reform followed leadership transitions resulting fromassassinations. In this paper we exploit this variation to examine whether the impact ofdelicensing on industrial performance was a¤ected by the state of labor institutions inthe Indian states.
3 A Simple Model of Industry Equilibrium
To guide the empirical analysis of the following sections, we construct a stylized modelof industry equilibrium where the reduction of barriers to entry and expansion gener-ates entry, exit and resource reallocation between regions (�states�) characterized bydi¤erent labor market institutions. Its building blocks are the following. First, �rmsare heterogenous in productivity and geographical locations. Productivity di¤erencesmay stem from entrepreneurial skills, availability of local infrastructure, or knowledgeembodied in the local labor force. Second, �rms face common labor market institutionswithin each state but institutions vary across states. We capture such di¤erences in areduced-form fashion by cross-state variation in average unit labor costs: in states withpro-worker (pro-employer) labor markets institutions �rms have to pay a higher (lower)
6
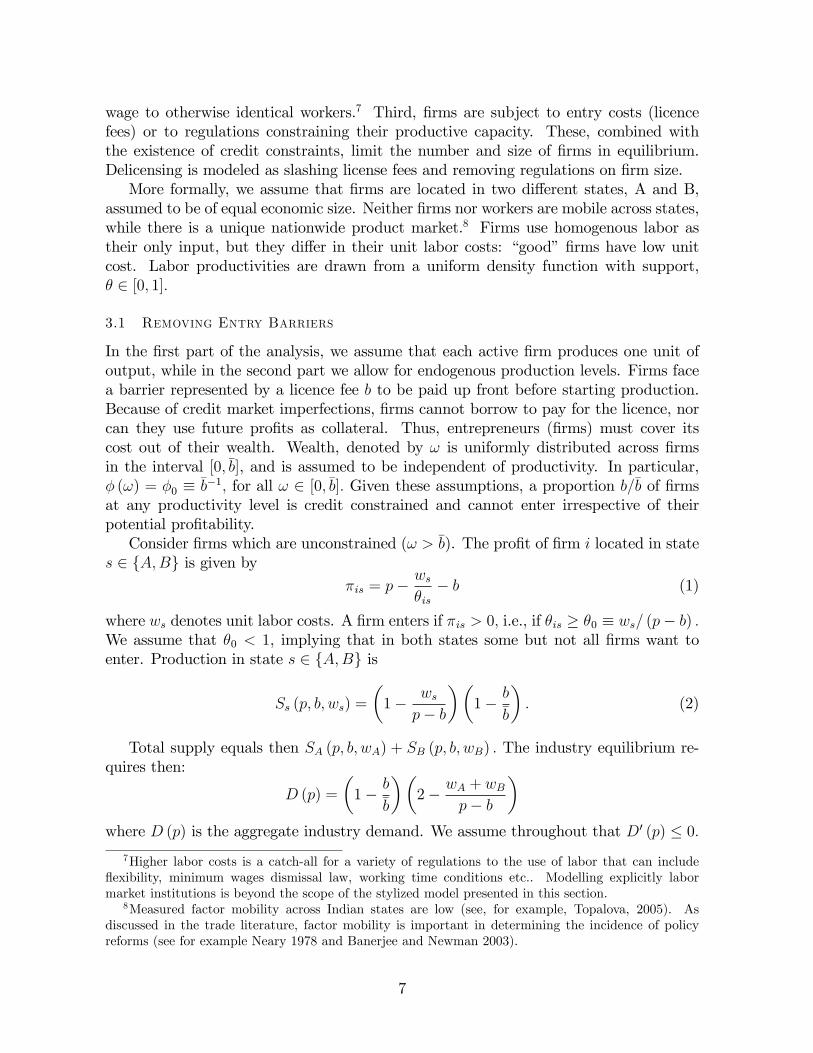
wage to otherwise identical workers.7 Third, �rms are subject to entry costs (licencefees) or to regulations constraining their productive capacity. These, combined withthe existence of credit constraints, limit the number and size of �rms in equilibrium.Delicensing is modeled as slashing license fees and removing regulations on �rm size.More formally, we assume that �rms are located in two di¤erent states, A and B,
assumed to be of equal economic size. Neither �rms nor workers are mobile across states,while there is a unique nationwide product market.8 Firms use homogenous labor astheir only input, but they di¤er in their unit labor costs: �good��rms have low unitcost. Labor productivities are drawn from a uniform density function with support,� 2 [0; 1]:
3.1 Removing Entry Barriers
In the �rst part of the analysis, we assume that each active �rm produces one unit ofoutput, while in the second part we allow for endogenous production levels. Firms facea barrier represented by a licence fee b to be paid up front before starting production.Because of credit market imperfections, �rms cannot borrow to pay for the licence, norcan they use future pro�ts as collateral. Thus, entrepreneurs (�rms) must cover itscost out of their wealth. Wealth, denoted by ! is uniformly distributed across �rmsin the interval [0;�b], and is assumed to be independent of productivity. In particular,� (!) = �0 � �b�1; for all ! 2 [0;�b]: Given these assumptions, a proportion b=�b of �rmsat any productivity level is credit constrained and cannot enter irrespective of theirpotential pro�tability.Consider �rms which are unconstrained (! > �b). The pro�t of �rm i located in state
s 2 fA;Bg is given by�is = p�
ws�is� b (1)
where ws denotes unit labor costs. A �rm enters if �is > 0; i.e., if �is � �0 � ws= (p� b) :We assume that �0 < 1, implying that in both states some but not all �rms want toenter. Production in state s 2 fA;Bg is
Ss (p; b; ws) =
�1� ws
p� b
��1� b�b
�: (2)
Total supply equals then SA (p; b; wA) + SB (p; b; wB) : The industry equilibrium re-quires then:
D (p) =
�1� b�b
��2� wA + wB
p� b
�where D (p) is the aggregate industry demand. We assume throughout that D0 (p) � 0:
7Higher labor costs is a catch-all for a variety of regulations to the use of labor that can include�exibility, minimum wages dismissal law, working time conditions etc.. Modelling explicitly labormarket institutions is beyond the scope of the stylized model presented in this section.
8Measured factor mobility across Indian states are low (see, for example, Topalova, 2005). Asdiscussed in the trade literature, factor mobility is important in determining the incidence of policyreforms (see for example Neary 1978 and Banerjee and Newman 2003).
7
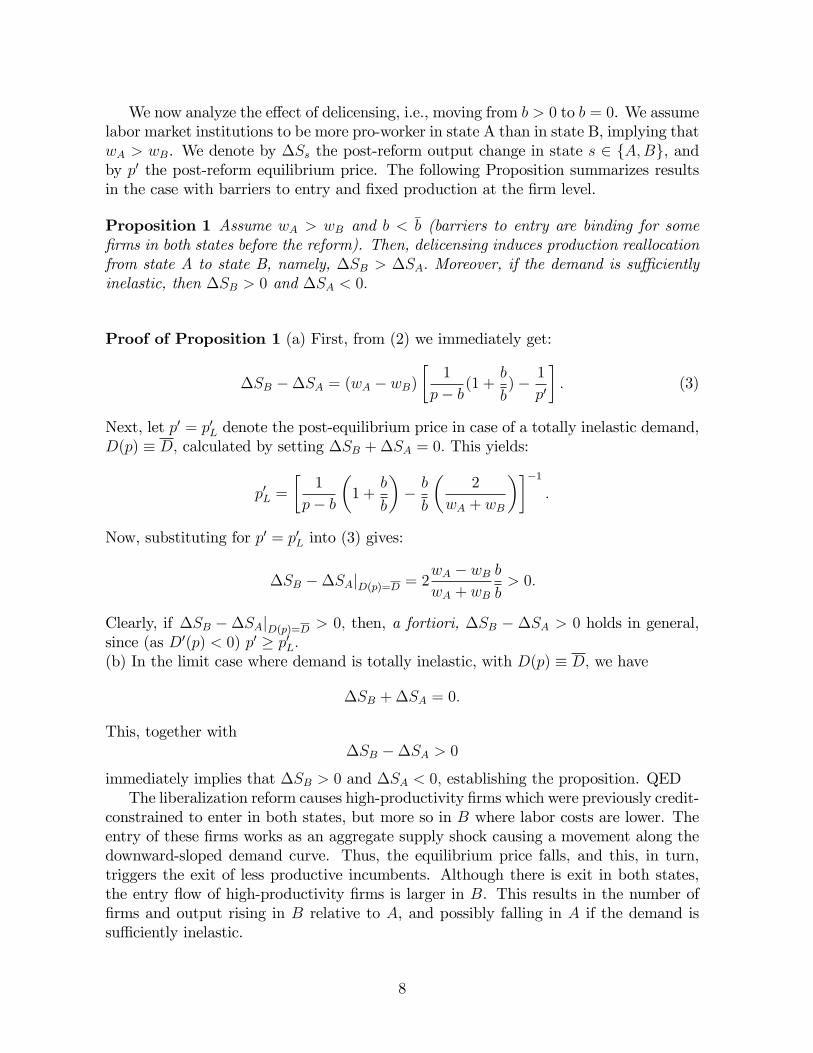
We now analyze the e¤ect of delicensing, i.e., moving from b > 0 to b = 0. We assumelabor market institutions to be more pro-worker in state A than in state B, implying thatwA > wB. We denote by �Ss the post-reform output change in state s 2 fA;Bg, andby p0 the post-reform equilibrium price. The following Proposition summarizes resultsin the case with barriers to entry and �xed production at the �rm level.
Proposition 1 Assume wA > wB and b < �b (barriers to entry are binding for some�rms in both states before the reform). Then, delicensing induces production reallocationfrom state A to state B, namely, �SB > �SA: Moreover, if the demand is su¢ cientlyinelastic, then �SB > 0 and �SA < 0:
Proof of Proposition 1 (a) First, from (2) we immediately get:
�SB ��SA = (wA � wB)�1
p� b(1 +b
b)� 1
p0
�: (3)
Next, let p0 = p0L denote the post-equilibrium price in case of a totally inelastic demand,D(p) � D; calculated by setting �SB +�SA = 0: This yields:
p0L =
�1
p� b
�1 +
b
b
�� bb
�2
wA + wB
���1:
Now, substituting for p0 = p0L into (3) gives:
�SB ��SAjD(p)=D = 2wA � wBwA + wB
b
b> 0:
Clearly, if �SB ��SAjD(p)=D > 0; then, a fortiori, �SB � �SA > 0 holds in general,since (as D0(p) < 0) p0 � p0L:(b) In the limit case where demand is totally inelastic, with D(p) � D; we have
�SB +�SA = 0:
This, together with�SB ��SA > 0
immediately implies that �SB > 0 and �SA < 0; establishing the proposition. QEDThe liberalization reform causes high-productivity �rms which were previously credit-
constrained to enter in both states, but more so in B where labor costs are lower. Theentry of these �rms works as an aggregate supply shock causing a movement along thedownward-sloped demand curve. Thus, the equilibrium price falls, and this, in turn,triggers the exit of less productive incumbents. Although there is exit in both states,the entry �ow of high-productivity �rms is larger in B. This results in the number of�rms and output rising in B relative to A, and possibly falling in A if the demand issu¢ ciently inelastic.
8
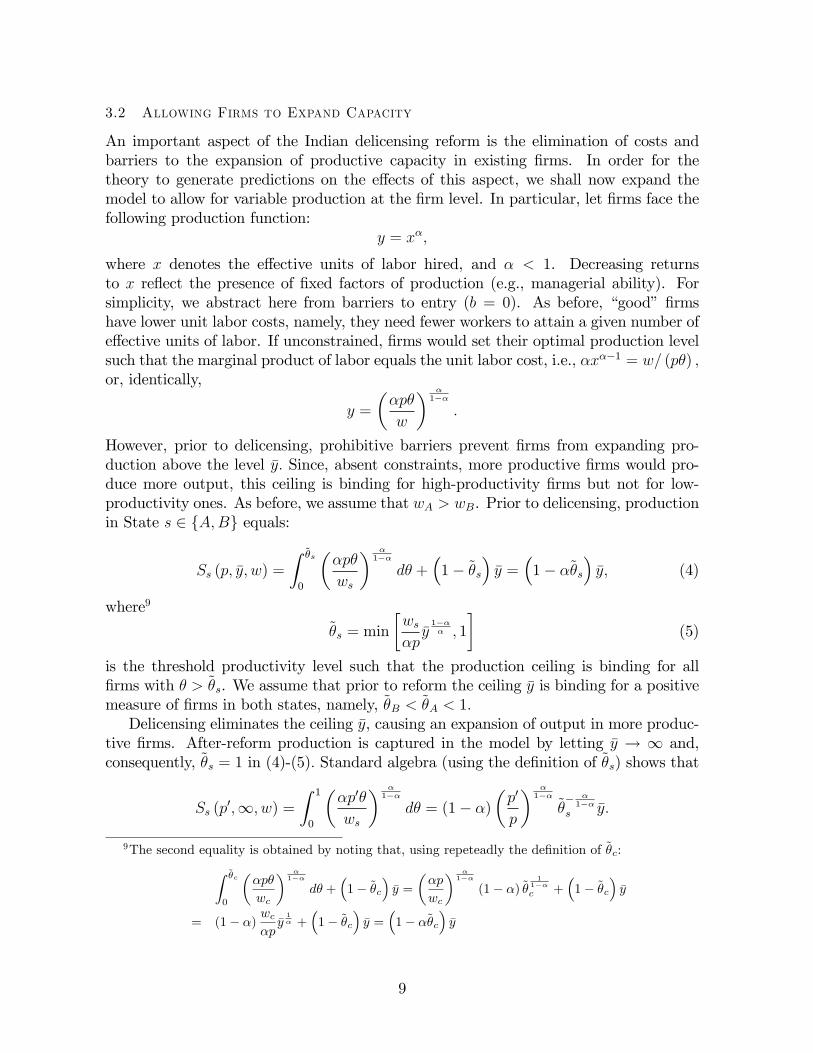
3.2 Allowing Firms to Expand Capacity
An important aspect of the Indian delicensing reform is the elimination of costs andbarriers to the expansion of productive capacity in existing �rms. In order for thetheory to generate predictions on the e¤ects of this aspect, we shall now expand themodel to allow for variable production at the �rm level. In particular, let �rms face thefollowing production function:
y = x�;
where x denotes the e¤ective units of labor hired, and � < 1. Decreasing returnsto x re�ect the presence of �xed factors of production (e.g., managerial ability). Forsimplicity, we abstract here from barriers to entry (b = 0). As before, �good��rmshave lower unit labor costs, namely, they need fewer workers to attain a given number ofe¤ective units of labor. If unconstrained, �rms would set their optimal production levelsuch that the marginal product of labor equals the unit labor cost, i.e., �x��1 = w= (p�) ;or, identically,
y =
��p�
w
� �1��
:
However, prior to delicensing, prohibitive barriers prevent �rms from expanding pro-duction above the level �y: Since, absent constraints, more productive �rms would pro-duce more output, this ceiling is binding for high-productivity �rms but not for low-productivity ones. As before, we assume that wA > wB. Prior to delicensing, productionin State s 2 fA;Bg equals:
Ss (p; �y; w) =
Z ~�s
0
��p�
ws
� �1��
d� +�1� ~�s
��y =
�1� �~�s
��y; (4)
where9
~�s = min
�ws�p�y1��� ; 1
�(5)
is the threshold productivity level such that the production ceiling is binding for all�rms with � > ~�s. We assume that prior to reform the ceiling �y is binding for a positivemeasure of �rms in both states, namely, ~�B < ~�A < 1:Delicensing eliminates the ceiling �y, causing an expansion of output in more produc-
tive �rms. After-reform production is captured in the model by letting �y ! 1 and,consequently, ~�s = 1 in (4)-(5): Standard algebra (using the de�nition of ~�s) shows that
Ss (p0;1; w) =
Z 1
0
��p0�
ws
� �1��
d� = (1� �)�p0
p
� �1��~�� �1��
s �y:
9The second equality is obtained by noting that, using repeteadly the de�nition of ~�c:Z ~�c
0
��p�
wc
� �1��
d� +�1� ~�c
��y =
��p
wc
� �1��
(1� �) ~�1
1��c +
�1� ~�c
��y
= (1� �) wc�p�y1� +
�1� ~�c
��y =
�1� �~�c
��y
9
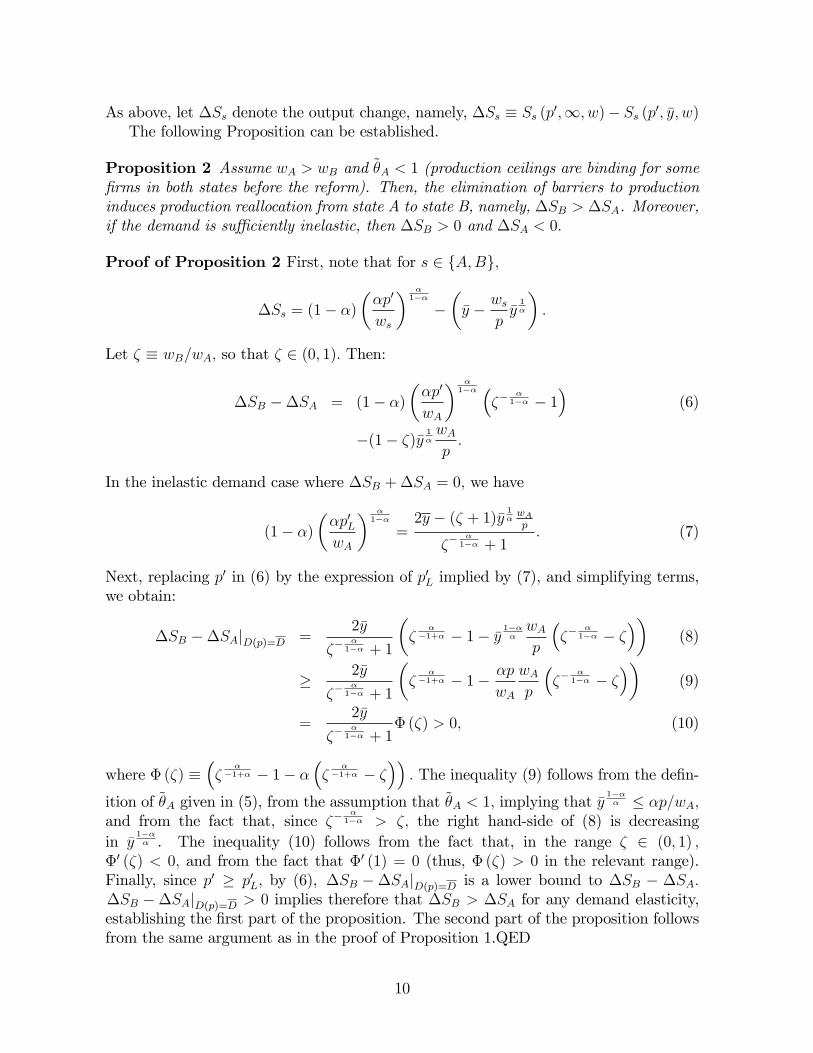
As above, let �Ss denote the output change, namely, �Ss � Ss (p0;1; w)� Ss (p0; �y; w)The following Proposition can be established.
Proposition 2 Assume wA > wB and ~�A < 1 (production ceilings are binding for some�rms in both states before the reform). Then, the elimination of barriers to productioninduces production reallocation from state A to state B, namely, �SB > �SA. Moreover,if the demand is su¢ ciently inelastic, then �SB > 0 and �SA < 0:
Proof of Proposition 2 First, note that for s 2 fA;Bg;
�Ss = (1� �)��p0
ws
� �1��
���y � ws
p�y1�
�:
Let � � wB=wA; so that � 2 (0; 1): Then:
�SB ��SA = (1� �)��p0
wA
� �1�� �
���
1�� � 1�
(6)
�(1� �)�y 1�wAp:
In the inelastic demand case where �SB +�SA = 0; we have
(1� �)��p0LwA
� �1��
=2y � (� + 1)�y 1
�wAp
���
1�� + 1: (7)
Next, replacing p0 in (6) by the expression of p0L implied by (7), and simplifying terms,we obtain:
�SB ��SAjD(p)=D =2�y
���
1�� + 1
��
��1+� � 1� �y 1��� wA
p
���
�1�� � �
��(8)
� 2�y
���
1�� + 1
��
��1+� � 1� �p
wA
wAp
���
�1�� � �
��(9)
=2�y
���
1�� + 1� (�) > 0; (10)
where � (�) ���
��1+� � 1� �
��
��1+� � �
��: The inequality (9) follows from the de�n-
ition of ~�A given in (5), from the assumption that ~�A < 1; implying that �y1��� � �p=wA;
and from the fact that, since ���
1�� > �; the right hand-side of (8) is decreasingin �y
1��� . The inequality (10) follows from the fact that, in the range � 2 (0; 1) ;
�0 (�) < 0; and from the fact that �0 (1) = 0 (thus, � (�) > 0 in the relevant range).Finally, since p0 � p0L; by (6), �SB ��SAjD(p)=D is a lower bound to �SB � �SA:�SB ��SAjD(p)=D > 0 implies therefore that �SB > �SA for any demand elasticity,establishing the �rst part of the proposition. The second part of the proposition followsfrom the same argument as in the proof of Proposition 1.QED
10
Slashing production ceilings causes an expansion in the production of high-productivity�rms which were previously constrained, and a fall in the equilibrium price. Low-productivity �rms react by reducing their output (if production were subject to �xedcosts, some would actually exit). On average, production expands more in state B (dueto lower labor costs), and possibly falls in state A.In reality, the Indian reforms entailed both the reduction of barriers to entry and the
elimination of controls on the production decisions of �rms. Thus, our theory predictsthat the delicensing triggers both the entry of new �rms accompanied by the exit of lessproductive incumbents (as in Proposition 1) and the expansion of more productive �rmsaccompanied by the contraction of less productive ones (as in Proposition 2). Bothe¤ects give rise to a reallocation of economic activity. Within each industry, output,employment, the number of factories and �xed capital expand more in regions wherelabor costs are lower, and possibly fall in regions where labor costs are higher. It is thesepredictions that we shall test in the next sections using Indian state-industry panel data.The idea that market liberalization favors the more productive �rms at the expense
of the less productive ones is reminiscent of Melitz (2003). In his theory, �rms withheterogenous productivities can either produce for the domestic market or export. Tradeliberalization is modelled as either a reduction in the per-unit iceberg cost of export, ora reduction in the �xed cost of exporting. A reform reducing either of these costs causesmore productive �rms to expand production whereas it forces the less productive �rmsto exit or shut down.10 Melitz�s model di¤ers from ours in two respects. First, it hasonly one factor market and �rm-level productivity is the only source of heterogeneity,whereas our focus is on the interplay between liberalization and the heterogeneity in labormarkets. Second, his emphasis is on trade liberalization, while ours is on delicensing.
4 Data
Table 1 contains the descriptive statistics for the main variables that we use in ouranalysis. Manufacturing in India is composed of two sub-sectors �an unregistered (un-organized) sector of small �rms and a registered (organized) sector of larger �rms.11 Inour sample period, the former makes up about 5 percent of state output and the latter9 percent. Both industrial licensing (via the 1951 Industries Act) and labor marketregulations (via the 1947 Industrial Disputes Act) only apply to �rms in the registeredsector. For these reasons our analysis focuses on the registered manufacturing sector.We have data at the three-digit industry level for the period 1980-1997 (which covers
delicensing) for the sixteen main states of India. For each three-digit industry we cantrack what happened to entry, output, employment and investment in each of the mainIndian states across this period. We then use codings of the state level amendments
10In his model, the reduction in trade costs induces entry by more productive �rms which can a¤ordthe �xed exporting cost. This increases domestic labor demand and therefore the real domestic wagerate, which in turn forces more low productivity �rms to exit, as their pro�t margins become too smallfor them to cover their �xed production costs.11Under the Factories Act of 1948 enterprises are required to register if either (i) they have more
than ten employees and use electric power or (ii) they have more than twenty employees and do not useelectric power.
11
to this 1947 Industrial Disputes Act to capture whether labor regulation in a state ismoving in a pro-worker or pro-employer direction. The state-industry panel data setwe construct in this way allows us to study the links between nationwide delicensing,labor market regulations at the state level, and manufacturing performance at the state-industry level.
4.1 Delicensing and Trade Protection
To construct our delicensing measure we �rst assigned three-digit codes to all the in-dustries licensed under the 1951 Industries Act (and subsequent amendments to thatAct). We then used statements on industrial policy, press notes and noti�cations issuedby the federal government to construct a delicensing dummy variable which is equal toone if all or part of a three-digit manufacturing industry is delicensed in a particularyear and to zero otherwise. Separate, independent codings were carried out to ensureconsistency. This policy measure tells us when each three-digit industry was delicensedwithin the 1980-1997 period.12 Figure 1 plots when di¤erent three-digit industries weredelicensed. The 1985 delicensing wave associated with Rajiv Gandhi�s rise to powerin 1984 and the 1991 wave associated with Narasimha Rao�s take over following RajivGandhi�s assassination in 1991, are both clearly visible. There is little delicensing ac-tion away from these leadership transitions. In the 1985-1990 wave about one third ofall three-digit industries are delicensed and in the 1991-1997 wave a further half of allthree-digit industries are delicensed. About one tenth of three-digit industries remainlicensed at the end of our data period in 1997. To take account of this variation weconstruct a second measure of delicensing where we have separate dummies for whethera three-digit industry is delicensed in the 1985-1990 wave or the 1991-1997 wave. Table1 documents that the number of industries, share of output and share of employmentdelicensed rises �rst in 1985 and then again post-1990.We also construct measures of tari¤ barriers over time for each three-digit industry
for the period 1980-1997. We exploit information on o¢ cial rates of duty applied tohighly disaggregated products in the Customs Tari¤ of India manuals issued throughthe Central Board of Excise and Custom. Indian tari¤s comprise a basic rate of duty,an auxiliary rate of duty, and a countervailing duty. We combine the three rates of dutyaccording to the o¢ cial formula for the applied tari¤ rate, as discussed in further detailin the data appendix. Prior to 1988, the tari¤ data are reported for approximately onethousand one hundred products of the Brussels Tari¤ Nomenclature (BTN). From 1988onwards, even more �nely-detailed data are available for approximately �ve thousandsix-digit products of the Harmonised System (HS).We use standard mappings between each of the trade classi�cations and the three-
digit industry classi�cation used in the delicensing measure and in our data on industrialperformance. The mappings in Debroy and Santhanam (1993) allocate each product toan individual three-digit manufacturing industry. Industry tari¤s were calculated as thearithmetic average of all products allocated to an industry.13 Our tari¤ measures have
12A full account of how the delicensing variable was coded for each three-digit industry in India isavailable in a web-based data appendix.13We take arithmetic averages rather than weighting by import shares to avoid the bias introduced
12
the attractive feature that they capture the actual tari¤ rate applied by customs o¢ cialsat the Indian border, taking into account auxiliary and countervailing duty. The tari¤data provide a direct measure of the evolving Indian trade policy regime and enable usto control for the e¤ects of trade liberalization in our regressions. In Table 1 we see howour applied tari¤ measure is high and relatively �at across the 1980-1990 period andthen falls dramatically post-1990 (starting in 1991).
4.2 Industrial Performance
We match our delicensing measure with state-industry panel data for the period 1980-1997 drawn from the Annual Survey of Industries. This is the most disaggregated levelat which one can obtain representative industrial data across the pre- and post-licensingperiods. The Annual Survey of Industries is in part a census and in part a surveyof registered manufacturing activity. Data on industry, location, inputs and outputsare collected at the factory level. Factories, as de�ned by the 1948 Factories Act, aremanufacturing establishments or plants which employ more then ten employees withelectricity or more than twenty employees without electricity. A �rm may thereforecomprise several factories. All factories with more than 100 employees are included inthe census sector. Factories with less than 100 employees form the sample sector. Thesampling unit is a state and three-digit industry, so that the data are representative atthe state-three-digit industry level. In the data made available to us, the factory-leveldata has been aggregated to the state-three-digit industry level, weighting by the inverseof the sampling probabilities (typically one third in the sample sector and one in thecensus sector) to ensure the representativeness of the data.We focus on the 16 main Indian states, which account for around 95 per cent of
the Indian population. Since we are interested in examining the relative performance ofdi¤erent states within the same three-digit industry, we restrict our attention to state-industries on which data exist for at least ten years and to industries where at least �vestates are active within the same three-digit industry in any year. This leaves us with anunbalanced panel of approximately 24,000 observations on an average of 85 three-digitindustries in the 16 states over the 18-year time period from 1980 to 1997. We also usea balanced panel data set which contains approximately 18,000 observations on state-industries that exist in all 18 years of the data. The balanced panel comprises an averageof 64 three-digit industries in the 16 states over the period 1980 to 1997. Table 1 reportsthe mean and standard deviation of real output, employment, number of factories, real�xed capital across industries and states over time for the unbalanced panel.
4.3 Labor Market Regulation
India is a federal democracy and under the Indian Constitution of 1950 industrial re-lations is a concurrent subject. This implies that central and state governments havejoint jurisdiction over labor regulation legislation. The key piece of central legislationis the Industrial Disputes Act of 1947 which sets out the conciliation, arbitration and
by endogenous import shares. With elastic demand, higher tari¤s reduce the share of a product inindustry imports.
13
adjudication procedures to be followed in the case of an industrial dispute. The Act wasdesigned to o¤er workers in the organized sector some protection against exploitationby employers. The Act is comprised of seven chapters and forty sections, specifying thepowers of government, courts and tribunals, unions and workers and the exact proce-dures that have to be followed in resolving industrial disputes.14 It has been extensivelyamended by state governments during the post-Independence period. It is these amend-ments that we use to study whether state labor market regulation mediate the impactof delicensing on manufacturing performance.We extend the coding of amendments carried out by Besley and Burgess (2004) for
the 1958 and 1992 period. The coding is based on reading all state level amendmentsto the Industrial Disputes Act of 1947 from Malik (1997). Thus although all stateshave the same starting point, they diverged from one another over time. Each amend-ment is coded as being either neutral, pro-worker or pro-employer. For the purposesof quantitative analysis, we coded each pro-worker amendment as a one, each neutralamendment as a zero, and each pro-employer amendment as a minus one. If there weremultiple amendments in a state in a year we add together the di¤erent amendmentsto give the net direction of change. Figure 2 graphs the history of regulatory changeacross states obtained using this coding procedure over the 1980-1997 period. Laborregulations exhibit signi�cant variation across states and time.This method classi�es states as either �treatment�or �control�states. The latter are
states that do not experience any amendment activity in a pro-worker or pro-employerdirection over the 1958-1997 period. In Figure 2 these are the �at line states which lieon the zero line. There are six of these: Assam, Bihar, Haryana, Jammu and Kashmir,Punjab and Uttar Pradesh. Among those that have passed amendments, our methodclassi�es six states Andhra Pradesh, Karnataka, Kerala, Madhya Pradesh, Rajasthanand Tamil Nadu as �pro-employer�. In Figure 2 these states lie below the zero line. Thisleaves four �pro-worker�states: Gujarat, Maharashtra, Orissa and West Bengal whichlie above the zero line.There is a growing body of evidence that suggest that our labor regulation measure is
capturing salient elements of the investment climate in Indian states. Besley and Burgess(2004), for example, present evidence that more pro-worker labor regulation is stronglypositively correlated with measures of industrial disputes such as work-days lost throughstrikes and lock-outs for the pre-1992 period. Sanyal and Menon (2005) demonstratethat new industrial plants in India tend to open more in pro-employer states which su¤erless from industrial disputes.As Figure 2 makes it clear there is some variation in the direction of amendments
across states during our 1980-1997 period. We can therefore examine whether thisvariation a¤ects industrial performance at the state-industry level. Our main focus ofinterest, however, is on the interaction between nationwide delicensing and state laborregulation. We look at this interaction using both the time varying labor regulation
14The seven chapters cover: (I) de�nitions; (II) authorities under this Act; (III) reference of disputesto Boards, Courts or Tribunals; (IV) procedures, powers and duties of authorities; (V) strikes andlockouts, lay-o¤ and retrenchment, unfair labour practices; (VI) penalties and (VII) miscellaneous (seeMalik, 1997).
14
measure and a simpler measure which classi�es states into pro-employer, neutral andpro-worker categories which are time invariant.
5 Empirical Analysis
5.1 Method
We run panel data di¤erence-in-di¤erence regressions of the form:
yist = �is + �t + dit + �rst + �(rst)(dit) + �z + "ist (11)
where yist is a (logged) three-digit state-industry outcome variable, dit is a dummyvariable which switches on (i.e., takes the value of unity) in the year a three-digit industryis delicensed and then stays on thereafter (see Figure 1), rst is the labor regulationmeasure measured in state s at time t (see Figure 2), z are control variables such asindustry and state time trends, �is are state-industry �xed e¤ects which control for anyunobserved time invariant determinants of net entry in a particular three-digit industryin a speci�c state (e.g. natural endowments, location), and �t are year dummies whichcontrol for common macroeconomic shocks. The variable uist is a stochastic error. Toaddress serial correlation concerns and to allow for heteroskedasticity, the standard errorsare clustered on state-three-digit industry (see Bertrand, Mullainathan and Du�o 2004).The theory presented in section 3 predicts that � should be negative, and the test of thisprediction constitutes the core of the empirical analysis.
5.2 Average Effects of Delicensing on Entry and Output
Before turning to the main analysis we examine a speci�cation without the interactionterm to see whether delicensing a¤ects entry. This is an important check as it allowsus to test whether the licensing system really acted as a barrier to entry. Columns(1) and (2) of Table 2 con�rms that this is the case for our unbalanced and balancedpanels. Delicensing is associated with an increase in the number of factories operatingin a three-digit industry. The estimated coe¢ cient on the delicensing variable is positiveand highly statistically signi�cant, implying an increase in the number of factories withinan industry of around 5-6 percent.In column (3), we split out the two waves of reforms by including separate delicensing
dummies according to whether an industry was delicensed between 1985 and 1990 orbetween 1991 and 1997. Both delicensing variables are signi�cant and of similar mag-nitude indicating that the reform waves that begun in 1985 and 1991 respectively wereboth e¤ective in encouraging entry. We �nd a similar pattern when we run the sameregression on the balanced panel in column (4). Our results are robust to the inclusionof state time trends which helps to control for unobserved time-varying state character-istics (column (5)). Including time trends for individual three-digit industries to controlfor di¤erential patterns of technological change and weighting by employment share in1980 to control for sampling errors also leaves our results una¤ected (column (6)). Wecontinue to �nd that delicensed industries experience signi�cantly more rapid growth inthe number of factories relative to industries that remain subject to licensing.
15
Table 3 carries out the same analysis for output. The evidence turns out to bemixed. We �nd no signi�cant e¤ect on output in the unbalanced (column (1)) norin the balanced sample (column (2)). However, when we separate out the 1985-1990and 1991-1997 delicensing waves (columns (3) and (4)) we see evidence that the 1985-1990 delicensing wave was associated with an increase in industrial output while the1991-1997 wave was not. We �nd an identical pattern of results for employment. Inthe speci�cations with state (column (5) and industry (column (6)) time trends wecontinue to �nd no signi�cant association between delicensing and industrial output.This suggests that additions to output and employment from entry and expansion insome state-industries is counterbalanced by contraction (and, to some degree, exit) inothers.15 The average e¤ect of delicensing on output and employment is, at best, small.We now turn our attention to the heterogeneous response of states and industries to
delicensing, which is the main focus of our analysis.
5.3 Basic Results
In column (1) of Table 4 we include both our labor regulation and delicensing measuresseparately. As before the e¤ect of delicensing remains insigni�cant. The coe¢ cient on thelabor regulation measure, however, is negative and signi�cant. Pro-worker regulationshave a negative e¤ect on registered manufacturing output. This result lines up with thestate level results in Besley and Burgess (2004) for the longer 1958-1992 period.In column (2) we include the interaction term between our labor regulation and deli-
censing measures. The coe¢ cient is negative and signi�cant. This tells us that whendelicensing occurred, state-industries in more pro-worker states experienced smaller (pos-sibly negative) increases in output than those located in pro-employer states. We �nda similar result when we run the regression on the balanced panel (column (3)). Thecoe¢ cients of the level e¤ect of delicense capture the e¤ect of the reform for states whichdid not amend the 1947 Industrial Disputes Act. For such states, as well as for thosestates which amended the Act in a pro-employer direction the reform had, on average,a positive e¤ect. However, the e¤ect was negative for all states which amended the Actin a pro-worker direction.Column (4) breaks out our delicensing measure into the 1985-1990 and 1991-1997
waves and interacts this with the our labor regulation measure in the year prior to an in-dustry being delicensed.16 We �nd that the coe¢ cients on both interactions are negativeand signi�cant (and of similar magnitude). The institutional environment prevailing ina state in the pre-delicensing year a¤ected the impact of delicensing in both the 1985and 1991 waves. This is an important result as is shows that both delicensing waves areimportant in explaining our interaction result in column (2).In column (5) of Table 4 we use the average of our labor regulation measure in each
state across the 1980-1997 period (see Figure 2) to divide the states into three groups �pro-worker states (Gujarat, Maharashtra, West Bengal) where average labor regulation
15Labor regulations and bankruptcy laws limit texit in India which helps explain why we observepositive e¤ects of delicensing on number of factories (see Fallon, 1987 and Fallon and Lucas, 1993).16Results are similar if we use the time varying labor regulation mesure interacted with dummies for
delicensing in the 1985-1990 and 1991-1997 periods.
16
score is above zero, control states (Assam, Bihar, Haryana, Jammu and Kashmir, Mad-hya Pradesh, Punjab, Uttar Pradesh) where there has been no amendments in eitherdirection since 1947 and hence the labor regulation score is zero and pro-worker states(Andhra Pradesh, Karnataka, Kerala, Rajasthan and Tamil Nadu) where the labor reg-ulation score is below zero. We interact dummies for pro-worker and pro-employer statuswith our delicensing measure leaving control states as the omitted reference category.Column (5) shows that when delicensing occurs it is the state-industries in pro-employerstates that expand output relative to those in control states. The coe¢ cient on theinteraction between pro-worker status and delicensing is of the opposite sign but is notsigni�cant.In column (6) we break our labor regulation even further dividing state into strong
pro-employer (Andhra Pradesh, Rajasthan and Tamil Nadu) de�ned as having an av-erage score over the period less than �1, moderate pro-employer (Karnataka, Kerala,Madhya Pradesh) de�ned as having a score between 0 and 1; moderate pro-worker (Gu-jarat, Orissa) de�ned as having a score between 0 and 1 and strong pro-worker (Maha-rashtra, West Bengal) de�ned as having a score greater than 1: The omitted category, asbefore, is the neutral states. We see in column (6) that strong pro-employer and strongpro-worker states move in opposite directions relative to neutral states. Both these in-teraction e¤ects are highly signi�cant but of opposite signs. The e¤ects of nationwidedelicensing are, indeed, unequal depending on the state of labor market institutions inIndian states.In column (7) we take the labor regulation score in the year prior to delicensing.
This helps to guard against our interaction e¤ect being driven by changes in labor regu-lation across time. The interaction terms remains negative and signi�cant and of similarmagnitude relative to the baseline result in column (2). This complements the analysiswhere we interacted the labor regulation score prior to delicensing for three-digit indus-tries delicensed in the 1985-1990 and 1991-1997 waves (column (4)). In column (8) weinclude political controls to control for unobserved government policies which may a¤ectoutput. These controls are the share of seats in the state legislature held by the �vemain political groupings in India: the congress parties, the hard left parties, the Janataparties, the Hindu nationalist parties and regional parties. The composition of the polit-ical groupings is discussed in further detail in the data appendix and the excluded groupis other parties. The interaction between labor regulation and delicensing continues tobe negative and signi�cant. Our result is also robust if we include interactions of ourpolitical measures with the delicense measure in the speci�cation in column (8). Thiscon�rms that it not just the political complexion of states at the point of delicensingthat is driving our results.Column (9) includes state-time trends to take account of the unobserved time varying
e¤ects of state characteristics on output. This is important as there is a whole host ofunobserved state characteristics which may a¤ect the evolution of industrial output in astate. Column (10) includes three-digit industry-time trends to control for time varyinge¤ects of industry characteristics on output and weights by employment share in 1980to control for sampling errors. Industries, for example, may experience di¤erent rates oftechnological change. In both speci�cations the interaction between labor regulation and
17
delicensing remains signi�cant indicating that our basic result in column (2) is robust tothe inclusion of such controls.17 Taken together the results in Table 4 con�rm the mainprediction of our theory that delicensing has an expansionary e¤ect in pro-employerstates relative to pro-worker states.In Table 5 we widen our set of left hand-side variables to include employment, number
of factories and �xed capital. In columns (1)-(3) we see a pattern of results for employ-ment which mirrors that for output. Moving in a pro-worker direction is associatedwith falls in employment (column (1)). When delicensing occurs being in a pro-workerstate is associated with a contraction of employment relative to being in a pro-employerstate (columns (2) and (3)). The fact that the output and employment e¤ects line upincreases our con�dence that state labor institutions are important in determining theimpact of delicensing on output.Delicensing allows �rms to enter new state-industries or expand production in exist-
ing establishments beyond what was permitted under pre-existing licenses. Firms mayalso decide to invest in new production processes and technologies to increase their pro-ductivity as a means of capturing a greater share of the market. The extent to whichthey respond through these mechanisms should depend upon the quality of the institu-tional environment in which �rms are embedded. Ceteris paribus we might expect theentry and investment response of state-industries to the same delicensing shock to bedi¤erent depending on whether they are in pro-worker or pro-employer state.Columns (4)-(9) of Table 5 investigate this possibility using number of factories and
�xed capital as proxies of investment. In Column (4) we see that moving in a pro-workerdirection is associated with a reduction in entry into a state-industry whereas delicensingis associated with an increase in entry. Delicensing and labor regulation thus pull inopposite directions. In column (5) we see that the interaction between delicensing andlabor regulation is negative and signi�cant. This tells us that when delicensing occurred,state-industries in more pro-employer states experienced larger increases in net entrythan those located in pro-worker states. In column (6) we divide states into pro-workerand pro-employer categories and interact these with our delicensing measure leavingcontrol states as the comparison group. In line with our results for output we �nd that,relative to the situation in control states, it is pro-employer states that are attractingthe bulk of new entry after delicensing occurs. This helps to explain why we see anexpansion in output in state-industries located in these states following delicensing.In columns (7)-(9) we see a similar pattern for �xed capital. Pro-worker regulation
is associated with lower state-industry investment (column (7)). When a state-industryis delicensed we see that labor institutions have the usual impact: industries in pro-employer states attract more investments than their counterparts in pro-worker stateswithin the same three-digit sector (column (8)). Relative to control states it is pro-
17The results are similar if we include three-digit industry time trends but do not weight observationsby employment shares. The estimated coe¢ cient on the interaction between delicensing and laborregulation in this case is -0.067 (s.e. 0.013). We also run a speci�cation where we include both statetrends and three digit industry-time trends. The coe¢ cient on the interaction between delicensing andlabor regulation continues to be negative and statistically signi�cant -0.033 (s.e. 0.016). In this case,however, the coe¢ cient becomes marginally insigni�cant (-0.020, s.e 0.013) when we also weight byemployment shares in 1980.
18
employer states that have bene�ted from delicensing (column (9)). The fact that entry,�xed capital and output results line up points to investment incentives di¤ering acrosspro-worker and pro-employer states when delicensing occurs. The investment resultsare important as they help uncover the mechanism as to why output (and employment)expands more in pro-employer states relative to neutral and pro-worker states when athree-digit industry is delicensed.
5.4 Magnitudes and Counterfactuals
The estimates in Table 4 can be used to quantify the impact of the dismantling of thelicense raj on industrial development across Indian states with di¤erent labor marketinstitutions. From equation (11) the level e¤ect of delicensing ( ) captures the impactof delicensing for a control state that has not amended labor regulation in either a pro-worker or pro-employer direction (rst = 0). The impact of delicensing for pro-workeror pro-employer states is found from the sum of the main e¤ect and the interactione¤ect evaluated at the value of state labor regulation ( + �rst). The percentage changein an industrial outcome due to delicensing therefore varies with state labor marketinstitutions as follows:
% impact delicensing = + �rst (12)
We can use this formula to evaluate the impact of delicensing on aggregate measuresof industrial development. To this aim, we �rst run the speci�cation from column (2) ofTable 4 and calculate, using the formula (12), a counterfactual for what the log outputlevel would have been in a state-industry had delicensing not occurred. We then takeexponents and sum across industries to evaluate the predicted impact of delicensingon total manufacturing output in each state. Figure 3 graphs the di¤erence betweenpredicted real output and this counterfactual for all Indian states. This exercise takesinto account not only the estimated impact of delicensing but also industrial structurein each of the Indian states.The largest positive e¤ects of delicensing on state output are found in Andhra
Pradesh and Tamil Nadu (and to a lower extent Karnataka, Kerala and Rajahstan)�the states with the most pro-employer labor regulations. The largest negative e¤ectsare found in West Bengal and Maharashtra � the states with most pro-worker laborregulations. For instance, in Andhra Pradesh and Tamil Nadu output in the manufac-turing sector was 15% higher in 1997 than if there had been no reform. In West Bengal,the opposite is true, output was 20% lower in 1997 than if there had been no reform.In many Indian states (for example, those with neutral labor market institutions), thee¤ects of the reforms are of negligible size, re�ecting the small magnitude of the averagedelicensing e¤ect. The results are similar for employment, number of factories and �xedcapital.18 The consequences for delicensing impact of having di¤erent types of labormarket regulations in an Indian state are thus sizeable.
18Due to the reforms, employment was 13% larger in Andra Pradesh and Tamil Nadu, and 13% lowerin West Bengal. Fixed capital was 9% larger in Andra Pradesh and Tamil Nadu, and 9% lower in WestBengal.
19
5.5 Trade Liberalization
While the main focus of our analysis is on delicensing, trade liberalization via reductionsin tari¤s was another important form of product market deregulation which took placein India during the 1990�s. We have constructed a measure of tari¤ barriers for eachthree-digit industry in India for the period 1980-1997. Tari¤s were relatively �at andin some cases increasing for the period 1980-90. Tari¤ reductions were concentratedfrom 1991 onwards and and were therefore somewhat contemporaneous with the seconddelicensing wave.In column (1) of Table 6 we �nd a positive but statistically insigni�cant average e¤ect
of tari¤s on output. This lines up with the weak e¤ects of delicensing on output that weobserve in Table 3. In column (2) of Table 6 we interact tari¤s with labor regulation:the estimated interaction coe¢ cient is positive and signi�cant. This implies that, withineach industry, tari¤ reductions led to output expansion in pro-employer states relativeto pro-worker states. This fact is con�rmed in column (3) where we interact pro-workerand pro-employer status with our tari¤ measure leaving control states as the omittedreference group. The pro-employer interaction is negative and signi�cant indicating thattari¤ reductions had a more positive e¤ect on pro-employer states relative to neutral andpro-worker states. This lines up with the results on delicensing in Table 4.In column (4) we include the interaction of labor regulation both with tari¤ and
with delicensing. The delicensing interaction remains negative and signi�cant indicat-ing robustness to controlling for trade liberalization. The magnitude of the coe¢ cientis almost una¤ected by the inclusion of the tari¤ interaction. The same is true whenwe include the time invariant measure of labor regulation in the year prior to delicens-ing (column (5)). The tari¤ interaction itself is positively signed although no longerstatistically signi�cant at conventional levels.In column (6) we break out delicensing into the 1985-1990 and 1991-1997 waves and
interact with labor regulation. Both interaction terms remain negative and signi�cantand of similar magnitude to the speci�cation in column (4) of Table 4 where tari¤s andtheir interactions with labor regulation were not included. This is a useful robustnesscheck, as the �rst delicensing wave precedes the period of tari¤ reduction, while thesecond is contemporaneous to it. The size of the coe¢ cient on the tari¤ interaction fallsbut remains signi�cant in column (5) at the 10 percent level. In summary, our delicensingresults are robust to including tari¤s and of their interaction with labor regulation.
5.6 Additional Robustness Checks
We now consider a variety of robustness checks to address two further important issues.First, we check that it is the variation over industries and time embedded in our delicensemeasure that is responsible for our results. Second, we discuss issues related to theendogeneity of the timing and sequencing of reforms.
5.6.1 Spurious Correlation
In Table 7 we undertake two falsi�cation exercises that compare the results of our base-line speci�cation in column (2) of Table 4 with �ndings from a sequence of randomly
20
generated (�placebo�) delicensing measures. The random delicensing measures were con-structed as follows. For each industry, we randomly chose a year from our time periodand imposed that random year as a hypothetical time when the industry was delicensed.Each random delicensing measure is zero before the hypothetical year of delicensingand one afterwards. Each falsi�cation exercise involved a Monte Carlo simulation thatconstructed one thousand of these random delicensing measures.The �rst falsi�cation exercise re-estimated the baseline speci�cation from column (2)
of Table 4 using each of the randomly generated delicensing measures in the place ofour baseline measure. We included both the level of the random delicensing variableand its interaction with labor regulation. We compared the statistical signi�cance ofthe interaction term between random delicensing and labor regulation in each of the onehundred regressions with the statistical signi�cance of the interaction term using ouractual delicensing measure. We also compared the overall goodness of �t of speci�cationswith random and actual delicensing as measured by the regression R2. As shown inColumn (1) of Table 7, the absolute value of the t-statistic on our actual delicensinginteraction exceeded the absolute value of the t-statistic on the random delicensinginteraction in more than 99% of the 1000 simulations. The regression R2 using our actualdelicensing measure exceeded that using the random delicensing measure in more than96% of the 1000 simulations. Both �ndings suggest that there is important informationin our actual measure of the timing and identity of industries delicensed based on theo¢ cial policy announcements of the Ministry of Industry.The second falsi�cation exercise re-estimated the baseline speci�cation from column
(2) of Table 4 including each of the randomly generated delicensing measures alongsideour baseline measure. We included both a level and interaction term with labor regu-lation for random and actual delicensing measures. As shown in column (2) of Table7, the interaction term between actual delicensing and labor regulation was statisticallysigni�cant in all 1000 simulations, while the interaction term between random delicens-ing and labor regulation was statistically signi�cant in 11% of the simulations. Theactual delicensing measure dominates random measures, though the interaction termbetween random delicensing and labor regulation is sometimes statistically signi�cant,which is not surprising given the necessary positive correlation between actual and ran-dom delicensing. Again these results provide clear evidence that the timing and identityof the industries delicensed matters for our results. Taken together, the results tightenthe link between delicensing in a particular industry and a speci�c time period and thepost-delicensing impact of labor market institutions.Column (1) of Table 8 continues in this vein. We construct a hypothetical measure of
delicensing, where we falsely assume that industries delicensed during our sample weredelicensed three years prior to their true year of delicensing. We include the hypotheti-cal measure and the interaction between the hypothetical measure and labor regulationalongside our actual measures in the speci�cation of column (2) of Table 4. The esti-mated coe¢ cient on the interaction between our actual delicensing measure and laborregulation remains of a similar size and is statistically signi�cant. The coe¢ cient on theinteraction term between the hypothetical delicensing measure and labor regulation isinsigni�cant. Again this is evidence that the delicensing measure we employ is capturing
21
salient elements of the competitive environment facing industries in Indian states.Columns (1) and (2) of Table 7 include interaction terms between labor regulation
and a post-1985 dummy and a post-1991 dummy, respectively.19 This is to control forthe possibility that our delicensing variable captures �across the board� e¤ects of the1985 and 1991 reforms (rather than those limited to the industries that were delicensed).We continue to �nd a negative and highly signi�cant coe¢ cient on the interaction termbetween delicensing and labor regulation, suggesting that it is indeed the cross-industryvariation in our delicensing measure that is responsible for our results.Finally, we checked that our �ndings are not driven by individual states. We sequen-
tially excluded each state from the sample and re-estimated our baseline speci�cation.In each case, we were unable to reject the null hypothesis that the estimated coe¢ cienton the interaction term between delicensing and labor regulation equalled the valueestimated for the full sample at the 5% level. This suggests that our results are captur-ing a general relationship between industrial performance, delicensing and labor marketinstitutions rather than the in�uence of individual states.
5.6.2 Endogeneity of Reforms
Delicensing was a centrally managed technocratic reform that was, in part, triggeredby largely unexpected shocks. The �rst wave of delicensing followed Rajiv Gandhi�ssudden rise to power in 1985 following the assassination of his mother Indira Gandhi ayear before. The second wave of delicensing followed the assassination of Rajiv Gandhiand the sudden rise to power of Narasimha Rao. Similarly, large-scale trade liberalizationdid not occur until 1991 and was again driven by the sudden rise to power of NarasimhaRao, the macroeconomic crisis, and the adoption of the IMF structural adjustmentprogramme. The concern that �rms may have acted in anticipation of economic reformsseems therefore to be of limited importance.A potentially more severe issue is the selection of industries that were delicensed
in di¤erent waves. In particular, reformers in 1985 may have not chosen industriesrandomly.20 The endogeneous sequencing would be a problem for our analysis if the se-lection criterion were correlated with the expected future performance of state-industriesat the time of the reform. We could also worry that industries were selected accordingto political criteria that would be correlated with the distribution of political poweracross states with di¤erent labor market institutions. These concerns could be properlyaddressed if it were possible to identify valid instruments, namely, variables which arecorrelated with the delicense indicator, but not directly with state-industry economicperformance trends. Unfortunately, this strategy did not appear feasible to us.We performed instead some imperfect experiments, which we report in Table 9,
aimed to show that endogeneity is unlikely to be a �rst-order issue. In column (1),we run a cross-section regression of the year in which an industry was delicensed on
19We cannot control simultaneously for the two dummy variables, as a combination of them would bealmost perfectly collinear to our delicense measure (since almost all industries were delicensed in either1985 or 1991).20The concern is less severe for the 1991 wave as this covered most of the remaining industries, and
the criterion for the exclusion of few industries was their strategic, environmental and social importance.
22
output growth during the 1980-84 period prior to the �rst wave of delicensing. We �ndno evidence of a relationship between when an industry is delicensed and pre-reformoutput growth. In column (2), we run a similar experiment for trade liberalization.We run a cross-section regression of the percentage point reduction in tari¤s between1988 and 1997 on rates of growth of output respectively during 1980-84. We �nd nocorrelation between the size of future tari¤ reductions and output growth prior to tradeliberalization. Therefore, neither of the experiments detect any evidence of systematicdi¤erences in economic performance across industries that are correlated with futuredelicensing or trade liberalization.21
In Columns (3) and (4) of Table 9, we examine whether delicensing and trade lib-eralization were in�uenced by politico-economic factors (e.g., protection for sale, asemphasized by Grossman and Helpman, 1994). Political parties have di¤erent attitudestowards economic liberalization, partly for ideological reasons and partly because of thenature of their constituency. The distribution of stakes political parties hold across states(which, if politics are persistent, is likely to be correlated with labor market institutions)may therefore have shaped the intensity of the support parties o¤ered to the delicensingof particular industries. For instance, political parties which were opposed to liberaliza-tion (e.g., because it represents the interests of either unionized workers or insider �rms)would tend to oppose particularly strongly delicensing industries that represent a largeshare of employment in states where they have large stakes.To test whether such politico-economic factors in�uenced the timing of reforms, we
exploit variation across states and over time in the political power of parties and inthe employment structure within the manufacturing sector. In particular, we constructindustry-employment weighted averages of the share of seats in state legislatures held byeach of the main political groupings in India. We then run an industry-time regression ofdelicensing on these measures. This will give us a sense of the extent to which the centraldelicensing process is a¤ected by state politics. Since elections are held approximatelyevery four years, we lag the political measures four years. We �nd no evidence ofa correlation between an industry being delicensed and industry-employment weightedstate political representation (column (3)). Column (4) shows a similar lack of correlationbetween the level of tari¤ barriers and state political representation. While these resultscannot rule out the in�uence of other politico-economic factors, they provide no evidenceof a relationship between reform and patterns of political power across states.
6 Conclusions
The question of how to encourage industrial development has been one of the holy grailsof development work. Intellectual fashions in this area have changed radically in the last�fty years. India is an emblematic case, as it began its post-independence life as theposter child for planned industrialization, and shifted more recently to a market-orientedstrategy.This paper investigates whether the e¤ects, on registered manufacturing output,
21Similar results were found using other measures of pre-reform industrial performance such as em-ployment or labor productivity growth during 1980-84.
23
employment, entry and investment, of dismantling the �license raj��a system of centralcontrols governing entry and expansion in this sector �vary across Indian states withdi¤erent labor market regulations. The punchline of the paper is contained in Figure3 �registered manufacturing fell in some states and rose in others in response to thesame delicensing reform depending on the state of labor institutions in an Indian state.Therefore, in line with our theoretical predictions we �nd that delicensing resulted ina reallocation of industrial production from states with pro-worker labor institutions tostates with pro-employer labor institutions.Our results emphasize how local institutions matter for whether industry in a region
bene�ts or is harmed by the nationwide delicensing reform. This is in line with asmall but growing trade liberalization literature which points to heterogeneous e¤ectsdepending on the local institutional setting in which liberalization takes place. The takehome message is that the focus should be squarely on the local policy and institutionalenvironment in thinking about how to encourage growth in particular regions duringperiods of economic reforms. Understanding which elements of this environment areimportant is critical to designing public policy to encourage industrialization and growthin a changing world.
24
References
[1] Acemoglu, Daron, Philippe Aghion, and Fabrizio Zilibotti (2006) �Distance to Fron-tier, Selection, and Economic Growth�, Journal of the European Economic Associ-ation, 4, 1.
[2] Aghion, Philippe, Nick Bloom, Richard Blundell, Rachel Gri¢ th and Peter Howitt(2005a) �Competition and Innovation: An Inverted-U Relationship�, QuarterlyJournal of Economics, 120(2), 701-728.
[3] Aghion, Philippe, Richard Blundell, Rachel Gri¢ th, Peter Howitt and Susan Prantl(2004) �Entry and Productivity Growth: Evidence from Microlevel Panel Data�,Journal of the European Economic Association, 2(2-3), 265-276.
[4] Aghion, Philippe, Robin Burgess, Stephen Redding and Fabrizio Zilibotti (2005b)�Entry Liberalization and Inequality in Industrial Performance�, Journal of the Eu-ropean Economic Association, 3(2-3), 291-302.
[5] Aghion, Philippe and Rachel Gri¢ th (2005) Competition and Innovation, ZeuthenLectures, MIT Press.
[6] Attanasio, Orazio, Pinelopi K. Goldberg and Nina Pavcnik (2005) �Trade Reformsand Income Inequality in Colombia�, Journal of Development Economics, forth-coming.
[7] Banerjee, Abhijit and Andrew Newman (2003) �Inequality, Growth and Trade Pol-icy�, MIT, mimeograph.
[8] Bertrand, Marianne and Francis Kramarz (2002) �Does Entry Regulation HinderJob Creation? Evidence from the French Retail Industry�, Quarterly Journal ofEconomics, 117(4), 1369-413.
[9] Bertrand, Marianne, Sendhil Mullainathan and Esther Du�o (2004) �How MuchShould we Trust Di¤erence in Di¤erences Estimates?�, Quarterly Journal of Eco-nomics, 119(1), 249-75.
[10] Besley, Timothy and Robin Burgess (2004) �Can Labor Regulation Hinder Eco-nomic Performance? Evidence from India�, Quarterly Journal of Economics, 19(1),91-134.
[11] Bhagwati, Jagdish (1963) �Monopoly in Public Enterprise�, The Working of thePublic Sector, Proceedings of the Third All-India Seminar on Public Enterprise atHyderabad.
[12] Bhagwati, Jagdish and Padma Desai (1970) India Planning for Industrialization:Industrialization and Trade Policies Since 1951, Oxford University Press: NewDehli.
25
[13] Blanchard, Olivier and Francesco Giavazzi (2000) �Macroeconomic E¤ects of Reg-ulation and Deregulation in Goods and Labor Markets�, MIT Dept. of EconomicsWorking Paper, No. 01-02.
[14] Caballero, Ricardo J. and Mohamad L. Hammour, �The Macroeconomics of Speci-�city,�Journal of Political Economy, CVI (1998), 724-767.
[15] Caballero, Ricardo J., Kevin N. Cowan, Eduardo M.R.A Engel and Alejandro Micco(2004) �E¤ective Labor Regulation and Microeconomic Flexibility�mimeo Depart-ment of Economics, MIT.
[16] Cutler, David, Ashok Lahiri and Prannoy Roy (1991) India Decides : Elections1952-1991. New Delhi : Aroom Purie for Living Media India.
[17] Chaudhary, Shri (1987) IDRA and Industrial Licensing with Rules, Forms, Noti�-cations, Press Notes, Guidelines, Policies, Bharat Law House: New Delhi.
[18] Cunat, Alejandro and Marc Melitz (2005) �Labor Market Flexibility and Compar-ative Advantage�, Harvard University, mimeograph.
[19] Debroy, B and A. T. Santhanam (1993) �Matching Trade Codes with IndustrialCodes�, Foreign Trade Bulletin, 24(1), 5-27.
[20] Djankov, Simeon, Rafael La Porta, Florencio Lopez-de-Silanes and Andrei Shleifer(2002) "The Regulation of Entry", Quarterly Journal of Economics, CXVII, 1-37.
[21] Dollar, David and Aart Kray (2001) �Trade, Growth and Poverty�, paper presentedat the World Institite for Development Economic Research, Helsinki .
[22] Dollar, David and Aart Kray (2002) �Growth is Good for the Poor�, Journal ofEconomic Growth, 7(3), 195-225
[23] Fallon, Peter (1987), �The E¤ects of Labor Regulation upon Industrial Employmentin India,�World Bank Research Department Discussion Paper No 287.
[24] Fallon, Peter and Robert E.B. Lucas (1993), �Job Security Regulations and theDynamic Demand for Labor in India and Zimbabwe�Journal of Development Eco-nomics, XL, 241-275.
[25] Frankel, Je¤rey and David Romer (1999) �Does Trade Cause Growth?�, AmericanEconomic Review, 89(3), 379-99.
[26] Goldberg, Penelopi and Nina Pavcnik (2004) �Trade, Inequality, and Poverty: WhatDo We Know? Evidence from Recent Trade Liberalization Episodes in DevelopingCountries�, Brookings Trade Forum.
[27] Government of India, Customs Tari¤ of India, New Delhi, various issues.
[28] Government of India, Economic Survey, New Delhi, various issues.
26
[29] Government of India, Handbook of Industrial Policy and Statistics, New Delhi, var-ious issues.
[30] Government of India (1948) Industrial Policy Resolution, New Delhi.
[31] Government of India (1956) Industrial Policy Resolution, New Delhi.
[32] Government of India (1980) Statement on Industrial Policy, New Delhi.
[33] Government of India (1991) Statement of Industrial Policy, New Delhi.
[34] Grossman, Gene and Elhanan Helpman (1994) �Protection for Sale�, AmericanEconomic Review, 84(4).
[35] Hanson, Gordon (2005) �Globalization, Labor Income, and Poverty in Mexico�, inAnn Harrison, ed., Globalization and Poverty, Chicago: University of Chicago Pressand the National Bureau of Economic Research, forthcoming.
[36] Harrison, Ann (2005) �Globalization and Poverty�, University of California Berke-ley, mimeograph.
[37] Hausmann, Ricardo and Dani Rodrik (2003) �Economic Development as Self-Discovery�, Journal of Development Economics, 72, 603-633.
[38] Hay, Donald (2001) �The Post-1990 Brazilian Trade Liberalization and the Perfor-mance of Large Manufacturing Firms: Productivity, Market Shares and Pro�ts�Economic Journal 111, 620-41.
[39] Hazari, Rabindra K. (1966) Industrial Planning and Licensing Policy, Interim Re-port to the Planning Commission, Bombay.
[40] Holmes, Thomas J. (1998) �The E¤ect of State Policies on the Location of Manufac-turing: Evidence from State Borders,�Journal of Political Economy, CVI, 667-705.
[41] Hsieh, Chang-Tai and Keong Woo (2005) �The Impact of Outsourcing to China onHong Kong�s Labor Market�forthcoming American Economic Review.
[42] Inoue, Kyoko (1992) �Industrial Development Policy in India�, Institute of Devel-oping Economies, IDE Occasional Papers Series, #27, Tokyo.
[43] Joshi, Vihav and Ian Little (1996) India�s Economic Reforms 1991-2001, ClarendonPress: Oxford.
[44] Krishna, Pravin and Devashish Mitra (1998) �Trade Liberalization, Market Disci-pline, and Productivity Growth: New Evidence from India�, Journal of DevelopmentEconomics, 56, 447-62.
[45] Krueger, Anne (1995) �Policy Lessons from Development Experience Since the Sec-ond World War�Chapter 40 in Behrman, J. and T.N. Srinivasan eds Handbook ofDevelopment Economics, Elsevier, Amsterdam.
27
[46] Levinsohn, James (1999) �Employment Responses to International Liberalizationin Chile,�Journal of International Economics, 47, 321-344.
[47] Malik, P. L. (1997) Industrial Law, Seventeenth Edition, Eastern Book Company:Lucknow.
[48] Marathe, Sharad S. (1986) Regulation and Development: India�s Policy Experienceof Controls over Industry, Sage Publications: New Delhi.
[49] Melitz, Marc J. (2003) �The Impact of Trade on Intra-Industry Reallocations andAggregate Industry Productivity�, Econometrica, 71, 1695-1725.
[50] Muendler, Marc-Andreas (2004), "Trade, Technology and Productivity: A Studyof Brazilian Manufacturers 1986-1998". CESifo Working Paper Series No. 1148
[51] Neary, Peter (1978) �Short-run Capital Speci�city and the Pure Theory of Interna-tional Trade�, Economic Journal, 88, 488-510.
[52] Pavcnik, Nina (2002) �Trade Liberalization, Exit, and Productivity Improvement:Evidence from Chilean Plants�, Review of Economic Studies, 69(1), 245-76.
[53] Rama, Martin (1997) �Organized Labor and the Political Economy of ProductMarket Distortions�, World Bank Economic Review, 11(2), 327-55.
[54] Rama, Martin and Guido Tabellini (1999) �Endogenous Distortions in Product andLabor Markets�World Bank Policy Research Working Paper No. 1413.
[55] Rodrik, Dani and Francisco Rodriguez (2001) �Trade Policy and Economic Growth:A Skeptic�s Guide to the Cross-National Evidence�, (eds). Ben Bernanke and Ken-neth S. Rogo¤, NBER Macroeconomics Annual, MIT Press for NBER.
[56] Rodrik, Dani and Arvind Subramanian (2004) �From "Hindu Growth" to Produc-tivity Surge: The Mystery of the Indian Growth Transition�, NBERWorking Paper10376.
[57] Rodrik, Dani, Arvind Subramanian and Francesco Trebbi (2004) �Institutions Rule:The Primacy of Institutions over Geography and Integration in Economic Develop-ment,�Journal of Economic Growth, 9(2), 131-65.
[58] Roland, Gerard (2004) �Understanding Institutional Change: Fast-Moving andSlow-Moving Institutions�, Studies in Comparative International Development,Winter.
[59] Rosenstein-Rodan, Paul (1943) �Problems of industrialization of Eastern andSoutheastern Europe.�Economic Journal, 53, 202�211.
[60] Rosenstein-Rodan, Paul (1961). Notes on the Theory of the �Big Push�. In: Ellis,H.S., Wallich, H.C. Eds. , Economic Development for Latin America. St. Martin�sPress, New York.
28
[61] Rostow, Walt W. (1952). The Process of Economic Growth. New York: Norton.
[62] Sanyal, Paroma and Menon, Nidhiya (2005) �Labor Disputes and the Economics ofFirm Geography: A Study of Domestic Investment in India�Economic Developmentand Cultural Change, 53, 825�854
[63] Sachs, Je¤rey D. and Andrew Warner (1995) �Economic Reform and the Process ofGlobal Integration�, Brookings Papers on Economic Activity, 0(1), 1-95.
[64] Stiglitz, Joseph (2002) Globalization and Its Discontents, WW Norton and Co.
[65] Sutton, John (2005) Competing in Capabilities, Clarendon Lectures in Economics,Oxford University Press.
[66] Topolova, Petia (2004) �Trade Liberalization and Firm Productivity: The Case ofIndia�, IMF Working Paper, WP/04/28.
[67] Topolova, Petia (2005) �Factor Immobility and Regional Impacts of Trade Liberal-ization: Evidence on Poverty and Inequality from India�, Yale University, mimeo-graph.
[68] Tre�er, Daniel (2004) �The Long and Short of the Canada-U.S. Free Trade Agree-ment�, American Economic Review, 94, 870-895.
[69] Tybout, James, Jaime de Melo and Vittorio Corbo (1991) �The E¤ects of TradeReforms on Scale and Technical E¢ ciency: New Evidence from Chile�, Journal ofInternational Economics, 31(3-4), 231-50.
[70] Verhoogen, Eric (2005) �Trade, Quality Upgrading andWage Inequality in the Mex-ican Manufacturing Sector: Theory and Evidence from an Exchange Rate Shock�,Columbia University, mimeograph.
[71] World Bank (2001)Globalization, Growth and Poverty: Building an Inclusive WorldEconomy, New York: Oxford University Press.
7 Data Appendix
The main source of data is the Indian Annual Survey of Industries (ASI). Our datasetcovers the 16 main Indian states that account for around 95% of the Indian popula-tion. Data on production activity in the ASI are reported at the level of three-digitmanufacturing industries by state for the period 1980-97. Number of factories is thenumber of production units employing ten or more workers with electricity, or twentyof more workers without electricity, on any day of the preceding twelve months andtherefore registered under sections 2m(i) and 2m(ii) of the Factories Act 1948. Outputis gross output, which comprises the total ex-factory value of products and by-productsmanufactured as well as other receipts such as receipts from non-industrial services andadditions to the stock of semi-�nished goods. Employment is all employees, includingproduction and non-production workers. Fixed capital is the depreciated value of �xed
29
assets that have a normal productive life of more than one year, including machinery,equipment and structures. Real output is output de�ated by industry-speci�c outputprice de�ators from the Handbook of Industrial Policy and Statistics. Real �xed cap-ital is �xed capital de�ated by the output price de�ator for Machinery and Equipmentfrom the Handbook of Industrial Policy and Statistics.The ASI data are reported according to the National Industrial Classi�cation (NIC)
1970 from 1980-88 and according to the NIC 1987 from 1989-97. Most three-digit in-dustries can be mapped one-to-one between the 1970 and 1987 classi�cations. In thosecases where a one-to-one mapping did not exist, we aggregated three-digit industries to-gether until a one-to-one mapping could be constructed. A full correspondence betweenthe 1970 and 1987 NIC classi�cations is available from the authors on request. Mis-cellaneous manufacturing industries are catch-all categories which are likely to includeheterogeneous activities in di¤erent states and therefore they are excluded from the sam-ple. The three-digit industries �Minting of Currency Coins�and �Processing of NuclearFuels�are likely to be shaped by non-economic factors and therefore these industries arealso excluded from the sample.The ASI is a census of factories above 100 employees and of factories in certain
speci�ed industries. The data on factories below 100 employees is a strati�ed sample.Some state-industries with low employment levels are observed for a small number ofyears and repeatedly enter and exit the data. We restrict attention to state-industrieson which there are data for at least 10 years. We also report results for the balancedpanel of state-industries that are observed in all eighteen years from 1980 to 1997.Our delicensing measure was constructed as follows. Appendix II of The Industries
Development and Regulation Act (IDRA) of 1951 reports a comprehensive list of the�Scheduled Industries�subject to industrial licensing (Malik 1997). We assigned three-digit codes to each of the scheduled industries listed in the Act. From the Press Noticesand Noti�cations issued by the Ministry of Commerce and Industry, we tracked the yearsin which individual scheduled industries were delicensed during the 1980s (Chaudhary1987, various issues of the Government of India�s Economic Survey, and the Handbookof Industrial Policy and Statistics 1987). In 1991 industrial licensing was disbanded inall but a small number of industries where licensing was retained �for reasons related tosecurity and strategic concerns, social reasons, problems related to safety and over-ridingenvironmental issues, manufacture of products of hazardous nature and articles of elitistconsumption.�(Government of India 1991). The Statement of Industrial Policy in 1991speci�es a list of industries where licensing was retained. Subsequent revisions to thelist of licensed industries from 1991 onwards were tracked from the Press Notices andNoti�cations published in various issues of the Handbook of Industrial Statistics. In thisway, we were able to determine the year in which each individual three-digit registeredmanufacturing industry was delicensed. Two independent codings were carried out toensure consistency. Delicense is a dummy variable which is equal to one from the yearin which all or part of a three-digit industry is delicensed and zero otherwise. A fullaccount of how the delicensing variable was coded for each three-digit industry in Indiais available in a web-based data appendix.Tari¤ rates for three-digit manufacturing industries were constructed based on actual
30
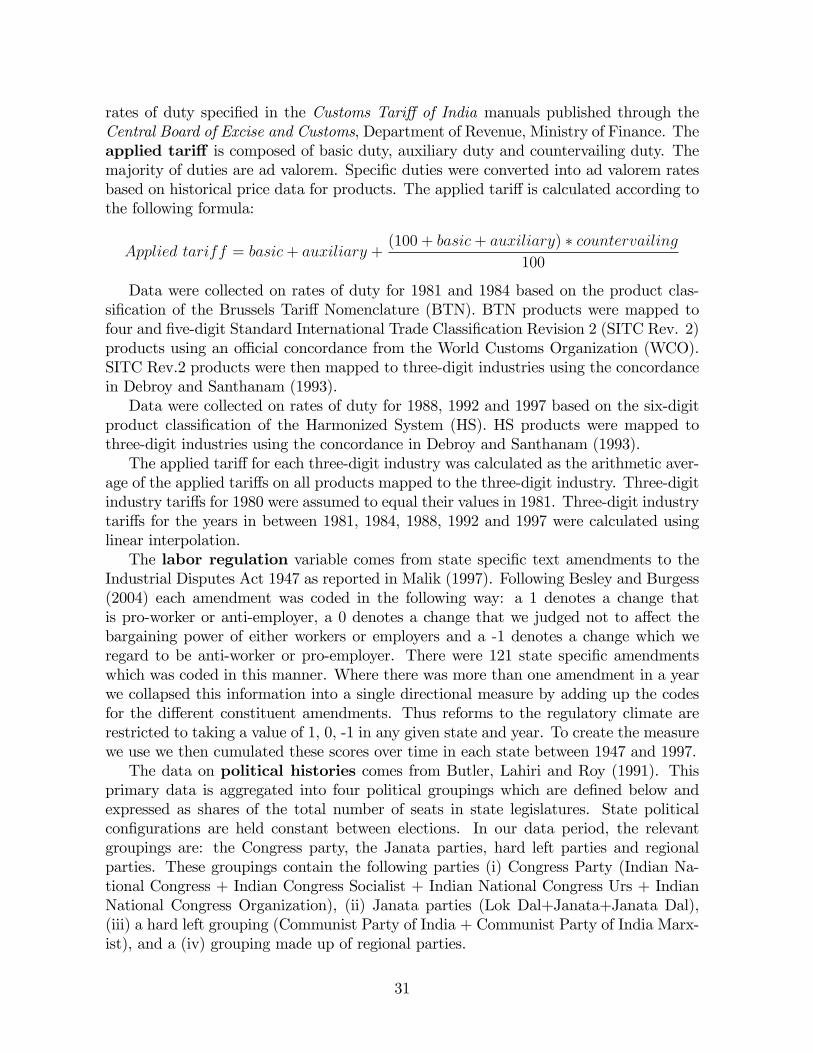
rates of duty speci�ed in the Customs Tari¤ of India manuals published through theCentral Board of Excise and Customs, Department of Revenue, Ministry of Finance. Theapplied tari¤ is composed of basic duty, auxiliary duty and countervailing duty. Themajority of duties are ad valorem. Speci�c duties were converted into ad valorem ratesbased on historical price data for products. The applied tari¤ is calculated according tothe following formula:
Applied tariff = basic+ auxiliary +(100 + basic+ auxiliary) � countervailing
100
Data were collected on rates of duty for 1981 and 1984 based on the product clas-si�cation of the Brussels Tari¤ Nomenclature (BTN). BTN products were mapped tofour and �ve-digit Standard International Trade Classi�cation Revision 2 (SITC Rev. 2)products using an o¢ cial concordance from the World Customs Organization (WCO).SITC Rev.2 products were then mapped to three-digit industries using the concordancein Debroy and Santhanam (1993).Data were collected on rates of duty for 1988, 1992 and 1997 based on the six-digit
product classi�cation of the Harmonized System (HS). HS products were mapped tothree-digit industries using the concordance in Debroy and Santhanam (1993).The applied tari¤ for each three-digit industry was calculated as the arithmetic aver-
age of the applied tari¤s on all products mapped to the three-digit industry. Three-digitindustry tari¤s for 1980 were assumed to equal their values in 1981. Three-digit industrytari¤s for the years in between 1981, 1984, 1988, 1992 and 1997 were calculated usinglinear interpolation.The labor regulation variable comes from state speci�c text amendments to the
Industrial Disputes Act 1947 as reported in Malik (1997). Following Besley and Burgess(2004) each amendment was coded in the following way: a 1 denotes a change thatis pro-worker or anti-employer, a 0 denotes a change that we judged not to a¤ect thebargaining power of either workers or employers and a -1 denotes a change which weregard to be anti-worker or pro-employer. There were 121 state speci�c amendmentswhich was coded in this manner. Where there was more than one amendment in a yearwe collapsed this information into a single directional measure by adding up the codesfor the di¤erent constituent amendments. Thus reforms to the regulatory climate arerestricted to taking a value of 1, 0, -1 in any given state and year. To create the measurewe use we then cumulated these scores over time in each state between 1947 and 1997.The data on political histories comes from Butler, Lahiri and Roy (1991). This
primary data is aggregated into four political groupings which are de�ned below andexpressed as shares of the total number of seats in state legislatures. State politicalcon�gurations are held constant between elections. In our data period, the relevantgroupings are: the Congress party, the Janata parties, hard left parties and regionalparties. These groupings contain the following parties (i) Congress Party (Indian Na-tional Congress + Indian Congress Socialist + Indian National Congress Urs + IndianNational Congress Organization), (ii) Janata parties (Lok Dal+Janata+Janata Dal),(iii) a hard left grouping (Communist Party of India + Communist Party of India Marx-ist), and a (iv) grouping made up of regional parties.
31
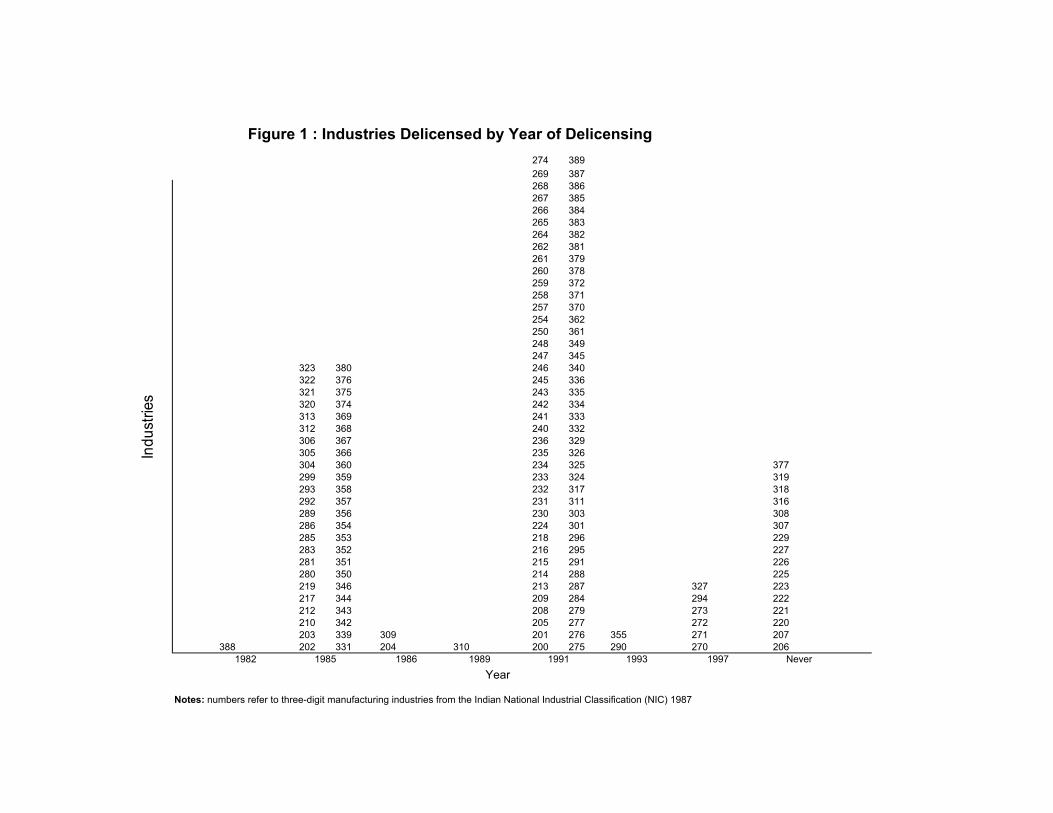
Figure 1 : Industries Delicensed by Year of Delicensing274 389269 387268 386267 385266 384265 383264 382262 381261 379260 378259 372258 371257 370254 362250 361248 349247 345
323 380 246 340322 376 245 336321 375 243 335320 374 242 334313 369 241 333312 368 240 332306 367 236 329305 366 235 326304 360 234 325 377299 359 233 324 319293 358 232 317 318292 357 231 311 316289 356 230 303 308286 354 224 301 307285 353 218 296 229283 352 216 295 227281 351 215 291 226280 350 214 288 225219 346 213 287 327 223217 344 209 284 294 222212 343 208 279 273 221210 342 205 277 272 220203 339 309 201 276 355 271 207
388 202 331 204 310 200 275 290 270 206
Year
Notes: numbers refer to three-digit manufacturing industries from the Indian National Industrial Classification (NIC) 1987
Never1993 19971982 1985 1986 19911989
Indu
strie
s
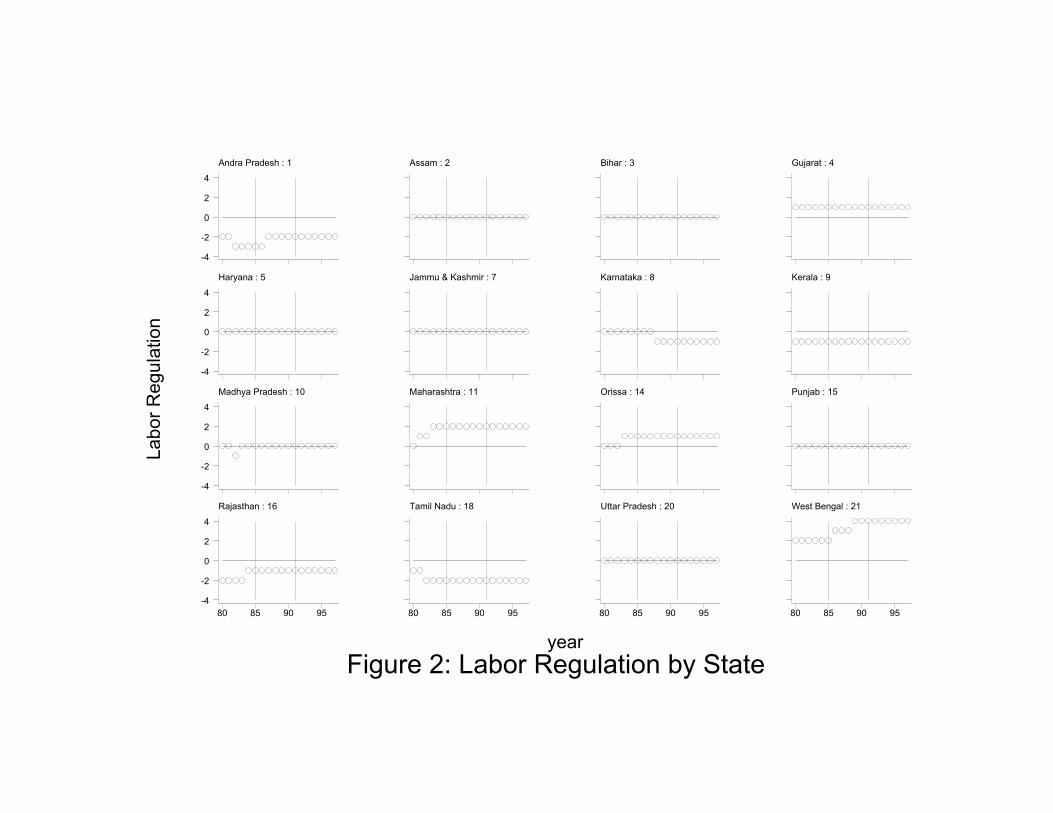
Labo
r Reg
ulat
ion
Figure 2: Labor Regulation by Stateyear
Andra Pradesh : 1
-4
-2
0
2
4
Assam : 2 Bihar : 3 Gujarat : 4
Haryana : 5
-4
-2
0
2
4
Jammu & Kashmir : 7 Karnataka : 8 Kerala : 9
Madhya Pradesh : 10
-4
-2
0
2
4
Maharashtra : 11 Orissa : 14 Punjab : 15
Rajasthan : 16
80 85 90 95-4
-2
0
2
4
Tamil Nadu : 18
80 85 90 95
Uttar Pradesh : 20
80 85 90 95
West Bengal : 21
80 85 90 95
Perc
ent (
No
Del
icen
sing
= 1
00)
Figure 3: Log Output Relative to Counterfactual Without DelicensingYear
Andra Pradesh : 1
80
90
100
110
120
Assam : 2 Bihar : 3 Gujarat : 4
Haryana : 5
80
90
100
110
120
Jammu & Kashmir : 7 Karnataka : 8 Kerala : 9
Madhya Pradesh : 10
80
90
100
110
120
Maharashtra : 11 Orissa : 14 Punjab : 15
Rajasthan : 16
1980 1985 1990 199580
90
100
110
120
Tamil Nadu : 18
1980 1985 1990 1995
Uttar Pradesh : 20
1980 1985 1990 1995
West Bengal : 21
1980 1985 1990 1995
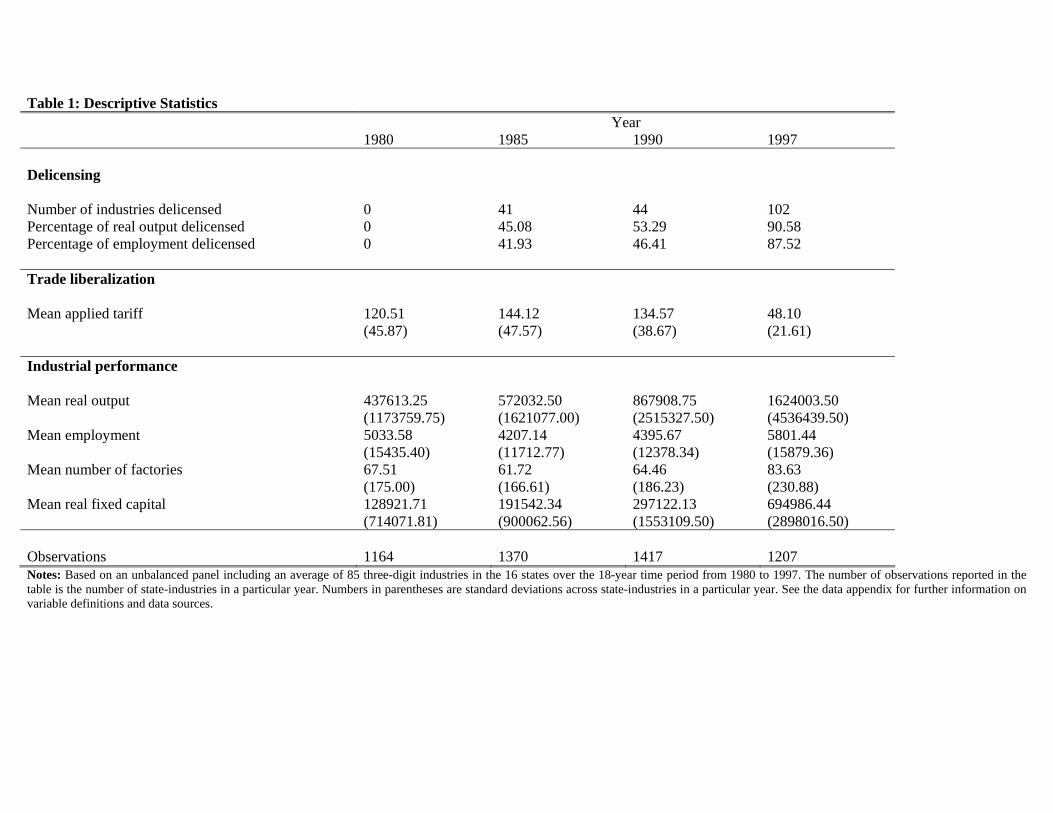
Table 1: Descriptive Statistics Year 1980 1985 1990 1997 Delicensing Number of industries delicensed 0 41 44 102 Percentage of real output delicensed 0 45.08 53.29 90.58 Percentage of employment delicensed 0 41.93 46.41 87.52 Trade liberalization Mean applied tariff 120.51 144.12 134.57 48.10 (45.87) (47.57) (38.67) (21.61) Industrial performance Mean real output 437613.25 572032.50 867908.75 1624003.50 (1173759.75) (1621077.00) (2515327.50) (4536439.50) Mean employment 5033.58 4207.14 4395.67 5801.44 (15435.40) (11712.77) (12378.34) (15879.36) Mean number of factories 67.51 61.72 64.46 83.63 (175.00) (166.61) (186.23) (230.88) Mean real fixed capital 128921.71 191542.34 297122.13 694986.44 (714071.81) (900062.56) (1553109.50) (2898016.50) Observations 1164 1370 1417 1207 Notes: Based on an unbalanced panel including an average of 85 three-digit industries in the 16 states over the 18-year time period from 1980 to 1997. The number of observations reported in the table is the number of state-industries in a particular year. Numbers in parentheses are standard deviations across state-industries in a particular year. See the data appendix for further information on variable definitions and data sources.
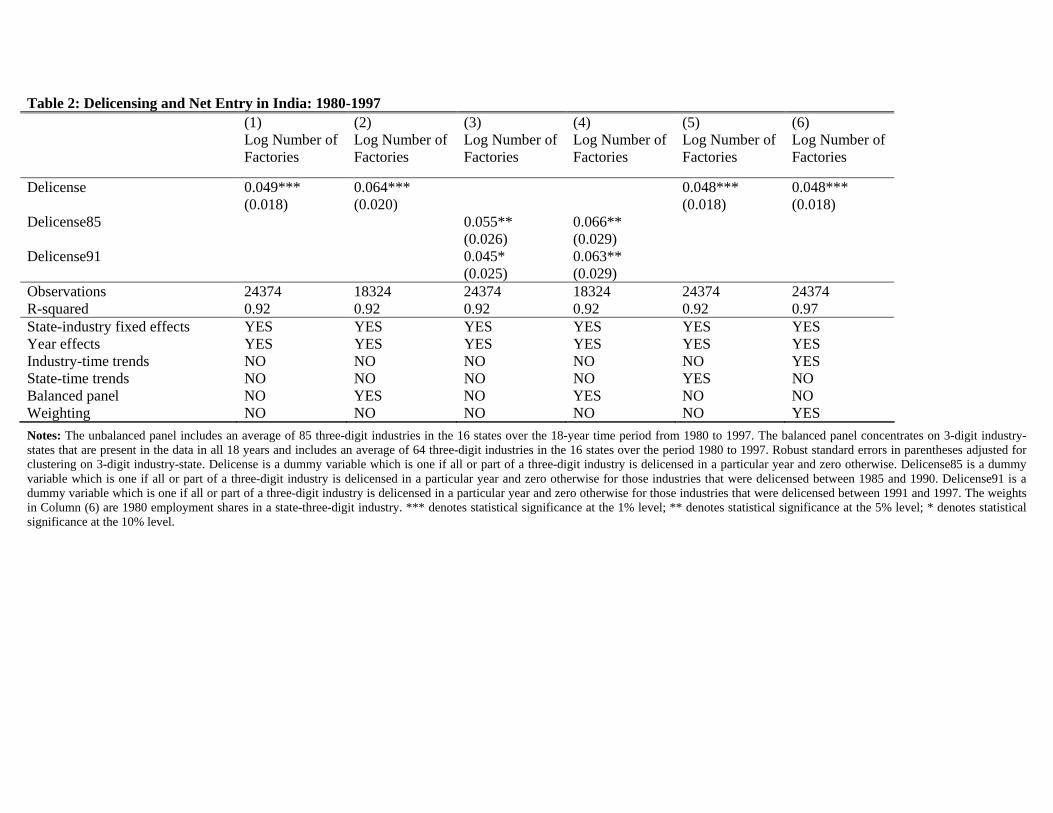
Table 2: Delicensing and Net Entry in India: 1980-1997
Notes: The unbalanced panel includes an average of 85 three-digit industries in the 16 states over the 18-year time period from 1980 to 1997. The balanced panel concentrates on 3-digit industry-states that are present in the data in all 18 years and includes an average of 64 three-digit industries in the 16 states over the period 1980 to 1997. Robust standard errors in parentheses adjusted for clustering on 3-digit industry-state. Delicense is a dummy variable which is one if all or part of a three-digit industry is delicensed in a particular year and zero otherwise. Delicense85 is a dummy variable which is one if all or part of a three-digit industry is delicensed in a particular year and zero otherwise for those industries that were delicensed between 1985 and 1990. Delicense91 is a dummy variable which is one if all or part of a three-digit industry is delicensed in a particular year and zero otherwise for those industries that were delicensed between 1991 and 1997. The weights in Column (6) are 1980 employment shares in a state-three-digit industry. *** denotes statistical significance at the 1% level; ** denotes statistical significance at the 5% level; * denotes statistical significance at the 10% level.
(1) (2) (3) (4) (5) (6) Log Number of
Factories Log Number of Factories
Log Number of Factories
Log Number of Factories
Log Number of Factories
Log Number of Factories
Delicense 0.049*** 0.064*** 0.048*** 0.048*** (0.018) (0.020) (0.018) (0.018) Delicense85 0.055** 0.066** (0.026) (0.029) Delicense91 0.045* 0.063** (0.025) (0.029) Observations 24374 18324 24374 18324 24374 24374 R-squared 0.92 0.92 0.92 0.92 0.92 0.97 State-industry fixed effects YES YES YES YES YES YES Year effects YES YES YES YES YES YES Industry-time trends NO NO NO NO NO YES State-time trends NO NO NO NO YES NO Balanced panel NO YES NO YES NO NO Weighting NO NO NO NO NO YES
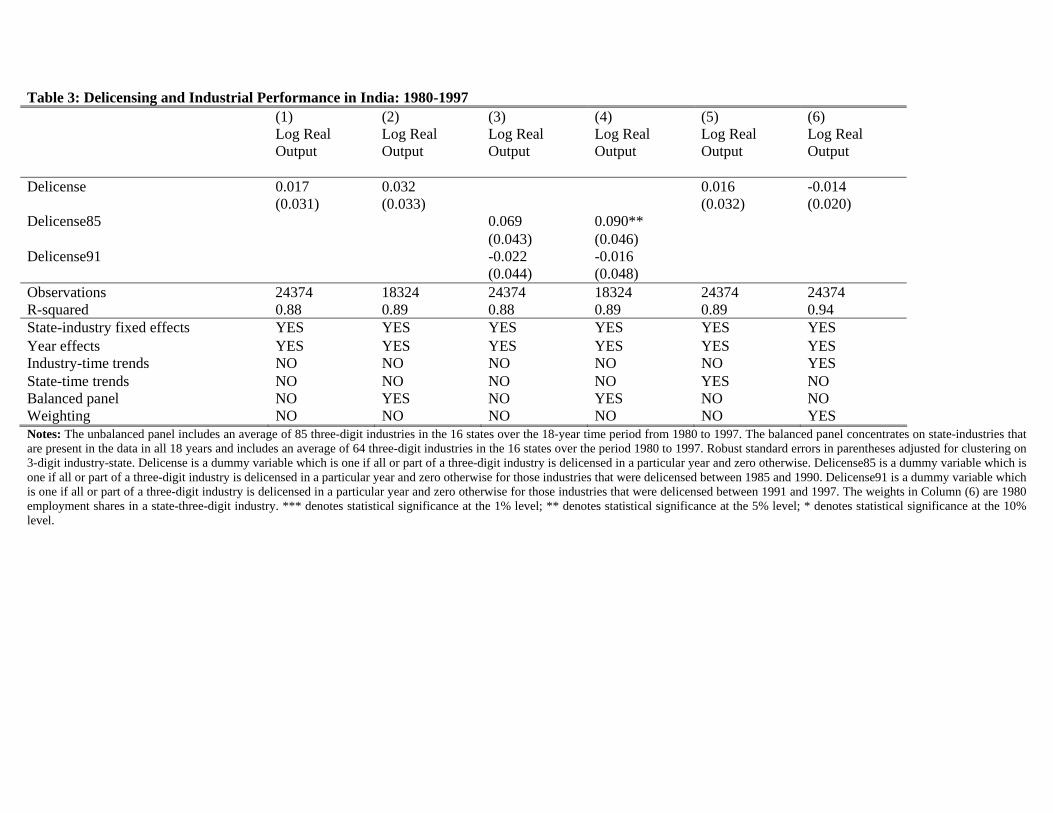
Table 3: Delicensing and Industrial Performance in India: 1980-1997 (1) (2) (3) (4) (5) (6) Log Real
Output Log Real Output
Log Real Output
Log Real Output
Log Real Output
Log Real Output
Delicense 0.017 0.032 0.016 -0.014 (0.031) (0.033) (0.032) (0.020) Delicense85 0.069 0.090** (0.043) (0.046) Delicense91 -0.022 -0.016 (0.044) (0.048) Observations 24374 18324 24374 18324 24374 24374 R-squared 0.88 0.89 0.88 0.89 0.89 0.94 State-industry fixed effects YES YES YES YES YES YES Year effects YES YES YES YES YES YES Industry-time trends NO NO NO NO NO YES State-time trends NO NO NO NO YES NO Balanced panel NO YES NO YES NO NO Weighting NO NO NO NO NO YES Notes: The unbalanced panel includes an average of 85 three-digit industries in the 16 states over the 18-year time period from 1980 to 1997. The balanced panel concentrates on state-industries that are present in the data in all 18 years and includes an average of 64 three-digit industries in the 16 states over the period 1980 to 1997. Robust standard errors in parentheses adjusted for clustering on 3-digit industry-state. Delicense is a dummy variable which is one if all or part of a three-digit industry is delicensed in a particular year and zero otherwise. Delicense85 is a dummy variable which is one if all or part of a three-digit industry is delicensed in a particular year and zero otherwise for those industries that were delicensed between 1985 and 1990. Delicense91 is a dummy variable which is one if all or part of a three-digit industry is delicensed in a particular year and zero otherwise for those industries that were delicensed between 1991 and 1997. The weights in Column (6) are 1980 employment shares in a state-three-digit industry. *** denotes statistical significance at the 1% level; ** denotes statistical significance at the 5% level; * denotes statistical significance at the 10% level.
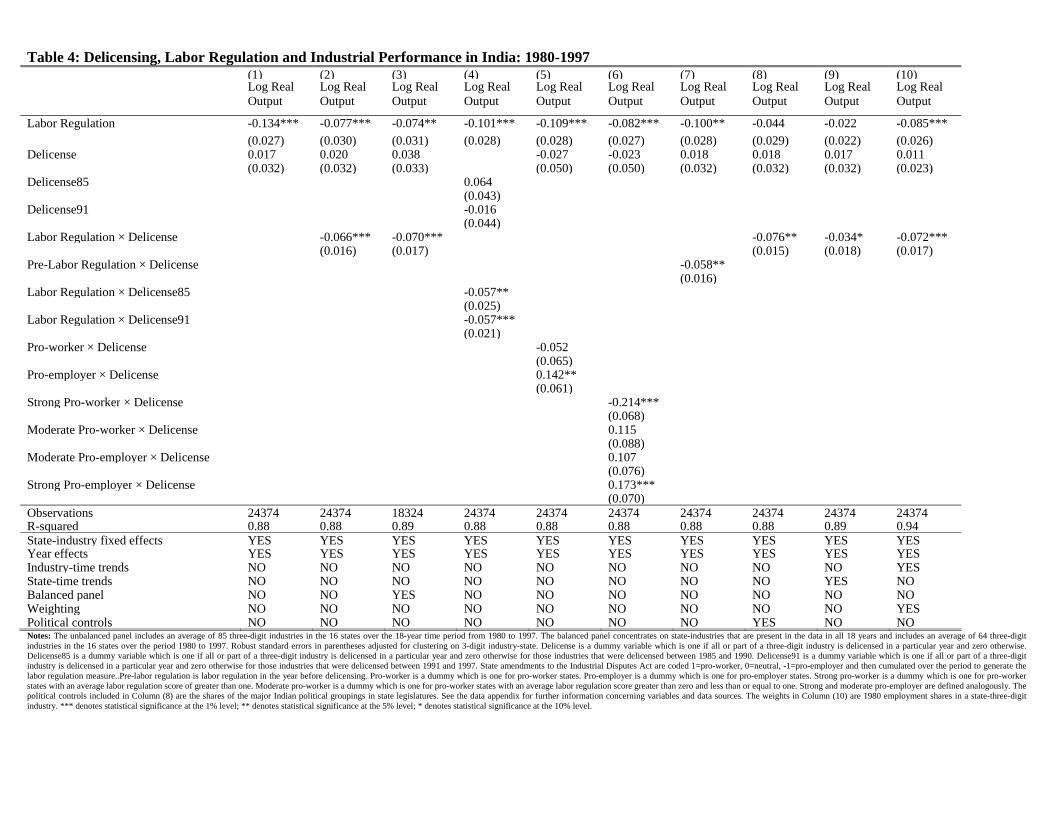
Table 4: Delicensing, Labor Regulation and Industrial Performance in India: 1980-1997 (1) (2) (3) (4) (5) (6) (7) (8) (9) (10)
Log Real Output
Log Real Output
Log Real Output
Log Real Output
Log Real Output
Log Real Output
Log Real Output
Log Real Output
Log Real Output
Log Real Output
Labor Regulation -0.134*** -0.077*** -0.074** -0.101*** -0.109*** -0.082*** -0.100** -0.044 -0.022 -0.085*** (0.027) (0.030) (0.031) (0.028) (0.028) (0.027) (0.028) (0.029) (0.022) (0.026)Delicense 0.017 0.020 0.038 -0.027 -0.023 0.018 0.018 0.017 0.011 (0.032) (0.032) (0.033) (0.050) (0.050) (0.032) (0.032) (0.032) (0.023)Delicense85 0.064 (0.043)Delicense91 -0.016 (0.044)Labor Regulation × Delicense -0.066*** -0.070*** -0.076** -0.034* -0.072*** (0.016) (0.017) (0.015) (0.018) (0.017)Pre-Labor Regulation × Delicense -0.058** (0.016)Labor Regulation × Delicense85 -0.057** (0.025)Labor Regulation × Delicense91 -0.057*** (0.021)Pro-worker × Delicense -0.052 (0.065)Pro-employer × Delicense 0.142** (0.061)Strong Pro-worker × Delicense -0.214*** (0.068) Moderate Pro-worker × Delicense 0.115 (0.088) Moderate Pro-employer × Delicense 0.107 (0.076) Strong Pro-employer × Delicense 0.173*** (0.070) Observations 24374 24374 18324 24374 24374 24374 24374 24374 24374 24374R-squared 0.88 0.88 0.89 0.88 0.88 0.88 0.88 0.88 0.89 0.94State-industry fixed effects YES YES YES YES YES YES YES YES YES YESYear effects YES YES YES YES YES YES YES YES YES YESIndustry-time trends NO NO NO NO NO NO NO NO NO YESState-time trends NO NO NO NO NO NO NO NO YES NOBalanced panel NO NO YES NO NO NO NO NO NO NOWeighting NO NO NO NO NO NO NO NO NO YESPolitical controls NO NO NO NO NO NO NO YES NO NONotes: The unbalanced panel includes an average of 85 three-digit industries in the 16 states over the 18-year time period from 1980 to 1997. The balanced panel concentrates on state-industries that are present in the data in all 18 years and includes an average of 64 three-digit industries in the 16 states over the period 1980 to 1997. Robust standard errors in parentheses adjusted for clustering on 3-digit industry-state. Delicense is a dummy variable which is one if all or part of a three-digit industry is delicensed in a particular year and zero otherwise. Delicense85 is a dummy variable which is one if all or part of a three-digit industry is delicensed in a particular year and zero otherwise for those industries that were delicensed between 1985 and 1990. Delicense91 is a dummy variable which is one if all or part of a three-digit industry is delicensed in a particular year and zero otherwise for those industries that were delicensed between 1991 and 1997. State amendments to the Industrial Disputes Act are coded 1=pro-worker, 0=neutral, -1=pro-employer and then cumulated over the period to generate the labor regulation measure..Pre-labor regulation is labor regulation in the year before delicensing. Pro-worker is a dummy which is one for pro-worker states. Pro-employer is a dummy which is one for pro-employer states. Strong pro-worker is a dummy which is one for pro-worker states with an average labor regulation score of greater than one. Moderate pro-worker is a dummy which is one for pro-worker states with an average labor regulation score greater than zero and less than or equal to one. Strong and moderate pro-employer are defined analogously. The political controls included in Column (8) are the shares of the major Indian political groupings in state legislatures. See the data appendix for further information concerning variables and data sources. The weights in Column (10) are 1980 employment shares in a state-three-digit industry. *** denotes statistical significance at the 1% level; ** denotes statistical significance at the 5% level; * denotes statistical significance at the 10% level.
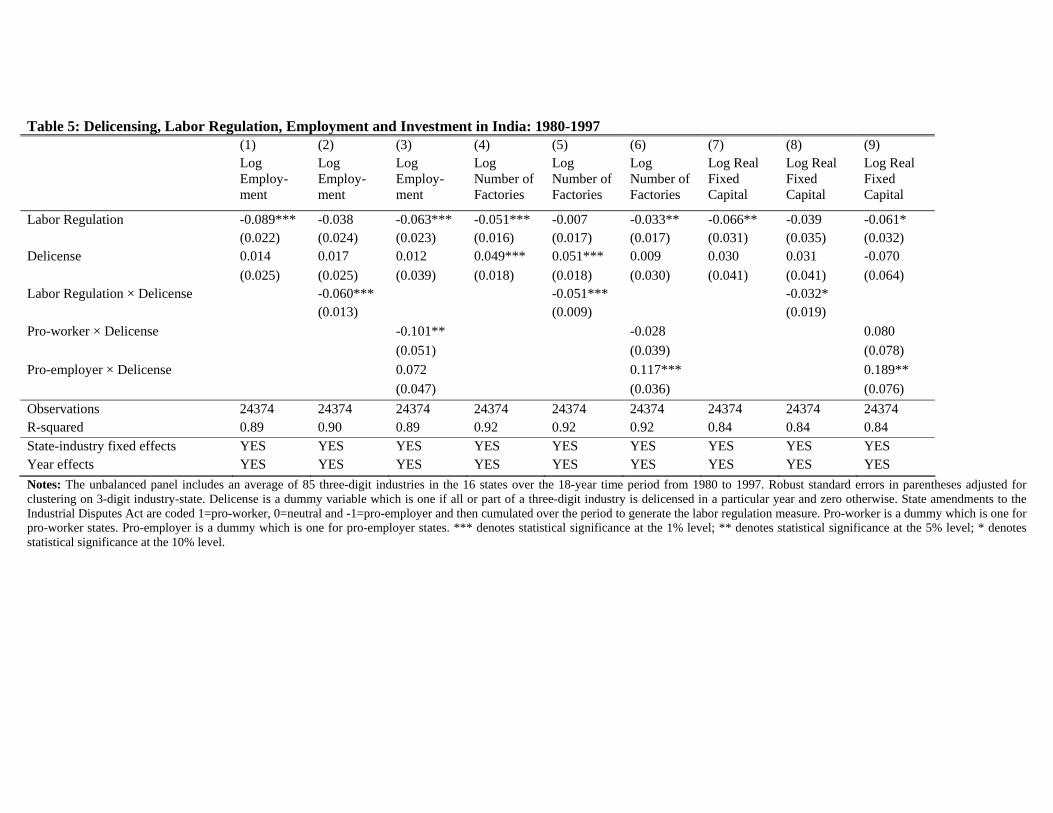
Table 5: Delicensing, Labor Regulation, Employment and Investment in India: 1980-1997 (1) (2) (3) (4) (5) (6) (7) (8) (9) Log
Employ-ment
Log Employ-ment
Log Employ-ment
Log Number of Factories
Log Number of Factories
Log Number of Factories
Log Real Fixed Capital
Log Real Fixed Capital
Log Real Fixed Capital
Labor Regulation -0.089*** -0.038 -0.063*** -0.051*** -0.007 -0.033** -0.066** -0.039 -0.061* (0.022) (0.024) (0.023) (0.016) (0.017) (0.017) (0.031) (0.035) (0.032) Delicense 0.014 0.017 0.012 0.049*** 0.051*** 0.009 0.030 0.031 -0.070 (0.025) (0.025) (0.039) (0.018) (0.018) (0.030) (0.041) (0.041) (0.064) Labor Regulation × Delicense -0.060*** -0.051*** -0.032* (0.013) (0.009) (0.019) Pro-worker × Delicense -0.101** -0.028 0.080 (0.051) (0.039) (0.078) Pro-employer × Delicense 0.072 0.117*** 0.189** (0.047) (0.036) (0.076) Observations 24374 24374 24374 24374 24374 24374 24374 24374 24374 R-squared 0.89 0.90 0.89 0.92 0.92 0.92 0.84 0.84 0.84 State-industry fixed effects YES YES YES YES YES YES YES YES YES Year effects YES YES YES YES YES YES YES YES YES Notes: The unbalanced panel includes an average of 85 three-digit industries in the 16 states over the 18-year time period from 1980 to 1997. Robust standard errors in parentheses adjusted for clustering on 3-digit industry-state. Delicense is a dummy variable which is one if all or part of a three-digit industry is delicensed in a particular year and zero otherwise. State amendments to the Industrial Disputes Act are coded 1=pro-worker, 0=neutral and -1=pro-employer and then cumulated over the period to generate the labor regulation measure. Pro-worker is a dummy which is one for pro-worker states. Pro-employer is a dummy which is one for pro-employer states. *** denotes statistical significance at the 1% level; ** denotes statistical significance at the 5% level; * denotes statistical significance at the 10% level.
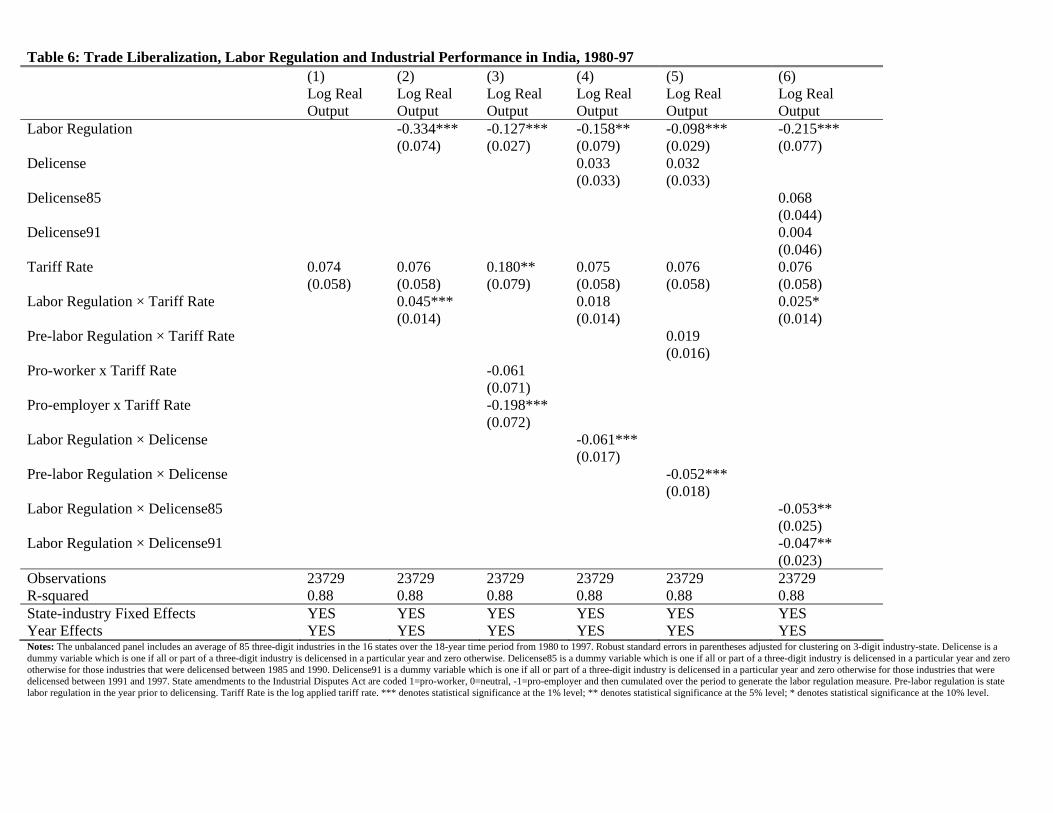
Table 6: Trade Liberalization, Labor Regulation and Industrial Performance in India, 1980-97 (1) (2) (3) (4) (5) (6) Log Real
Output Log Real Output
Log Real Output
Log Real Output
Log Real Output
Log Real Output
Labor Regulation -0.334*** -0.127*** -0.158** -0.098*** -0.215*** (0.074) (0.027) (0.079) (0.029) (0.077) Delicense 0.033 0.032 (0.033) (0.033) Delicense85 0.068 (0.044) Delicense91 0.004 (0.046) Tariff Rate 0.074 0.076 0.180** 0.075 0.076 0.076 (0.058) (0.058) (0.079) (0.058) (0.058) (0.058) Labor Regulation × Tariff Rate 0.045*** 0.018 0.025* (0.014) (0.014) (0.014) Pre-labor Regulation × Tariff Rate 0.019 (0.016) Pro-worker x Tariff Rate -0.061 (0.071) Pro-employer x Tariff Rate -0.198*** (0.072) Labor Regulation × Delicense -0.061*** (0.017) Pre-labor Regulation × Delicense -0.052*** (0.018) Labor Regulation × Delicense85 -0.053** (0.025) Labor Regulation × Delicense91 -0.047** (0.023) Observations 23729 23729 23729 23729 23729 23729 R-squared 0.88 0.88 0.88 0.88 0.88 0.88 State-industry Fixed Effects YES YES YES YES YES YES Year Effects YES YES YES YES YES YES Notes: The unbalanced panel includes an average of 85 three-digit industries in the 16 states over the 18-year time period from 1980 to 1997. Robust standard errors in parentheses adjusted for clustering on 3-digit industry-state. Delicense is a dummy variable which is one if all or part of a three-digit industry is delicensed in a particular year and zero otherwise. Delicense85 is a dummy variable which is one if all or part of a three-digit industry is delicensed in a particular year and zero otherwise for those industries that were delicensed between 1985 and 1990. Delicense91 is a dummy variable which is one if all or part of a three-digit industry is delicensed in a particular year and zero otherwise for those industries that were delicensed between 1991 and 1997. State amendments to the Industrial Disputes Act are coded 1=pro-worker, 0=neutral, -1=pro-employer and then cumulated over the period to generate the labor regulation measure. Pre-labor regulation is state labor regulation in the year prior to delicensing. Tariff Rate is the log applied tariff rate. *** denotes statistical significance at the 1% level; ** denotes statistical significance at the 5% level; * denotes statistical significance at the 10% level.
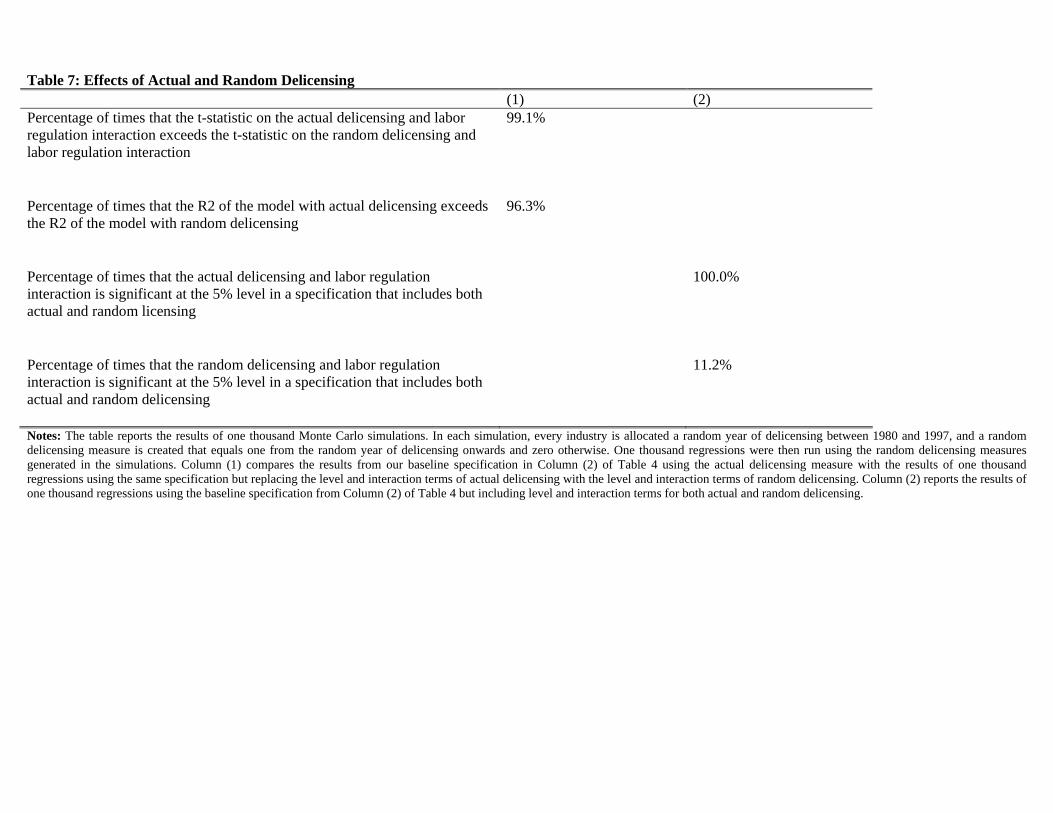
Table 7: Effects of Actual and Random Delicensing (1) (2) Percentage of times that the t-statistic on the actual delicensing and labor regulation interaction exceeds the t-statistic on the random delicensing and labor regulation interaction
99.1%
Percentage of times that the R2 of the model with actual delicensing exceeds the R2 of the model with random delicensing
96.3%
Percentage of times that the actual delicensing and labor regulation interaction is significant at the 5% level in a specification that includes both actual and random licensing
100.0%
Percentage of times that the random delicensing and labor regulation interaction is significant at the 5% level in a specification that includes both actual and random delicensing
11.2%
Notes: The table reports the results of one thousand Monte Carlo simulations. In each simulation, every industry is allocated a random year of delicensing between 1980 and 1997, and a random delicensing measure is created that equals one from the random year of delicensing onwards and zero otherwise. One thousand regressions were then run using the random delicensing measures generated in the simulations. Column (1) compares the results from our baseline specification in Column (2) of Table 4 using the actual delicensing measure with the results of one thousand regressions using the same specification but replacing the level and interaction terms of actual delicensing with the level and interaction terms of random delicensing. Column (2) reports the results of one thousand regressions using the baseline specification from Column (2) of Table 4 but including level and interaction terms for both actual and random delicensing.
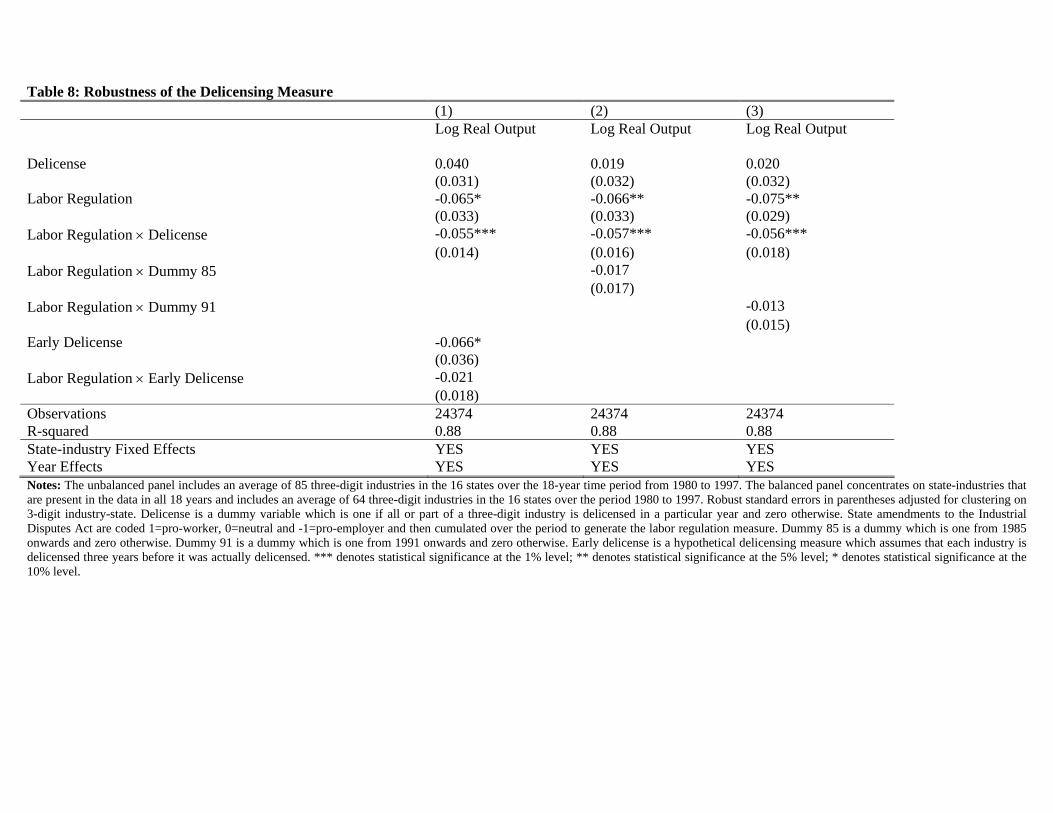
Table 8: Robustness of the Delicensing Measure (1) (2) (3) Log Real Output Log Real Output Log Real Output
Delicense 0.040 0.019 0.020 (0.031) (0.032) (0.032) Labor Regulation -0.065* -0.066** -0.075** (0.033) (0.033) (0.029) Labor Regulation × Delicense -0.055*** -0.057*** -0.056*** (0.014) (0.016) (0.018) Labor Regulation × Dummy 85 -0.017 (0.017) Labor Regulation × Dummy 91 -0.013 (0.015) Early Delicense -0.066* (0.036) Labor Regulation × Early Delicense -0.021 (0.018) Observations 24374 24374 24374 R-squared 0.88 0.88 0.88 State-industry Fixed Effects YES YES YES Year Effects YES YES YES Notes: The unbalanced panel includes an average of 85 three-digit industries in the 16 states over the 18-year time period from 1980 to 1997. The balanced panel concentrates on state-industries that are present in the data in all 18 years and includes an average of 64 three-digit industries in the 16 states over the period 1980 to 1997. Robust standard errors in parentheses adjusted for clustering on 3-digit industry-state. Delicense is a dummy variable which is one if all or part of a three-digit industry is delicensed in a particular year and zero otherwise. State amendments to the Industrial Disputes Act are coded 1=pro-worker, 0=neutral and -1=pro-employer and then cumulated over the period to generate the labor regulation measure. Dummy 85 is a dummy which is one from 1985 onwards and zero otherwise. Dummy 91 is a dummy which is one from 1991 onwards and zero otherwise. Early delicense is a hypothetical delicensing measure which assumes that each industry is delicensed three years before it was actually delicensed. *** denotes statistical significance at the 1% level; ** denotes statistical significance at the 5% level; * denotes statistical significance at the 10% level.
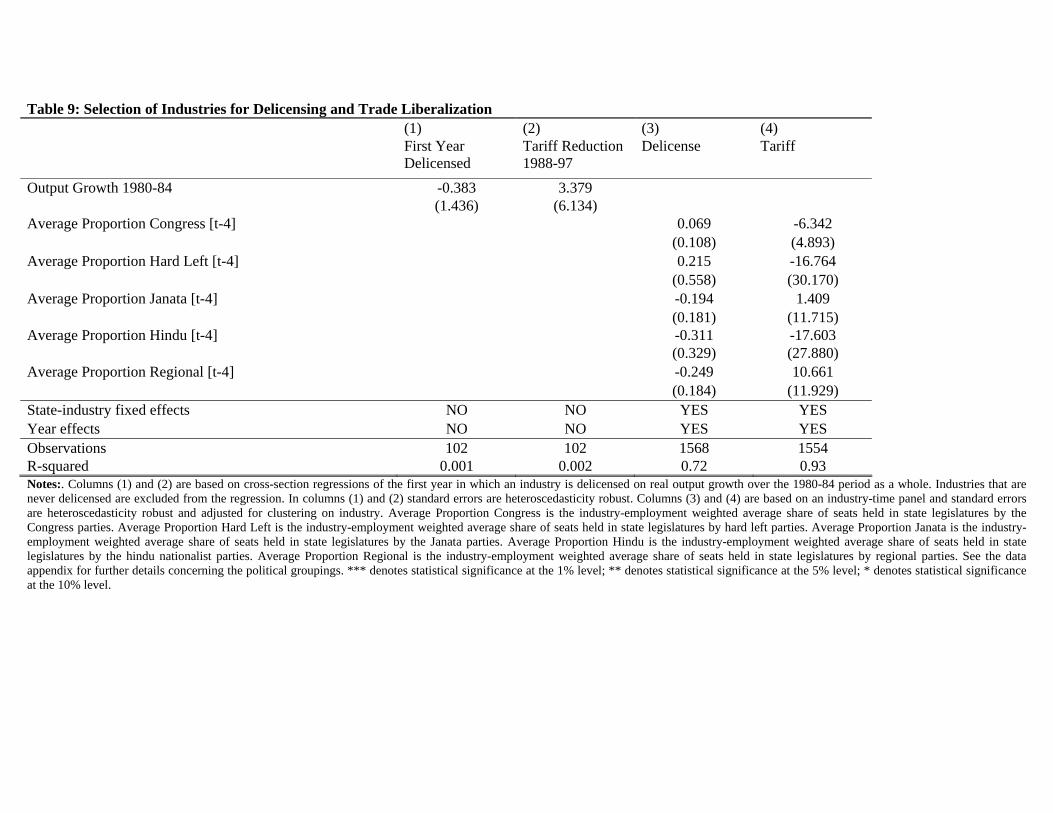
Table 9: Selection of Industries for Delicensing and Trade Liberalization (1) (2) (3) (4) First Year
Delicensed Tariff Reduction 1988-97
Delicense Tariff
Output Growth 1980-84 -0.383 3.379 (1.436) (6.134) Average Proportion Congress [t-4] 0.069 -6.342 (0.108) (4.893) Average Proportion Hard Left [t-4] 0.215 -16.764 (0.558) (30.170) Average Proportion Janata [t-4] -0.194 1.409 (0.181) (11.715) Average Proportion Hindu [t-4] -0.311 -17.603 (0.329) (27.880) Average Proportion Regional [t-4] -0.249 10.661 (0.184) (11.929) State-industry fixed effects NO NO YES YES Year effects NO NO YES YES Observations 102 102 1568 1554 R-squared 0.001 0.002 0.72 0.93 Notes:. Columns (1) and (2) are based on cross-section regressions of the first year in which an industry is delicensed on real output growth over the 1980-84 period as a whole. Industries that are never delicensed are excluded from the regression. In columns (1) and (2) standard errors are heteroscedasticity robust. Columns (3) and (4) are based on an industry-time panel and standard errors are heteroscedasticity robust and adjusted for clustering on industry. Average Proportion Congress is the industry-employment weighted average share of seats held in state legislatures by the Congress parties. Average Proportion Hard Left is the industry-employment weighted average share of seats held in state legislatures by hard left parties. Average Proportion Janata is the industry-employment weighted average share of seats held in state legislatures by the Janata parties. Average Proportion Hindu is the industry-employment weighted average share of seats held in state legislatures by the hindu nationalist parties. Average Proportion Regional is the industry-employment weighted average share of seats held in state legislatures by regional parties. See the data appendix for further details concerning the political groupings. *** denotes statistical significance at the 1% level; ** denotes statistical significance at the 5% level; * denotes statistical significance at the 10% level.