Embed Size (px)
Citation preview
IAB-DISCUSSION PAPER Articles on labour market issues
16|2020 The Unemployment Impact of the COVID-19 Shutdown Measures in Germany
Anja Bauer, Enzo Weber

The Unemployment Impact of the COVID-19 Shutdown Measures in Germany
Anja Bauer (IAB), Enzo Weber (IAB)
Mit der Reihe „IAB-Discussion Paper“ will das Forschungsinstitut der Bundesagentur für Ar-beit den Dialog mit der externen Wissenschaft intensivieren. Durch die rasche Verbreitung von Forschungsergebnissen über das Internet soll noch vor Drucklegung Kritik angeregt und Qualität gesichert werden.
The“IAB-DiscussionPaper” ispublishedby the research instituteof theGermanFederalEmploy-ment Agency in order to intensify the dialogue with the scientific community. The prompt publi-cation of the latest research results via the internet intends to stimulate criticism and to ensure research quality at an early stage before printing.

Contents
1 Introduction . . . . . . . . . . . . . . . . . . . . . . . . . . . . . . . . . . . . . . . . . . . . . . . . . . . . . . . . . . . . . . . . . . . . . . . . . . . . . . . . . . . . 6
2 Diff - in - Diff with Bite . . . . . . . . . . . . . . . . . . . . . . . . . . . . . . . . . . . . . . . . . . . . . . . . . . . . . . . . . . . . . . . . . . . . . . . . . 7
3 Inflows vs. Outflows . . . . . . . . . . . . . . . . . . . . . . . . . . . . . . . . . . . . . . . . . . . . . . . . . . . . . . . . . . . . . . . . . . . . . . . . . 10
4 Robustness . . . . . . . . . . . . . . . . . . . . . . . . . . . . . . . . . . . . . . . . . . . . . . . . . . . . . . . . . . . . . . . . . . . . . . . . . . . . . . . . . . . . 13
5 Conclusion . . . . . . . . . . . . . . . . . . . . . . . . . . . . . . . . . . . . . . . . . . . . . . . . . . . . . . . . . . . . . . . . . . . . . . . . . . . . . . . . . . . . 14 References . . . . . . . . . . . . . . . . . . . . . . . . . . . . . . . . . . . . . . . . . . . . . . . . . . . . . . . . . . . . . . . . . . . . . . . . . . . . . . . . . . . . . .15
Appendix . . . . . . . . . . . . . . . . . . . . . . . . . . . . . . . . . . . . . . . . . . . . . . . . . . . . . . . . . . . . . . . . . . . . . . . . . . . . . . . . . . . . . . . . . . 16
List of Tables
Table 1: Inflows to unemployment from employment subject to social security contri-butions . . . . . . . . . . . . . . . . . . . . . . . . . . . . . . . . . . . . . . . . . . . . . . . . . . . . . . . . . . . . . . . . . . . . . . . . . . . . . . . . . . . . 9
Table 2: Average number of days of economic closures and curfews . . . . . . . . . . . . . . . . . . . . . . . . .11 Table 3: Regression of labour market flows on closing days. . . . . . . . . . . . . . . . . . . . . . . . . . . . . . . . . . .12 Table 4: Inflows to unemployment from employment subject to social security contri-
butions . . . . . . . . . . . . . . . . . . . . . . . . . . . . . . . . . . . . . . . . . . . . . . . . . . . . . . . . . . . . . . . . . . . . . . . . . . . . . . . . . . .16
IAB-Discussion Paper 16|2020 3
Abstract
This paper evaluates the short-term labour market impact of the COVID-19 shutdown mea-sures in Germany. We take the closure of economic sectors such as restaurants and retail as a treatment, which enables difference-in-difference estimation. Additionally considering input-output linkages between the sectors, we find that 60 percent of the considerably in-creased inflows from employment into unemployment in April 2020 were due to the shut-down measures. In a second approach, we make use of the fact that sector closures and cur-fews were implemented at different times by the German state governments. In a regional re-gression setup based on treatment intensity, we find that the hiring margin accounted for ad-ditional 82 percent of the unemployment effect coming from the separations margin. In sum, the shutdown measures increased unemployment in the short run by 117,000 persons.
Zusammenfassung
Wir analysieren die kurzfristigen Arbeitsmarkteffekte der COVID-19 Shutdown-Maßnahmen in Deutschland. Mittels eines Differenzen-von-Differenzen Ansatzes, der auch die Verflech-tung der Branchen über eine Input-Output Systematik berücksichtigt, zeigen wir, dass 60 Pro-zent der zusätzlichen Zugänge in Arbeitslosigkeit aus Beschäftigung zwischen März und April 2020 durch die Shutdown-Maßnahmen erklärt werden können. In einem weiteren Ansatz nut-zen wir die zeitliche Variation in der Einführung von Branchenschließungen und Ausgangs-beschränkungen in den Bundesländern. Eine regionale Regression zeigt, dass unterlassene Einstellungen rund 82 Prozent der Wirkung vermehrter Zugänge in Arbeitslosigkeit ausma-chen und dadurch die Arbeitslosigkeit zusätzlich erhöhen. Insgesamt haben die Shutdown-Maßnahmen kurzfristig zu einer Zunahme der Arbeitslosigkeit um 117.000 Personen geführt.
JEL
J06, E24 JEL J06, JEL E24
Keywords
COVID-19, treatment effect, unemployment COVID-19, treatment effect, unemployment
IAB-Discussion Paper 16|2020 4

Acknowledgement
We thank Max Studtrucker for excellent research assisstance.
IAB-Discussion Paper 16|2020 5

1 Introduction
In spring 2020, the corona virus spread exponentially in many countries. During the second half of March, in Germany, as elsewhere, comprehensive containment measures were taken. In the public sector, for example, companies and institutions in sectors such as hotels and restaurants, retail or culture and leisure were closed. This was followed by contact restrictions and curfews. Weighing up the necessity of these steps and the economic and social damage they caused is now the subject of intense debate (compare, e.g., Baldwin 2020).
In this paper we determine the short-term effects of the shutdown measures on the labour market. Unemployment in Germany rose dramatically in April. We use detailed administra-tive data to determine the treatment effect of these measures on unemployment via difference-in-difference estimations. While the economy as a whole has been affected by the Corona crisis, in a second approach, we methodically take advantage of the fact that the contain-ment measures were implemented by the German state governments at different times and not uniformly nationwide. We differentiate between economic closures and curfews. Con-structing a comprehensive data set, the resulting regional variation in the introduction of the measures allows us to estimate the direct effects on regional unemployment flows represent-ing a higher separation rate and a lower job finding rate.
We find that 60 percent of the considerably increased inflows into unemployment in April 2020 were due to the shutdown measures. Furthermore, the hiring margin accounted for ad-ditional 82 percent of the unemployment effect coming from the separations margin. In sum, the shutdown measures increased unemployment in the short run by 117,000 persons.
The paper is structured as follows. The next section presents the difference-in-difference ap-proach. Section 3 evaluated the regional impact on separations and job findings. The last sections concludes.
IAB-Discussion Paper 16|2020 6
2 Diff - in - Diff with Bite
For our first analysis we use data for the inflow of workers from employment to unemploy-ment by regions and industries from the statistics of the Federal Employment Agency. For the industry classification we use the 2-digit level of the Germany industry classification (WZ08-Abteilung), for the regional level we choose the 16 federal states. We calculate a separation rate by using the inflows over the number of workers subject to social security contributions. The flow data is seasonally adjusted using Census X-13. Data for the stock of employment is only available with a lag of 6 months. To cancel out seasonality we use the yearly average of the number of workers from October 2018 to October 2019, which is the latest available information.
We use a difference-in-difference approach, distinguishing industries that are treated by the economic closures from the other industries. We use a special application of this approach by replacing the binary treatment by the ”bite”. We borrow this procedure from the litera-ture that is concerned with the measurement of the effects of a nationwide minimum wage on employment (see, for instance, Card(1992) or a recent application from Caliendo et al. (2018)). First, we use assumptions about the degree of closure. For instance, we assume that services in the travel sector and services in recreation and sports were closed to 100 percent. Also the automobile industry1 closed fully, however for ”Wholesale and retail trade and re-pair of motor vehicles and motorcycles” we set the closure to 50 percent, approximating the share of trade while garages were still operating. Accommodation and Food and beverage service activities offered is one industry in our classification, and, because restaurants were allowed to offer take-away service, we assume a closure of this industry of 80 percent. For wholesale and retail we assumed 40.5 percent, as groceries, pharmacies, drug stores and gas stations, which already make up 50 percent in terms of sales, were still running during lock-down and faced an increase in demand. For land transport and transport via pipelines we set the rate to 32.8 percent, which stands for the majority of passenger services. Libraries, archives, museums and other cultural activities, Creative arts and entertainment activities and Gambling and betting activities in sum are closed to 70 percent, because most of the in-dustries were closed by decree, except gambling. Other personal service activities is assumed to be closed about 58 percent which corresponds to the share of beauty treatments and hair dressers within the industry. Below 20 percent of closure was given to the industries of Ed-ucation, Public administration and defence and compulsory social security, Motion picture, video and television programme production, sound recording and music publishing activities (standing for education beyond the schooling system and cinemas).
Second, we consider the share of the gross value added affected by the closures in the indus-
While the automobile industry was not closed by decree, because of its factural shutdown we take it as treated (just as parts of transport.)
IAB-Discussion Paper 16|2020
1
7
tries that were not directly treated. The logic behind is the following: While some industries are closed per decree, others were hit by these measures through their linkages to the closed industries. To account for the full extent, we generate the change in the gross value added of every industry caused by the closures via their linkages in an input-output table. A full list of the degrees of closure and the loss in value added including input-output linkages is given in the appendix.
In the difference-in-difference regression of the separation rate, we control for a comprehen-sive set of variables which stem from the Establishment History Panel (BHP)(see Ganzer et al. (2020) for a full description of the data set). The BHP is a cross sectional dataset that con-tains all the establishments in Germany which are covered by the IAB Employment History (BeH) 2 and have at least one employee liable to social security. We use the BHP to add infor-mation on the average share of certain worker groups in the establishments operating in the industries in the regions, information about the average wage structure and the age of the es-tablishments. Furthermore, we control for the infection rate at the 13th of March. We choose this date as reference date because the inflows are counted between the 13th of March and the 14th of April. To account for differences in the regions (e.g. differences in unemployment) we include a set of region dummies. To account for differences in industries (e.g. export de-pendency), we include dummies on the 1-digit industry code.
Our estimation equation reads as follows:
𝑠𝑖𝑗𝑡 = 𝛾1𝐴𝑝𝑟𝑖𝑙𝑡 + 𝛾2𝐶𝑙𝑜𝑠𝑒𝑖 + 𝛾3𝐴𝑝𝑟𝑖𝑙𝑡 × 𝐶𝑙𝑜𝑠𝑒𝑖 + 𝛽𝑋𝑖𝑗 + 𝑢𝑖𝑗𝑡, (2.1)
where 𝑠𝑖𝑗𝑡 hold the separation rates in region 𝑖, industry 𝑗 and time 𝑡 (March, April 2020). 𝐴𝑝𝑟𝑖𝑙 is a time dummy that takes on the value of 1 in April 2020. As first closure measures came into force on March 13th, and the inflows in April are measured between 13th of March and 14th of April, the time dummy measures the post treatment time span. 𝐶𝑙𝑜𝑠𝑒 is bounded between 0 and −1, showing the degree of industry value added affected by the closures. The treatment effect is given by the interaction term of 𝐴𝑝𝑟𝑖𝑙 and 𝐶𝑙𝑜𝑠𝑒 with coefficient 𝛾3. This interaction measures the treatment effect because of the closure measures due to COVID-19. 𝑋 holds the control variables with coefficient vector 𝛽, and 𝑢𝑖𝑗𝑡 is an industry-and region-specific error term.
Table 1 shows the effects of interest. The closure measure increased the inflow into unem-ployment out of employment by 0.0075 percentage points. Expressed differently, a back of the envelope calculation, where we multiply the coefficient by the drop in output and weight
For more information follow this link.
IAB-Discussion Paper 16|2020
2
8

this expression with the number of employees subject to social security in the industry sec-tors, shows that the closure measures increased the unemployment inflow by about 53,000 people. In our data, this stands for 60 percent of the increase of inflows into unemployment in April 2020.
The additional inflows from all industries sum to 88,000 in our data. This is a bit lower than the overall number from the statistics of the Federal Employment Agency of 107,000 due to missings in industry classification codes. When we scale our number accordingly under the assumption that the missings are random, we arrive at an unemployment inflow due to the closures of 64,000.
Table 1: Inflows to unemployment from employment subject to social security contributions Inflow rate
treatment -0.0007262 (-9.82)
time 0.0007261 (7.00)
time × treatment -0.0075246 (-25.70)
Note: T-values in parentheses. Source: Statistics of the Federal Employment History; Establishment History Panel 2018, own calculations. ©IAB
IAB-Discussion Paper 16|2020 9
3 Inflows vs. Outflows
Due to data limitations, by industry we only can observe the inflows into unemployment but not the outflows from unemployment. However, we are interested to which extent the two channels, namely separations and job findings, contribute to the rise in the unemployment stock. In order to analyse this question, we forgo the industry division and take a deeper look at these two channels using regional variation. As dependent variables we use the flows between employment and unemployment for the 156 Employment Agency districts. We con-sider the change in the seasonally adjusted separation rate (inflows into unemployment from the 1st labour market divided by the stock of employment subject to social security contribu-tions) and job finding rate (outflows from unemployment into the 1st labour market divided by the stock of unemployment) from March to April 2020. Again, the change in these two vari-ables is measured by taking stocks at the 12𝑡ℎ March to 14𝑡ℎ April, i.e. including the entire period of time of containment measures coming into force.
The flows show the labour market channels behind the unemployment increase, i.e. separa-tions and new hires. As an additional advantage, they are not affected by special effects on the stock of unemployed: E.g., unemployment considerably increased in April due to excep-tionally low outflows of unemployed to labour market policy measures.
As explanatory variables we use the number of days of economic closures in the sectors of public life and the number of days of curfews in the above-mentioned period. These were de-termined in the course of comprehensive research and compiled in a data set (Bauer/Weber 2020). Since all measures lasted at least until mid-April, the number of days reflect how early the measures came into force regionally. At the level of the Employment Agency districts, usually it is the decisions of the respective federal states that are relevant. However, there are also certain special measures in some districts. The data on industry closures were re-searched for the sectors of retail, accommodation, restaurants, bars / clubs, cinemas, trade fairs / events, other education, art / entertainment / recreation and hairdressers / cosmetics, and combined into one closure variable per district by averaging.
Considering the 156 districts, there are on average 26.7 closing days, with a standard devia-tion of 0.8. The average for the days of curfews is 21.1 days, with a standard deviation of 0.9. Table 1 shows the two variables aggregated at the level of the federal states.
We control several characteristics of the districts. The industry composition is taken into ac-count via the proportions of employees subject to social security contributions according to the Germany industry classification on a 2-digit level (WZ08-Abteilung) with the most recent available status as of October 2019. The unemployment rate in March 2020 and its change since March 2019 reflect the regional labour market situation. Finally, the corona virus infec-
IAB-Discussion Paper 16|2020 10

Table 2: Average number of days of economic closures and curfews
Federal State Closure of economic sectors Curfews
Baden Wuerttemberg 27 22 Bavaria 27 22 Berlin 28 21 Brandenburg 25 21 Bremen 26 20 Hamburg 28 21 Hesse 26 21 Mecklenburg-Western Pomerania 26 21 Lower Saxony 28 20 North Rhine-Westphalia 27 21 Rhineland-Palatinate 26 20 Saarland 26 22 Saxony 25 21 Saxony-Anhalt 26 21 Schleswig-Holstein 29 21 Thuringia 26 19
Note: Table 2 shows the average of the days measured up to the cut-off date (14 April 2020) across the agency districts in one federal state.It was rounded to full days. Source: own calculations. ©IAB
tion rate is controlled by the confirmed infection cases per inhabitant from the Robert Koch-Institute directly before the first closures on 13 March.
The results of the regression are shown in Table 3. The variable of economic closures has an effect of +0.022 on the separation rate, which means that one more closing day represents a regional separation rate that is 0.022 percentage points higher. Extrapolated to the stock of employment subject to social insurance contributions in Germany, this would affect 7,400 persons. The curfews variable has an effect of +0.023. Here one day stands for a 0.023 per-centage points higher separation rate, or 7,800 persons extrapolated nationwide.
On the job finding rate, the variable of economic closures has an effect of -0.192, i.e. one clos-ing day leads to a 0.192 percentage point lower job finding rate. Recall that this rate is cal-culated on basis of the stock of unemployment and not as the separation rate, on the stock of employment. Logically, we extrapolate to the stock of unemployment for Germany. Then, 4,400 people would be affected. One additional day of curfews reduces the exit rate by 0.354 percentage points, or 8,100 people extrapolated nationwide.
It should be noted that the estimates determine the effects of one more day of closures/curfews compared to the other regions. It does therefore not represent an absolute effect that could be extended to any number of days, for instance until the end of the month. All taken to-gether, additional days of economic closure and curfews have effects of a similar magnitude. Both channels operating via separations and new hires are affected. Sector closures and cur-fews taken together, the loss of new hires stands for an unemployment effect of an additional
IAB-Discussion Paper 16|2020 11
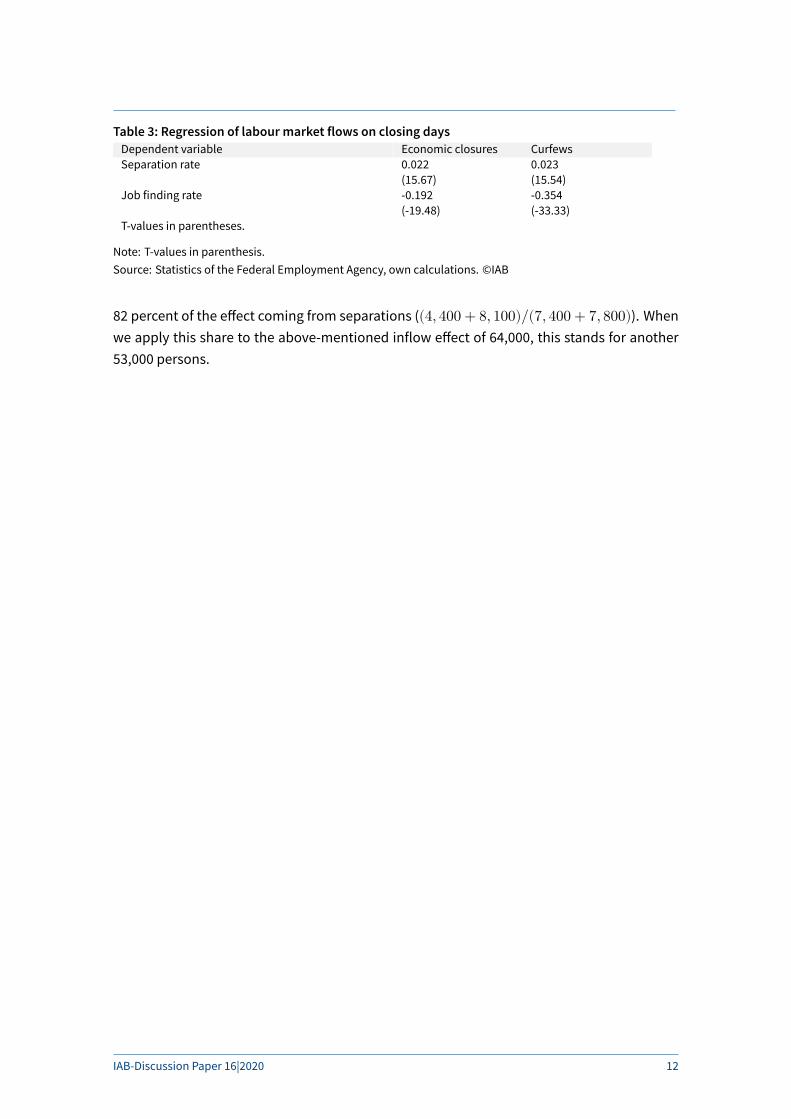
Table 3: Regression of labour market flows on closing days Dependent variable Economic closures Curfews Separation rate 0.022 0.023
(15.67) (15.54) Job finding rate -0.192 -0.354
(-19.48) (-33.33) T-values in parentheses.
Note: T-values in parenthesis. Source: Statistics of the Federal Employment Agency, own calculations. ©IAB
82 percent of the effect coming from separations ((4, 400 + 8, 100)/(7, 400 + 7, 800)). When we apply this share to the above-mentioned inflow effect of 64,000, this stands for another 53,000 persons.
IAB-Discussion Paper 16|2020 12
4 Robustness
Given the currentness of data, we cannot employ extensive robustness checks. However, note that we also performed classical diff-in-diff estimations with a binary treatment indi-cator, that takes on the value one, if the degree of closure is above 0 (see appendix). This regression also delivers statistically significant results. However, also this classical approach could potentially suffer from violations of the assumptions.
In further research we want to shed more light on the channel of hiring with data that allow to analyse effects on the hiring rate in regional and industrial dimensions. Furthermore we want to explore variations in the treatment effect by altering our bite measure. We acknowledge that, up to now, our bite measure is dependent on the assumption we make about the degree of closure which stems from a bundle of information. The measure could be refined, when information on losses between March and April is available. Also, our second approach would benefit from information on the completed length of closure within the districts. We think this is promising, as the government just recently decided to peg containment measures to infection rates, which implies that there will be much more variation in the days of closure within districts.
IAB-Discussion Paper 16|2020 13

5 Conclusion
We evaluate the short-term labour market impact of the COVID-19 shutdown measures in Ger-many. We take the closure of economic sectors such as restaurants and retail as a treatment, which enables difference-in-difference estimation. Additionally considering input-output link-ages between the sectors, we find that 60 percent of the considerably increased inflow into unemployment in April 2020 was due to the shutdown measures. This stands for 64,000 per-sons.
In a second approach, we make use of the fact that sector closures and curfews were imple-mented at different times by the German state governments. In a regional regression setup based on treatment intensity, we find that the hiring margin accounted for additional 82 per-cent of the unemployment effect coming from the separations margin. This stands for an-other 53,000 persons. Evidently, saving existing jobs e.g. via short-time work is not enough to prevent a severe labour market drop (Merkl/Weber 2020). In sum, the shutdown measures increased unemployment in the short run by 117,000 persons.
When assessing these results, two points should be kept in mind: First, the available data measure effects up to mid-April. However, later effects cannot be ruled out either, for ex-ample with regard to notice periods. Secondly, we consider immediate effects. Without the measures, however, the uncontrolled spread of the virus could possibly have caused much greater damage in the medium term.
Nevertheless, the presented results underline that within the framework of an opening strat-egy all possibilities must be explored on how the reactivation of economic activity can be made possible with a sufficient containment of the virus. The effects of these opening steps should be examined empirically on the basis of different regional configurations in order to collect evidence for the optimisation of further proceedings.
IAB-Discussion Paper 16|2020 14
References
Baldwin, Richard (2020): COVID, remobilisation and the ’stringency possibility corridor’: Creat-ing wealth while protecting health. VoxEU.org, 10 April.
Bauer, Anja; Weber, Enzo (2020): Die Arbeitsmarktwirkungen der Corona-Eindämmungsmaß-nahmen. Makronom, 4 May.
Caliendo, Marco; Fedorets, Alexandra; Preuss, Malte;Schröder, Carsten; Wittbrodt, Linda (2018): The short-run employment effects of the German minimum wage reform. Labour Eco-nomics, Volume 53, p. 46-62.
Card, David (1992): Using regional variation in wages to measure the effects of the federal min-imumwage. Industrial and Labor Relations Review,46(1), p. 22-37.
Ganzer, Andreas; Schmidtlein, Lisa; Stegmaier,Jens; Wolter, Stefanie (2020): Establishment His-tory Panel 1975-2018. FDZ-Datenreport, 01/2020 (en), Nuremberg. DOI: 10.5164/IAB.FDZD.2001.en.v1
Merkl, Christian; Weber, Enzo (2020): Rescuing the labour market in times of COVID-19: Don’t forget new hires. VoxEU.org, 7 April.
IAB-Discussion Paper 16|2020 15
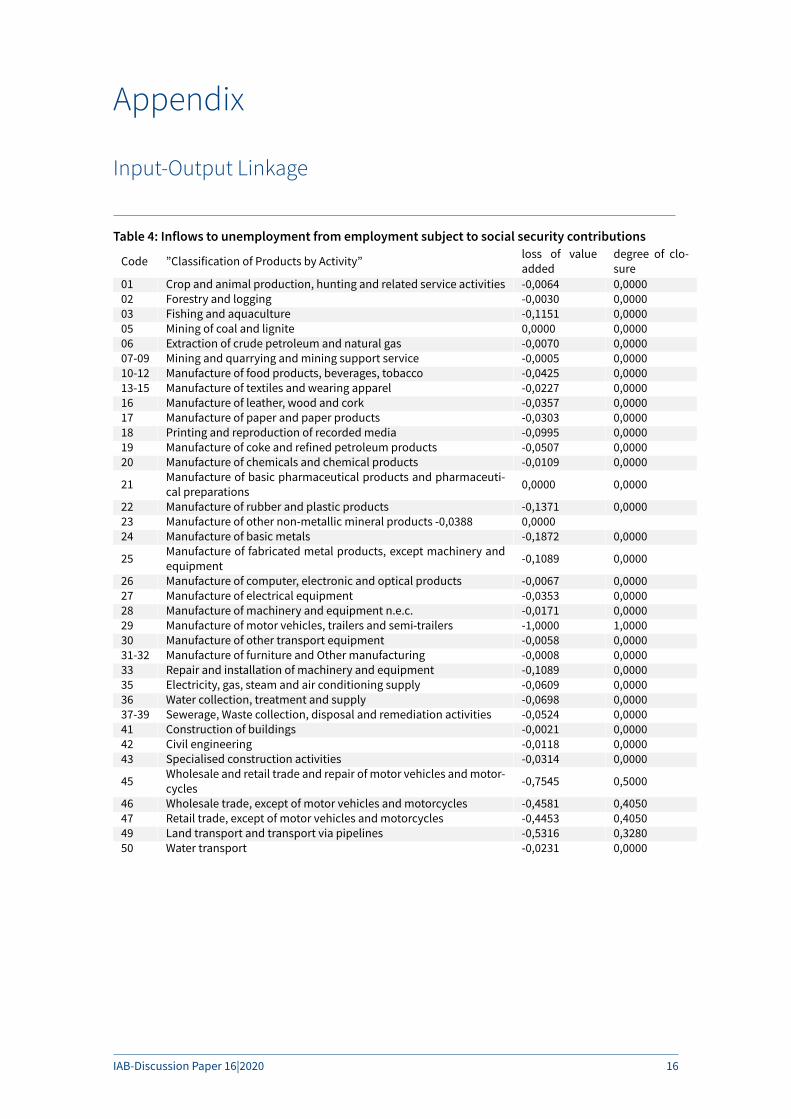
Appendix
Input-Output Linkage
Table 4: Inflows to unemployment from employment subject to social security contributions
Code ”Classification of Products by Activity” loss of value added
degree of clo-sure
01 Crop and animal production, hunting and related service activities -0,0064 0,0000 02 Forestry and logging -0,0030 0,0000 03 Fishing and aquaculture -0,1151 0,0000 05 Mining of coal and lignite 0,0000 0,0000 06 Extraction of crude petroleum and natural gas -0,0070 0,0000 07-09 Mining and quarrying and mining support service -0,0005 0,0000 10-12 Manufacture of food products, beverages, tobacco -0,0425 0,0000 13-15 Manufacture of textiles and wearing apparel -0,0227 0,0000 16 Manufacture of leather, wood and cork -0,0357 0,0000 17 Manufacture of paper and paper products -0,0303 0,0000 18 Printing and reproduction of recorded media -0,0995 0,0000 19 Manufacture of coke and refined petroleum products -0,0507 0,0000 20 Manufacture of chemicals and chemical products -0,0109 0,0000
21 Manufacture of basic pharmaceutical products and pharmaceuti-cal preparations 0,0000 0,0000
22 Manufacture of rubber and plastic products -0,1371 0,0000 23 Manufacture of other non-metallic mineral products -0,0388 0,0000 24 Manufacture of basic metals -0,1872 0,0000
25 Manufacture of fabricated metal products, except machinery and equipment -0,1089 0,0000
26 Manufacture of computer, electronic and optical products -0,0067 0,0000 27 Manufacture of electrical equipment -0,0353 0,0000 28 Manufacture of machinery and equipment n.e.c. -0,0171 0,0000 29 Manufacture of motor vehicles, trailers and semi-trailers -1,0000 1,0000 30 Manufacture of other transport equipment -0,0058 0,0000 31-32 Manufacture of furniture and Other manufacturing -0,0008 0,0000 33 Repair and installation of machinery and equipment -0,1089 0,0000 35 Electricity, gas, steam and air conditioning supply -0,0609 0,0000 36 Water collection, treatment and supply -0,0698 0,0000 37-39 Sewerage, Waste collection, disposal and remediation activities -0,0524 0,0000 41 Construction of buildings -0,0021 0,0000 42 Civil engineering -0,0118 0,0000 43 Specialised construction activities -0,0314 0,0000
45 Wholesale and retail trade and repair of motor vehicles and motor-cycles -0,7545 0,5000
46 Wholesale trade, except of motor vehicles and motorcycles -0,4581 0,4050 47 Retail trade, except of motor vehicles and motorcycles -0,4453 0,4050 49 Land transport and transport via pipelines -0,5316 0,3280 50 Water transport -0,0231 0,0000
IAB-Discussion Paper 16|2020 16

Code ”Classification of Products by Activity” loss of value added
degree of clo-sure
51 Air transport -0,9222 0,7500 52 Warehousing and support activities for transportation -0,6988 0,5000 53 Postal and courier activities -0,2115 0,0000 55-56 Accommodation and Food and beverage service activities -0,8231 0,8000 58 Publishing activities -0,0503 0,0000
59-60 Motion picture, video and television programme production and Programming and broadcasting activities -0,0249 1,0000
61 Telecommunications -0,0643 0,0000
62-63 Computer programming, consultancy and related activities and In-formation service activities -0,0528 0,0000
64 Financial service activities, except insurance and pension funding -0,0493 0,0000
65 Insurance, reinsurance and pension funding, except compulsory social security -0,0471 0,0000
66 Activities auxiliary to financial services and insurance activities 0,0000 0,0000 68 Real estate activities -0,0580 0,0000
69-70 Legal and accounting activities and Activities of head offices; man-agement consultancy activities -0,0711 0,0000
71 Architectural and engineering activities; technical testing and anal-ysis -0,0457 0,0000
72 Scientific research and development 0,0000 0,0000 73 Advertising and market research -0,1372 0,0000
74-75 Other professional, scientific and technical activities and Veteri-nary activities -0,0790 0,0000
77 Rental and leasing activities -0,0913 0,0000 78 Employment activities -0,1606 0,0000
79 Travel agency, tour operator and other reservation service and re-lated activities -1,0000 1,0000
80-82 Security and investigation, Services to buildings and landscape, of-fice support and other business support activities -0, 7670 0,1600
84 Public administration and defence; compulsory social security -0,0114 0,0000 85 Education -0,1399 0,1300 86 Human health activities -0,0012 0,0000
87-88 Residential care activities and Social work activities without ac-commodation 0,0000 0,0000
90-92 Entertainment activities, Libraries, archives, museums and Gam-bling -0,7180 0,7000
93 Sports activities and amusement and recreation activities -1,0000 1,0000 94 Activities of membership organisations -0,0335 0,0000 95 Repair of computers and personal and household goods -0,0861 0,0000 96 Other personal service activities -0,5967 0,5800
97-98 Activities of households, goods- and services-producing activities of private households for own use 0,0000 0,0000
Source: Federal Statistical Office. Own calculations. ©IAB
IAB-Discussion Paper 16|2020 17

Imprint IAB-Discussion Paper 16|2020EN
Publication Date 27. May 2020
Publisher Institute for Employment Research of the Federal Employment Agency Regensburger Straße 104 90478 Nürnberg Germany
All rights reserved Reproduction and distribution in any form – also in parts – requires the permission of the FDZ
Download http://doku.iab.de/discussionpapers/2020/dp1620.pdf
All publications in the series “IAB-Discusssion Paper” can be downloaded from https://www.iab.de/en/publikationen/discussionpaper.aspx
Website www.iab.de/en
Corresponding author Anja Bauer +49 (0)911 -179 3366 E-Mail [email protected] Enzo Weber E-Mail [email protected]