Embed Size (px)
Citation preview
Executive summary
Rising labor costs, fluctuations in payer mix, and regulatory changes, among other issues, are pressuring many hospitals and health systems to reduce costs and increase revenue. Indeed, the 2017 Deloitte Survey of US Health System CEOs found that declining margins is one of the top issues keeping chief executives up at night.1
Current and projected margin challenges are considerable: Commercial health insurance payments as a percentage of hospital and health systems’ total payments are projected to drop from 37 percent to 33 percent by 2024.2 The percentage of revenue from historically lower-margin Medicare payments is projected to increase from 35 percent to 40 percent of total payments.3 Labor costs are anticipated to continue rising due, in part, to patient volume growth from an aging and more chronically ill US population.4 Some future-state scenarios show that the combination of these trends could significantly reduce margins. A recent study from the Congressional Budget Office (CBO), for instance, suggests that absent productivity growth, between 51 percent and 60 percent of hospitals could have negative margins by 2025.5
To shed light on the main drivers of hospital operating expenses and revenue, we analyzed the financial performance (operating revenue and expenses per adjusted admission) of approximately 3,000 acute US hospitals between 2011 and 2015. We also conducted secondary research on the types of innovative technologies that hospitals are beginning to leverage to reduce costs and enhance revenue.
Our analysis turned up three key findings:
Variation in hospital revenue and expense performance is large. Although, on average, margins increased from four percent in 2011 to
4.8 percent in 2015, roughly 30 percent of hospitals had negative operating margins each year. Almost half (45 percent) of hospitals with negative margins in 2011 were still negative in 2015.
Hospitals might need to adopt new strategies, such as combining traditional workforce planning with predictive
analytics, to improve efficiencies in labor costs and find alternatives to contract labor. Labor costs account for approximately 60 percent of hospital noncapital costs, and were consistently the largest driver of operating expenses between 2011 and 2015. After controlling for hospital and market characteristics—including admissions volume—we found that, on average, a 10 percent increase in salary and benefits is associated with a six percent increase in operating expenses. Contract labor drives expenses, as well. A 10 percent increase in contract labor is associated with a four percent increase in operating expenses, according to our analysis.
To improve revenue, hospitals may want to revisit revenue cycle strategies, such as leveraging new technologies and analytics
tools that help improve processes and coding to reduce claims denials. In our analysis, the largest drivers of hospital revenue, irrespective of hospital type, were case mix index and payer mix. Increasing the case mix from the median (1.45) to the 75th percentile (1.65) is associated with a 10 percent increase in operating revenue. The impact of Medicare and Medicaid payer mix was similar—a 10 percent increase in the share of Medicare patients or Medicaid patients decreases operating revenue by two percent.
The uncertain road ahead: Could technology offer hospitals relief from increasing margin pressures?
The uncertain road ahead: Could technology offer hospitals relief from increasing margin pressures?
2
To stay afloat—even thrive—in the face of margin pressures, health systems should consider identifying strategies to enhance revenue, reduce costs, and generally improve efficiency. New approaches such as using predictive analytics and Artificial Intelligence (AI) to improve the supply chain or robots and cognitive automation to enhance finance and revenue cycle processes have the potential to bend the cost curve and boost revenue in coming years.
Hospital margins overall have been holding steady, but are anticipated to tighten significantly
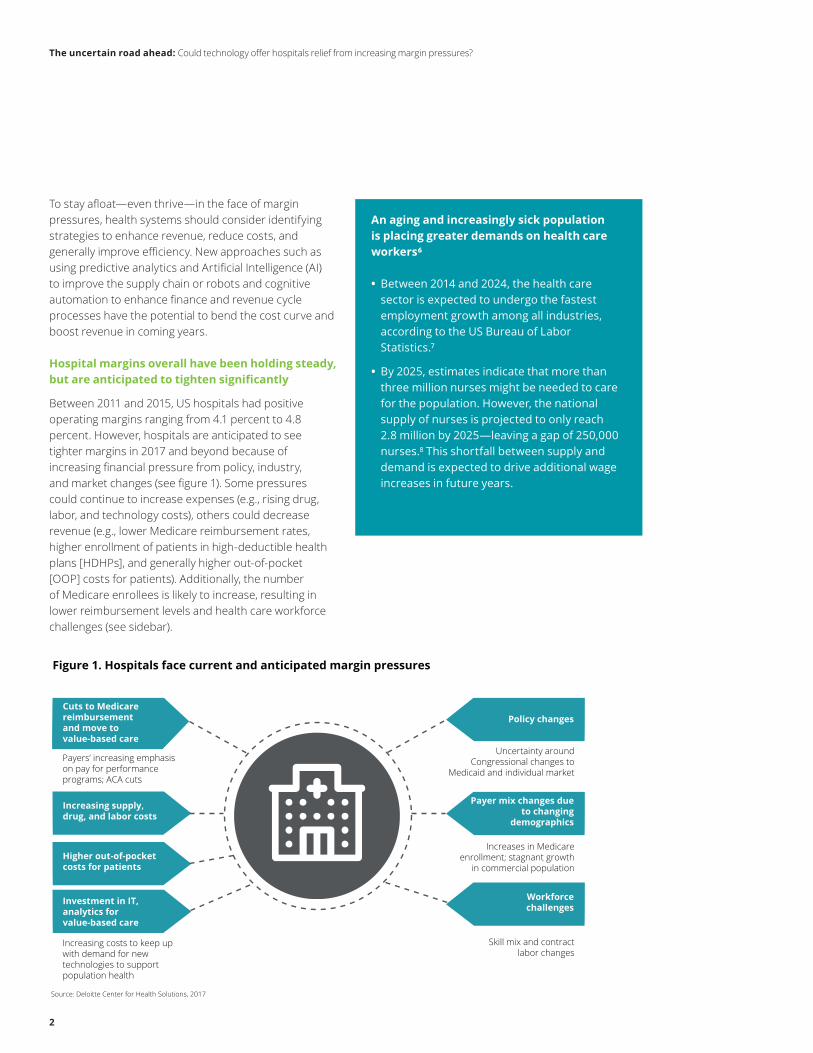
Between 2011 and 2015, US hospitals had positive operating margins ranging from 4.1 percent to 4.8 percent. However, hospitals are anticipated to see tighter margins in 2017 and beyond because of increasing financial pressure from policy, industry, and market changes (see figure 1). Some pressures could continue to increase expenses (e.g., rising drug, labor, and technology costs), others could decrease revenue (e.g., lower Medicare reimbursement rates, higher enrollment of patients in high-deductible health plans [HDHPs], and generally higher out-of-pocket [OOP] costs for patients). Additionally, the number of Medicare enrollees is likely to increase, resulting in lower reimbursement levels and health care workforce challenges (see sidebar).
An aging and increasingly sick population is placing greater demands on health care workers⁶
• Between 2014 and 2024, the health care sector is expected to undergo the fastest employment growth among all industries, according to the US Bureau of Labor Statistics.⁷
• By 2025, estimates indicate that more than three million nurses might be needed to care for the population. However, the national supply of nurses is projected to only reach 2.8 million by 2025—leaving a gap of 250,000 nurses.⁸ This shortfall between supply and demand is expected to drive additional wage increases in future years.
Cuts to Medicare reimbursement and move to value-based care
Policy changes
Payer mix changes due to changing
demographics
Workforcechallenges
Figure 1. Hospitals face current and anticipated margin pressures
Source: Deloitte Center for Health Solutions, 2017
Payers’ increasing emphasison pay for performanceprograms; ACA cuts
Uncertainty aroundCongressional changes to
Medicaid and individual market
Increases in Medicareenrollment; stagnant growth
in commercial population
Skill mix and contractlabor changes
Increasing supply, drug, and labor costs
Higher out-of-pocket costs for patients
Investment in IT, analytics for value-based care
Increasing costs to keep up with demand for new technologies to support population health
The uncertain road ahead: Could technology offer hospitals relief from increasing margin pressures?
3
By 2029, when the last round of Baby Boomers (individuals born between 1946 and 1964) reaches retirement age, more than 71 million Americans will be 65 or older—up 73 percent from 2011.⁹ Also, approximately one million registered nurses (RNs) are now more than 50 years old. That means one-third of today’s nursing workforce will reach retirement age in the next 10 to 15 years. Nearly 700,000 nurses are projected to retire or leave the labor force by 2024.¹⁰
Possible future policy changes to Medicaid and the individual health insurance market could also impact reimbursement and overall coverage rates. While it is unclear what policy changes the new administration and Congress will enact in these markets, many ideas under discussion have the potential to disrupt hospital finances (see sidebar below). In general, any policies that result in fewer people with insurance or more people with higher OOP costs have the potential to boost bad debt and charity care for hospitals.
Combined demographic, legislative, and regulatory pressures have the potential to drive more hospital margins into the red. Indeed, a 2016 CBO analysis projected that hospital margins could face significant pressure in the coming years.
Congress and the administration’s efforts to repeal and replace the ACA could put more pressure on hospitals
The new administration that took office in early 2017, combined with the Republican-controlled Congress, reinvigorated the debate around repealing and replacing the
Affordable Care Act (ACA). Since early 2017, Republican members of the House and Senate have debated the many ways they could repeal aspects of the ACA and replace them with more conservative policies. The following ideas could have a significant impact on hospital margins:
• Restructuring federal contributions to the Medicaid program: The repeal bills have included changes to the way the federal government finances its match for state spending on Medicaid. Reductions in federal spending on Medicaid could cause states to eliminate benefits, restrict enrollment, and/or reduce provider payments. Moreover, states could consider reducing payments to Medicaid managed care plans, which could, in turn, prompt health plans to limit provider networks.11 The Congressional Budget Office (CBO) projected that Medicaid spending would be reduced 35 percent by 2036 under one scenario.12
• Repealing the ACA’s cuts to disproportionate share hospital (DSH) payments: Several of the repeal and replace bills discussed to date have provisions that would eliminate DSH cuts for states that did not expand Medicaid, as called for by the ACA. Under most scenarios, hospitals in expansion states would continue to see DSH payments cut, while hospitals in non-expansion states would see relief from this policy. If combined with restructured federal government Medicaid payments to states, DSH payments under these schemes likely would not adequately cover the expected increase in uncompensated care costs.13
• Changing regulations in the individual market: Lawmakers have considered allowing states to remove categories from their essential health benefits packages, reducing the actuarial value of benchmark plans (leading consumers to pay more OOP despite the lower premiums that would result), eliminating the individual mandate penalty, reducing premium tax credits and, eventually, eliminating the cost-sharing subsidies. These changes, combined with others, could lead to more uninsured and underinsured in the individual market, exposing hospitals to more uncompensated care costs. Hospitals also would likely see lower volume as consumers cut back on using more expensive services.14
The uncertain road ahead: Could technology offer hospitals relief from increasing margin pressures?
4
According to the report, between 51 percent and 60 percent of hospitals could see negative margins by 2025 if they are unable to achieve productivity growth on par with the general economy15 (see sidebar below).
Drivers of hospital revenue and expenses between 2011 and 2015
Considering all their existing and anticipated financial pressures, hospitals have an uncertain road ahead. More than ever, the ability to identify primary cost and revenue drivers can help hospitals position themselves for financial stability in a changing environment. To better understand these drivers, we analyzed the financial performance of approximately 3,000 acute US hospitals between 2011 and 2015. (For more information on our methodology, see the appendix.)
Defining productivity and productivity growth
Productivity is the measure of an organization’s efficiency and
is commonly defined as a ratio between output volume and input volume (e.g., labor, capital, and materials).16 In its projection analysis, CBO defines productivity growth as “the extent to which a given amount of output of a given quality is produced using fewer inputs or a less costly mix of inputs over time.”17 Productivity growth can be achieved by using the same or fewer inputs to achieve more output (e.g., performing more services with the same or less labor). It also can be achieved by improving output quality. In the case of hospitals, productivity growth would mean improving patient outcomes while relying on the same or fewer resources.
Key findings
Large variation in hospital financial performance
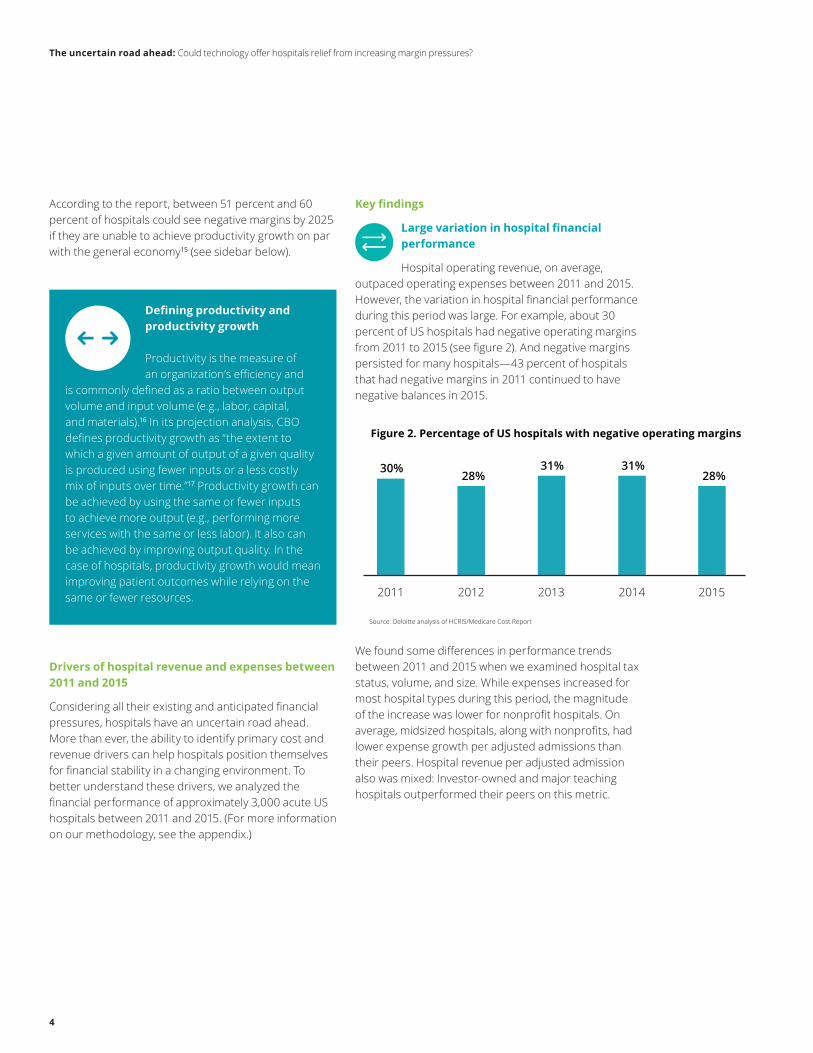
Hospital operating revenue, on average, outpaced operating expenses between 2011 and 2015. However, the variation in hospital financial performance during this period was large. For example, about 30 percent of US hospitals had negative operating margins from 2011 to 2015 (see figure 2). And negative margins persisted for many hospitals—43 percent of hospitals that had negative margins in 2011 continued to have negative balances in 2015.
We found some differences in performance trends between 2011 and 2015 when we examined hospital tax status, volume, and size. While expenses increased for most hospital types during this period, the magnitude of the increase was lower for nonprofit hospitals. On average, midsized hospitals, along with nonprofits, had lower expense growth per adjusted admissions than their peers. Hospital revenue per adjusted admission also was mixed: Investor-owned and major teaching hospitals outperformed their peers on this metric.
Policy changes
Figure 2. Percentage of US hospitals with negative operating margins
Source: Deloitte analysis of HCRIS/Medicare Cost Report
2011 2012 2013 2014 2015
30%28%
31% 31%28%
The uncertain road ahead: Could technology offer hospitals relief from increasing margin pressures?
5
Digging into hospital operating expenses
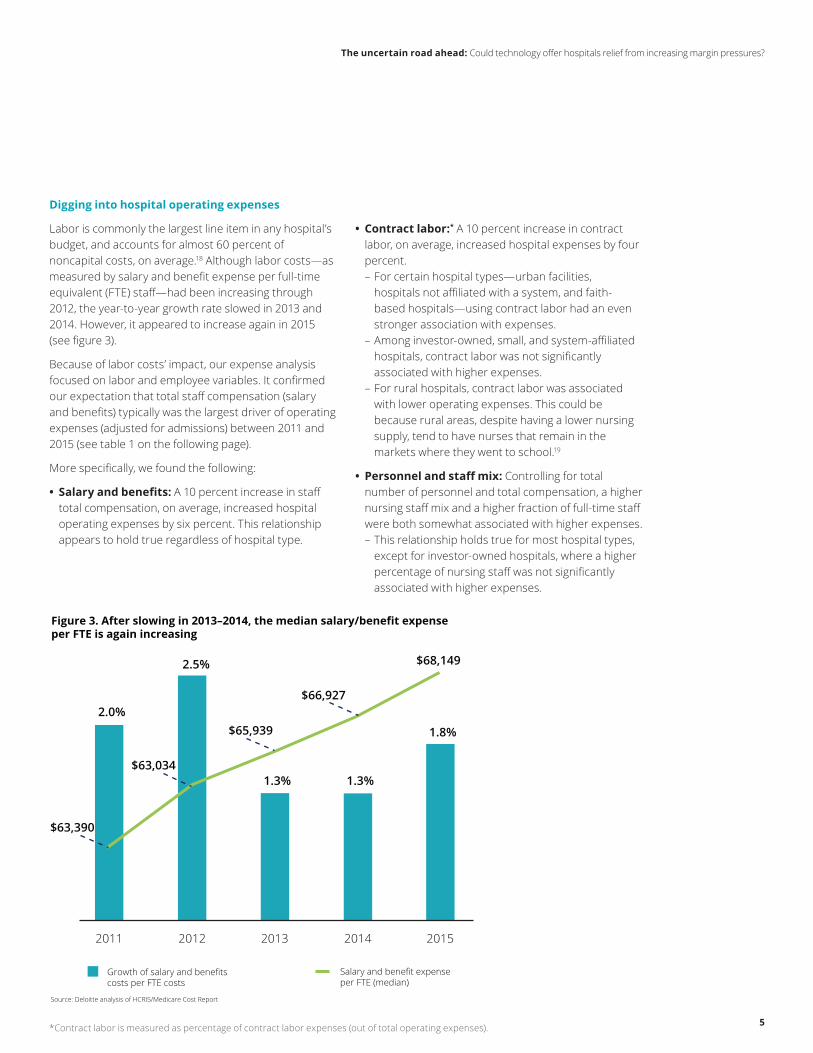
Labor is commonly the largest line item in any hospital’s budget, and accounts for almost 60 percent of noncapital costs, on average.18 Although labor costs—as measured by salary and benefit expense per full-time equivalent (FTE) staff—had been increasing through 2012, the year-to-year growth rate slowed in 2013 and 2014. However, it appeared to increase again in 2015 (see figure 3).
Because of labor costs’ impact, our expense analysis focused on labor and employee variables. It confirmed our expectation that total staff compensation (salary and benefits) typically was the largest driver of operating expenses (adjusted for admissions) between 2011 and 2015 (see table 1 on the following page).
More specifically, we found the following:
• Salary and benefits: A 10 percent increase in staff total compensation, on average, increased hospital operating expenses by six percent. This relationship appears to hold true regardless of hospital type.
• Contract labor:* A 10 percent increase in contract labor, on average, increased hospital expenses by four percent. – For certain hospital types—urban facilities, hospitals not affiliated with a system, and faith-based hospitals—using contract labor had an even stronger association with expenses.
– Among investor-owned, small, and system-affiliated hospitals, contract labor was not significantly associated with higher expenses.
– For rural hospitals, contract labor was associated with lower operating expenses. This could be because rural areas, despite having a lower nursing supply, tend to have nurses that remain in the markets where they went to school.19
• Personnel and staff mix: Controlling for total number of personnel and total compensation, a higher nursing staff mix and a higher fraction of full-time staff were both somewhat associated with higher expenses. – This relationship holds true for most hospital types, except for investor-owned hospitals, where a higher percentage of nursing staff was not significantly associated with higher expenses.
Policy changes
Figure 3. After slowing in 2013–2014, the median salary/benefit expense per FTE is again increasing
Source: Deloitte analysis of HCRIS/Medicare Cost Report
2011 2012 2013 2014 2015
2.0%
2.5%
1.3%1.3%
1.8%
$63,390
$63,034
$65,939
$66,927
$68,149
Growth of salary and benefits costs per FTE costs
Salary and benefit expense per FTE (median)
*Contract labor is measured as percentage of contract labor expenses (out of total operating expenses).
The uncertain road ahead: Could technology offer hospitals relief from increasing margin pressures?
6
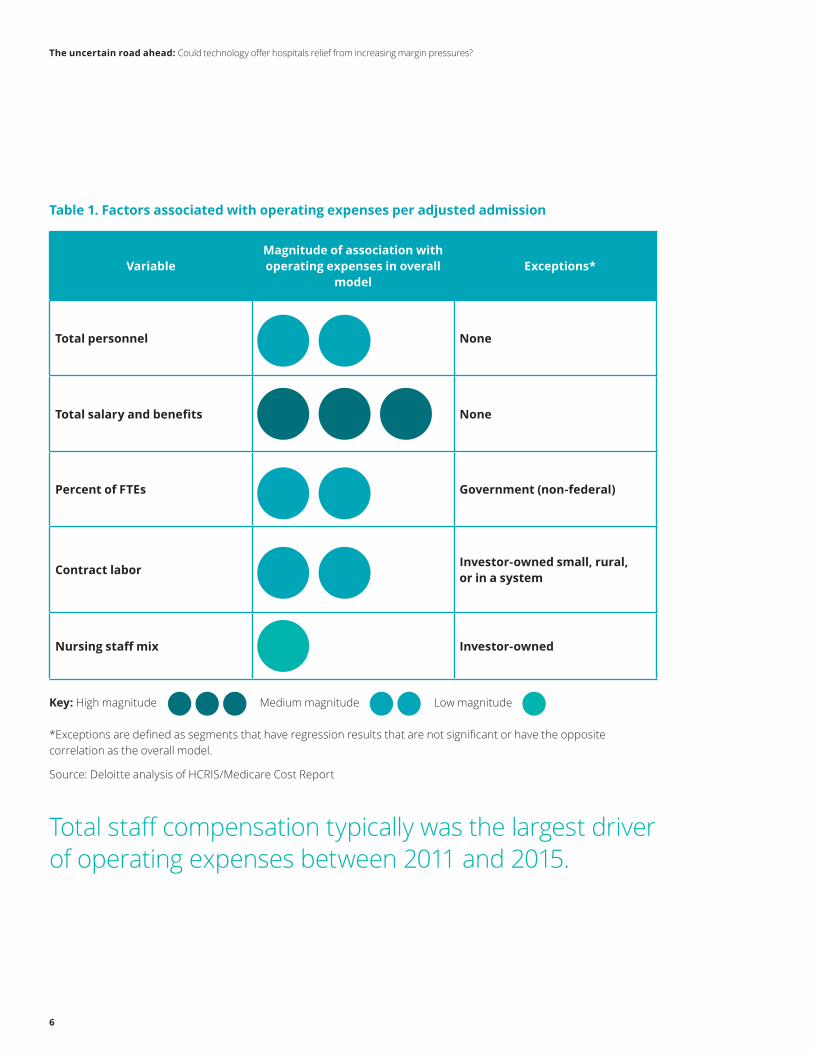
Table 1. Factors associated with operating expenses per adjusted admission
VariableMagnitude of association with operating expenses in overall
model Exceptions*
Total personnel None
Total salary and benefits None
Percent of FTEs Government (non-federal)
Contract labor Investor-owned small, rural, or in a system
Nursing staff mix Investor-owned
Key: High magnitude Medium magnitude Low magnitude
*Exceptions are defined as segments that have regression results that are not significant or have the opposite correlation as the overall model.
Source: Deloitte analysis of HCRIS/Medicare Cost Report
Total staff compensation typically was the largest driver of operating expenses between 2011 and 2015.
The uncertain road ahead: Could technology offer hospitals relief from increasing margin pressures?
7
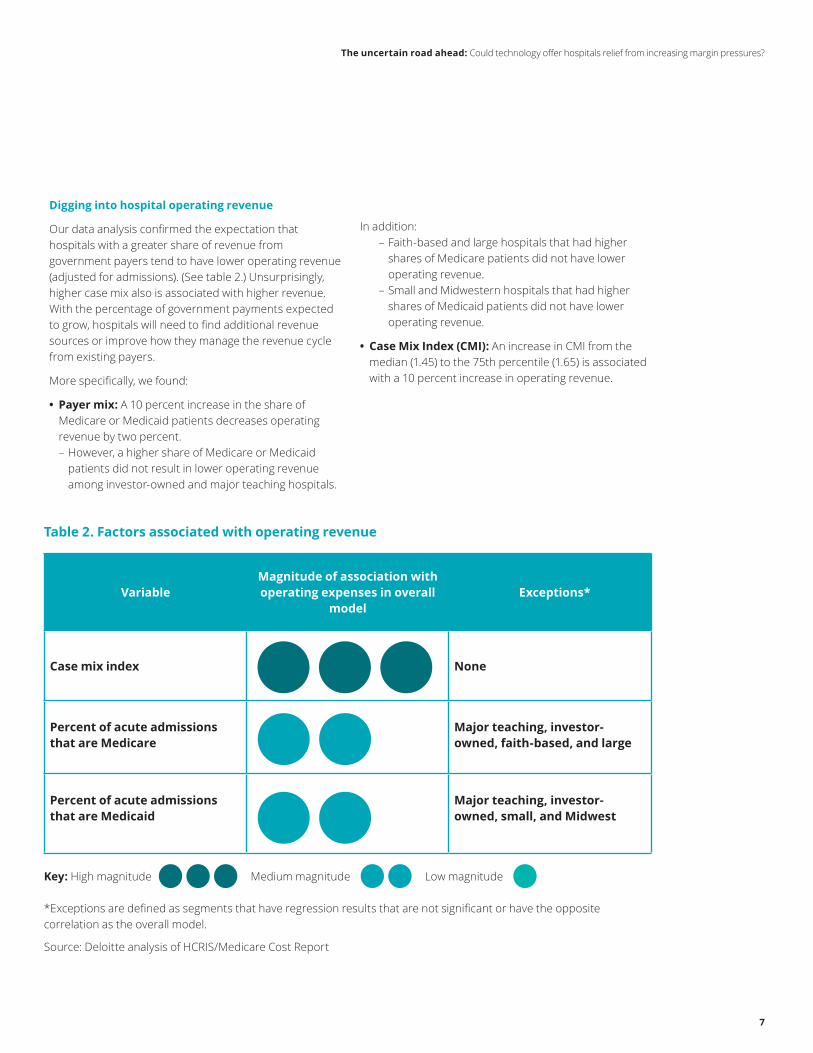
Table 2. Factors associated with operating revenue
VariableMagnitude of association with operating expenses in overall
model Exceptions*
Case mix index None
Percent of acute admissions that are Medicare
Major teaching, investor-owned, faith-based, and large
Percent of acute admissions that are Medicaid
Major teaching, investor-owned, small, and Midwest
Key: High magnitude Medium magnitude Low magnitude
*Exceptions are defined as segments that have regression results that are not significant or have the opposite correlation as the overall model.
Source: Deloitte analysis of HCRIS/Medicare Cost Report
Digging into hospital operating revenue
Our data analysis confirmed the expectation that hospitals with a greater share of revenue from government payers tend to have lower operating revenue (adjusted for admissions). (See table 2.) Unsurprisingly, higher case mix also is associated with higher revenue. With the percentage of government payments expected to grow, hospitals will need to find additional revenue sources or improve how they manage the revenue cycle from existing payers.
More specifically, we found:
• Payer mix: A 10 percent increase in the share of Medicare or Medicaid patients decreases operating revenue by two percent. – However, a higher share of Medicare or Medicaid patients did not result in lower operating revenue among investor-owned and major teaching hospitals.
In addition: – Faith-based and large hospitals that had higher shares of Medicare patients did not have lower operating revenue.
– Small and Midwestern hospitals that had higher shares of Medicaid patients did not have lower operating revenue.
• Case Mix Index (CMI): An increase in CMI from the median (1.45) to the 75th percentile (1.65) is associated with a 10 percent increase in operating revenue.
The uncertain road ahead: Could technology offer hospitals relief from increasing margin pressures?
8
Hospitals should consider strategies to reduce costs and improve revenue
What should hospitals do to counter current and anticipated margin pressures? Our review of secondary literature reveals some strategies already in play.
Implications and strategies that may reduce expenses
• Reexamine and, if necessary, reconsider contract labor to respond to a changing environment. Anecdotal evidence suggests that hospitals have increasingly turned to contract labor to help offset the widening gap between staffing needs and personnel availability. Consider this: After the ACA’s enactment and patient volumes increased with expanded coverage, hospitals reported more use of contract labor, particularly for nursing staff.20 In addition, high turnover in the nursing profession contributes to vacancies, which places additional pressure on hospitals.21 Bringing these costs down will increase in importance as patient volume continues to grow.
• Digitize the core by adopting emergent technologies. Organizations should work to optimize internal support services and processes by using predictive and responsive platforms that are efficient, automated, and move in real time. – As an entry point to digital transformation, organizations can use robotic process automation (RPA) to streamline administrative work and tedious back-office tasks. RPA may be appropriate when a task involves repetitive action—for example, copying and pasting information from a spreadsheet into a software application. Applying RPA can free employees to focus on more important tasks—and reduce the error rate at the same time.²² Experts say that RPA also can help reinvigorate employees because it shifts their job away from tedious tasks and toward those that require human interaction and oversight (see sidebar). Health care organizations could start by assessing how RPA can be applied to transform the revenue cycle function and then move to other functional areas.
• Consider other exponential technologies. RPA is just one of many exponential technologies that can aid health care organizations. After successfully
RPA can propel hospitals beyond traditional cost-cutting strategies
CrossChx’s “Olive,” a 24/7 virtual care assistant, is one example of applying RPA in health care. Olive is AI that is trained as an “employee” to perform eligibility, prior authorizations, appointment reminders, and more. Olive reduces the chance for human error in repetitive,
high-volume tasks and workflows and frees employees to focus on tasks that require a human touch. Olive can integrate into any electronic health record (EHR), payment, or task management system.²³
In another example, a hospital’s shared services center leveraged RPA in 2014 to automate what it calls its “swivel chair” processes. The organization applied RPA technology to its human resources and payable services areas, where employees were taking information contained in Excel spreadsheets and manually copying and pasting it into the HR records system. By automating these processes, the hospital eliminated approximately 16,000 labor hours, including time spent reworking processes due to human error.²⁴
Some experts estimate that RPA’s return on investment (ROI) can be as much as double that of outsourcing IT departments. The savings come from enabling employees to complete tasks more quickly and from preventing issues before they arise.²⁵
The uncertain road ahead: Could technology offer hospitals relief from increasing margin pressures?
9
Case study: Technology can help hospitals streamline contract labor use
In 2016, the average vacancy rate for RNs nationally was 8.5 percent. Between 2015 and 2016, the number of hospitals reporting an RN vacancy rate of greater than 12.5 percent rose more than four percent.²⁶ When hospitals have high vacancy rates, they often turn to high-cost solutions—overtime, agency staff, and travel nurses—to bridge the gap. This practice can make contract labor one of the highest variable costs for hospitals and health systems and can produce damaging effects on employee morale, patient experience and outcomes, and overall expenses. In its 2016 Hospital Survey on Patient Safety Culture, the Agency for Healthcare Research and Quality (AHRQ) reported that 65 percent of respondents said their hospital uses more agency or temporary staff than is best for patient care.²⁷ In the long run, using contract labor could negatively impact hospital performance in value-based arrangements.
Hospital Corporation of America (HCA) saw a 36 percent increase ($55 million) in contract labor costs between third quarter 2014 and third quarter 2015. The primary reasons for this increase were higher patient volume due to the ACA’s insurance expansion and the nation’s improving economy. However, HCA applies real-time analytics to manage its workforce, reportedly checking labor statistics every two hours and staffing its workforce based on acuity and productivity targets. In addition, HCA uses a dashboard enabled by predictive analytics to look at projections and historical patient figures, and to accurately identify its staffing needs. While its contract labor costs increased by a third between 2014 and 2015, HCA was able to keep its labor ratio (total labor costs/net operating revenue) in check—increasing from 45.8 percent to 46.9 percent that same year. (A hospital’s labor ratio is considered to be well-managed if it remains under 55 percent.²⁸) HCA’s use of technology and the most appropriate employees to leverage the technology may be a useful lesson for hospitals that wish to rein in contract labor costs.
Hospitals and health systems could leverage leading practices from organizations like the Hospital Corporation of America. The organization uses real-time analytics to keep its contract labor costs in check.
The uncertain road ahead: Could technology offer hospitals relief from increasing margin pressures?
10
incorporating RPA into their core business strategies, hospitals should consider moving further along the cognitive computing spectrum to more advanced technologies, such as machine learning and AI. Unlike RPA, machine learning technologies can help identify patterns in data. Applied in health care organizations, machine learning can help to identify payment variance and remediate complex payment methodologies.²⁹
• Assess how combining exponential technologies into workflow will impact and improve staff productivity. The future health care work environment could look very different from today if organizations prioritize the adoption of disruptive technologies that help them achieve more for less. This may be especially true for employee productivity. Robotics and automation, for example, can help nurses complete routine tasks such as collecting blood samples. This can reduce task time and the risk of error or injury, while improving the patient experience. And as organizations progress from relying on manual tasks to using RPA and cognitive computing, the workforce can move from being “doers” to “reviewers.” In the long run, organizations may be able to reduce their reliance on contract labor.
Implications and strategies that may help increase revenue
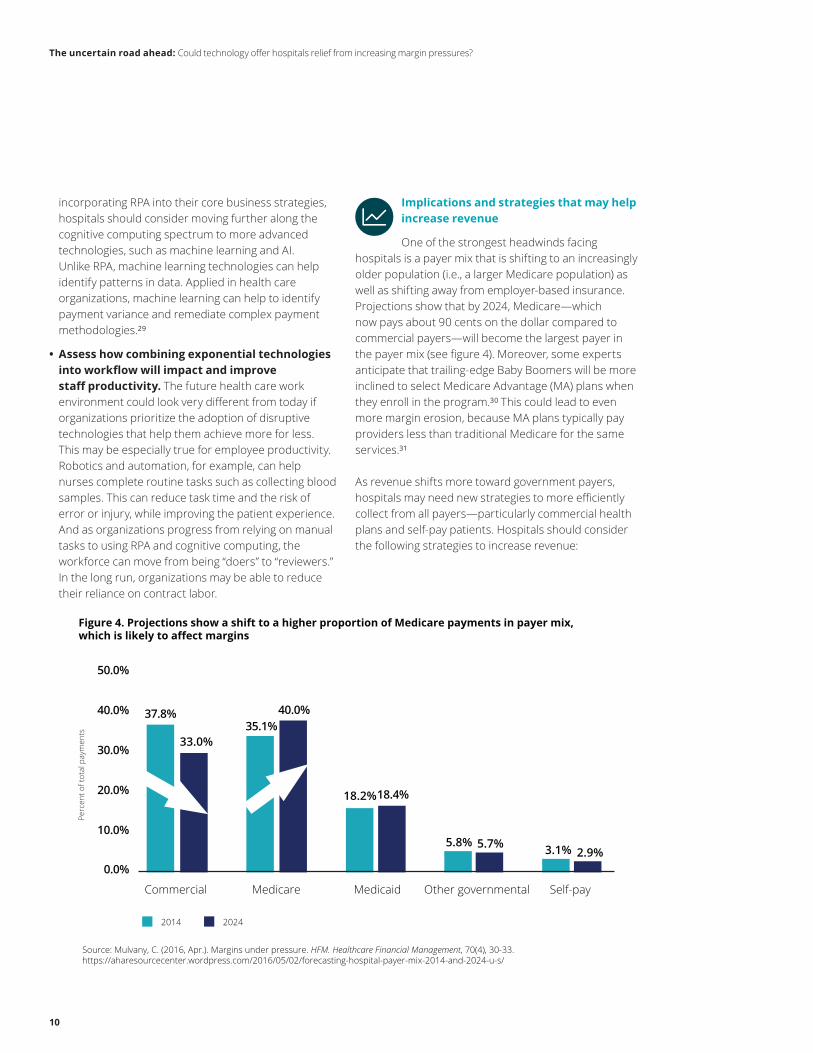
One of the strongest headwinds facing hospitals is a payer mix that is shifting to an increasingly older population (i.e., a larger Medicare population) as well as shifting away from employer-based insurance. Projections show that by 2024, Medicare—which now pays about 90 cents on the dollar compared to commercial payers—will become the largest payer in the payer mix (see figure 4). Moreover, some experts anticipate that trailing-edge Baby Boomers will be more inclined to select Medicare Advantage (MA) plans when they enroll in the program.³⁰ This could lead to even more margin erosion, because MA plans typically pay providers less than traditional Medicare for the same services.³¹
As revenue shifts more toward government payers, hospitals may need new strategies to more efficiently collect from all payers—particularly commercial health plans and self-pay patients. Hospitals should consider the following strategies to increase revenue:
Other governmental
Figure 4. Projections show a shift to a higher proportion of Medicare payments in payer mix, which is likely to affect margins
Source: Mulvany, C. (2016, Apr.). Margins under pressure. HFM. Healthcare Financial Management, 70(4), 30-33. https://aharesourcecenter.wordpress.com/2016/05/02/forecasting-hospital-payer-mix-2014-and-2024-u-s/
Commercial Medicare Medicaid Self-pay
37.8%
33.0%35.1%
40.0%
3.1% 2.9%
18.2%18.4%
5.8% 5.7%
2014 2024
0.0%
10.0%
20.0%
30.0%
40.0%
50.0%
Perc
ent o
f tot
al p
aym
ents
The uncertain road ahead: Could technology offer hospitals relief from increasing margin pressures?
11
• Leverage digital solutions across the enterprise. Many health care providers have aging back-office technology platforms that are unable to support business needs in an increasingly complex and evolving market. Finance is one area in need of transformation: Digital solutions can elevate current capabilities to next-generation levels. Supply chain is another operational area that can benefit from digital solutions: With a set of dynamic networks around a digital core, the supply chain of the future can be shorter, faster, more responsive, and smarter.
• Pursue innovative health plan strategies and invest in value-based care capabilities. As the payer mix evolves, and as historically profitable volume moves away from the inpatient setting, health systems should consider adopting strategies that offer greater access to prepaid revenue arrangements. Additionally, they should consider investing in capabilities to deliver value-based care, such as data, analytics, talent, care coordination, complex care management, pharmacy, and patient engagement. Many health systems may have to redistribute limited investment capital and reassign resources that are now focused on initiatives aligned to the traditional volume-driven care model.
• Digitize core clinical documentation processes. Accurate and timely clinical documentation is often an important element of a health care provider’s revenue strategy. By leveraging new technologies, organizations can improve care documentation, reduce administrative burdens, and enhance revenue. For example, natural language processing (NLP) could be enlisted to prompt staff for more refined documentation if necessary. Organizations also could employ automatic coding techniques using document keywords and leverage technology to automatically generate documentation-based appeal letters.
• Adopt better denial prevention and management strategies. Approximately nine percent of claims are initially denied, according to recent estimates.³² Generally, health plans deny claims based on clinical issues (e.g., service was deemed not medically necessary), administrative issues (e.g., claims had
clerical errors such as billing and coding), and contractual issues (e.g., claims are vague and require additional research).³³ Many denials are preventable, but a recent survey found that fewer than half of hospitals use the claims-management tools available from their revenue cycle vendors, and approximately one-third use a manual process to track denials.³⁴
Automation and claims-management tools can help health systems on many fronts: identifying the payers that deny claims most often, determining the most common denial-related issues, and, importantly, how much each payer owes the health system. In addition, hospitals should properly train coding staff. Employing any or all of these strategies and tools could help reduce denials and help organizations receive the proper risk-adjustment payments from government payers.
• Improve processes to increase consumer experience and engagement. As consumers assume more financial responsibility for their care, health systems may see more payment gaps—however, they also may see more opportunities to
As revenue shifts more toward government payers, hospitals may need new strategies to more efficiently collect from all payers—particularly commercial health plans and self-pay patients.
The uncertain road ahead: Could technology offer hospitals relief from increasing margin pressures?
12
enhance patient satisfaction—an important focus area in value-based care arrangements. For example, hospitals that fail to collect and submit Hospital Consumer Assessment of Healthcare Providers and Systems (HCAHPS) data could be penalized up to two percentage points off of the Inpatient Prospective Payment System (IPPS) annual payment update.³⁵ Deloitte’s research on the value of patient experience found that health care providers that are able to anticipate, meet, and even exceed patient needs are more likely to be financially successful.³⁶ Now more than ever, health systems’ revenue cycles—from appointment scheduling to registration to payment—should be consumer-focused. This may be achieved by making improvements in three main areas:
1. Re-examine patient interaction with the revenue cycle process: Patients frequently interact with the revenue cycle system, often for longer periods than they interact with the clinical staff. As such, making scheduling, registration, and billing processes consumer-friendly can be just as critical as producing quality outcomes. Strategies that could help hospitals improve their patient experience scores and avoid collection issues that historically have plagued the revenue cycle include:
• Giving patients upfront and clear cost estimates for their care
• Helping patients navigate basic health insurance terms; for example, some patients might not know the difference between a copay and coinsurance
• Delivering timely, easy-to-understand statements using the patient’s preferred delivery method; for example, patients who do not have Internet access might prefer to receive bills in the mail³⁷
2. Analyze the patient population: Segmenting the population served by the health care system can help identify which patients are more or less likely to pay their bills. This information can help health systems tailor collection approaches. For example, segmenting patients by their credit score and balance can help identify individuals
who owe substantial amounts and have lower credit ratings. Such patients are less likely to pay bills outright, and health systems might need different collection approaches.
3. Hire the right staff or retrain existing staff: Traditional roles for staff involved in hospital registration and billing have evolved over the last several years to require skills that go beyond computer entry. Staff in these areas could be trained more as financial counselors who have the ability to help patients navigate the process from start to finish.³⁸ They also could be trained to listen and communicate with patients, asking questions and documenting conversations to facilitate better follow-up.³⁹
Now more than ever, health systems’ revenue cycles—from appointment scheduling to registration to payment—should be consumer-focused.
The uncertain road ahead: Could technology offer hospitals relief from increasing margin pressures?
13
Conclusion
The primary drivers of hospital expenses and revenue that we identify in our analysis—increased labor costs and changes in case and payer mix driven by regulatory and demographic changes—likely will continue to exert pressure on hospital margins. Some of these pressures, such as regulatory and payer-mix changes, might be beyond hospitals’ control, but others are not.
Cost-reduction strategies that hospitals traditionally have relied upon may no longer be sufficient. To stay afloat—even thrive—in the future, health system leaders should consider strategies to optimize labor costs, reduce fixed costs, gain greater access to revenue through innovative value-based payment contracts with
health plans, improve revenue cycle processes, and invest in new value-based care capabilities. Emergent technologies, such as robotic and cognitive automation, could help hospitals truly innovate their operations in the face of mounting financial pressures.
As the health care system continues down a path toward value-based care, it is likely that payers will try to negotiate lower payments, which can place further pressure on health systems to reduce costs. In response, health systems should consider developing proactive, winning strategies now to achieve long-term financial sustainability.
The move to value-based care
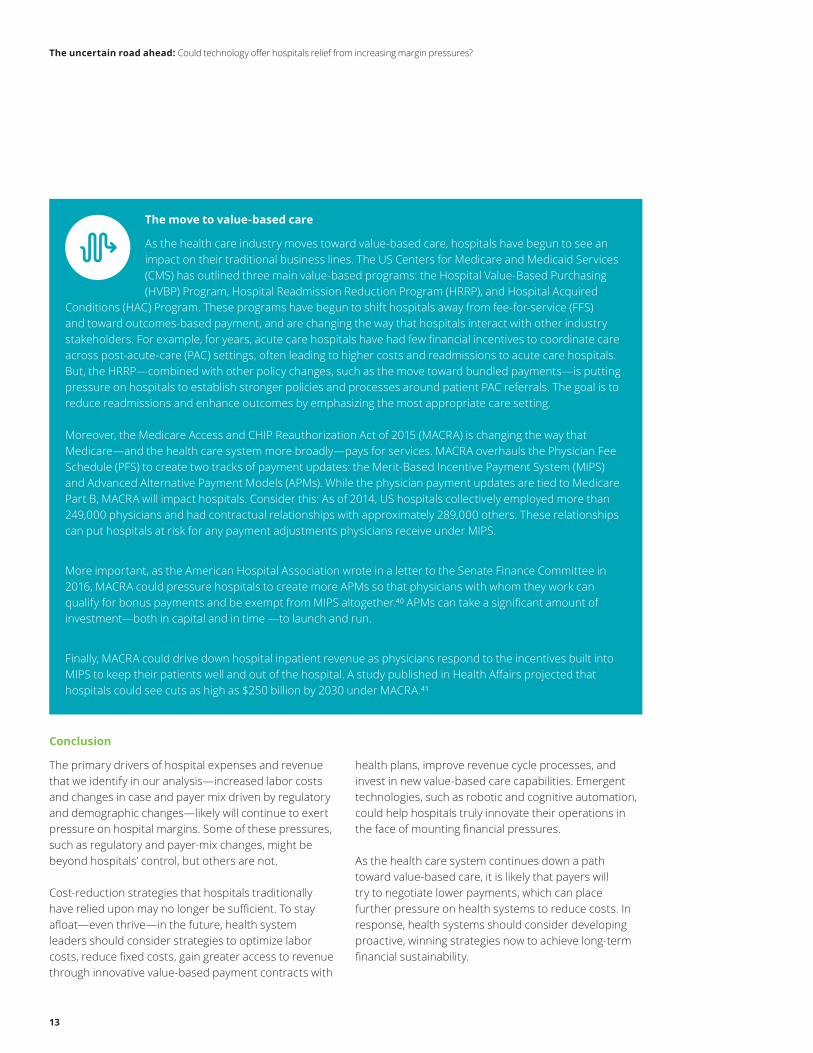
As the health care industry moves toward value-based care, hospitals have begun to see an impact on their traditional business lines. The US Centers for Medicare and Medicaid Services (CMS) has outlined three main value-based programs: the Hospital Value-Based Purchasing (HVBP) Program, Hospital Readmission Reduction Program (HRRP), and Hospital Acquired
Conditions (HAC) Program. These programs have begun to shift hospitals away from fee-for-service (FFS) and toward outcomes-based payment, and are changing the way that hospitals interact with other industry stakeholders. For example, for years, acute care hospitals have had few financial incentives to coordinate care across post-acute-care (PAC) settings, often leading to higher costs and readmissions to acute care hospitals. But, the HRRP—combined with other policy changes, such as the move toward bundled payments—is putting pressure on hospitals to establish stronger policies and processes around patient PAC referrals. The goal is to reduce readmissions and enhance outcomes by emphasizing the most appropriate care setting.
Moreover, the Medicare Access and CHIP Reauthorization Act of 2015 (MACRA) is changing the way that Medicare—and the health care system more broadly—pays for services. MACRA overhauls the Physician Fee Schedule (PFS) to create two tracks of payment updates: the Merit-Based Incentive Payment System (MIPS) and Advanced Alternative Payment Models (APMs). While the physician payment updates are tied to Medicare Part B, MACRA will impact hospitals. Consider this: As of 2014, US hospitals collectively employed more than 249,000 physicians and had contractual relationships with approximately 289,000 others. These relationships can put hospitals at risk for any payment adjustments physicians receive under MIPS.
More important, as the American Hospital Association wrote in a letter to the Senate Finance Committee in 2016, MACRA could pressure hospitals to create more APMs so that physicians with whom they work can qualify for bonus payments and be exempt from MIPS altogether.⁴⁰ APMs can take a significant amount of investment—both in capital and in time —to launch and run.
Finally, MACRA could drive down hospital inpatient revenue as physicians respond to the incentives built into MIPS to keep their patients well and out of the hospital. A study published in Health Affairs projected that hospitals could see cuts as high as $250 billion by 2030 under MACRA.⁴¹
The uncertain road ahead: Could technology offer hospitals relief from increasing margin pressures?
14
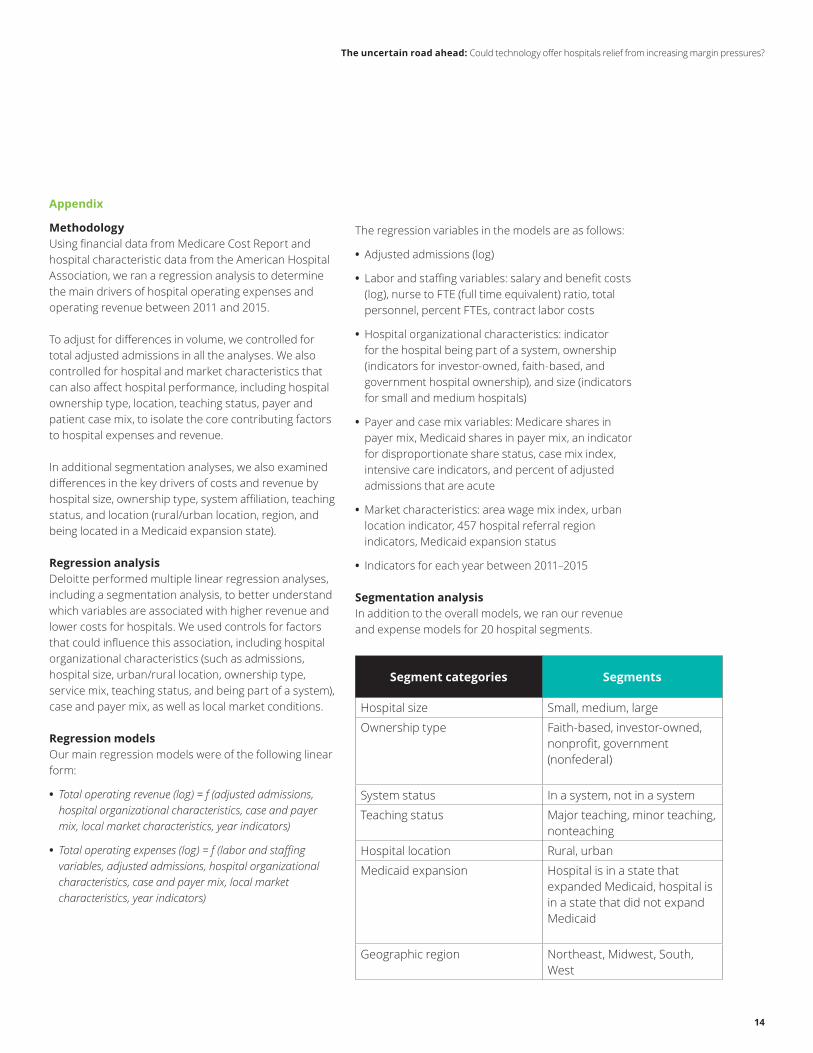
Appendix
MethodologyUsing financial data from Medicare Cost Report and hospital characteristic data from the American Hospital Association, we ran a regression analysis to determine the main drivers of hospital operating expenses and operating revenue between 2011 and 2015.
To adjust for differences in volume, we controlled for total adjusted admissions in all the analyses. We also controlled for hospital and market characteristics that can also affect hospital performance, including hospital ownership type, location, teaching status, payer and patient case mix, to isolate the core contributing factors to hospital expenses and revenue.
In additional segmentation analyses, we also examined differences in the key drivers of costs and revenue by hospital size, ownership type, system affiliation, teaching status, and location (rural/urban location, region, and being located in a Medicaid expansion state).
Regression analysis Deloitte performed multiple linear regression analyses, including a segmentation analysis, to better understand which variables are associated with higher revenue and lower costs for hospitals. We used controls for factors that could influence this association, including hospital organizational characteristics (such as admissions, hospital size, urban/rural location, ownership type, service mix, teaching status, and being part of a system), case and payer mix, as well as local market conditions.
Regression modelsOur main regression models were of the following linear form:
• Total operating revenue (log) = f (adjusted admissions, hospital organizational characteristics, case and payer mix, local market characteristics, year indicators)
• Total operating expenses (log) = f (labor and staffing variables, adjusted admissions, hospital organizational characteristics, case and payer mix, local market characteristics, year indicators)
The regression variables in the models are as follows:
• Adjusted admissions (log)
• Labor and staffing variables: salary and benefit costs (log), nurse to FTE (full time equivalent) ratio, total personnel, percent FTEs, contract labor costs
• Hospital organizational characteristics: indicator for the hospital being part of a system, ownership (indicators for investor-owned, faith-based, and government hospital ownership), and size (indicators for small and medium hospitals)
• Payer and case mix variables: Medicare shares in payer mix, Medicaid shares in payer mix, an indicator for disproportionate share status, case mix index, intensive care indicators, and percent of adjusted admissions that are acute
• Market characteristics: area wage mix index, urban location indicator, 457 hospital referral region indicators, Medicaid expansion status
• Indicators for each year between 2011–2015
Segmentation analysisIn addition to the overall models, we ran our revenue and expense models for 20 hospital segments.
Segment categories Segments
Hospital size Small, medium, large
Ownership type Faith-based, investor-owned, nonprofit, government (nonfederal)
System status In a system, not in a system
Teaching status Major teaching, minor teaching, nonteaching
Hospital location Rural, urban
Medicaid expansion Hospital is in a state that expanded Medicaid, hospital is in a state that did not expand Medicaid
Geographic region Northeast, Midwest, South, West
The uncertain road ahead: Could technology offer hospitals relief from increasing margin pressures?
15
Authors
Allyson Gorman, MPH Principal Deloitte Consulting LLP [email protected]
Leslie Korenda, MPH Research Manager Deloitte Center for Health Solutions Deloitte Services LP [email protected]
Project team
Andreea Balan-Cohen helped with the research design, interpretation of the findings, writing, and editing. Claire Cruse helped interpret research findings, conducted secondary research, and contributed to the writing. Bushra Naaz and Wendell Miranda conducted secondary research. Sonal Shah helped with project management and interpreting the findings.
Acknowledgments
Thank you to Andreea Balan-Cohen, Sonal Shah, and Sarah Thomas for their leadership throughout the project.
The authors would also like thank Jonathan Lo, Sam Johnson, Suzanne Whitworth, Jennifer Brown, Chris DeBeers, Chip Newton, Jeffrey Pasqua, Wendy Gerhardt, Lauren Wallace, Amy Hoffmaster, Jessica McCann, and the many others who contributed their ideas and insights to this project.
Deloitte Center for Health Solutions To learn more about the Deloitte Center for Health Solutions, please visit www.deloitte.com/centerforhealthsolutions.
Sarah Thomas, MS Managing Director Deloitte Center for Health Solutions Deloitte Services LP [email protected]
Email: [email protected] Web: www.deloitte.com/centerforhealthsolutions Twitter: @DeloitteHealth
To download a copy of this report, please visit www.deloitte.com/us/hospital-margins.levisit XXXXXX
The uncertain road ahead: Could technology offer hospitals relief from increasing margin pressures?
16
Endnotes
1. Deloitte Center for Health Solutions, “Deloitte 2017 Survey of US Health System CEOs: Moving forward in an uncertain environment,” https://www2.deloitte.com/content/dam/Deloitte/us/Documents/life-sciences-health-care/us-lshc-ceo-medicaid-reimbursement.pdf.
2. American Hospital Association Resource Center Blog, “FORECASTING: Hospital payer mix 2014 and 2024, U.S.,” May 2, 2016, https://aharesourcecenter.wordpress.com/2016/05/02/forecasting-hospital-payer-mix-2014-and-2024-u-s/.
3. Ibid.
4. Jennifer M. Ortman, Victoria A. Velkoff, and Howard Hogan, “An Aging Nation: The Older Population in the United States Population Estimates and Projection,” United States Census Bureau, May 2014.
5. Tamara Hayford, Lyle Nelson, and Alexia Diorio, “Projecting Hospitals’ Profit Margins Under Several Illustrative Scenarios,” Working Paper Series Congressional Budget Office, September 2016, https://www.cbo.gov/system/files/115th-congress-2017-2018/costestimate/52849-hr1628senate.pdf.
6. Ibid.
7. Bureau of Labor Statistics, “Employment Projections: 2014-24 Summary,” December 8, 2015, https://www.bls.gov/news.release/ecopro.nr0.htm.
8. Data from American Hospital Association Annual Chartbook, 2016, Accessed October 10, 2017, http://www.aha.org/research/reports/tw/chartbook/2016/table5-9.pdf.
9. Jennifer M. Ortman, Victoria A. Velkoff, and Howard Hogan, “An Aging Nation: The Older Population in the United States Population Estimates and Projection,” United States Census Bureau, May 2014.
10. Rebecca Grant, “The U.S. Is Running Out of Nurses,” The Atlantic, February 3, 2016, https://www.theatlantic.com/health/archive/2016/02/nursing-shortage/459741/.
11. Tamara Hayford, Lyle Nelson, and Alexia Diorio, “Projecting Hospitals’ Profit Margins Under Several Illustrative Scenarios,” Working Paper Series Congressional Budget Office, September 2016, https://www.cbo.gov/system/files/115th-congress-2017-2018/costestimate/52849-hr1628senate.pdf.
12. Congressional Budget Office, “Longer-Term Effects of the Better Care Reconciliation Act of 2017 on Medicaid Spending,” June 2017, https://www.cbo.gov/publication/52859.
13. America’s Essential Hospitals, “Analysis of Medicaid DSH Provisions in Graham-Cassidy-Heller-Johnson Plan,” September 20, 2017, https://essentialhospitals.org/policy/analysis-medicaid-dsh-provisions-graham-cassidy-heller-johnson-plan/.
14. Fitch Ratings Press Release, “US Senate Bill a Risk for Governments, Health Providers,” June 26, 2017, https://www.fitchratings.com/site/pr/1025693.
15. Tamara Hayford, Lyle Nelson, and Alexia Diorio, “Projecting Hospitals’ Profit Margins Under Several Illustrative Scenarios,” Working Paper Series Congressional Budget Office, September 2016, https://www.cbo.gov/sites/default/files/114th-congress-2015-2016/workingpaper/51919-Hospital-Margins_WP.pdf.
16. Organisation for Economic Co-operation and Development, “Defining and Measuring Productivity,” https://www.oecd.org/std/productivity-stats/40526851.pdf.
17. Tamara Hayford, Lyle Nelson, and Alexia Diorio, “Projecting Hospitals’ Profit Margins Under Several Illustrative Scenarios,” Working Paper Series Congressional Budget Office, September 2016, https://www.cbo.gov/sites/default/files/114th-congress-2015-2016/workingpaper/51919-Hospital-Margins_WP.pdf.
18. Data from American Hospital Association Annual Chartbook, 2016.
19. Rebecca Grant, “The U.S. Is Running Out of Nurses,” The Atlantic, February 3, 2016, https://www.theatlantic.com/health/archive/2016/02/nursing-shortage/459741/.
20. Jennifer M. Ortman, Victoria A. Velkoff, and Howard Hogan, “An Aging Nation: The Older Population in the United States Population Estimates and Projection,” United States Census Bureau, May 2014.
21. Cheryl Bland Jones and Michael Gates, “The Costs and Benefits of Nurse Turnover: A Business Case for Nurse Retention,” OJIN: The Online Journal of Issues in Nursing. Vol. 12 No. 3, Manuscript 4, September 2007, http://www.nursingworld.org/ANAMarketplace/NurseRetention.html.
22. Dan Housman, “Robotic process automation in healthcare,” HIT Leaders and News, https://us.hitleaders.news/robotic-process-automation-in-healthcare/.
23. Cross CHX, https://crosschx.com/, Accessed October 12, 2017.
24. Mary Lacity and Leslie Willcocks, “Robotic Process Automation: The Next Transformation Lever for Shared Services,” The Outsourcing Unit Working Research Paper Series, January 2016, http://www.umsl.edu/~lacitym/OUWP1601.pdf.
25. Stephanie Overby, ”Why automation doubles IT outsourcing cost saving,” CIO, September 30, 2016, http://www.cio.com/article/3126150/it-industry/why-automation-doubles-it-outsourcing-cost-savings.html.
26. NSI Nursing Solutions, Inc., “2016 National Healthcare Retention & RN Staffing Report,” http://www.nsinursingsolutions.com/Files/assets/library/retention-institute/NationalHealthcareRNRetentionReport2016.pdf.
27. Agency for Healthcare Research and Quality, “Hospital Survey on Patient Safety Culture: 2016 User Comparative Database Report,” March 2016, https://www.ahrq.gov/sites/default/files/wysiwyg/professionals/quality-patient-safety/patientsafetyculture/hospital/2016/2016_hospitalsops_report_pt1.pdf.
28. Burroughs Healthcare Network, “How HCA Keeps Labor Costs Under Control,” September 2016, https://burroughshealthcare.com/2016/09/14/help-wanted-how-hca-keeps-labor-costs-under-control/.
The uncertain road ahead: Could technology offer hospitals relief from increasing margin pressures?
17
29. Jerry Bruno, Sam Johnson, and Josh Hesley, “Robotic Disruption and the New Revenue Cycle,” Healthcare Financial Management Association, September 2017, https://www.hfma.org/Content.aspx?id=55353##, Accessed September 20, 2017.
30. Deloitte Center for Health Solutions, “Understanding the next wave of Medicare enrollees,” 2017.
31. Laurence C. Baker, M. Kate Bundorf, Aileen M. Devlin, and Daniel P. Kessler, “Medicare Advantage Plans Pay Hospitals Less Than Traditional Medicare Pays,” Health Affairs, August 2016 vol. 35 no. 8 1444-1451.
32. Jacqueline Belliveau, “$262B of Total Hospital Charges in 2016 Initially Claim Denials,” RevCycle Intelligence, https://revcycleintelligence.com/news/262b-of-total-hospital-charges-in-2016-initially-claim-denials, Accessed October 1, 2017.
33. Brad Olin, “Denial Management Best Practices for Hospitals,” PMMC Healthcare Revenue Cycle Blog, http://blog.pmmconline.com/blog/denial-management-best-practices-for-hospitals, Accessed October 1, 2017.
34. Tom Sullivan, “Claims denials management tools: Big opportunity for hospitals to automate revenue cycle processes, says HIMSS Analytics,” Healthcare IT News, July 11, 2016, http://www.healthcareitnews.com/news/claims-denials-management-tools-big-opportunity-hospitals-automate-revenue-cycle-processes-says, Accessed October 1, 2017.
35. Centers for Medicare & Medicaid Services, “HCAHPS: Patients’ Perspectives of Care Survey,” https://www.cms.gov/Medicare/Quality-Initiatives-Patient-Assessment-Instruments/HospitalQualityInits/HospitalHCAHPS.html, Accessed October 1, 2017.
36. Deloitte Center for Health Solutions, “The value of patient experience,” 2016, https://www2.deloitte.com/us/en/pages/life-sciences-and-health-care/articles/hospitals-patient-experience.html.
37. HFMA,“Key Strategies for Modernizing the Revenue Cycle,” hfm Magazine: November 2015, https://www.hfma.org/ModRevCycle/?trackref=auto.
38. Brooke Murphy, “6 characteristics of consumer-friendly revenue cycles,” Becker’s Hospital CFO Report, August 3, 2016, http://www.beckershospitalreview.com/finance/6-characteristics-of-consumer-friendly-revenue-cycles.html.
39. Andrew Adams and Kristen Vennum, “10 Steps to Create a Customer-Focused Revenue Cycle,” Becker’s Hospital CFO Report, June 4, 2014, http://www.beckershospitalreview.com/finance/10-steps-to-create-a-customer-focused-revenue-cycle.html.
40. Statement of the American Hospital Association before the Finance Committee of the U.S. Senate, “Medicare Access and CHIP Reauthorization Act of 2015: Ensuring Successful Implementation of Physician Payment Reforms,” July 13, 2016, http://www.aha.org/advocacy-issues/testimony/2016/160713-statement-macra.pdf.
41. Peter S. Hussey, Jodi L. Liu, and Chapin White, “The Medicare Access and CHIP Reauthorization Act: Effects on Medicare Payment Policy and Spending,” Health Affairs, April 2017 vol. 36 no. 4 697-705.
This publication contains general information only and Deloitte is not, by means of this publication, rendering accounting, business, financial, investment, legal, tax, or other professional advice or services. This publication is not a substitute for such professional advice or services, nor should it be used as a basis for any decision or action that may affect your business. Before making any decision or taking any action that may affect your business, you should consult a qualified professional advisor. This publication is solely for educational purposes. This publication should not be deemed or construed to be for the purpose of soliciting business for any of the companies/organizations included in this publication, nor does Deloitte advocate or endorse the services or products provided by these companies/organizations. Deloitte shall not be responsible for any loss sustained by any person who relies on this publication.
About DeloitteDeloitte refers to one or more of Deloitte Touche Tohmatsu Limited, a UK private company limited by guarantee (“DTTL”), its network of member firms, and their related entities. DTTL and each of its member firms are legally separate and independent entities. DTTL (also referred to as “Deloitte Global”) does not provide services to clients. In the United States, Deloitte refers to one or more of the US member firms of DTTL, their related entities that operate using the “Deloitte” name in the United States and their respective affiliates. Certain services may not be available to attest clients under the rules and regulations of public accounting. Please see www.deloitte.com/about to learn more about our global network of member firms.
Copyright © 2017 Deloitte Development LLC. All rights reserved.
About the Deloitte Center for Health SolutionsThe source for fresh perspectives in health care: The Deloitte Center for Health Solutions (DCHS), part of Deloitte LLP s̓ Life Sciences and Health Care practice, looks deeper at the biggest industry issues and provides new thinking around complex challenges. Cutting-edge research and thought-provoking analysis give our clients the insights they need to see things differently and address the changing landscape.