Embed Size (px)
Citation preview
ConfusionContemplation
Confidence
The Tyranny of Statistical Significance Testing
Why I think we should stop quoting P values ...
May 28, 2013
1 / 26
ConfusionContemplation
Confidence
Motivation and Conclusion in one page
P values are frequently abused and more commonlymisunderstood.
As commonly practices, statistical significance testing isflawed.
The ’framework’ of statistical significance testing is uniquelysuited to sow confusion amongst its practicioners (andconsumers).
P values have minimal useful information content and theydon’t answer the questions you want answers to.
2 / 26
ConfusionContemplation
Confidence
Why Focus on Significance Testing? What about the Rest?
In this talk we seemingly only deal with comparing twopopulations, or rather, their means and are trying to find outwhether these measured means stem from different populations.
P values can be determined for many other things:
paired comparisons,
two receiver-operating curves etc.
The mechanics will change but, ultimately, the P value issue andthe statistical significance testing problem remain.
3 / 26
ConfusionContemplation
Confidence
Acknowledgement and Sources
Stang, Poole, Kuss (2010)
The ongoing tyranny of statistical significance testing in biomedicalresearch.
Eur J Epidem 25(4): 225–230.
Goodman (2008)
A dirty dozen: Twelve P-Value Misconceptions.
Sem Hemat 45: 135–140.
Gigerenzer (2004).
The Null Ritual: What You Always Wanted to Know About SignificanceTesting but Were Afraid to Ask.
published in: D.Kaplan (Ed.) 2004 The Sage Handbook of quant. method.for the social sciences (pp. 391–408)
Goodman (1999)
Toward Evidence-Based Medical Statistics. 1: The P Value Fallacy.Toward Evidence-Based Medical Statistics. 2: The Bayes Factor.
Ann Intern Med 130: 995–1013.4 / 26
ConfusionContemplation
Confidence
What is a P Value?
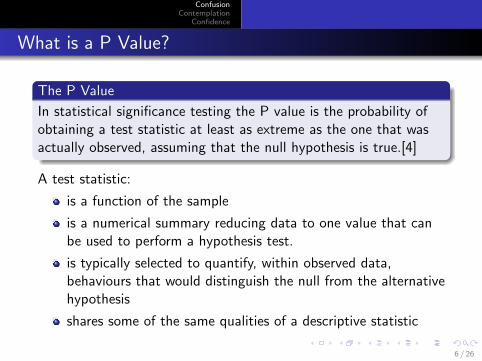
The P Value
In statistical significance testing the P value is the probability ofobtaining a test statistic at least as extreme as the one that wasactually observed, assuming that the null hypothesis is true.[4]
A test statistic:
is a function of the sample
is a numerical summary reducing data to one value that canbe used to perform a hypothesis test.
is typically selected to quantify, within observed data,behaviours that would distinguish the null from the alternativehypothesis
shares some of the same qualities of a descriptive statistic
5 / 26
ConfusionContemplation
Confidence
What is a P Value?
The P Value
In statistical significance testing the P value is the probability ofobtaining a test statistic at least as extreme as the one that wasactually observed, assuming that the null hypothesis is true.[4]
A test statistic:
is a function of the sample
is a numerical summary reducing data to one value that canbe used to perform a hypothesis test.
is typically selected to quantify, within observed data,behaviours that would distinguish the null from the alternativehypothesis
shares some of the same qualities of a descriptive statistic
6 / 26
ConfusionContemplation
Confidence
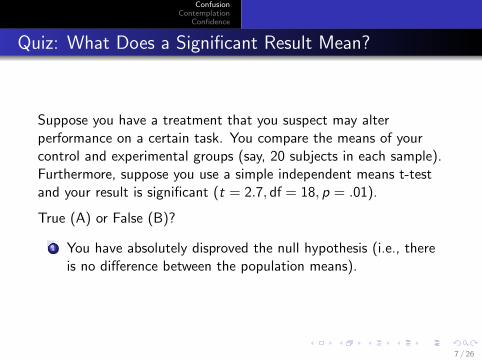
Quiz: What Does a Significant Result Mean?
Suppose you have a treatment that you suspect may alterperformance on a certain task. You compare the means of yourcontrol and experimental groups (say, 20 subjects in each sample).Furthermore, suppose you use a simple independent means t-testand your result is significant (t = 2.7, df = 18, p = .01).
True (A) or False (B)?
1 You have absolutely disproved the null hypothesis (i.e., thereis no difference between the population means).
7 / 26
ConfusionContemplation
Confidence
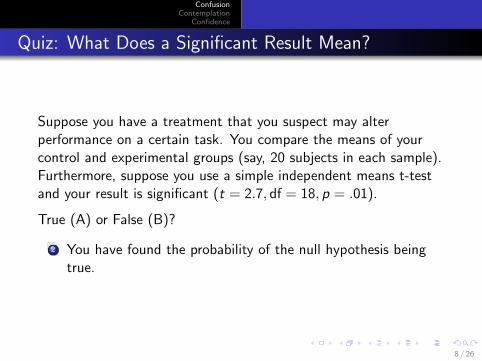
Quiz: What Does a Significant Result Mean?
Suppose you have a treatment that you suspect may alterperformance on a certain task. You compare the means of yourcontrol and experimental groups (say, 20 subjects in each sample).Furthermore, suppose you use a simple independent means t-testand your result is significant (t = 2.7, df = 18, p = .01).
True (A) or False (B)?
2 You have found the probability of the null hypothesis beingtrue.
8 / 26
ConfusionContemplation
Confidence
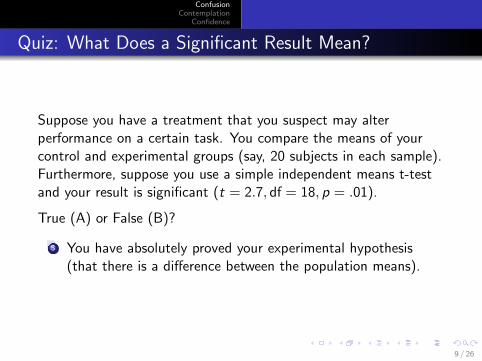
Quiz: What Does a Significant Result Mean?
Suppose you have a treatment that you suspect may alterperformance on a certain task. You compare the means of yourcontrol and experimental groups (say, 20 subjects in each sample).Furthermore, suppose you use a simple independent means t-testand your result is significant (t = 2.7, df = 18, p = .01).
True (A) or False (B)?
3 You have absolutely proved your experimental hypothesis(that there is a difference between the population means).
9 / 26
ConfusionContemplation
Confidence
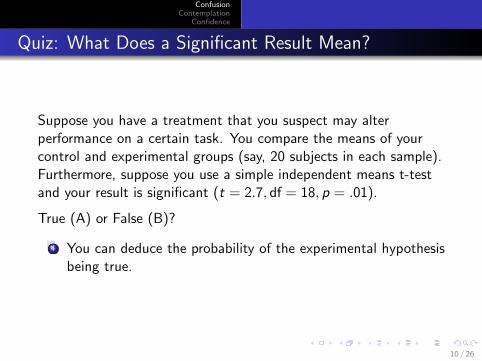
Quiz: What Does a Significant Result Mean?
Suppose you have a treatment that you suspect may alterperformance on a certain task. You compare the means of yourcontrol and experimental groups (say, 20 subjects in each sample).Furthermore, suppose you use a simple independent means t-testand your result is significant (t = 2.7, df = 18, p = .01).
True (A) or False (B)?
4 You can deduce the probability of the experimental hypothesisbeing true.
10 / 26
ConfusionContemplation
Confidence
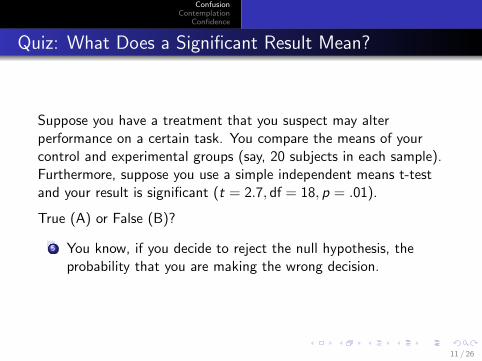
Quiz: What Does a Significant Result Mean?
Suppose you have a treatment that you suspect may alterperformance on a certain task. You compare the means of yourcontrol and experimental groups (say, 20 subjects in each sample).Furthermore, suppose you use a simple independent means t-testand your result is significant (t = 2.7, df = 18, p = .01).
True (A) or False (B)?
5 You know, if you decide to reject the null hypothesis, theprobability that you are making the wrong decision.
11 / 26
ConfusionContemplation
Confidence
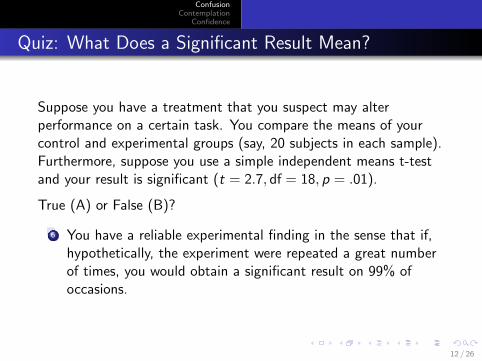
Quiz: What Does a Significant Result Mean?
Suppose you have a treatment that you suspect may alterperformance on a certain task. You compare the means of yourcontrol and experimental groups (say, 20 subjects in each sample).Furthermore, suppose you use a simple independent means t-testand your result is significant (t = 2.7, df = 18, p = .01).
True (A) or False (B)?
6 You have a reliable experimental finding in the sense that if,hypothetically, the experiment were repeated a great numberof times, you would obtain a significant result on 99% ofoccasions.
12 / 26
ConfusionContemplation
Confidence
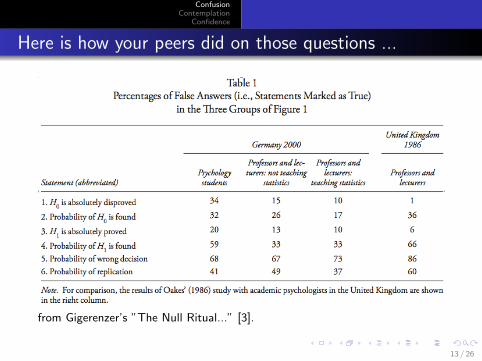
Here is how your peers did on those questions ...
from Gigerenzer’s ”The Null Ritual...” [3].
13 / 26
ConfusionContemplation
Confidence
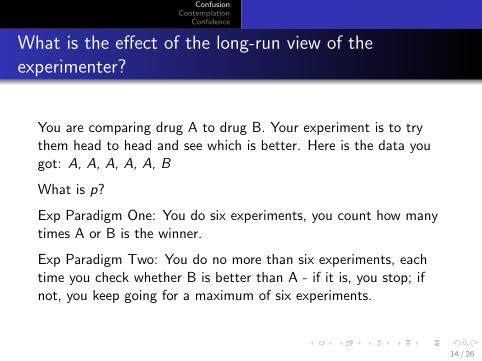
What is the effect of the long-run view of theexperimenter?
You are comparing drug A to drug B. Your experiment is to trythem head to head and see which is better. Here is the data yougot: A, A, A, A, A, B
What is p?
Exp Paradigm One: You do six experiments, you count how manytimes A or B is the winner.
Exp Paradigm Two: You do no more than six experiments, eachtime you check whether B is better than A - if it is, you stop; ifnot, you keep going for a maximum of six experiments.
14 / 26
ConfusionContemplation
Confidence
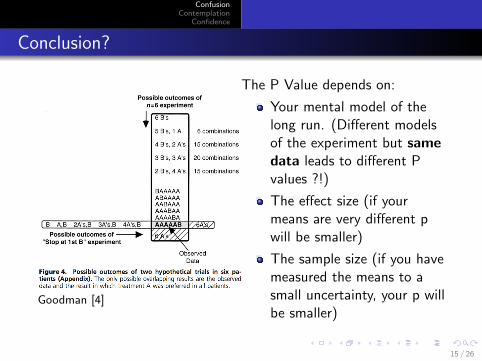
Conclusion?
Goodman [4]
The P Value depends on:
Your mental model of thelong run. (Different modelsof the experiment but samedata leads to different Pvalues ?!)
The effect size (if yourmeans are very different pwill be smaller)
The sample size (if you havemeasured the means to asmall uncertainty, your p willbe smaller)
15 / 26
ConfusionContemplation
Confidence
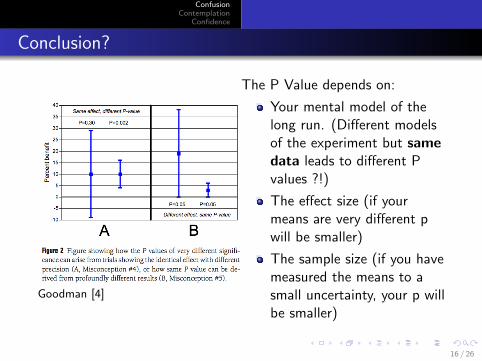
Conclusion?
Goodman [4]
The P Value depends on:
Your mental model of thelong run. (Different modelsof the experiment but samedata leads to different Pvalues ?!)
The effect size (if yourmeans are very different pwill be smaller)
The sample size (if you havemeasured the means to asmall uncertainty, your p willbe smaller)
16 / 26
ConfusionContemplation
Confidence
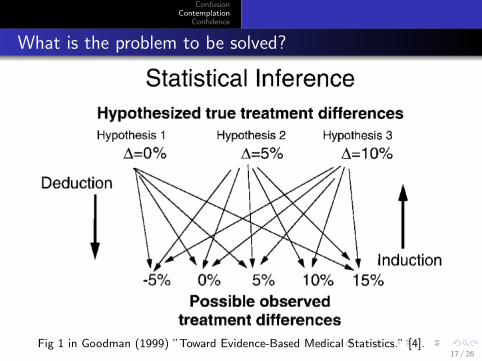
What is the problem to be solved?
Fig 1 in Goodman (1999) ”Toward Evidence-Based Medical Statistics.” [4].17 / 26
ConfusionContemplation
Confidence
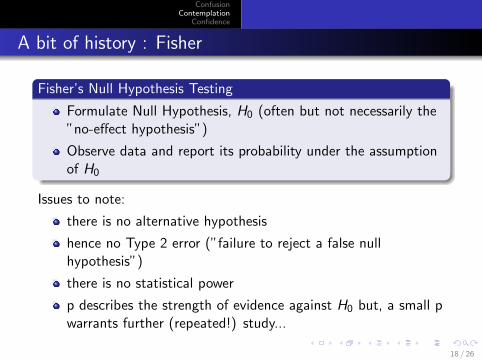
A bit of history : Fisher
Fisher’s Null Hypothesis Testing
Formulate Null Hypothesis, H0 (often but not necessarily the”no-effect hypothesis”)
Observe data and report its probability under the assumptionof H0
Issues to note:
there is no alternative hypothesis
hence no Type 2 error (”failure to reject a false nullhypothesis”)
there is no statistical power
p describes the strength of evidence against H0 but, a small pwarrants further (repeated!) study...
18 / 26
ConfusionContemplation
Confidence
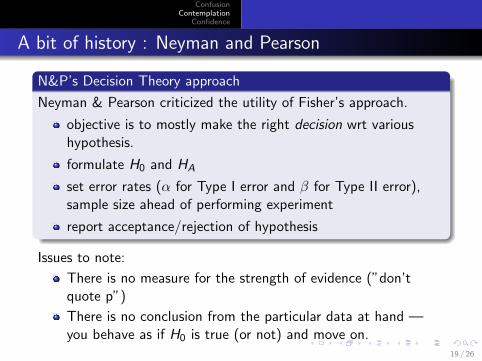
A bit of history : Neyman and Pearson
N&P’s Decision Theory approach
Neyman & Pearson criticized the utility of Fisher’s approach.
objective is to mostly make the right decision wrt varioushypothesis.
formulate H0 and HA
set error rates (α for Type I error and β for Type II error),sample size ahead of performing experiment
report acceptance/rejection of hypothesis
Issues to note:
There is no measure for the strength of evidence (”don’tquote p”)
There is no conclusion from the particular data at hand —you behave as if H0 is true (or not) and move on.
19 / 26
ConfusionContemplation
Confidence
A bit of history: The Unholy Mix
The methods by Fisher and by Neyman/Pearson
are individually sound but don’t (and can’t) fulfil the desire ofinferring truth from one experiment.
are not compatible, but have been mixed (around 1940 AD)into an incoherent framework posing as a unified receivedmethod (aka ”The Tyranny of Statistical SignificanceTesting”)
20 / 26
ConfusionContemplation
Confidence
What alternatives to SST are there? Feeling cheated bytoday’s talk?
What is an honest, well meaning researcher to do?
”[...] appreciate [...] that there is no number generated bystandard methods that tells us the probability that a givenconclusion is right or wrong.[...] The second principle is that thesize of an effect matters, and that the entire confidence intervalshould be considered as an experiments result, more so than the Pvalue or even the effect estimate. ” Goodman[2]
Present your work using
confidence intervals
show me the data
Bayes Factor (= Likelihood Ratio)
21 / 26
ConfusionContemplation
Confidence
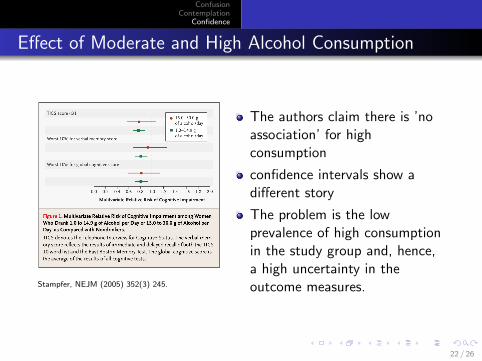
Effect of Moderate and High Alcohol Consumption
Stampfer, NEJM (2005) 352(3) 245.
The authors claim there is ’noassociation’ for highconsumption
confidence intervals show adifferent story
The problem is the lowprevalence of high consumptionin the study group and, hence,a high uncertainty in theoutcome measures.
22 / 26
ConfusionContemplation
Confidence
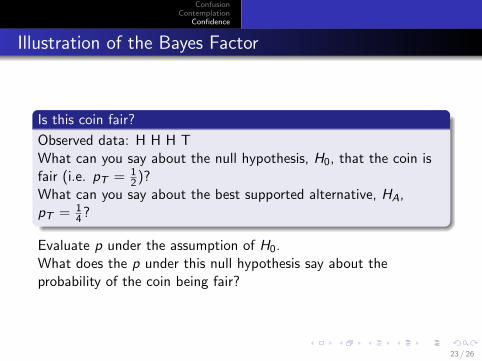
Illustration of the Bayes Factor
Is this coin fair?
Observed data: H H H TWhat can you say about the null hypothesis, H0, that the coin isfair (i.e. pT = 1
2 )?What can you say about the best supported alternative, HA,pT = 1
4 ?
Evaluate p under the assumption of H0.What does the p under this null hypothesis say about theprobability of the coin being fair?
23 / 26
ConfusionContemplation
Confidence
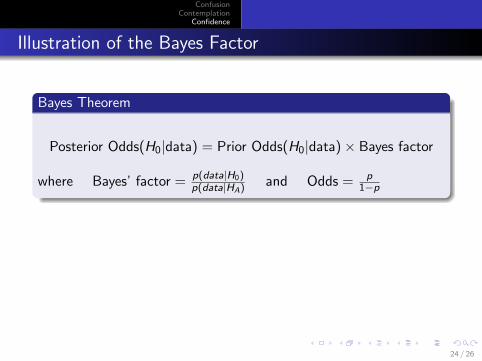
Illustration of the Bayes Factor
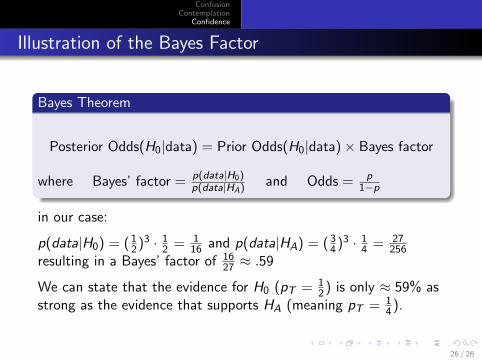
Bayes Theorem
Posterior Odds(H0|data) = Prior Odds(H0|data)× Bayes factor
where Bayes’ factor = p(data|H0)p(data|HA) and Odds = p
1−p
in our case:
p(data|H0) = ( 12 )3 · 1
2 = 116 and p(data|HA) = ( 3
4 )3 · 14 = 27
256resulting in a Bayes’ factor of 16
27 ≈ .59
We can state that the evidence for H0 (pT = 12 ) is only ≈ 59% as
strong as the evidence that supports HA (meaning pT = 14 ).
24 / 26
ConfusionContemplation
Confidence
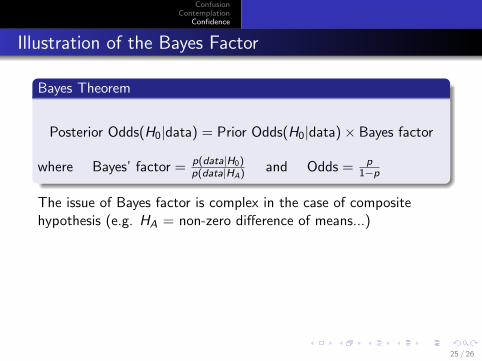
Illustration of the Bayes Factor
Bayes Theorem
Posterior Odds(H0|data) = Prior Odds(H0|data)× Bayes factor
where Bayes’ factor = p(data|H0)p(data|HA) and Odds = p
1−p
The issue of Bayes factor is complex in the case of compositehypothesis (e.g. HA = non-zero difference of means...)
in ourcase:
p(data|H0) = ( 12 )3 · 1
2 = 116 and p(data|HA) = ( 3
4 )3 · 14 = 27
256resulting in a Bayes’ factor of 16
27 ≈ .59
We can state that the evidence for H0 (pT = 12 ) is only ≈ 59% as
strong as the evidence that supports HA (meaning pT = 14 ).
25 / 26
ConfusionContemplation
Confidence
Illustration of the Bayes Factor
Bayes Theorem
Posterior Odds(H0|data) = Prior Odds(H0|data)× Bayes factor
where Bayes’ factor = p(data|H0)p(data|HA) and Odds = p
1−p
in our case:
p(data|H0) = ( 12 )3 · 1
2 = 116 and p(data|HA) = ( 3
4 )3 · 14 = 27
256resulting in a Bayes’ factor of 16
27 ≈ .59
We can state that the evidence for H0 (pT = 12 ) is only ≈ 59% as
strong as the evidence that supports HA (meaning pT = 14 ).
26 / 26