Embed Size (px)
Citation preview

2005
QATAR CENTRAL BANK Department of Economic Policies
The Twenty Ninth
Annual Report

Department of Economic PoliciesQatar Central Bank
P.O.Box: 1234, Doha-QatarTel.: +(974) 4456456 - Facsimile : +(974) 4416771
[email protected]: www.qcb.gov.qa
For Correspondence& Inquiries:

Serial Number of Qatar National Library: 6-2004 ISBN: 99921-26-70-1
May 2007

Qatar Central Bank4

In the name of God
The Most Merciful,
The Most Compassionate

Qatar Central Bank6

H.H. SHEIKHHamad Bin Khalifa Al Thani
AMIR OF THE STATE OF QATAR

Qatar Central Bank8

H.H. SHEIKHTamim Bin Hamad Bin Khalifa Al Thani
HEIR APPARENT

Qatar Central Bank10

Foreword
Qatar Central Bank (QCB) is pleased to publish its Twenty Ninth Annual Report. In
general, this issue of QCB Annual Report presents major facts and figures that cover the
most important economic developments, focusing, in particular, on banking system
developments during 2005.
The growth of the Qatari economy, expressed by the annual nominal rate of growth
in GDP, continued its vigor in 2005, albeit at slower pace than that of 2004, reaching
33.8% in 2005 vis-à-vis 34.8% in 2004.
The Oil and Gas sector, as well as the non-oil-non-gas (NONG) sectors, have all
contributed to the growth realized in 2005. However, the oil and gas sector grew by
46.3%, while the NONG sectors grew by 18.8% only, both in nominal terms. This
nominal growth was associated with both internal and external balance surpluses. On
one hand, the Government Budget realized a surplus for the sixth consecutive year,
reaching 9.2% of GDP in 2005 vis-à-vis 16.4% in 2004. On the other hand, the Current
Account continued its surplus position for the seventh consecutive year, rising in 2005 to
25.2% of GDP, vis-à-vis 23.8% in 2004.
In light of QCB commitment to fixed parity of the Qatari Riyal (QR) against the US
dollar and the resultant link between QR-interest rates and USD-interest rates; the
continuous expansion of government expenditures on developmental and infrastructural
projects, the slowdown of private capital outflows and the inflows of repatriating some
capital to invest either in financing domestic projects or to speculate in the securities and
other assets markets; it was a natural outcome for the growth in domestic liquidity (M2)
to accelerate from 20% in 2004 to 43% in 2005, exceeding by far the nominal growth
rates in GDP and non-oil-non-gas GDP, which were 33.8% and 18.8%, respectively.
Logically, this acceleration led to higher domestic inflationary pressures, and pushed the
core inflation rate (excludes the rent component from CPI) up to 4.39% by the end of
2005.
At the monetary policy level, QCB continued to realize its major goals of
maintaining the stability of the QR peg and sustaining the monetary and financial
stability. Furthermore, QCB continued to manage interest rates in such a way that
supports monetary and financial stability via absorbing excess liquidity and fighting
inflationary pressures and serves the needs of sustainable economic development. The
coverage ratio of QCB net foreign assets to currency issued at the end of 2005 reached
471.3% vis-à-vis 391.7% end-2004.

Within QCB role of supervision and oversight of the banking sector, QCB has
continued in 2005 to emphasize banks' compliance with its prudential instructions and
adherence to the sound banking and financial practices along the lines of the latest
developments in the international standards, especially the Basel II accord on capital
adequacy, effective January 2006.
The current economic boom has reflected favorably on the activities of the banking
sector. Commercial banks continued to realize steady and firm growth in providing their
banking services, and introduced new banking products to meet the needs of their
clients, which reflected positively on their 2005 financial indicators, such as growing
total assets by 41.6% by the end of 2005 vis-à-vis 20.9% end-2004. Whereas the main
activities of commercial banks, i.e., accepting deposits and extending credit; grew by
40.5% end-2005 vis-à-vis 14.8% end-2004; and by 40.9% end-2005 vis-à-vis 13%
end-2004, respectively. A quick glance on the indicators of banking sector performance
in 2005 reveals that the profitability (net returns on shareholders' equity) of the banking
sector have exceeded the 2004 level, reaching 28.5% end-2005 vis-à-vis 20.9%
end-2004. Banks have continued to maintain high ratios of capital adequacy, reaching
24.8% end-2005, well above the minimum ratio of 10% required by QCB.
QCB is honored to pay great thanks with highest respect to His Highness the Amir
Sheikh Hamad Bin Khalifa Al Thani, His Highness the Heir Apparent and His Highness
the Prime Minister for the continuous support extended to QCB. The QCB also
expresses its gratitude and appreciation to all Government agencies, banks and financial
institutions operating in Qatar and acknowledges their valuable contribution towards the
issuance of this report.
Governor
Abdulla Bin Saud Al Thani

QATAR CENTRAL BANKThe Bank Organization Chart
BOARD OFDIRECTORS
GOVERNOR
DEPUTYGOVERNOR
INTERNAL AUDITUNIT
LEGAL AFFAIRSUNIT
BANKING SYSTEMDept.
BANKINGCONSUMERS’SERVICE UNIT
Dept. OfEconomic Policies
Dept. Of Pub.Debt, Banking Aff.
& Issuing
Dept. OfBanking
Supervision
Dept. OfInvestment
Dept. OfAdmin. &
Financial Affairs
QATAR CENTRAL BANKOrganization Chart

Qatar Central Bank14
Section One: The Real Economy………………………………………………………………
Chapter One: Gross Domestic Product (GDP) ……………………………………
• Overall Product ………………………………………………………………………
• Oil and Gas Sector ……………………………………………………………………
• Non-oil-non-gas Sectors ……………………………………………………………
• Sectoral Analysis of non-oil-non-gas GDP ……………………………………
Chapter Two: Prices and the Labor Force …………………………………………....
• Price Levels …………………………………………………………………………......
• The Labor Force………………………………………………………………………..
Chapter Three: Public Finance…………………………………………………………..
• Government Budget for FY 2005/2006……………………………………….....
• Estimated Budget for FY 2006/2007 …………………………………………....
Section Two: Banking, Financial Sector and the Balance of Payments………...
Chapter Four: The Banking Sector…………………………………………………......
• Domestic Liquidity Developments………………………………………………..
• Qatar Central Bank……………………………………………………………………
• Commercial Banks……………………………………………………………………
• Criteria of Banks' Performance………………………………………………….....
Chapter Five: The Financial Sector…………………………………………………......
• Qatar Industrial Development Bank……………………………………………...
• Exchange Companies……………………………………………………………........
• Finance Companies……………………………………………………………………
• Investment Companies…………………………………………………………….....
• Insurance Companies……………………………………………………………........
• Doha Securities Market (DSM)……………………………....................…………
Chapter Six: Foreign Trade and the Balance of Payments……….....……………
• Classification of Imports by Major Economic Groups…………...…………
• QR Exchange Rate……………………………………………………………………
• The Balance of Payments……………................................…………………………
The Twenty Ninth Annual ReportContents ...
17
19
21
21
22
25
35
35
38
41
41
43
45
47
47
54
61
73
79
79
80
82
83
84
87
93
93
99
101

Qatar Central Bank16
The Real Economy
Section I
1Chapter OneGross Domestic Product
2Chapter TwoPrices and the Labor Force
3Chapter ThreePublic Finance

Qatar Central Bank18

Twenty Ninth Annual Report 19
1ChapterOneGross Domestic Product
The Gross Domestic Product of the State of Qatar recorded a new high in 2005.
Several developments, both domestic and international, have contributed to its high
growth during the year.
Geopolitical tensions in the Middle East Region -especially in the Gulf region- such
as the ongoing war in Iraq, and the tensions arising from the standoff on Iran's nuclear
issue; and natural disasters; all led the international oil markets to a 40% price hike.
The above developments reflected positively on Qatar GDP growth results in 2005;
especially the hydrocarbon sector.
At the domestic level, several factors interacted. especially are those coming from
the government's fiscal side and the banking industry. The banking industry experienced
an unprecedented expansion in the various forms of financial intermediation. The public
expenditure increased by 32% in 2005, while the domestic liduidity increased by 43%.
Banking credit extended to the domestic private sector during 2005 grew by 63%.
All in all, the accumulated effects exerted by these developments have in fact been
responsible for what the Qatari GDP has reached in 2005. The unprecedented growth
rate of GDP in current prices, which exceeded 33% for 2005 and the phenomenal growth
of 13.1% in real terms (in the non-oil-non-gas GDP sectors), which came out higher than
the 8.6% achieved in Asia and the 5.9% achieved in the Middle Eastern countries in
2005, were not possible to be achieved without these developments.
In the following subheadings, a more detailed discussion of what these
developments in the Qatari GDP have been in 2005.

Qatar Central Bank20
02001 2002 2003 2004 2005
2
4
6
8%
WorldAdvanced EconomiesDeveloping CountriesMiddle & Eastern Europe
BOX (1)
World Economic Growth
World real economic rate of growth decreased to 4.8% in 2005 compared with 5.3% in 2004,
but was still a bit higher than the 4.1% rate of growth in 2003. The US economy grew by 3.5%
in 2005 compared with 4.2% in 2004, Japan’s economy has expanded by 2.7% compared with
2.3% in 2004, while the Euro Zone rate of economic growth has decreased to 1.3% in 2005
compared with 2.1% a year earlier.
The developing economies as a whole realized an average rate of growth of 7.2% compared
with 7.6% in 2004. The economic rate of growth in the regional groups of Asia, Africa, South
America, have decelerated, while increased in the Middle East as shown in the table below:
World Real GDP Growth Rates (2001-2005)
2005
4.8
2.7
3.5
2.7
1.3
7.2
5.2
8.6
5.9
4.3
5.3
2004
5.3
3.3
4.2
2.3
2.1
7.6
5.5
8.8
5.4
5.6
6.5
2003
4.1
2.0
2.7
1.8
0.7
6.7
4.6
8.4
6.6
2.2
4.7
2002
3.1
1.6
1.6
-0.1
0.9
5.1
3.6
7.0
4.3
-
4.4
2001
2.6
1.2
0.8
0.4
1.9
4.4
4.2
6.1
3.2
0.5
0.3
Item
World
Advanced Economies
USA
Japan
Euro Zone
Developing Countries
Africa
Asia
The Middle East
Half Western World
Middle & East Europe
(%)
Source: IMF, World Economic Outlook, April 2004.

Twenty Ninth Annual Report 21
Gross Domestic Product (GDP):
Nominal GDP for the state of Qatar has maintained a fast pace of growth for the past
few years. However, this pace in 2005 seems a little slower than 2004. GDP rose from
QR 115.51 billion in 2004 to QR 154.56 billion, in 2005, that is a growth of 33.8%
compared with 34.8% in 2004.
Table No (1-1) indicates that real GDP in Qatar has grown in 2005 at the rate of
6.1% vis-à-vis 20.8% in the previous year. This is due to Qatar's honoring its
commitment to the OPEC decision not to raise production during 2005 and adhering to
this share during 2005. Thus, Qatar's oil and gas production did not increase in 2005.
The Oil and Gas Sector:
The oil and gas sector grew faster in 2005 than
it did in 2004 and 2003. The growth rate realized in
2005 came to almost twice that achieved in 2004,
which was almost equal to growth rate achieved in
2003. Oil and gas sector output (in current prices)
reached QR 92.1 billion in 2005. That is an
increase of QR 29.1 billion, or 46.3%, from its level
in 2004. Most of this increase was the result of
rising price of oil on the international markets.
These developments in the oil and gas sector
during 2005 led to increasing its relative share of
overall GDP in current prices by 5.1 percentage
points, to become approximately 60%, representing
the highest record during the last five years.
Table No (1-1)
Developments in Gross Domestic Product Bi-Sectoral Classification
Oil and Gas Sector
Relative Share %
Rate of Growth %
Non-oil-non-gas Sectors
Relative Share %
Rate of Growth %
TOTAL
(Y-o-Y) Rate of Growth %
2004 2005Items
GDP in ConstantPrices of 2001
62,922
54.5
24.5
52,590
45.5
49.8
115,512
34.8
92,071
59.6
46.3
62,493
40.4
18.8
154,564
33.8
47,765
55.8
18.0
37,759
44.2
24.6
85,524
20.8
48,032
52.9
0.6
42,694
47.1
13.1
90,726
6.1
Million QRGDP in Current
Prices
2004 2005
0
20
40
60
80
100
120
140
160Billion QR
Non-OilOil and Gas
2001 2002 2003 2004 2005
Figure (1-1)
Gross Domestic Product

Qatar Central Bank22
On the other hand, the increase of oil and gas output (in real terms) came very close
to a mere QR 267 million, or 0.6%, that is a clear indicator of the real rate of growth in
this sector. This clearly reveals the fact that the real rate of growth in the volume or
quantities of production in this sector did not exceed 1%, and that the remaining nominal
increase, which surpassed 46%, is attributed to the price increases that took place in
2005.
These developments led to the decreasing relative importance of this sector's real
output to GDP (in real terms) by 3 percentage points, i.e., from 55.8% in 2004 to 52.9%
in 2005.
Non-Oil and Non-Gas (NONG) Sectors:
The growth of these sectors experienced relative slowing down in 2005, achieving a
rise of QR 9.9 billion, or 18.8%, vis-à-vis a rise by 49.8% in 2004, reaching QR 62.5
billion by the end-2005, vis-à-vis QR 52.6 billion by end-2004. Thus, its contribution to
the growth of nominal GDP shrank to 25.4% in 2005, vis-à-vis 58.6% in 2004. All
NONG sectors contributed positively to the increase in nominal GDP, except for the
service sector which experienced a decline in its output during 2005.
On the other hand, the real rate of growth in the output of NONG sectors grew by
13.1% in 2005 vis-à-vis 24.6% in 2004. However, its relative share in the overall growth
of real GDP has leaped to account for 94.9% during 2005 vis-à-vis 50.5% in 2004. The
real sector of the economy was characterized by the fact that all of its sub-sectors have
achieved positive rates of growth in 2005, except for the Agriculture and Fishing which
maintained their previous levels of output unchanged.
Table No (1-2)
Relative Contributions to GDP Growth
Oil and Gas Sector
Relative Share in Total Growth of GDP%
NONG Sectors
Relative Share in Total Growth of GDP%
Overall Increase in GDP
Nominal RealRealized Increase in:
2005
12,371
41.45
17,478
58.55
29,849
7,297
49.49
7,446
50.51
14,743
29,149
74.64
9,903
25.36
39,052
267
5.13
4,935
94.87
5,202
Million QR
2004
Nominal Real

Twenty Ninth Annual Report 23
Source: The Planning Council.
Viewing the NONG sectors by the nature of their output, one can observe that the
nominal growth in the commodity-producing sectors was slower, while their real growth
accelerated during 2005. Meanwhile, the output of the commodity-producing sectors
grew by more than QR 4.0 billion, or 20.4%, vis-à-vis 59.5% in 2004, reaching an added
value of QR 24.2 billion and representing 38.73% in relative share of nominal NONG
GDP and contributing 41.39% of the nominal growth that the NONG GDP realized in
2005.
In real terms, real output of the commodity-producing sectors grew by QR 2.7
billion (in base-year prices of 2001) or 25.2%, vis-à-vis 8.2% in 2004, reaching an added
value of QR 13.6 billion, and representing 31.90% of the NONG GDP against 28.80%
in 2004, and contributing 55.62% to the overall real growth that the NONG GDP
realized in 2005.
Table No (1-3)
Developments in Non-oil-non-gas GDP
Production Sector
The Relative Share in NOG-GDP%
Rate of Growth %
Service Sector
The Relative Share in NOG-GDP%
Rate of Growth %
NONG –GDP Sectors
Rate of Growth %
2004 2005Items
Real
20,112
38.24
59.5
32,478
61.76
44.40
52,590
49.8
24,211
38.73
20.4
38,282
61.24
17.90
62,493
18.8
10,874
28.80
8.20
26,885
71.20
32.70
37,759
24.6
13,619
31.90
25.20
29,075
68.10
8.10
42,694
13.1
Million QR
Nominal
2004 2005
Table No (1-4)
Relative Contributions to Growth in Non-oil-non-gas GDP
Commodity Production Sectors
Relative Share in Total Sector %
Service Sectors*
Relative Share in Total Sector %
Total growth in NONG Sectors
Nominal RealRealized Growth in:
2005
7,499
42.91
9,979
57.09
17,478
828
11.12
6,618
88.88
7,446
4,099
41.4
5,804
58.61
9,903
2,745
55.62
2,190
44.38
4,935
Million QR
2004
Nominal Real
* Service sectors include: productive services sector, social services sector. The first includes: trade, hotels andrestaurants, transportation and communications, finance and insurance sector, real-estate sector, financialservices and business sector. The social services sector include: governmental services, opportunity costfinancial services, social services, housekeeping services, and import duties.
Commodity Production Sectors Includes Agriculture and fishing sector, Manufacturing industries, Electricity Water and Buliding & Construcion Sector.

Qatar Central Bank24
Unlike the growth in the commodity-producing sectors output, the output of the
sercive sector, both in nomial and real terms, experienced a slowing down in its growth
in 2005, growing by QR 5.8 billion, or 17.9%, vis-à-vis 44.4% in 2004, reaching QR
38.3 billion, whereas the service sectors' real output (in constant prices of 2001) grew by
QR 2.2 billion, or 8.1% , vis-à-vis 32.7% in 2004, reaching QR 29.1 billion.
Comparison between nominal and real rates of growth achieved for 2005 in
commodity-producing sectors and services' sectors reveals that the average prices of the
former fell by 3.88%, whereas the average prices in the latter rose by 8.99%.
It is worthy to mention here that the increase in private sector consumption
expenditures in 2005 by almost QR 8.0 billion has directly contributed to the growth
realized in nominal NONG GDP, representing about 80% of this growth, compared with
35% in 2004. However, this increase was smaller than expected, where the detailed GDP
breakdown by major items of the expenditures approach reveals that unplanned
investment items in 2005 reached about QR 3.0 billion, reflecting the increase in private
savings over planned investment for 2005, or the falling of private consumption short of
(1) These figures are different from those in the balance of payments due to differences in methodology.
Table No (1-5)
Developments in GDP Components by Expenditure Approach
Government Consumption
Relative Share %
Rate of Growth %
Private Consumption
Relative Share %
Rate of Growth %
Change in Inventory
Relative Share %
Rate of Growth %
Fixed Capital Formation
Relative Share %
Rate of Growth %
Net Exports of Goods and Services(1)
Relative Share %
Rate of Growth %
TOTAL
OVERALL GROWTH RATE
2004 2005
ItemsIn 2001 Constant
Prices
15,094
13.07
14.4
20,166
17.46
42.7
3,756
3.25
- 5.6
34,808
30.13
34.4
41,688
36.09
46.4
115,512
34.8%
17,769
11.50
17.7
28,165
18.22
39.7
2,953
1.91
- 21.4
51,886
33.57
49.1
53,794
34.80
29.0
154,564
33.8%
10,217
11.95
- 3.7
18,420
21.54
33.6
2,641
3.09
- 15.9
30,363
35.50
3.1
23,833
27.93
73.2
85,524
20.8%
11,494
12.66
12.5
23,642
26.04
28.3
1,505
1.66
- 43.0
45,901
50.56
51.2
8,238
9.07
- 65.5
90,780
6.1%
Million QR
In Current Prices
2004 2005
Twenty Ninth Annual Report 25
its expected level; despite the fact that the unplanned investment fell short behind its
level reached in 2004 by more than 20%.
On the other hand, the increase in private-sector consumption in 2005 coincided
with a similar sizeable increase in the narrowly defined money supply (M1), which grew
by QR 7.8 billion, exceeding by more than 97% the increase experienced by private
sector consumption. The fast increase in the rate of growth of the narrowly defined
money supply (M1) by more than what could be considered compatible with the rate of
growth in private sector consumption, led to increasing the inflationary pressures
manifested by the increased prices of goods and services, and especially nontradables'
prices. As indicated by contrasting nominal and real growth rates realized in 2005, the
private-sector consumption expenditures revealed that the averages of their prices rose
by 8.89% during 2005, which is almost equal to the annual rate of inflation (8.81%)
manifested by the annual CPI-inflation rate in Qatar for 2005.
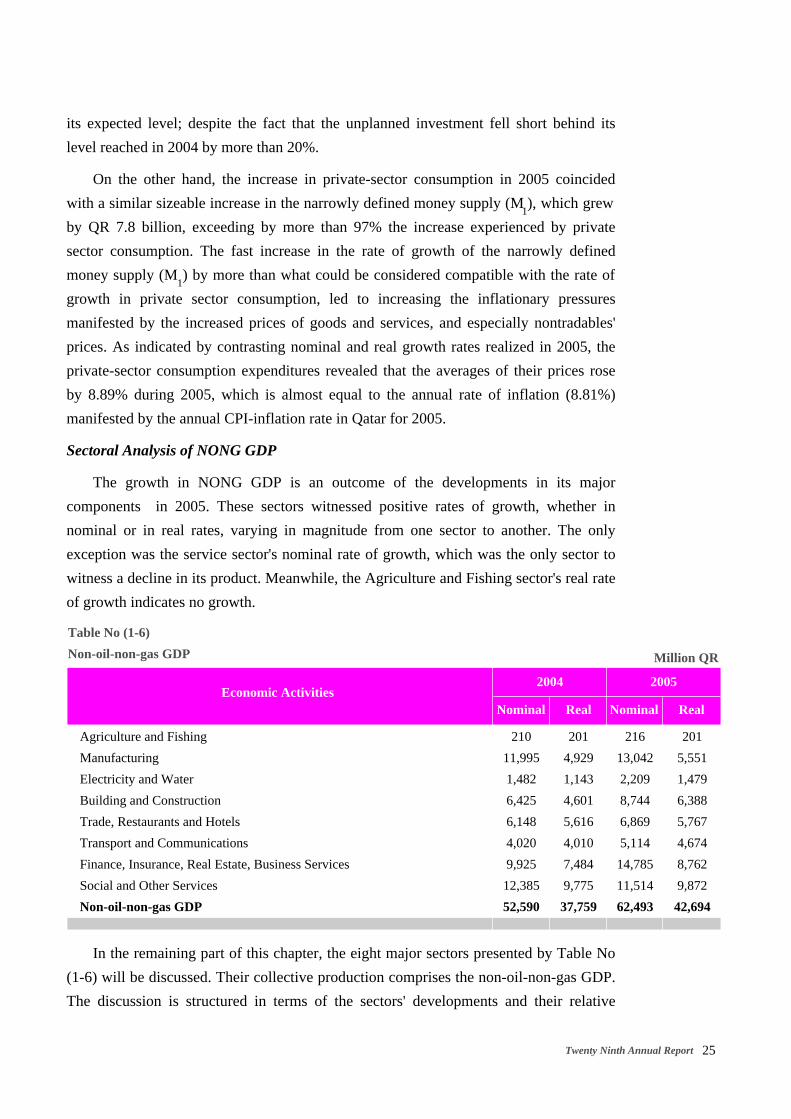
Sectoral Analysis of NONG GDP
The growth in NONG GDP is an outcome of the developments in its major
components in 2005. These sectors witnessed positive rates of growth, whether in
nominal or in real rates, varying in magnitude from one sector to another. The only
exception was the service sector's nominal rate of growth, which was the only sector to
witness a decline in its product. Meanwhile, the Agriculture and Fishing sector's real rate
of growth indicates no growth.
In the remaining part of this chapter, the eight major sectors presented by Table No
(1-6) will be discussed. Their collective production comprises the non-oil-non-gas GDP.
The discussion is structured in terms of the sectors' developments and their relative
Table No (1-6)
Non-oil-non-gas GDP
Agriculture and Fishing
Manufacturing
Electricity and Water
Building and Construction
Trade, Restaurants and Hotels
Transport and Communications
Finance, Insurance, Real Estate, Business Services
Social and Other Services
Non-oil-non-gas GDP
Nominal RealEconomic Activities
2005
210
11,995
1,482
6,425
6,148
4,020
9,925
12,385
52,590
201
4,929
1,143
4,601
5,616
4,010
7,484
9,775
37,759
216
13,042
2,209
8,744
6,869
5,114
14,785
11,514
62,493
201
5,551
1,479
6,388
5,767
4,674
8,762
9,872
42,694
Million QR
2004
Nominal Real
Qatar Central Bank26
shares in current prices of 2005 (starting first with the most important sector) in the total
of non-oil-non-gas GDP during 2005.
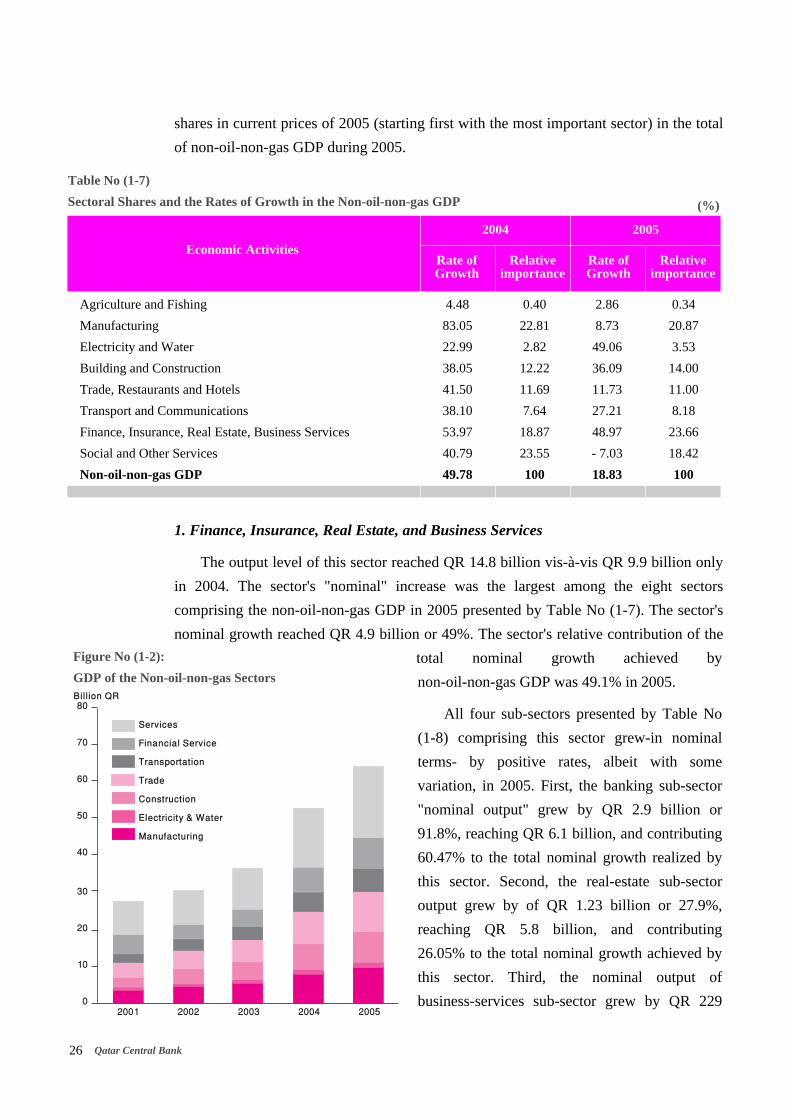
1. Finance, Insurance, Real Estate, and Business Services
The output level of this sector reached QR 14.8 billion vis-à-vis QR 9.9 billion only
in 2004. The sector's "nominal" increase was the largest among the eight sectors
comprising the non-oil-non-gas GDP in 2005 presented by Table No (1-7). The sector's
nominal growth reached QR 4.9 billion or 49%. The sector's relative contribution of the
total nominal growth achieved by
non-oil-non-gas GDP was 49.1% in 2005.
All four sub-sectors presented by Table No
(1-8) comprising this sector grew-in nominal
terms- by positive rates, albeit with some
variation, in 2005. First, the banking sub-sector
"nominal output" grew by QR 2.9 billion or
91.8%, reaching QR 6.1 billion, and contributing
60.47% to the total nominal growth realized by
this sector. Second, the real-estate sub-sector
output grew by of QR 1.23 billion or 27.9%,
reaching QR 5.8 billion, and contributing
26.05% to the total nominal growth achieved by
this sector. Third, the nominal output of
business-services sub-sector grew by QR 229
Table No (1-7)
Sectoral Shares and the Rates of Growth in the Non-oil-non-gas GDP
Agriculture and Fishing
Manufacturing
Electricity and Water
Building and Construction
Trade, Restaurants and Hotels
Transport and Communications
Finance, Insurance, Real Estate, Business Services
Social and Other Services
Non-oil-non-gas GDP
Rate ofGrowth
Economic Activities
2005
4.48
83.05
22.99
38.05
41.50
38.10
53.97
40.79
49.78
0.40
22.81
2.82
12.22
11.69
7.64
18.87
23.55
100
2.86
8.73
49.06
36.09
11.73
27.21
48.97
- 7.03
18.83
0.34
20.87
3.53
14.00
11.00
8.18
23.66
18.42
100
(%)
2004
Relativeimportance
Relativeimportance
0
10
20
30
40
50
60
70
80
2001 2002 2003 2004 2005
Billion QR
Services
Financial Service
Transportation
Trade
Construction
Electricity & Water
Manufacturing
Figure No (1-2):
GDP of the Non-oil-non-gas Sectors
Rate ofGrowth

Twenty Ninth Annual Report 27
million, or 13.9%, reaching QR 1.9 billion and contributing 4.71% of the total nominal
growth achieved by this sector. Finally, the insurance and money exchange sub-sector
nominal output grew by QR426 million, or 77.7%, reaching QR 974 million and
contributing 8.77% of the total nominal growth achieved by this sector in 2005.
The above-mentioned developments in the insurance, finance, real estate and other
services sub-sectors helped increase their "relative importance" in nominal GDP (as seen
in Table No 1-7) from 18.87% in 2004 to 23.66% in 2005, bringing it up from the third
place in 2004 to the first place in 2005.
It is worth noting that "real output" of this sector has grown in real terms by QR 1.3
billion or 17.1% (in constant prices of 2001), contributing about 25.9% of the increase
realized by "real non-oil-non-gas GDP" in 2005. In spite of the improvement in its
relative share, which reached 20.52% in 2005 vis-à-vis 19.82% in 2004, this sector has
remained in the second place among all sectors of non-oil-non-gas GDP achieved in
2004.
Noticeably, comparisons of nominal and real growth rates for this sector, in 2005,
indicate clearly that more than 30% of its "nominal growth" can be attributed to rising
prices by approximately 27.24% in the same year.
2. Manufacturing Sector
The 8.7% nominal growth rate in the value of the manufacturing sector output came
out much slower than its counterpart, 83% in 2004. The manufacturing sector output
increased by one billion to reach QR 13.0 in 2005. Thus, contributing about 10.57% to
the overall non-oil-non-gas GDP nominal increase realized in 2005.
The above-mentioned developments in the manufacturing sector of GDP, especially
the slower growth rate in 2005 vis-à-vis 2004; reinforced by the fact that it is slower than
the overall nominal growth rate of non-oil-non-gas GDP; led to decreasing its relative
share in the non-oil-non-gas GDP from 22.81% in 2004 to 20.87% in 2005. Despite
Table No (1-8)
Relative Contributions and Growth in the Non-oil-non-gas GDP Service Sector
The Banking Industry
The Insurance Industry
The Real Estate Industry
Other Business Services
Sector's Total
ValueItems Relative Contribution
to growth
2,939
426
1,266
229
4,860
91.84
77.74
27.93
13.92
48.97
60.47%
8.77%
26.05%
4.71%
100%
Million QR
Growth in 2005
%

Qatar Central Bank28
these developments, it was able to continue occupying the second place as in 2004
among the eight sectors comprising the nominal non-oil-non-gas GDP in 2005.
It is worth noting that the "real output" of the manufacturing sector grew at a rate (in
real terms) of 12.6% in 2005, almost twice as fast the rate of 6.5% achieved in 2004.
However, in spite of this fast growth in real terms, the relative importance of the
manufacturing sector went down from the fourth place in 2004 to the fifth place in 2005.
The increase of QR 622 million realized by the manufacturing sector real output (in
constant prices of 2001), accounted approximately for 12.6% of the overall
non-oil-non-gas real GDP growth in 2005.
Noticeably, comparisons of this sector's nominal and real growth rates in 2005
indicate an estimated 3.45% decline in prices of this sector's output.
3. The Service Sector
The service sector's "nominal output" experienced negative growth in 2005 by about
QR (871) million, or -7.0%, after growing positively by 40.8% in 2004. This caused a
retreating output from QR 12.4 billion in 2004 to QR 11.5 billion in 2005. The negative
growth has been the outcome of several developments in the sub-sectors comprising this
sector, all of which have grown at varying positive rates.
However, the removal of the sizeable relative contribution of the imputed financial
services in the growth of this sector (QR 2.2 billion), have overweighed the remaining
five sub-sectors contributions to growth The remaining services sub-sectors are:
government services rising by QR 541 million, or 4.6%; social services rising by QR 210
million, or 19.0%; housekeeping services rising by QR 70 million, or 7.1%; and import
duties rising by QR 532 million, or 44.1%.
The retreat in "nominal output" of services sub-sectors resulted in the deterioration
of the sector's relative share in the 2005 overall "nominal" non-oil-non-gas GDP from
23.55% in 2004 to 18.42%, and caused deterioration in its rank among all sectors
comprising "nominal" non-oil-non-gas GDP from the first place in 2004 to a third place
in 2005.
It is worth noting that the "real output" of the services sector, unlike the nominal
output, experienced meager positive growth of QR 97 million, (in constant prices of
2001) or less than 1%, contributing less than 2% of the overall increase in real
non-oil-non-gas GDP in 2005. In spite of its declining relative share - from 25.89% in
2004 to 23.12% in 2005 - the services sector's relative share sustained being in the first
place among the relative shares of all other sectors comprising the non-oil-non-gas GDP.

Twenty Ninth Annual Report 29
Noticeably, comparison of the services sector's nominal and real growth rates in
2005 indicates an estimated 7.94% decline in average prices of this sector's output.
4. Building and Construction Sector
The building and construction sector realized the second largest absolute value
increase among all non-oil-non-gas economic sectors in 2005, amounting to QR 2.3
billion, or 36.1%. Thus, it contributed 23.42% to the overall nominal growth realized by
the non-oil-non-gas GDP in 2005. This sector's output amounted to QR 8.7 billion, up
from its 2004 level of QR 6.4 billion. In spite of the fact that this sector's 38.1% rate of
growth is marginally lower than the rate of growth achieved in 2004, being more than
two-fold the 18.8% rate of growth realized by non-oil-non-gas sectors of GDP, helped
push its relative share from 12.22% in 2004 up to almost 14% in 2005. However, the
building and construction sector kept its fourth rank among all other sectors comprising
the non-oil-non-gas GDP unaltered.
It is worth noting that the building and construction sector "real output" during 2005
witnessed the highest increases, both absolute and relative, growing by 38.8% in 2005,
which is equivalent to 463% of its counterpart for 2004. This reflects the country's
highest leap ever in building and construction activities. This also helped improve this
sector's relative position from the fifth place to the third place. The increase in the real
output of the building and construction sector which approximates QR 1.8 billion (in
constant prices of 2001) contributed about 36.21% of the overall increase realized in
non-oil-non-gas real GDP in 2005.
5. Trade, Commerce, Restaurants, and Hotels
This sector's rate of growth witnessed a noticeable slowdown in 2005, after the
strong growth witnessed in 2004 by this sector, its growth dipped down in 2005 to
Table No (1-9)
The Relative Contribution of the Sub-Sectors in the Nominal Growth of the Services Sector
Government Services
Imputed Fin. Services
Other Services
Social Services
Housekeeping Services
Import duties
Sector's Total
Value of Growth (QR million)
ItemsRelative Contributions to
the Sector's NominalGrowth
541
- 2,224
812
210
70
532
- 871
4.56
80.55
24.62
19.02
7.09
44.08
- 7.03
- 62.11%
255.34%
- 93.23%
- 24.11%
- 8.04%
- 61.08%
100%
Growth in 2005
Rates of Growth%
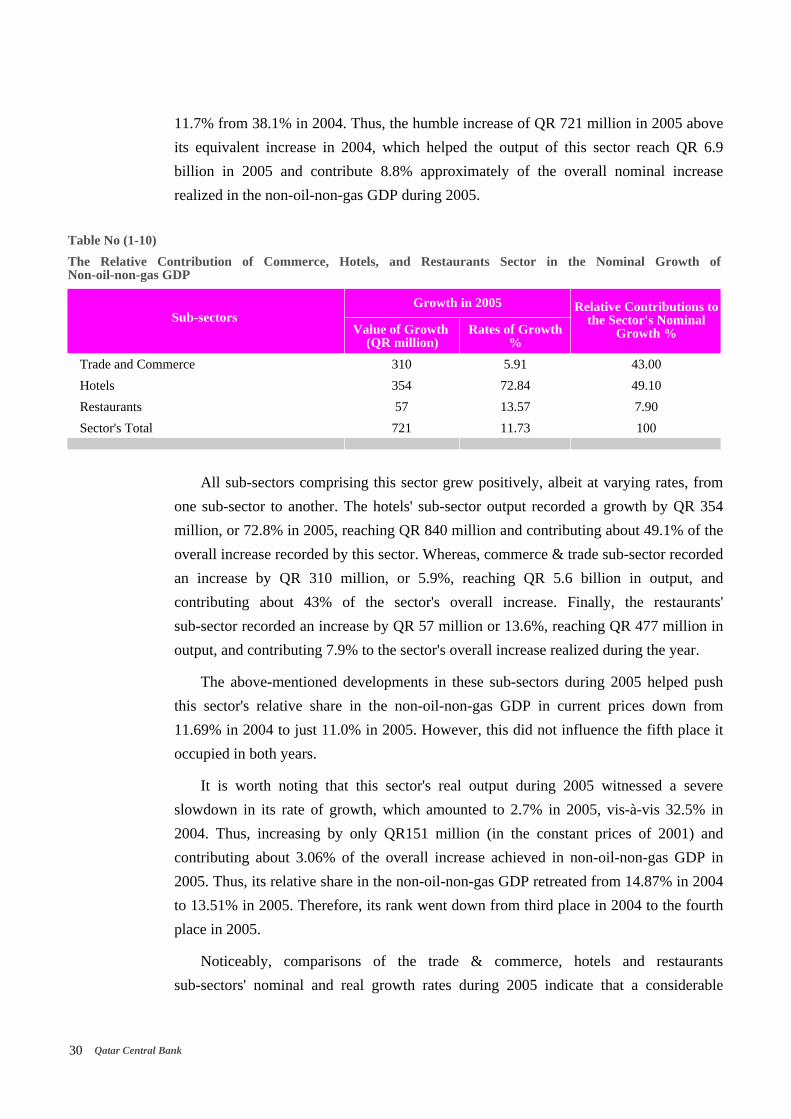
Qatar Central Bank30
11.7% from 38.1% in 2004. Thus, the humble increase of QR 721 million in 2005 above
its equivalent increase in 2004, which helped the output of this sector reach QR 6.9
billion in 2005 and contribute 8.8% approximately of the overall nominal increase
realized in the non-oil-non-gas GDP during 2005.
All sub-sectors comprising this sector grew positively, albeit at varying rates, from
one sub-sector to another. The hotels' sub-sector output recorded a growth by QR 354
million, or 72.8% in 2005, reaching QR 840 million and contributing about 49.1% of the
overall increase recorded by this sector. Whereas, commerce & trade sub-sector recorded
an increase by QR 310 million, or 5.9%, reaching QR 5.6 billion in output, and
contributing about 43% of the sector's overall increase. Finally, the restaurants'
sub-sector recorded an increase by QR 57 million or 13.6%, reaching QR 477 million in
output, and contributing 7.9% to the sector's overall increase realized during the year.
The above-mentioned developments in these sub-sectors during 2005 helped push
this sector's relative share in the non-oil-non-gas GDP in current prices down from
11.69% in 2004 to just 11.0% in 2005. However, this did not influence the fifth place it
occupied in both years.
It is worth noting that this sector's real output during 2005 witnessed a severe
slowdown in its rate of growth, which amounted to 2.7% in 2005, vis-à-vis 32.5% in
2004. Thus, increasing by only QR151 million (in the constant prices of 2001) and
contributing about 3.06% of the overall increase achieved in non-oil-non-gas GDP in
2005. Thus, its relative share in the non-oil-non-gas GDP retreated from 14.87% in 2004
to 13.51% in 2005. Therefore, its rank went down from third place in 2004 to the fourth
place in 2005.
Noticeably, comparisons of the trade & commerce, hotels and restaurants
sub-sectors' nominal and real growth rates during 2005 indicate that a considerable
Table No (1-10)
The Relative Contribution of Commerce, Hotels, and Restaurants Sector in the Nominal Growth ofNon-oil-non-gas GDP
Trade and Commerce
Hotels
Restaurants
Sector's Total
Value of Growth (QR million)
Sub-sectors Relative Contributions to
the Sector's NominalGrowth %
310
354
57
721
5.91
72.84
13.57
11.73
43.00
49.10
7.90
100
Growth in 2005
Rates of Growth%

Twenty Ninth Annual Report 31
proportion of the nominal growth is attributable to higher average prices of its output
which rose by 8.8% approximately in 2005.
6. Transport and Communications Sector
The transport and communications sector's nominal output grew by QR 1.1 billion,
or 27.2% in 2005, reaching QR 5.1 billion vis-à-vis about QR 4.0 billion in 2004. Thus,
its nominal growth contribution reached about 11.05% of the nominal overall growth in
the non-oil-non-gas GDP.
The sub-sectors comprising this sector witnessed varying positive rates of growth.
The communications sub-sector nominal output increased by QR 771 million, or 36.3%,
reaching QR 2.9 billion, thereby contributing about 70.48% of the overall increase
realized by this sector. Whereas the transportation sub-sector nominal output increased
by QR 323 million, or 17%, reaching QR 2.2 billion, thereby contributing about 29.52%
of the overall increase realized by this sector during 2005.
The slowing down of the "nominal growth" rate in 2005, from 38.1% in 2004 to
27.2% in 2005 did not prevent this sector's relative share from rising from 7.64% in 2004
to 8.18% in 2005. Similarly, it did not alter the sector's sixth place ranking either.
It is worth noting that this sector's "real output" during 2005 witnessed a severe
slowdown in its real rate of growth, from 36.7% in 2004 to 16.6% in 2005, thus
increasing by QR 664 million (in constant prices of 2001) and contributing about
13.45% to the overall increase realized by the non-oil-non-gas GDP in 2005.
Furthermore, in spite of the previously mentioned slowdown in this sector's rate of
growth, this sector's contribution improved in 2005 vis-à-vis its counterpart of 2004,
recording 10.95% this year against 10.62% last year, and with no change in the ranking
of this sector which came sixth.
It is also worth noting that by comparing the real and nominal rates of growth
realized in 2005 by the communications and transport sector, it becomes clear that a
Table No (1-11)
Relative Contribution of Transport and Communications Sector in Nominal Growth of Non-oil-non-gas GDP
Transportation
Communications
TOTAL
Value of Growth (QR million)
Sub-sectors Relative Contribution%
323
771
1,094
17.04
36.30
27.21
29.52
70.48
100
Growth Realized in 2005
Rate of Growth%

Qatar Central Bank32
considerable part of the nominal growth is attributable to the increase in average prices
of this sector's products which increased by 9.14%.
7. Electricity and Water Sector
The electricity and water sector realized the highest rate of growth among all
non-oil-gas sectors of GDP, and it was the only sector witnessing an acceleration of
growth rate in 2005; recording a nominal rate of growth at 49.1% vis-à-vis 23.0% in
2004, reaching a production level of QR 2.2 billion, that is an increase by QR 727
million, and contributing about 7.34% to the overall nominal increase recorded by the
non-oil-non-gas GDP in 2005. The strong growth realized by this sector led to
strengthening its relative share to 3.53% by the end-of 2005 vis-à-vis 2.82% by the
end-of 2004. However, this improvement did not influence this sector's rank in the
seventh place.
It is worth mentioning that the real output of the electricity and water sector has also
witnessed an acceleration in its real rate of growth which reached 29.4% in 2005
vis-à-vis 17.4% in 2004. This sector's output increased by QR 336 million (in constant
prices of 2001), contributing about 6.81% to the total real increase realized by the
non-oil-non-gas GDP in 2005.
It is also worth noting that by comparing the real and nominal rates of growth
realized in 2005 by the electricity and water sector, it becomes clear that a considerable
part of the nominal growth is attributable to the increase in average prices of this sector's
products which increased by 15.19%.
8. Agriculture and Fishing Sector
The agriculture and fishing sector realized a positive rate of growth in 2005,
however at a humble rate of 2.9%, against 4.48% in 2004. This sector's contribution to
the overall increase realized by the non-oil-non-gas GDP was limited to less than 0.1%,
thus causing a decline in its relative share from 0.4% in 2004 to 0.34% in 2005, thus
ranking last among all non-oil-non-gas sectors.
It is also worth noting that the real output of the agriculture and fishing sector did
not witness any change at all in 2005, thus the positive growth witnessed by this sector is
attributable to the increase in average prices of this sector's products which increased by
2.86% in 2005.

Twenty Ninth Annual Report 33
Table No (1-12)
Price Changes in the Economic Sectors of GDP in 2005
Commodity Production Sectors:
Agriculture and Fishing
Manufacturing
Electricity and Water
Building and Construction
Services Sectors
Trade, Restaurants and Hotels
Transport and Communications
Finance, Insurance, Real Estate, and Business Services
Services
Non-oil-non-gas GDP
Oil and Gas
GDP
NominalEconomic Activity Change in Average
Prices
20.38
2.86
8.73
49.06
36.09
17.87
11.73
27.21
49.97
-7.03
18.83
46.33
33.81
25.24
0.00
12.62
29.40
38.84
8.15
2.69
16.56
17.08
0.99
13.07
0.56
6.08
-3.88
2.86
-3.45
15.19
-1.98
8.99
8.80
9.14
27.24
-7.95
5.09
45.52
26.14
(%)
Growth Rates
Real
Table No (1-13)
The Rates of Growth and Relative Shares of the Non-oil-non-gas GDP Real Sector
Agriculture and Fishing
Manufacturing
Electricity and Water
Building and construction
Trade, Restaurants and Hotels
Transport and Communications
Finance, Insurance, Real Estate, Business Services
Social and Other Services
TOTAL
RealGrowth
Real Economic Sectors
2005
1.01
6.50
17.35
8.39
32.48
36.72
37.65
27.64
24.56
0.53
13.05
3.03
12.19
14.87
10.62
19.82
25.89
100
0.00
12.62
29.40
38.84
2.69
16.56
17.08
0.99
13.07
0.47
13.00
3.47
14.96
13.51
10.95
20.52
23.12
100
(%)
2004
RelativeShare
RealGrowth
RelativeShare

Qatar Central Bank34
Table No (1-14)
GDP in Current Prices Classified by Economic Activities
Agriculture and Fishing
Oil and gas
Manufacturing
Electricity and Water
Building and construction
Trade, Restaurants and Hotels
Transport and Communications
Finance, Insurance, Real Estate, Business Services
Social and Other Services
GDP
Rate of Growth %
Oil and gas
Proportion of the Total %
Rate of Growth %
Non-oil-non-gas GDP
Proportion of the Total %
Rate of Growth %
Real Economic Activity 2005
181
40717
5076
409
3593
3969
2489
5802
8248
70484
10.4%
40717
57.8%
10.6%
29767
42.2%
10.1%
201
50551
6553
1205
4654
4345
2911
6446
8797
85663
21.5%
50551
59.0%
24.2%
35112
41.0%
18.0%
210
62922
11995
1482
6425
6148
4020
9925
12385
115512
34.8%
62922
54.5%
24.5%
52590
45.5%
49.8%
216
92071
13042
2209
8744
6869
5114
14785
11514
154564
33.8%
92071
59.6%
46.3%
62493
40.4%
18.8%
Million QR
200420032002
Table No (1-15)
GDP in Constant Prices of 2001 Classified by Economic Activities
Agriculture and Fishing
Oil and Gas
Manufacturing
Electricity and Water
Building and construction
Trade, Restaurants and Hotels
Transport and Communications
Finance, Insurance, Real Estate, Business Services
Other Services
GDP
Rate of Growth %
Oil and gas
Proportion of the Total %
Rate of Growth %
Non-oil-non-gas GDP
Proportion of the Total %
Rate of Growth %
Economic Activities 2005
179
40144
4316
414
3287
3957
2757
5677
7663
68394
7.1%
40144
58.7%
9.1%
28250
41.3%
4.5%
199
40468
4628
974
4245
4239
2933
5437
7658
70781
3.5%
40468
57.2%
0.8%
30313
42.8%
7.3%
201
47765
4929
1143
4601
5616
4010
7484
9775
85524
20.8%
47765
55.8%
18.0%
37759
44.2%
24.6%
201
48032
5551
1479
6388
5767
4674
8762
9872
90726
6.1%
48032
52.9%
0.6%
42694
47.1%
13.1%
Million QR
200420032002

Twenty Ninth Annual Report 35
2ChapterTwoPrices and the Labor Force
Prices
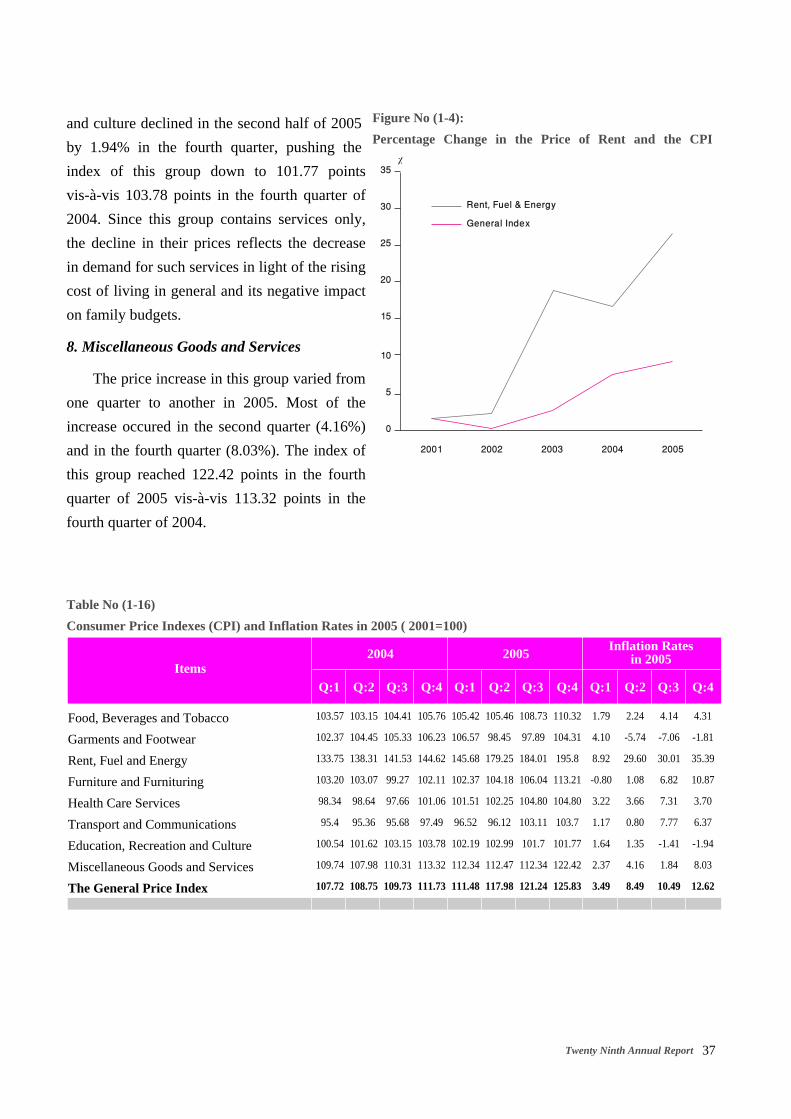
The Consumer Price Index (CPI) increased by 12.62% in the fourth quarter of 2005,
reaching 125.83 points vis-à-vis 111.73 points during the same period of 2004.The year
2005 witnessed noticeable acceleration in inflation; while it recorded an increase by 3.49%
only in the first quarter of 2005, it jumped by 8.49% in the second quarter, 10.49% in the
third quarter, and 12.62% in the fourth quarter, compared with the same periods of 2004.
Most of the increase came in the rent item, which alone rose by 35.39% in the fourth
quarter of 2005 on an annual average basis. By excluding the rent item from the CPI, the
inflation rate (the core inflation), goes down to 4.8% most of which is concentrated in the
furniture and furnituring (10.87%) and various goods and services items (8.03%), which
are tradable and imported from abroad. In what follows, a discussion of the developments
in the various components of the CPI is in order.
1. Food, Beverages and Tobacco
The price index of the food, beverages and tobacco group increased by 4.13%
reaching 110.32 points in the fourth quarter 2005 as a result of the spillover effects of
rising rent. The prices of these items were rising gradually from 1.79% in the first
quarter, 2.24% in the second quarter, 4.14% in the third quarter, and 4.31% in the fourth
quarter as an annualized average basis.
2. Garments and Footwear
On the contrary of what happened in 2004 when the price level of these items
increased on average by 8.1%, these prices varied considerably from one quarter to the
other in 2005. While the index of these items witnessed an increase in the first quarter by
4.1%, reaching 106.57 points, it declined sharply in the second and third quarters
reaching 97.89 points, before it resumed rising in the fourth quarter reaching 104.31
points, which is still lower than the 106.23 points level reached in the fourth quarter of
2004.
3. Rent and Fuel
The rent and prices of fuel witnessed a large increase in 2005 for the second
consecutive year. The increase took place in all four quarters of the year, but it started
rising in the first quarter by 8.92% (y-o-y), by 29.6% in the second quarter, then by

Qatar Central Bank36
30.01% in the third quarter, reaching its peak of 35.39% in the fourth quarter, as the
index reached to 195.80 points vis-à-vis 144.62 points in the fourth quarter of 2004. This
sharp increase was due to the shortage created by evictions and demolishing of old
buildings and due to the increased demand which stemmed from strong economic
growth and increased population.
4. Furniture and Furnishings
The prices of the furniture and furnishings group increased during the second half of
2005. After decreasing by 0.8% in the first quarter. The price index of this group
increased slightly by 1.08% in the second quarter, and started to accelerate in the third
quarter, increasing by 6.82% and by 10.87% in the third and fourth quarters of 2005
respectively; (yoy) thus pushing the index up to 113.21 points. This noticeable increase
in the prices of furniture and furnishings could be attributed to spillover effects of the
rising rent, since international inflation in 2005 was generally stable.
5. Health Care Services
The price index of this group increased during 2005 for the second consecutive
year for the same reasons mentioned above, that is the spillover effects of rising rent
inflation. The quarterly rises in this index were almost the same except for the third
quarter, as the index increased by 7.31% above
the third quarter of 2004. The index reached
104.8 points, an increase of 3.7% above the
same quarter of 2004.
6. Transport and Communications
The prices of this group recorded an increase
by 5.72% in the last quarter of 2005 compared
with the same quarter of 2004. Part of the
increase, which occurred in the second half of the
year, could be attributed to the rising air fairs.
The price index of this group reached 103.07
points in the fourth quarter of 2005 vis-à-vis
97.49 points a year earlier.
7. Education, Recreation and Culture
Contrary to the general price index (CPI) and other component groups, (except for
the group of clothing, garments and footwear) the price index of Education, Recreation
0
50
100
150
200٪
2001 2002 2003 2004 2005
Rent, Fuel & Energy
Transport
Food
General Index
Figure No (1-3):
The Consumer Price Index (CPI)
Twenty Ninth Annual Report 37
and culture declined in the second half of 2005
by 1.94% in the fourth quarter, pushing the
index of this group down to 101.77 points
vis-à-vis 103.78 points in the fourth quarter of
2004. Since this group contains services only,
the decline in their prices reflects the decrease
in demand for such services in light of the rising
cost of living in general and its negative impact
on family budgets.
8. Miscellaneous Goods and Services
The price increase in this group varied from
one quarter to another in 2005. Most of the
increase occured in the second quarter (4.16%)
and in the fourth quarter (8.03%). The index of
this group reached 122.42 points in the fourth
quarter of 2005 vis-à-vis 113.32 points in the
fourth quarter of 2004.
Food, Beverages and Tobacco
Garments and Footwear
Rent, Fuel and Energy
Furniture and Furnituring
Health Care Services
Transport and Communications
Education, Recreation and Culture
Miscellaneous Goods and Services
The General Price Index
Inflation Ratesin 200520052004
4.31
-1.81
35.39
10.87
3.70
6.37
-1.94
8.03
12.62
Q:4
Table No (1-16)
Consumer Price Indexes (CPI) and Inflation Rates in 2005 ( 2001=100)
Items
4.14
-7.06
30.01
6.82
7.31
7.77
-1.41
1.84
10.49
Q:3
2.24
-5.74
29.60
1.08
3.66
0.80
1.35
4.16
8.49
Q:2
1.79
4.10
8.92
-0.80
3.22
1.17
1.64
2.37
3.49
Q:1
110.32
104.31
195.8
113.21
104.80
103.7
101.77
122.42
125.83
Q:4Q:3Q:2Q:1Q:4Q:3Q:2Q:1
108.73
97.89
184.01
106.04
104.80
103.11
101.7
112.34
121.24
105.46
98.45
179.25
104.18
102.25
96.12
102.99
112.47
117.98
105.42
106.57
145.68
102.37
101.51
96.52
102.19
112.34
111.48
105.76
106.23
144.62
102.11
101.06
97.49
103.78
113.32
111.73
104.41
105.33
141.53
99.27
97.66
95.68
103.15
110.31
109.73
103.15
104.45
138.31
103.07
98.64
95.36
101.62
107.98
108.75
103.57
102.37
133.75
103.20
98.34
95.4
100.54
109.74
107.72
0
5
10
15
20
25
30
35٪
2001 2002 2003 2004 2005
Rent, Fuel & Energy
General Index
Figure No (1-4):
Percentage Change in the Price of Rent and the CPI

Qatar Central Bank38
The Labor Force
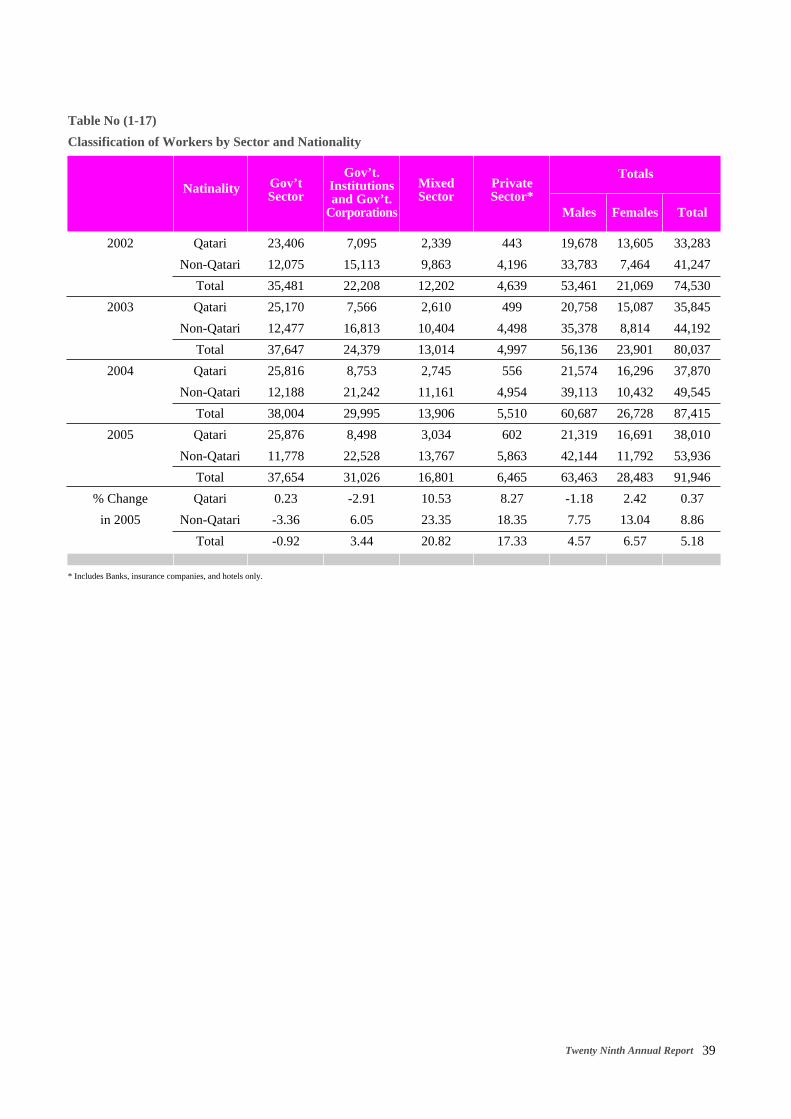
Estimates issued by the Department of Statistics at the Planning Council indicate
that the population of the state of Qatar reached 796,000 at the mid of 2005, and has
probably risen to 838,000 by mid 2006, i.e. growing by 5.3% per annum. According to
the official census, actual population was 744,000 in April 2004.
No aggregate statistics is available on the labor force in Qatar; the figures published
by the Department of Statistics contain only the number of workers in the Government,
Government Institutions, semi publicly-owned Sector; hotels and the financial services
sector. The total number of workers in all of these sectors at the end-of 2005 reached
91,946 persons, increasing 5.2% above the level reached at the end of 2004. This
percentage is very close to the real rate of growth in 2005, which seems logical.
Qatari nationals constituted approximately 38,000 persons, or 41.3% of the total
work force at the end of 2005, slightly increasing by no more than 1% from the level
reached by the end of 2004. The Qatari nationals were distributed among the
above-mentioned sectors as follows: 21,300 males, or 56.1%, and 16,700 females, or
43.9%. The total number of government employees reached 37,700 workers, of whom
25,900 or 68.7% qatari workers and 11,800 or 31.1% foreigners.
It is worth noting that the total number of workers in the government has declined
slightly by 410 workers in 2005 (less than 1%), all of them were foreign workers only.
The year 2005 witnessed a noticeable increase in the number of workers in other sectors.
The number of workers in government institutions and government-owned corporations
increased by 3.4% or slightly above 31,000 workers; the number of private sector
workers (banks, insurance companies, and hotels) increased by 17.3% or 6465 workers;
and finally, the workers of the mixed ownership sector rose by 20.8% or 16,800 workers.
Table No. (1-17) gives more details about the number of workers in the
above-mentioned sectors during the period 2002-2005.
Twenty Ninth Annual Report 39
Table No (1-17)
Classification of Workers by Sector and Nationality
Totals
33,283
41,247
74,530
35,845
44,192
80,037
37,870
49,545
87,415
38,010
53,936
91,946
0.37
8.86
5.18
Males Females Total
PrivateSector*
MixedSector
Gov’t.Institutionsand Gov’t.
Corporations
Gov’tSector
Natinality
13,605
7,464
21,069
15,087
8,814
23,901
16,296
10,432
26,728
16,691
11,792
28,483
2.42
13.04
6.57
19,678
33,783
53,461
20,758
35,378
56,136
21,574
39,113
60,687
21,319
42,144
63,463
-1.18
7.75
4.57
443
4,196
4,639
499
4,498
4,997
556
4,954
5,510
602
5,863
6,465
8.27
18.35
17.33
2,339
9,863
12,202
2,610
10,404
13,014
2,745
11,161
13,906
3,034
13,767
16,801
10.53
23.35
20.82
7,095
15,113
22,208
7,566
16,813
24,379
8,753
21,242
29,995
8,498
22,528
31,026
-2.91
6.05
3.44
23,406
12,075
35,481
25,170
12,477
37,647
25,816
12,188
38,004
25,876
11,778
37,654
0.23
-3.36
-0.92
Qatari
Non-Qatari
Total
Qatari
Non-Qatari
Total
Qatari
Non-Qatari
Total
Qatari
Non-Qatari
Total
Qatari
Non-Qatari
Total
2002
2003
2004
2005
% Change
in 2005
* Includes Banks, insurance companies, and hotels only.

Qatar Central Bank40
BOX (2)
Rate of Unemployment in the Industrial Countries
Unemployment rates in the industrial countries have declined over 2005 for the second
consecutive year. The rate of unemployment in the USA decreased to 5.1% end-2005 vis-à-vis
5.5% end-2004. Other industrial countries witnessed decreases in their unemployment rates,
where the rate declined to 4.4% in Japan, 8.6% in the Euro zone, and 6.8% in Canada.
On average, the rate of unemployment in the industrial countries decreased to 6.0% at the end of
2005, vis-à-vis 6.3% in 2004.
The Rates of Unemployment in Industrial Countries
2005
6.0
5.1
4.4
8.6
4.7
6.8
2004
6.3
5.5
4.7
8.9
4.8
7.2
2003
6.6
6.0
5.3
8.7
5.0
7.6
2002
6.3
5.8
5.4
8.3
5.2
7.6
2001
5.8
4.7
5.0
7.8
5.1
7.2
Countries
Advanced Economies (Average)
USA
Japan
Euro Zone
UK
Canada
Source: World Economic Outlook, April 2006.
(%)

Twenty Ninth Annual Report 41
3ChapterThreePublic Finance
Government Expenditures are considered as an important source of financing the
economic development projects in the state of Qatar, and as an important tributary of
income, expenditure, and domestic liquidity stream at the macroeconomic level of the
economy. In recent years, government expenditures increased continuously in tandem
with the increasing government revenues, and the general government budget recorded
surpluses for the fifth consecutive year.
It is well known that the main source of government revenues in Qatar comes from
the proceeds of selling oil and gas, in addition to the returns on investment, various
customs duties and tariffs, and others. On the other hand, government expenditures are
distributed among wages and salaries, services and supplies, interest on loans, and the
financing of the main capital and infrastructure projects. The following is a brief
exploration of the main features of the government budget for FY 2005/2006 and the
estimated figures of the budget for FY 2006/2007.
The General Budget for 2005/2006
1. Public Revenues
The data presented by Table No (1-17) reveals that the preliminary figures of actual
Public Revenues increased in fiscal year (FY) 2005/2006 by 18.0% to reach QR 65
billion versus QR 55.1 billion in FY 2004/2005. In addition, the actual revenue of FY
2005/2006 was 70.9% above the budget estimates for FY 2005/2006. The rise in the
actual public revenues in FY 2005/2006 was basically due to the rise in oil prices and the
resulting revenues. Oil and gas revenues accounted for 67.1% or QR 43.6 billion
vis-à-vis 66%, or QR 36.3 billion, in the year before, whereas investment revenues
represented 21.9%, or QR 14.2 billion, compared with 24.9%, or QR 13.7 billion in FY
2004/2005.
2. Public Expenditures
Actual public expenditures presented by Table No (1-17) reflect an increase by
40.8%, reaching QR 50.8 billion, vis-à-vis QR 36.1 billion in FY 2004/2005. Thus, the
general budget did enjoy a surplus of QR 14.2 billion, a decrease of 25.4% from the QR
19.0 billion surplus level achieved in FY 2004/2005. Table No (1-17) sheds more details
on the distribution of the public expenditure among current and capital expenditures. It is

Qatar Central Bank42
noted that current expenditures amounted QR 32.8 billion, while capital expenditures
amounted QR 18.1 billion. That is, 64.4% of total expenditures was allocated for current
expenditures and 35.6% was allocated for the capital expenditures.
The main components of public expenditures are described as follows:
1. Wages and salaries in fiscal year
2005/2006 reached QR 6.7 billion,
decreasing by 16.2% from previous
year's level which was QR 7.9 billion.
The wages and salaries represented
13.1% of total public expenditure in FY
2005/2006 vis-à-vis 22% in FY
2004/2005. The partial privatization of
the education sector is the main
justification for wages and salaries
decline in FY 2005/2006.
2. Interest Payments: against the domestic
and external loans increased in FY
2005/2006 by 2.2%, reaching QR 1.92
billion vis-à-vis QR 1.88 billion in FY0
10
20
30
40
50
60
70
2001 2002 2003 2004 2005
Billion QR
Total Revenue
Surplus
Total Expenditure
Figure No. (1-5):
The General Budget
Total Revenues
Oil and Gas Revenues
Investment Revenues
Other Revenues
Total Expenditures
Current Expenditures
Wages and Salaries
Interest Payments
Supplies and Services
Other Expenditures
Capital Expenditures
Surplus or Deficit (-)
ActualPreliminary Estimates
Table No (1-18)
Actual and Preliminary Estimates for the State General Budget
Budget Items
Million QR
2003/04 2004/05 2005/06 2003/04 2004/05 2005/06*
21,586
12,110
6,851
2,625
23,312
17,158
6,056
1,450
1,148
8,504
6,154
-1,726
26,192
14,456
8,153
3,583
28,352
19,469
6,273
1,200
1,172
10,824
8,883
-2,160
38,028
20,827
12,550
4,651
37,811
26,082
6,315
1,571
1,004
17,192
11,729
217
30,563
18,593
8,063
2,907
27,187
21,921
6,244
1,942
1,943
11,792
5,266
3,376
55,064
36,319
13,711
5,034
36,102
28,270
7,940
1,880
1,572
16,878
7,832
18,962
64,984
43,616
14,233
7,135
50,833
32,761
6,657
1,922
1,008
23,174
18,072
14,151
* Preliminary Figures , Source: The Ministry of Finance.

Twenty Ninth Annual Report 43
2004/2005. The increase is attributed partially to rising interest rates in
2005. However, its share of the total public expenditures declined to 3.8%,
vis-à-vis 5.2% in the previous fiscal year.
3. Supplies and Services Expenditures declined in FY 2005/2006 to about QR 1.0
billion due to the above-mentioned privatization factor.
4. Other Current Expenditures increased in FY 2005/2006 by 37.3% reaching QR 23.2
billion. It represented 45.6% of total public expenditure, vis-à-vis 46.8% in FY
2004/2005.
5. Capital Expenditures increased by 130.8% reaching QR 18.1 billion vis-à-vis QR 7.8
billion in 2004/2005. Thus, total expenditure has been distributed in 2005/2006
among capital expenditure and current expenditure, by 35.6% and 64.4%, vis-à-vis
21.7% and 78.3% respectively, in the previous fiscal year.
Estimates of the State Budget for FY 2006/2007
The Ministry of Finance (MOF) imputation of the revenue for the fiscal year
2006/2007 was based on 36$ per barrel compared with $27 in the previous year. The
price base increment was expected as the average oil price has exceeded $53 per barrel
in mid 2005. The public revenues were estimated by QR 56,901.8 million, a decrease of
12.4% from the QR 64,984 million actual revenues of the previous year.
On the other side, the total expenditures for the year 2005/2006 have been raised by
7.3% to reach QR 54,568.2 million vis-à-vis QR 50,833 million in FY 2004/2005. Thus,
it is estimated that the Budget will realize a surplus of QR 2,334 million against an
actual surplus of QR 14,714 million in FY 2005/2006.
Total RevenuesOil and Gas Revenues
Investment Revenues
Other Revenues
Total ExpendituresRecurrent Expenditure
Wages and Salaries
Interest Payments
Supplies and Services
Other Expenditure
Capital Expenditures
Surplus or Deficit (-)
Table No (1-19)
Preliminary Estimates for the State Budget
Budget Items
Million QR
2005/2006 Actual
64,98443,616
14,223
7,135
50,83332,761
6,657
1,922
1,008
23,174
18,072
14,151
2005/2006Estimates
38,02820,827
12,550
4,651
37,81126,082
6,315
1,571
1,004
17,192
11,729
217
2006/2007Estimates
56,90231,050
17,817
8,035
54,56834,668
7,167
2,463
1,340
23,698
19,900
2,334

Qatar Central Bank44
Most of the increase in public expenditures has occurred in 2006/2007 estimates of
capital expenditures on infrastructure; increasing by 10.1% to reach QR 19,900 million,
vis-à-vis an actual QR 18,072 million in FY 2005/2006.
It is noted that the communications’ allocation has been doubled 9 times in
FY2006/2007 budget to reach to QR 4,511 million compared with QR 489 million only
in FY 2005/2006; thus representing 22.7% of the total capital expenditures. Moreover,
the allocation for the roads has been doubled to QR 3,505 million, representing 17.6% of
the total capital expenditures, vis-à-vis QR 1,567 million in the previous fiscal year. The
allocations of the electricity and water sector amounted QR 3,017 million, which
represents 15.2% of the total capital expenditures.
Health
Education
Housing and Public Buildings
Roads
Communications
Social Services
Electricity and Water
Reclamation and Land Acquisitions
Consulting and Technical Research for Other Projects
TOTAL
Relative Importance %Allocations (in QR Million)
Table No (1-20)
Major Project Allocations of the Estimated Capital Expenditures for 2006/2007
Allocations for
629
580
584
3,505
4,511
1,939
3,017
2,019
3,116
19,900
3.2
2.9
2.9
17.6
22.7
9.7
15.2
10.1
15.7
100

Banking, Financial Sectorand the Balance of Payments
Section II
4Chapter FourThe Banking Sector
5Chapter FiveThe Financial Sector
6Chapter Six Foreign Trade and the
Balance of Payments

Qatar Central Bank46

Twenty Ninth Annual Report 47
Domestic Liquidity Developments
Defined as broad money (M2), domestic liquidity continued its vigorous growth,
which started some years ago, stimulated by many positive developments realized by the
Qatari economy on the fronts of economic development and large increase in
population; both of which represent higher levels of effective demand, which in turn
entail increased demand for money. The most obvious acceleration in 2005 was realized
in the rate of domestic liquidity growth, leaping by to QR 19.4 billion or 43.3% in 2005,
vis-à-vis QR 7.6 billion or 20.5% in 2004. Thus, domestic liquidity (M2) jumped from
QR 44.9 billion in 2004 to QR 64.3 billion in 2005, which led to a rise in the (M2/GDP)
ratio from 38.8% by the end of-2004 to 41.6% by the end of 2005, a decline in currency
velocity of circulation from 2.57 in 2004 to 2.40 in 2005.
Investigation of developments taking place in the components of domestic liquidity
(M2) during the year reveals that all of these components without exception have
contributed to the (M2) growth during the past few years, especially 2004 and 2005,
althoug with varying rates of growth and contributions.
The narrowly defined money supply (M1), which represents the first component of
domestic liquidity, strongly grew in 2005 by QR 7.8 billion or 53.2%, contributing about
40% of the total increase in (M2) during 2005. Thus, (M
1) relative share in domestic
liquidity improved from 32.5% by the end of 2004 to 34.8% by the end of 2005.
Table No (2-1)
Domestic Liquidity
Money Supply (M1)
Relative Importance %
Quasi Money
Relative Importance %
Domestic Liquidity
ItemsChange
7,763.8
40.0
11,642.1
60.0
19,405.9
53.2
38.5
43.3
Million QR
Value %2004
14,598.4
32.5
30,226.6
67.5
44,865.0
2005
22,362.2
34.8
41,908.7
65.2
64,270.9
4ChapterFourThe Banking Sector

Qatar Central Bank48
0
10000
20000
30000
40000
50000
60000
70000
80000
90000
2002 2003 2004 2005
Million QR
M2
Quasi-Money
M1
Table No (2-2)
Composition of the Money Supply (M1)
Currency in Circulation
Relative Importance %
Demand Deposits
Relative Importance %
Money Supply (M1)
ItemsChange
271.6
3.5
7,492.2
96.5
7,763.8
10.5
62.4
53.2
Million QR
Value %2004
2,594.0
17.8
12,004.4
82.2
14,598.4
2005
2,865.6
12.8
19,496.6
87.2
22,362.2
The second component of domestic liquidity, i.e. quasi money (QM), also witnessed
a similar strong growth in 2005 that amounted to QR 11.6 billion, or 38.5%, thus
contributing about 60% of the total increase in domestic liquidity in 2005. In spite of the
fact that the QM contribution to growth in (M2) was larger than that of (M
1) by almost
50%; its rate of growth being less than that of (M1) led to a decline in its relative share
from 67.5% in 2004 to 65.2% end-2005.
The above developments indicate change in
the composition of domestic liquidity (M2) due
to an increase in demand for currency for
speculation on various assets in general and on
the Doha Securities Market in particular.
Money Supply (M1)
Similar to the developments in domestic
liquidity (M2), the narrowly defined money
supply (M1) continued growing strongly in 2005,
as it did in several years, increasing by QR 7.8
billion, or 53.2%, vis-à-vis QR 3.3 billion, or
29.4%, in 2004. Thus, money supply (M1)
reached QR 22.4 billion, raising the ratio of (M1)
to non-oil-non-gas GDP to 35.8% at the end of
2005 vis-à-vis 27.8% at the end of 2004, slowing
(M1) velocity of circulation, measured against
non-oil-non-gas GDP from 3.60 in 2004 to 2.79
in 2005.
Investigation of the developments that occurred in 2005 reveals that all the
components of the narrowly defined money supply (M1) have contributed to its growth
during the past four years, but with varying rates of growth and contributions during
these years.
Figure No (2-1):
The Money Supply

Twenty Ninth Annual Report 49
Table No (2-3)
Quasi Money
QR Time Deposits
Relative Importance %
Foreign Currency Deposits
Relative Importance %
Quasi Money
ItemsChange
5,438.6
46.7
6,203.5
53.3
11,642.1
26.4
64.3
38.5
Million QR
Value %2004
20,620.9
68.1
9,645.7
31.9
30,266.6
2005
26,059.5
62.2
15,849.2
37.8
41,908.7
The first item of (M1) is currency in circulation, which grew moderately by QR
271.6 million or 10.5%; contributing about 3.5% only of the total increase in (M1); thus,
its relative share in the composition of (M1) shrank from 17.8% in 2004 to 12.8% in
2005.
The second item of (M1) is the QR-demand deposits, which grew strongly by QR
7.5 billion, or 62.4%, contributing the remaining 96.5% of the total increase in (M1); this
caused its relative share in the composition of (M1) to expand from 82.2% in 2004 to
87.2% in 2005.
These developments, in the items comprising the narrowly-defined money (M1), led
to a continuous decline in the ratio of liquidity preference, from 23.5% at the end of
2003 to 21.6% at the end of 2004 and to 14.7% by the end of 2005. It is attributable to
the spreading of banking culture among the general public in Qatar, and to the increase
in the volume and value of the financial transactions, which are settled by payment
instruments other than currency (like checks), aside from what was mentioned
previously about the increase in money demand for speculation in the assets' markets.
Quasi Money
Quasi money (QM) continued its record of several years of growth at the tempo
observed in domestic liquidity (M2) and the narrowly defined money supply (M
1),
realizing an increase by QR 11.6 billion or 38.5% in 2005 vis-à-vis QR 4.3 billion or
16.7% in 2004, to reach QR 41.9 billion by the end of 2005, vis-à-vis QR 30.3 billion
one year earlier.
Investigation of the developments that occurred in 2005 reveals that all the
components of (QM) have contributed to its strong growth in 2005, although with
varying rates of growth.
The first component of QM is QR time deposits, which grew strongly by QR 5.4
billion or 26.4%; contributing about 46.7% of the total increase in QM in 2005; this

Qatar Central Bank50
Table No (2-4)
Changes in the Factors Affecting Domestic Liquidity
Net Foreign Assets (NFA)
Relative Importance (%)
Domestic Credit
Relative Importance (%)
Gov't Deposits (increase -)
Relative Importance %
Other Items Net (increase -)
Relative Importance (%)
Change in Domestic Liquidity
ItemsChange
10,015.0
85.1
14,124.7
120.1
-4,774.5
-40.6
-7,601.3
-64.6
11,763.9
167.1
285.5
865.6
276.7
153.9
Million QR
Value %2004
5,993.2
78.4
4,947.8
64.7
-551.6
-7.2
-2,747.4
-36.0
7,642.0
2005
16,008.2
82.5
19,072.5
98.3
-5,326.1
-27.4
-10,348.7
-53.3
19,405.9
0
5000
10000
15000
20000
25000
2002 2003 2004 2005
Million QR
Local Currency Foreign Currency
caused its relative share in the composition of
QM to shrink from 68.1% in 2004 to 62.2% in
2005.
The second item of QM is foreign currency
deposits, the accelerated growth of which
reached QR 6.2 billion, or 64.3%; thus,
contributing the remaining 53.3% of the total
increase in QM during 2005.
The Factors Affecting Domestic Liquidity
Analysis of the factors affecting domestic liquidity defined as (M2) reveals that the
trends in these factors namely, net foreign assets, domestic credit and government
deposits, and other items net, did not change in 2005 from those trends prevailing in the
past few years.
The domestic credit played its usual expansionary role, but it was stronger in 2005
than the previous year; injecting about QR 19.1 billion in 2005, which accounted for
most of the increase in domestic liquidity, vis-à-vis QR 4.9 billion in 2004. However,
each of government deposits and "other items net" played contractionary role and
together neutralized the expansionary effect of net foreign assets (NFA); namely,
government deposits absorbed QR 5.3 billion whereas "other items net" absorbed QR
Figure No (2-2):
The Money Supply

Twenty Ninth Annual Report 51
10.6 billion. The total sum of what both items had absorbed was approximately equal to
what net foreign assets (NFA) had injected, where the latter has played its usual
expansionary influence on domestic liquidity by QR 16 billion in 2005 vis-à-vis QR 6
billion in the previous year.
Table No (2-5) sheds some more light on the developments of domestic liquidity, for
more details and clarity.
The data in Table No (2-5) contains detailed information about inflows and outflows
of funds. On the one hand, the inflows of funds come from two sources, namely,
government expenditures as the basic and usual source of domestic liquidity and the net
of domestic banking transactions as the secondary source. On the other hand, the flows
of funds that leak out of the economy through private sector transactions with the outside
world, whether for financing imports or satisfying investment needs. It is obvious that
the domestic liquidity injected into the domestic economy in 2005 from both sources
(government spending and net domestic banking transactions) rose significantly above
their level in 2004 by QR 11.8 billion, or 153.9%.
The analysis indicates that the domestic banking transactions played an
expansionary role estimated by QR 8.5 billion. It was the outcome of increased domestic
credit extended to private sector by QR 18.9 billion, and decreased "other items net" by
QR 10.4 billion. Finally, the net government expenditures played its expansionary role in
2005 through increasing by QR 12.6 billion, or 40.7%.
As for the channel through which domestic liquidity leaks out of the economy, i.e.,
the level of private sector transaitions with the rest of the world, it increased in 2005 by
QR 5.7 billion, or 21.2%, above its level in 2004, reaching QR 32.8 billion by the end of
2005.
Table No (2-5)
The Factors Affecting Domestic Liquidity
Government Expenditures (Net)
Domestic Banking Transactions
Domestic Credit to Private Sector
Other Items (Net)
Private Sector Transactions with the Rest of the World (Net)
Change in Domestic Liquidity
ItemsChange
12,630.0
4,880.8
- 5,746.9
11,763.9
40.7
133.3
21.2
153.9
Million QR
Value %2004
31,068.0
3,662.3
6,409.8
-2,747.5
- 27,088.3
7,642.0
2005
43,698.0
8,543.1
18,891.8
-10,348.7
- 32,835.2
19,405.9
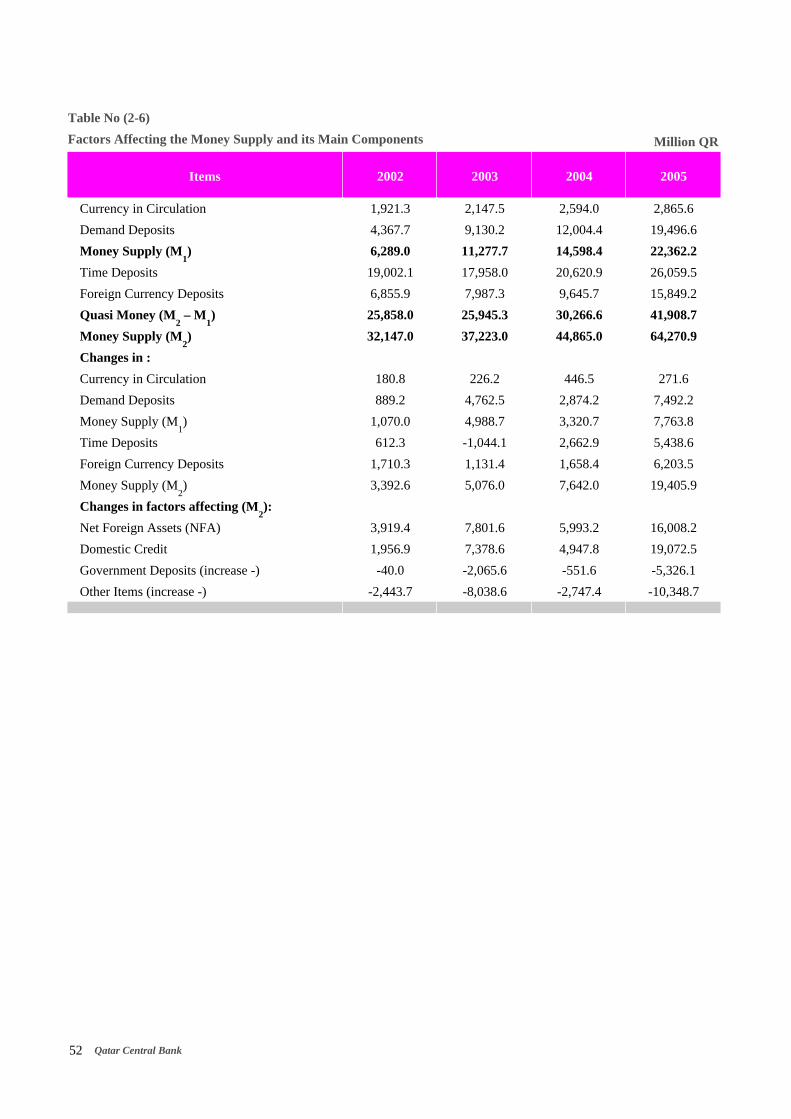
Qatar Central Bank52
Table No (2-6)
Factors Affecting the Money Supply and its Main Components
Currency in Circulation
Demand Deposits
Money Supply (M1)
Time Deposits
Foreign Currency Deposits
Quasi Money (M2 – M
1)
Money Supply (M2)
Changes in :
Currency in Circulation
Demand Deposits
Money Supply (M1)
Time Deposits
Foreign Currency Deposits
Money Supply (M2)
Changes in factors affecting (M2):
Net Foreign Assets (NFA)
Domestic Credit
Government Deposits (increase -)
Other Items (increase -)
Items
2,594.0
12,004.4
14,598.4
20,620.9
9,645.7
30,266.6
44,865.0
446.5
2,874.2
3,320.7
2,662.9
1,658.4
7,642.0
5,993.2
4,947.8
-551.6
-2,747.4
2,865.6
19,496.6
22,362.2
26,059.5
15,849.2
41,908.7
64,270.9
271.6
7,492.2
7,763.8
5,438.6
6,203.5
19,405.9
16,008.2
19,072.5
-5,326.1
-10,348.7
Million QR
2004 20052002
1,921.3
4,367.7
6,289.0
19,002.1
6,855.9
25,858.0
32,147.0
180.8
889.2
1,070.0
612.3
1,710.3
3,392.6
3,919.4
1,956.9
-40.0
-2,443.7
2003
2,147.5
9,130.2
11,277.7
17,958.0
7,987.3
25,945.3
37,223.0
226.2
4,762.5
4,988.7
-1,044.1
1,131.4
5,076.0
7,801.6
7,378.6
-2,065.6
-8,038.6

Twenty Ninth Annual Report 53
Table No (2-7)
Monetary Survey of the Banking System
Net Foreign Assets (NFA):
Foreign Assets:
QCB
Commercial Banks
Foreign Liabilities
Domestic Credit
Assets = Liabilities
Money Supply (M1)
Currency in Circulation
Demand Deposits
Quasi Money (M2 – M
1)
Time Deposits
Foreign Currency Deposits
Money Supply (M2)
Government Deposits:
in QR
in FX
Other Items (Net)
Capital
Revaluation Account
Unclassified Items:
QCB
Commercial Banks
Items
31,812.1
39,989.1
12,232.7
27,756.4
- 8,177.0
48,293.8
80,105.9
14,598.4
2,594.0
12,004.4
30,266.6
20,620.9
9,645.7
44,865.0
18,161.5
8,452.9
9,708.6
17,079.4
16,241.3
966.8
-128.7
2,458.4
-2,587.1
47,820.3
58,290.2
16,642.7
41,647.5
- 10,469.9
67,366.3
115,186.6
22,362.2
2,865.6
19,496.6
41,908.7
26,095.5
15,849.2
64,270.9
23,487.6
10,551.5
12,936.1
27,428.1
31,235.1
739.9
-4,546.9
-4,635.0
88.1
Million QR
2004 20052002
18,017.3
20,408.2
5,473.5
14,934.7
- 2,390.9
35,967.4
53,984.7
6,289.0
1,921.3
4,367.7
25,858.0
19,002.1
6,855.9
32,147.0
15,544.3
5,589.7
9,954.6
6,293.4
8,943.0
299.4
-2,949.0
1,342.0
-4,291.0
2003
25,818.8
29,933.5
10,468.6
19,464.9
- 4,114.7
43,346.0
69,164.8
11,277.7
2,147.5
9,130.2
25,945.3
17,958.0
7,987.3
37,223.0
17,609.9
8,828.6
8,781.3
14,331.9
12,949.5
800.7
581.7
1,732.7
-1,151.0
Qatar Central Bank54
Qatar Central Bank (QCB)
QCB continued its efforts and strife towards achieving the provision of most
appropriate environment for the banking system operating in Qatar in 2005, to enable the
banks provide the best level possible of banking services to the public and the economy
at large, especially in light of the fact that these services are developing very fast
worldwide, and to be able to stand the possible competition of foreign banks operating
under the umbrella of Qatar Financial Center, and the banks that might be coming in
soon after Qatar opens the door by joining the WTO. QCB also endeavored during 2005
to deepen the pillars of financial stability for the banking system against the various
types of risks which it may face during the practice of its activities.
QCB Monetary and Banking Policy Developments
Monetary policy during 2005 showed a sufficient degree of flexibility and
adaptation with the current and new events occurring on the international arena
especially those related to the trends of interest rate on the international financial market,
this took the form of several changes in the QCB rates which are considered the basic
indicator for the term structure of domestic interest rates.
In what follows we take up the most important developments witnessed by monetary
and banking policy during the year 2005. This will be done through focusing on the most
important monetary and prudential measures and actions taken by QCB during 2005,
with the view of maintaining the safety and stability of the banking system in addition to
achieving the goals of monetary policy.
1. In Feberay 2005, QCB instructed the commercial banks to provide the new islamic
financing services through a unit (or a division) inside the bank or through an
independent branch. In the first case, the services of islamic financing must be
limited to assets within its financial position over those producing debts from the
beginning of transaction.
2. QCB issued instructions at the beginning of March 2005 to all national banks
operating in Qatar to adopt the standard criterion of calculating the ratio of capital
adequacy applicable to credit risk and market risk, and to adopt the simple criterion
in calculating operational risk according to the Basel II Accord, and the continuation
of applying the 10% minimum in calculating the ratio of capital adequacy. QCB also
instructed all the banks to catculate the ratio of capital adequacy of Basel II in an
experimental basis up to December 31st, 2005 and inform the QCB with them on a
regular monthly basis.

Twenty Ninth Annual Report 55
3. On the same date, QCB issued instruction exempting the companies affiliated to any
bank which are entirely owned by the bank from the ceiling imposed on the banks'
subscriptions in the capital of companies which is currently set at 30% of the bank's
capital and reserves.
4. In the second half of March 2005, QCB allowed banks to open accounts for foreign
companies which do not operate in Qatar, given the necessity of taking into
consideration the special instructions of money laundering and fighting terrorism.
5. On the same date, QCB issued instructions regarding the concentration of bank’s
deposits and credits in other banks and financial institutions, where it was decided to
set the ceiling for the subsidiary and associated companies of national banks which
practice banking and financial activities at 20% of the capital and reserves, except
those companies which issue their financial statements consolidated with those of
the bank.
6. At the begging of June 2005, QCB issued instructions to all banks operating in Qatar
concerning the necessity to provide QCB with the banks' policies in applying Basel
II Accord and the steps taken towards improving their systems, data and the date
expected to complete the application of the said accord.
7. In the middle of July 2005, QCB introduced several changes to the basis of granting
real estate financing by all banks such that it should not exceed 150%, 200% of the
bank's capital and reserves or 15%, 20% of the bank's total deposits for commercial
traditional banks and Islamic banks, respectively. In the middle of the following
month, QCB decided that the finance of every project must not exceed 65% of the
requested financing, given that the client's contribution in the project must be used
before starting to use the bank's credit.
8. In the middle of August 2005, QCB decided to set the end of November 2005 as the
final deadline for the application of the new system which uses the smart card and to
adapt the banks' systems with the criterion EMV.
9. In the middle of September 2005, QCB sent all banks operating in Qatar a circular
regarding the bases and criteria for credit accounts classification and determining the
provisions taken on them for consultation and consideration.
10. In the second half of September 2005, QCB notified all banks operating in Qatar that
the decision has been made to start the experimental automated implementation of
the Basel II system during the first half of October 2005, using the data of
September 2005.

Qatar Central Bank56
11. In the second half of November 2005, QCB issued instructions to all banks operating
in Qatar concerning the rules for classifying credit and setting the provisions to be
taken on them.
12. In the middle of December 2005, QCB consulted all banks operating in Qatar on the
possibility of making adjustments to the basis used to calculate the liquidity
adequacy ratio and the ratio of credit to deposits.
13. At the end of December 2005, QCB issued a circular containing instruction to all
banks operating in Qatar regarding the necessity of modifying the classification and
valuation of their financial investments in light of the new adjustments that took
place in the international accounting standard (IAS No. 39).
QCB Balance Sheet
Available data indicate that the accelerated growth of QCB total assets (liabilities)
during the past few years, has continued in 2005 as it increased by QR 4.4 billion, or
34.1%, reaching about QR 17.3 billion by the end of 2005 vis-à-vis QR 12.9 billion by
the end of 2004.
On the liabilities side, the growth in total liabilities resulted from growth in all of the
components, except the revaluation account, which shrank by QR 226.9 million, or
23.5%, reflecting a decline in the value of some foreign securities owned by QCB due to
rising international interest rates – especially on the US Dollar which accounts for most
of QCB foreign assets. The balance of domestic banks' accounts held at QCB constituted
the second major source of liabilities increase, as it increased by QR 1.8 billion, or
63.2%, to reach a total of QR 4.7 billion by the end of 2005 vis-à-vis QR 2.9 billion by
the end of 2004. The increase in capital and reserves represented the first source of
growth on the liabilities side in 2005; which increased by QR 2.2 billion or 39.5% to
reach QR 7.7 billion by the end of 2005, vis-à-vis QR 5.5 billion by the end of 2004. The
remaining items on the liabilities side witnessed a smaller growth in absolute value, most
important of which was currency issued, which increased by QR 408 million or 13.1%
by the end of 2005, reaching a balance of QR 3.5 billion vis-à-vis QR 3.1 billion by the
end of 2004.
On the assets side, foreign bonds and T-Bills contributed approximately the entire
increase in total assets, whereas another item (balances with foreign banks) continued its
growth through the decrease that occurred in the remaining assets. Foreign bonds and
T-Bills increased by QR 4.4 billion or 44.6% to reach a balance of QR 14.1 billion by
the end of 2005 vis-à-vis QR 9.8 billion by the end of 2004; while balances held with
foreign banks increased by QR 275 million, or 14.5%, reaching a balance of QR 2.2
billion by the end of 2005 vis-à-vis QR 1.9 billion by the end of 2004.

Twenty Ninth Annual Report 57
Table No (2-8)
Financial Accounts of Qatar Central Bank
Balances with Foreign Banks
Foreign Bonds and T-Bills
Qatar's IMF Reserve Position
Holdings of SDRs Deposits
Gold
Balances with Local Banks
Unclassified Assets
Assets = Liabilities
Currency Issued
Due to the Government of Qatar
Capital and Reserves
Revaluation Account
Required Reserves
Deposits of Domestic Banks
Unclassified Liabilities
ItemsChange
275.0
4,358.7
-192.5
-0.7
-30.5
-8.8
-14.3
4,386.9
408.0
93.5
2,173.8
-226.9
607.9
1,223.1
107.5
14.5
44.6
-51.6
-0.5
-45.9
-2.4
-5.3
34.1
13.1
55.5
39.5
-23.5
37.6
95.6
52.6
Million QR
Value %2004
1,894.1
9,762.5
372.8
136.8
66.5
366.7
267.7
12,867.1
3,123.2
168.6
5,508.2
966.8
1,616.6
1,279.4
204.3
2005
2,169.1
14,121.2
180.3
136.1
36.0
357.9
253.4
17,254.0
3,531.2
262.1
7,682.0
739.9
2,224.5
2,502.5
311.8
The indicators of foreign assets’ adequacy held by QCB reveal a strong
development in QCB foreign assets; realizing a growth during 2005 that amounted to
QR 4.4 billion or 36.1% reaching a balance of QR 16.6 billion by the end of 2005,
vis-à-vis QR 12.2 billion by the end of 2004. Thus, the coverage ratio of currency
issued (stated by QCB Statute to be no less than 100%) jumped to 471.4% by the end
of 2005 vis-à-vis 391.7% by the end of 2004, an increase by 79.6 percentage points or
20.3%. It is worth mentioning that the QCB foreign assets coverage ratio of the
monetary base (which includes in addition to currency issued the balances of banks'
accounts at QCB) has reached 201.5% by the end of 2005, decreasing slightly by 1.7
percentage points from the end of 2004.

Qatar Central Bank58
Table No (2-9)
Indicators of QCB’s Foreign Assets Sufficiency
Foreign Assets
Currency Issued
Monetary Base
Percentage Asset Coverage to:
Currency Issued (%)
Monetary Base (%)
Items
12,232.7
3,123.2
6,019.2
391.7
203.2
16,642.7
3,531.2
8,258.2
471.3
201.5
Million QR
2004 20052002
5,473.5
2,266.6
3,995.5
241.5
137.0
2003
10,468.7
2,600.2
4,589.9
402.6
228.1
Table No (2-10)
Financial Statement of Qatar Central Bank (2002–2005)
Balances held with Foreign Banks
Foreign Bonds and T-Bills
Qatar's Share in the IMF
Special Drawing Rights Deposits
Gold
Balances held with Local Banks
Claims against the Government
Unclassified Assets
Assets = Liabilities
Currency Issued
Due to the Government of Qatar
Capital and Reserves
Revaluation Account
Required Reserves
Deposits of Domestic Banks at QCB
Unclassified Liabilities
Items
1,894.1
9,762.5
372.8
136.8
66.5
366.7
0.0
267.7
12,867.1
3,123.2
138.6
5,508.2
966.8
1,616.6
1,279.4
204.3
2,169.1
14,121.2
180.3
136.1
36.0
357.9
0.0
253.4
17,254.0
3,531.2
262.1
7,682.0
739.9
2,224.5
2,502.5
311.8
Million QR
2004 20052002
678.2
4,342.0
326.4
102.6
24.3
28.0
135.1
367.5
6,004.1
2,266.6
0.0
1,432.3
299.4
1,242.8
486.8
276.9
2003
1,610.0
8,351.4
356.7
121.7
28.9
96.6
16.0
338.0
10,919.3
2,600.2
0.0
5,324.6
800.7
1,443.8
545.9
204.1

Twenty Ninth Annual Report 59
Interest Rates
QCB policy towards interest rates was direct control of interest rates on deposits and
credit until the middle of 1995. By mid of August 1995, QCB adopted a new policy
according to which interest rates were gradually floated. At the beginning, QCB fully
floated the interest rates charged on credit; then in the middle of April 1998, QCB
floated interest rates paid on time deposits of maturities longer than 15 months; in
January 1999, QCB floated the interest rates paid on time deposits of maturities longer
than 12 months; finally, at the beginning of 2000, QCB fully floated all interest rates
paid on deposits.
Due to the fact that QCB uses reserve requirements basically as a precautionary
measure, and due to the fact that other monetary instruments are inactive (e.g. Repo
transactions) or rarely used (e.g. outright sale and purchase of the U.S dollar), interest
rates remain the most effective instrument among all instruments of monetary policy
available to QCB.
The general framework of QCB interest rates consists of a two-sided monetary
mechanism called QMR, in addition to the traditional Repo facility. The QMR contains
multi-maturity lending and deposit standing facilities.
The general interest rate framework at QCB consists of three official interest rates,
namely, QCB overnight lending rate (QCBLR), QCB overnight deposit rate (QCBDR),
and QCB Repo Rate (QCBRR). The Repo rate is currently limited to two-weeks and
one-month maturities.
The overnight QCBLR is considered as the main rate that is used by QCB for
signaling to the money market and for transparent adjustments of the monetary policy of
QCB. Lowering it indicates an expansionary, while raising it indicates a contractionary,
policy.
QCB continued raising its official interest rates in a manner consistent with the
official interest rate targeted by the U.S Federal Reserve System during 2005; where
QCB gradually raised the QCB lending rate to reach 4.50% by the end of December
2005. Similarly, QCB raised its QCB deposit rate gradually to reach 4.40% by the end of
December 2005. QCB was also concerned about the necessity of having consistency
between the QCB Repo rate and the interest rates on the US Dollar and other major
foreign currencies. Thus, QCB gradually raised QCBRR to reach 5.10% by the end of
December 2005. Table No (2-11) presents the official interest rates targeted by the US
Federal Reserve and QCB interest rates.

Qatar Central Bank60
Table No (2-12)
Cumulative and Daily Averages of QMR Transactions
Period(End-of-Month)
Jan. 2005
February
March
April
May
June
July
August
September
October
November
December
Total
QMR Deposits
Cumulative Daily Average
QMR Credit
Cumulative Daily Average
QMR Balance (net)
Cumulative Daily Average
9,760.5
17,853.0
23,924.5
21,653.0
22,935.0
30,047.5
26,819.0
33,306.0
30,164.0
27,577.5
26,025.0
28,635.5
298,700.5
314.9
637.6
771.8
721.8
739.8
1,001.6
865.1
1,074.4
1,005.5
889.6
867.5
923.7
818.4
380.0
567.5
435.0
40.0
156.5
318.0
26.0
00.0
56.3
132.0
00.0
232.0
2,343.3
12.3
20.3
14.0
1.3
5.0
10.6
0.8
-
1.9
4.3
-
7.5
6.4
-9,380.5
-17,285.5
-23,489.5
-21,613.0
-22,778.5
-29,729.5
-26,793.0
-33,306.0
-30,107.7
-27,445.5
-26,025.0
-28,403.5
-296,357.2
-302.6
-617.3
-757.7
-720.4
-734.8
-991.0
-864.3
-1,074.4
-1,003.6
-885.3
-867.5
-916.2
-811.9
Table No (2-11)
The US-Targeted Federal Funds Rate and the QCB Policy Interest Rates
Period(End-of-Month)
(%)
Jan. 2005
February
March
April
May
June
July
August
September
October
November
December
The Federal FundsRate Targeted by theUS Federal Reserve
2.25
2.50
2.75
2.75
3.00
3.25
3.25
3.50
3.75
3.75
4.00
4.25
QCBLR
2.60
2.80
3.05
3.05
3.30
3.30
3.55
3.80
4.05
4.20
4.25
4.50
QCBDR
2.50
2.75
3.00
3.00
3.25
3.25
3.50
3.75
4.00
4.00
4.15
4.40
QCBRR (Repo Rate)
3.15
3.40
3.65
3.65
3.90
3.90
4.15
4.40
4.65
4.85
4.85
5.10
QMR Transactions
The QMR transactions reflected the reactions of commercial banks towards the
changes that took place in QCB interest rate policy during 2005. Table No (2-12)
presents monthly cumulative values of QMR transactions (deposits, lending and their net
balance) and their daily averages during 2005.
Million QR

Twenty Ninth Annual Report 61
Table No (2-13)
Aggregated Balance Sheet of the Banks Operating in Qatar
Cash and Balances with QCB
Collectable Cheques
Financial Assets Portfolio
Due from Banks & Financial Institutions
Total Credit Facilities
Inside Qatar
Abroad
Long-Term Investments
Other Assets
Total Assets = Total Liabilities
Due to Qatar Central Bank
Due to Banks and Financial Institutions
Customers' Deposits
Provisions
Other Liabilities
Shareholders' Equity
Memoranda Accounts
ItemsChange 2005-04
1,802
35
2,675
11,316
20,223
19,045
1,179
1,718
413
38,182
84
2,838
24,601
-476
5,772
5,364
13,036
52.1
28.2
19.2
54.8
40.9
39.5
99.2
81.5
20.9
41.6
24.8
30.4
40.5
-13.3
122.0
41.6
24.6
Million QR
Value %2005
5,264
159
16,632
31,956
69,634
67,267
2,368
3,825
2,386
129,856
423
12,177
85,400
3,102
10,503
18,251
66,065
2004
3,462
124
13,957
20,640
49,411
48,222
1,189
2,107
1,973
91,674
339
9,339
60,799
3,578
4,731
12,887
53,030
2003
2,492
179
11,480
15,132
43,730
43,289
441
1,065
1,686
75,764
98
5,538
52,964
3,916
4,558
8,690
38,845
2002
2,115
78
9,901
12,170
36,175
35,928
247
650
1,267
62,356
22
3,062
45,770
3,688
2,691
7,123
23,638
2001
1,732
72
8,888
9,726
35,466
33,981
1,485
-
1,208
57,092
79
2,633
42,518
3,016
2,384
6,463
24,883
Commercial Banks
Banks’ Aggregated Balance Sheet
The aggregated balance sheet of all commercial banks operating in Qatar, (total
assets) reached QR 129,856 million by the end of 2005, reflecting an increase by QR
38,182 million, or 41.6%, in 2005, vis-à-vis an increase by QR 15,909 million, or 21.0%,
by the end of 2004. This increase was a result of the high rate of growth achieved by
these banks over the last five years, especially in the field of financial intermediation, in
tandem with the pace of the fast growth rates realized by the Qatari economy during this
period. The following is a brief description of the most important developments on the
aggregate assets side.
Assets
The increase in total assets during 2005 stemmed from increases in each of the
following assets’ components; credit facilities increased by QR 20,223 million, or 40.9%;
due balances from other banks and financial institutions increased by QR 11,316 million,
or 54.8%, (90 per cent caused by increase in balances held at banks and financial
institutions abroad); bank’s financial investments in securities increased by QR 2,675
million, or 19.2%; and long-term investment increased by QR 1,718 million, or 81.5%.

Qatar Central Bank62
0
20
40
60
80
100
120
140
2001 2002 2003 2004 2005
Billion QR
Figure (2-3):
Development of Banks' Aggregated Assets
0
5
10
15
20
25
30
35
40
45
50
2001 2002 2003 2004 2005
Billion QR
Local Currency
Foreign Currencies
1. Domestic Banks’ Credit
Domestic credit facilities recorded an
increase in 2005 by QR 19,045 million, or
39.5%, versus an increase by QR 4,933 million,
or 11.4%, in 2004. Total domestic credit
recorded a new level of QR 67,267 million, by
the end of 2005, representing about 51.8% of
total banks' assets. The increase in domestic
credit during 2005 is reflective of the expanding
role played by Qatar’s private sector, especially,
in real-estate and infrastructural projects
development.
The major developments of banks' credit
extended in 2005 are as follows:
A: Currency Classification of Bank's Domestic Credit
Total domestic credits extended in QR by all banks operating in Qatar reached QR
46,709 million, representing 69.4% of the total extended credit in both QR and foreign
currencies during 2005; compared with QR 30,938 million by the end of 2004 and
representing 64.2% of the total domestic credit extended in 2004.
On the other hand, Table No. (2-14), which presents the currency classification of
domestic credit facilities extended by all banks in 2005, reveals that the realized
increase in national-currency-denominated
domestic credit, which amounted to QR 15,771
million, or 51.0%, in 2005, is much larger than
(almost fourfold) the increase realized in 2004,
which amounted to QR 3,880 million, or 14.3%.
Meanwhile, the foreign-currency-denominated
domestic credit also recorded a less sharp
increase of QR 3,274 million, or 18.9 %, in
2005, versus an increase of QR 1,053 million, or
6.5%, in 2004.
However, the different growth rates in the
two credit components led to an increase in the
ratio of QR-credit to total domestic credits, from
64.2% (QR 30,938 million) by the end of 2004,
Figure (2-4):
Currency Classification of Domestic Bank Credit

Twenty Ninth Annual Report 63
Domestic Credit in National Currency
Domestic Credit in Foreign Currency
Total Domestic Credits
Domestic Credits / Total Assets
ItemsChange 2005-04
15,771
3,274
19,045
-
51.0
18.9
39.5
-
Million QR
Value %2005
46,709
20,558
67,267
51.8%
2004
30,938
17,284
48,222
52.6%
2003
27,058
16,231
43,289
57.1%
2002
22,995
12,933
35,928
57.6%
2001
22,368
11,613
33,981
59.5%
to 69.4% (QR 46,709 million) end-2005. And the ratio of foreign-currency-denominated
credit to total domestic credits declined from 35.8% end-2004 to 30.6% end-2005. The
decline in the ratio came as a result of faster growth in the national-currency component
than the growth in the foreign-currency component of these credits, and not due to a
decline in their value.
B: Sectoral Distribution of Domestic Bank Credit
The sectoral distribution of banks' domestic credit extended in 2005 revealed that
the private sector acquired more than 99.1% of the increase in domestic credit extended.
Hence, the share of the private sector in bank's outstanding credit increased by QR
18,864 million, or 63.4% in 2005, versus an increase of QR 6,395 million, or 27.4%, in
2004. The private sector's outstanding credit balance reached QR 48,617 million by the
end of 2005; and accounted for 72.3% of the total outstanding credit balances.
Most of the increase in private sector credit was distributed as follows:
• Consumption loans granted to the household sector increased by QR 10,646 million, or
75.6%, reaching QR 24,731 million by the end of 2005. The relative share of this
category of loans at the end of 2005 was 36.8% of total credit facilities. This relative
share revealed that banks continued to target the household sector as their main source
of demand for bank loans. In general, financing stock market speculative activities and
subscriptions in Initial Public Offering (IPO's) activities during 2005 accounted for a
good part of the demand for this type of banking system credit.
• Loans extended to the "real-estate and construction" sector also increased by QR 3,829
million, or 67.0%, reaching QR 9,541 million by the end of 2005, versus a smaller
numerical increase (but larger proportional increase) of QR 2,385 million, or 71.7%,
by the end of 2004. The increases in this category of loans recorded in 2004 and 2005
are clearly a mere manifestation of the contemporaneous and unprecedented expansion
of building activities in housing, construction projects and infrastructure sector in
Qatar.
Table No (2-14)
Currency Classification of Domestic Bank Credit
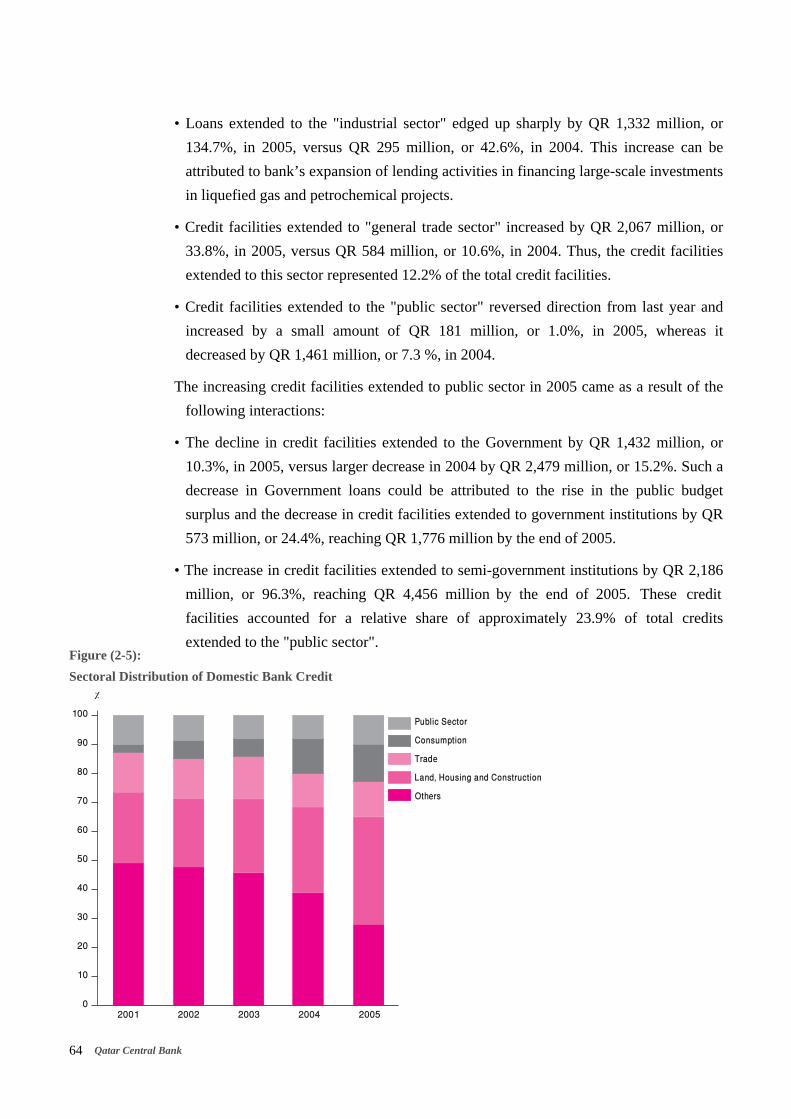
Qatar Central Bank64
0
10
20
30
40
50
60
70
80
90
100
٪
2001 2002 2003 2004 2005
Public Sector
Consumption
Trade
Land, Housing and Construction
Others
Figure (2-5):
Sectoral Distribution of Domestic Bank Credit
• Loans extended to the "industrial sector" edged up sharply by QR 1,332 million, or
134.7%, in 2005, versus QR 295 million, or 42.6%, in 2004. This increase can be
attributed to bank’s expansion of lending activities in financing large-scale investments
in liquefied gas and petrochemical projects.
• Credit facilities extended to "general trade sector" increased by QR 2,067 million, or
33.8%, in 2005, versus QR 584 million, or 10.6%, in 2004. Thus, the credit facilities
extended to this sector represented 12.2% of the total credit facilities.
• Credit facilities extended to the "public sector" reversed direction from last year and
increased by a small amount of QR 181 million, or 1.0%, in 2005, whereas it
decreased by QR 1,461 million, or 7.3 %, in 2004.
The increasing credit facilities extended to public sector in 2005 came as a result of the
following interactions:
• The decline in credit facilities extended to the Government by QR 1,432 million, or
10.3%, in 2005, versus larger decrease in 2004 by QR 2,479 million, or 15.2%. Such a
decrease in Government loans could be attributed to the rise in the public budget
surplus and the decrease in credit facilities extended to government institutions by QR
573 million, or 24.4%, reaching QR 1,776 million by the end of 2005.
• The increase in credit facilities extended to semi-government institutions by QR 2,186
million, or 96.3%, reaching QR 4,456 million by the end of 2005. These credit
facilities accounted for a relative share of approximately 23.9% of total credits
extended to the "public sector".

Twenty Ninth Annual Report 65
Table No (2-15)
The Sectoral Distribution of Domestic Bank Credit (2001-2005)
Public Sector
Government
Government Institutions
Semi-Government Institutions
Private Sector
General Trade
Industry
Construction
Real Estate
Consumption
Services
Others
Total Domestic Credit Facilities
ItemsChange 2005-04
181
-1,432
-573
2,186
18,864
2,068
1,331
1,700
2,129
10,646
558
432
19,045
1.0
-10.3
-24.4
96.3
63.4
33.8
134.7
102.5
52.5
75.6
23.4
92.3
39.5
Million QR
Value %2005
18,651
12,419
1,776
4,456
48,617
8,184
2,319
3,358
6,183
24,731
2,942
900
67,268
2004
18,470
13,851
2,349
2,270
29,752
6,116
988
1,658
4,054
14,085
2,384
468
48,222
2003
19,931
16,330
2,122
1,479
23,358
5,532
693
1434
1,894
11,503
1,865
437
43,289
2002
16,832
13,930
1,937
965
19,097
4,722
898
1452
1181
9,075
1,389
380
35,929
2001
16,530
15,096
1,198
236
17,451
4,047
577
718
415
8,882
1071
1,741
33,981
2. Banks’ Aggregate Portfolio of Financial Investments
Bank’s aggregate portfolio of financial investments rose by QR 2,675 million, or
19.2%, in 2005, reaching QR 16,632 million, versus a smaller increase (in value only) by
QR 2,477 million, or 21.6%, in 2004. However, the ratio of financial-investment
portfolio to commercial banks' total assets fell from a stable level of 15.2% by the end of
2003 and by the end of 2004 to 12.8% by the end of 2005, indicating a faster increase in
total assets than the increase in the aggregate financial-investment portfolio. The
increase in the aggregate financial-investment portfolio in 2005 could be decomposed
into the following sources:
1. Increase in domestic financial securities by QR 1,753 million, or 20.3%, reaching QR
10,376 million end-2005. The relative importance of banks' investment in domestic
financial securities was 62.4% of banks' total financial investments end-2005. The
increase resulted from banks changing their investment portfolios in favor of the
"domestic shares" component, increasing it by QR 2,167 million, or 61.5%, and
decreasing domestic government securities component by QR 414 million, or 8.1%
due to the redemption of maturing securities in 2005.
2. Increase in foreign securities by QR 921 million, or 17.3%, reaching QR 6,255 million
end-2005. Foreign financial assets represent approximately 37.6% of the banks' total
financial investments. The most notable sources of the increase in 2005 were the
foreign "shares" item which increased by QR 143 million, or 317.8% in 2005, versus

Qatar Central Bank66
25.0% in 2004; the foreign "other bonds" item, which increased by QR 363 million, or
27.9% in 2005 versus a decline by (-79.5%) in 2004; and finally the foreign
"government securities", which increased by QR 355 million, or 9.0% in 2005, versus
an increase by 14.1% in 2004.
3. Cash Assets
The aggregated banks’ cash assets increased by QR 1,802 million, or 52.1%, in
2005, versus QR 970 million, or 38.9%, in 2004. The banks' cash assets reached QR
5,264 million end-2005. This notable increase in banks' cash assets led to an increase in
the ratio of cash assets to total assets from 3.8% in 2004 to 4.1% in 2005.
Increased cash assets are attributed to the following:
1. The increase in Required Reserves held at QCB by QR 646 million, or 40.0%,
reflecting the increase in banks' deposit base to which the ratio of required reserve is
applied uniformly to all types of deposits, a ratio that has not changed in 2005.
2. The notable increase in QMR deposits held at QCB (the indirect monetary policy
instrument to absorb excess reserves) by QR 925 million, or 163.4%, reaching QR
1,491 million at the by the end of 2005, from its end of 2004 level of QR 566
million.
3. The increase in banks' excess reserves by QR 77 million or 11.2%, in 2005, reaching
QR 762 million by end-2005.
Table No (2-16)
Banks’ Consolidated Financial Investments Portfolio
Domestic Securities:
Government Securities
Shares
Total Domestic Securities
Foreign Securities:
Government Securities
Other Bonds
Shares
Others
Total Foreign Securities
Total Portfolio of Financial Assets
Ratio of (Financial Assets Portfolio/ Total Assets)
ItemsChange 2005-04
- 8.1
61.8
20.3
9.0
27.9
317.8
153.8
17.3
19.2
-
Million QR
Value %2005
- 414
2,167
1,753
355
363
143
60
921
2,675
-
2004
4,703
5,673
10,376
4,305
1,663
188
99
6,255
16,631
12.8%
2003
5,117
3,506
8,623
3,950
1,300
45
39
5,334
13,957
15.2%
2002
5,066
1,822
6,888
3,461
905
36
190
4,592
11,480
15.2%
6,452
772
7,224
1,800
656
51
170
2,677
9,901
15.9%

Twenty Ninth Annual Report 67
Table No (2-17)
Cash Assets
Cash
Balances with QCB
• Required Reserves
• QMR Deposits
• Excess Reserves
Total Cash Assets
Ratio of (Cash Assets/Total Assets)
ItemsChange 2005-04
154
1,648
646
925
77
1,802
-
25.9
57.5
40.0
163.4
11.2
52.1
-
Million QR
Value %2005
748
4,516
2,263
1,491
762
5,264
4.10%
2004
594
2,868
1,617
566
685
3,462
3.8%
2003
509
1,983
1,444
193
346
2,492
3.3%
2002
393
1,723
1,242
304
177
2,116
3.4%
2001
361
1,371
1,141
0
230
1,732
3.0%
Liabilities
The aggregated balance sheet of commercial banks in 2005 indicated an increase in
total liabilities, which mainly came from rises in customers’ deposits by QR 24,601
million; shareholders’ equity by QR 5,364 million; and balances due to banks and other
financial institutions by QR 2,838 million. The increase in total liabilities was partially
offset by the decrease in provisions by QR 476 million, as a result of banks' writing off
some of their bad loans in 2005.
The most important developments on the liabilities side are briefly described in the
following items:
1. Customer Deposits
Banks’ total deposits increased by QR 24,601 million (from QR 60,799 million to
QR 85,400 million) or 40.5%,in 2005; versus a much smaller increase of QR 7,835
million, or 14.8% in 2004. However, the ratio of total deposits to total liabilities declined
slightly end-2005 (from 66.3% end-2004 to 65.8%), reflecting a faster rate of growth in
total liabilities, which was 41.6% in 2005.
A. Classification of Banks’ Customer Deposits by Maturity
Classification-by-maturity of the deposits in 2005 indicated that demand deposits
increased notably by QR 13,328 million, or 68.8%, in 2005, versus a much smaller
increase of QR 4,056 million, or 26.5%, in 2004. As a result, the ratio of demand
deposits to total deposits rose from 31.9% end-2004 to 38.3% end-2005. The increase
stemmed mainly from increases in personal and private-companies' deposits, and could
be attributed to the surge in trade and financial transactions of these two sectors.
Consequently, the value of checks cleared by QCB Clearing System during 2005
amounted to QR 115,822 million, vis-a-vis QR 65,523 million during 2004.

Qatar Central Bank68
Table No (2-18)
Maturity and Currency Classification of Bank's Customer Deposits
Total Deposits
Demand Deposits
Time & Saving Deposits
Deposits in National Currency (QR)
Demand Deposits
Time & Saving Deposits
Deposits in Foreign Currencies
Demand Deposits
Time & Saving Deposits
ItemsChange 2005-04
24,601
13,328
11,273
14,994
9,564
5,430
9,606
3,764
5,842
40.5
68.8
27.2
36.6
62.7
21.1
48.4
91.6
37.1
Million QR
Value %2005
85,400
32,700
52,700
55,930
24,826
31,104
29,470
7,874
21,596
2004
60,799
19,372
41,427
40,936
15,262
25,674
19,863
4,110
15,753
2003
52,964
15,316
37,648
35,974
11,050
24,924
16,990
4,266
12,724
2002
45,770
11,234
34,536
28,962
7,588
21,374
16,808
3,646
13,162
2001
42,518
4,067
38,452
26,385
3,767
22,619
16,133
300
15,833
Similarly, savings and time deposits increased by QR 11,273 million, or 27.2%,
reaching QR 52,700 million end-2005, versus an increase of QR 3,779 million, or
10%, end-2004. These deposits represented a relative share of 61.7% of total
deposits. The increase in savings and time deposits during 2005 could be attributed
to rising interest rates, whether these deposits were denominated in QR or in foreign
currencies.
B. Classification of Banks' Customer Deposits by Currency
The classification-by-currency of customers’
deposits indicated that total deposits
denominated in national currency increased by
QR 14,994 million, or 36.6%, and total deposits
denominated in foreign currencies increased by
QR 9,606 million, or 48.4%, in 2005. The
foreign-currency deposits component amounted
to QR 29,470 million at the end of 2005. The
relative share of foreign-currency deposits in
total deposits increased from 32.7% in 2004 to
34.5% in 2005. The most notable contributors in
the increase in foreign-currencies deposits were
the increases in government and
semi-government institutions, and private
companies’ deposits by QR 6,899 million and
QR 1,383 million, respectively.0
10
20
30
40
50
60
2001 2002 2003 2004 2005
Billion QR
Local Currency
Foreign Currencies
Figure (2-6) :
Currency Classification of Banks' Customer Deposits

Twenty Ninth Annual Report 69
C. Classification of Banks' Customer Deposits by Economic Sectors
The classification-by-economic sectors of banks customers’ deposits indicated that
the "private sector" contributed 63.8% of the increase in total deposits in 2005. The
private-sector deposits increased by QR 15,701 million, or 42.2% in 2005. Private
companies’ deposits increased notably by QR 10,245 million, or 91.8%, in 2005, versus
QR 3,187 million, or 39.9%, in 2004. Personal deposits continued in the position of
being the principal component of total customers’ deposits, constituting 36.8% of total
deposits. Personal deposits increased by QR 5,457 million, or 21%, reaching QR 31,465
million by the end of 2005.
Non-resident deposits continued to increase
noticeably, however at a slower pace, for the
second consecutive year. The non-resident
deposits increased by QR 234 million, or 43.7%, in
2005, versus QR 256 million, or 91.8%, in 2004.
On the other hand, "public sector" deposits
increased by QR 8,666 million, or 37.5%, in 2005,
versus QR 1,115 million, or 5.1%, in 2004. The
increase in this category of deposits was
concentrated mainly in government and
semi-government institutions, their deposit
increases in 2005 were QR 4,265 million and QR
3,433 million, respectively. Whereas, Government
deposits reversed direction in 2005 and increased
by QR 968 million, or 12.7%, versus a decrease by
QR 1,477 million, or 16.2%, in 2004.0
5
10
15
20
25
30
35
40
2001 2002 2003 2004 2005
Billion QR
Personal
Private Companies
Govt. Inst.
Govt.
Semi Govt. Inst.
Figure (2-7):
Banks' Deposits Classification by Economic Sectors
Table No (2-19)
Classification of Banks’ Deposits by Economic Sectors
Public Sector
Government
Government Institutions
Semi-governments Institutions
Private Sector
Private Companies
Personal
Non-Resident
Total Deposits
ItemsChange 2005-04
8,666
968
4,265
3,433
15,702
10,245
5,457
234
24,601
37.5
12.7
41.1
67.4
42.2
91.8
21.0
43.7
40.5
Million QR
Value %2005
31,755
8,595.2
14,630.3
8,529.8
52,876
21,411
31,465
769
85,400
2004
23,090
7,627
10,366
5,097
37,174
11,166
26,008
535
60,799
2003
21,975
9,104
8,506
4,366
30,710
7,979
22,731
279
52,964
2002
18,680
4,070
11,481
3,129
26,806
6,710
20,096
284
45,770
2001
18,028
3,712
11,793
2,524
24,490
5,719
18,771
-
42,518
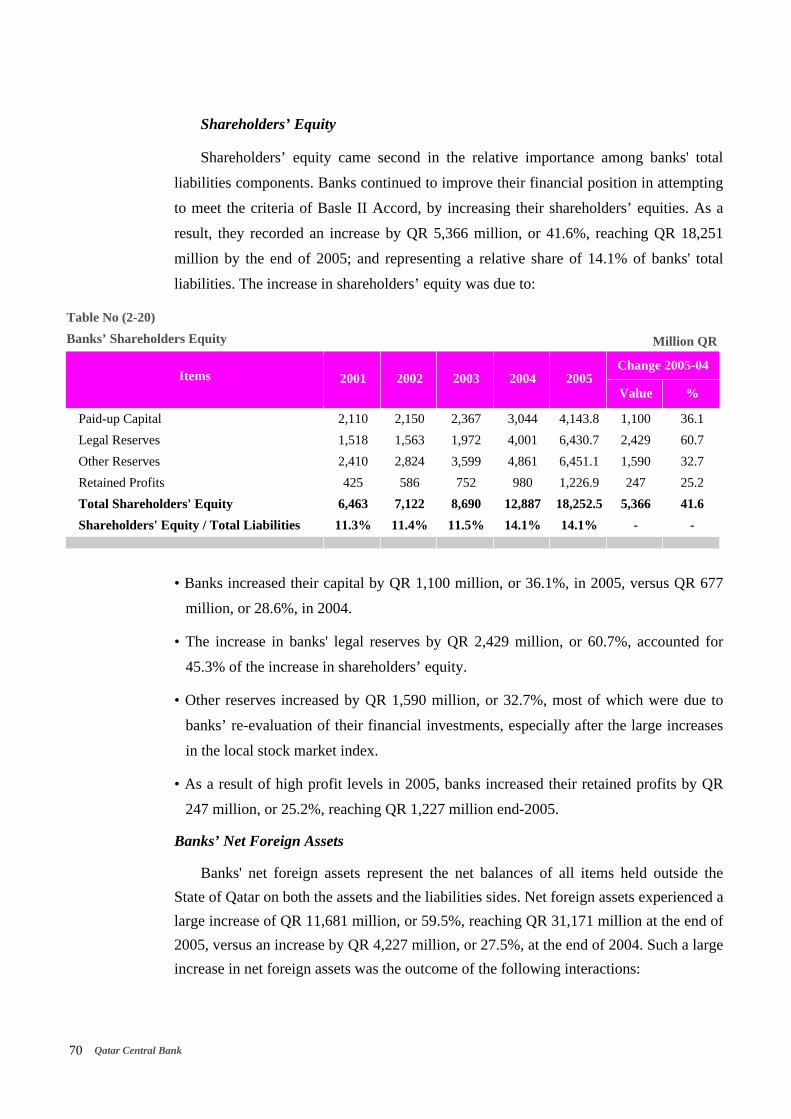
Qatar Central Bank70
Table No (2-20)
Banks’ Shareholders Equity
Paid-up Capital
Legal Reserves
Other Reserves
Retained Profits
Total Shareholders' Equity
Shareholders' Equity / Total Liabilities
ItemsChange 2005-04
1,100
2,429
1,590
247
5,366
-
36.1
60.7
32.7
25.2
41.6
-
Million QR
Value %2005
4,143.8
6,430.7
6,451.1
1,226.9
18,252.5
14.1%
2004
3,044
4,001
4,861
980
12,887
14.1%
2003
2,367
1,972
3,599
752
8,690
11.5%
2002
2,150
1,563
2,824
586
7,122
11.4%
2001
2,110
1,518
2,410
425
6,463
11.3%
Shareholders’ Equity
Shareholders’ equity came second in the relative importance among banks' total
liabilities components. Banks continued to improve their financial position in attempting
to meet the criteria of Basle II Accord, by increasing their shareholders’ equities. As a
result, they recorded an increase by QR 5,366 million, or 41.6%, reaching QR 18,251
million by the end of 2005; and representing a relative share of 14.1% of banks' total
liabilities. The increase in shareholders’ equity was due to:
• Banks increased their capital by QR 1,100 million, or 36.1%, in 2005, versus QR 677
million, or 28.6%, in 2004.
• The increase in banks' legal reserves by QR 2,429 million, or 60.7%, accounted for
45.3% of the increase in shareholders’ equity.
• Other reserves increased by QR 1,590 million, or 32.7%, most of which were due to
banks’ re-evaluation of their financial investments, especially after the large increases
in the local stock market index.
• As a result of high profit levels in 2005, banks increased their retained profits by QR
247 million, or 25.2%, reaching QR 1,227 million end-2005.
Banks’ Net Foreign Assets
Banks' net foreign assets represent the net balances of all items held outside the
State of Qatar on both the assets and the liabilities sides. Net foreign assets experienced a
large increase of QR 11,681 million, or 59.5%, reaching QR 31,171 million at the end of
2005, versus an increase by QR 4,227 million, or 27.5%, at the end of 2004. Such a large
increase in net foreign assets was the outcome of the following interactions:

Twenty Ninth Annual Report 71
0
5
10
15
20
25
30
35
40
45
2001 2002 2003 2004 2005
Billion QR
Foreign Assets
Foreign Liabilities
Net Foreign Assets
Figure (2-8)
Banks’ Net Foreign Assets (2001-2005)
Table No (2-21)
Banks’ Net Foreign Assets (2001-2005)
Foreign Assets
Foreign Currencies: Cash-in-Vault
Due from Banks Abroad
Financial Investment outside Qatar
Credit Facilities outside Qatar
Foreign Liabilities
Non-residents Deposits
Due to Banks Abroad
Net Foreign Assets
ItemsChange 2005-04
13,882
17
10,246
2,440
1,179
2,201
234
1,967
11,681
50.2
26.2
53.6
33.5
99.2
26.9
43.6
25.8
59.9
Million QR
Value %2005
41,541
82
29,363
9,728
2,368
10,370
769
9,601
31,171
2004
27,659
65
19,117
7,288
1,189
8,169
535
7,634
19,490
2003
19,366
57
13,659
5,208
442
4,104
279
3,825
15,262
2002
14,854
47
11,565
2,995
247
2,668
284
2,384
12,186
2001
11,143
53
8,303
1,301
1,486
2,465
329
2,136
8,678
A. Banks’ Foreign Assets
• Local banks increased their deposit balances with
foreign banks and other financial institutions
abroad by QR 10,243 million, or 53.6%,
comprising 73.8% of the total increase in foreign
assets in 2005, versus an increase by QR 5,459
million, or 40.0% in 2004.
• Banks expanded their investments abroad (both
short and long) by QR 2,440 million, or 33.5%,
reaching QR 9,728 million at the end of 2005.
• Banks continued the expansion of their credit
facilities abroad in 2005. These credits facilities
increased by QR 1,179 million, or 99.2 %,
versus QR 747 million, or 169%, in 2004.
B. Bank's Foreign Liabilities
Banks' foreign liabilities increased by QR 2,201
million, or 26.9%. The increase stemmed from an
increase in balances due to foreign banks, which
increased by QR 1,967 million, or 25.8%, and non-resident deposits by QR 234 million
or 43.6%.

Qatar Central Bank72
Table No (2-22)
Banks’ Memoranda Accounts (2001-2005)
Letters of Credit (LCs)
Letters of Guarantee (LGs)
Deferred Contracts
Unutilized Extended Credits
Others
Total
ItemsChange 2005-04
1,925
9,492
-918
1,626
912
13,037
31.1
62.7
-4.4
18.1
46.6
24.6
Million QR
Value %2005
8,118
24,642
19,826
10,611
2,869
66,066
2004
6,193
15,150
20,744
8,985
1,957
53,029
2003
4,498
10,018
15,264
5,836
3,228
38,844
2002
3,775
9,291
3,902
3,733
2,937
23,638
2001
2,959
8,086
7,688
3,809
2,341
24,883
Banks’ Memoranda Accounts
Banks continued to expand off-balance-sheet activities in 2005 for the third
consecutive year. These activities increased by QR 13,037 million, or 24.6% in 2005
reaching QR 66,065 million by the end of the year, versus a larger increase of QR
14,185 million, or 36.5% in 2004. The increase in 2005 could be attributed mainly to the
following:
• The Letters of Guarantee (LGs) issued by banks increased noticeably by QR 9,492
million, or 62.7%, constituting about 72.8% of the total increase in the memoranda
accounts in 2005, and they also accounted for the largest relative share among all items
of memoranda accounts in 2005, and they also ranked first among the items of
memoranda accounts with a relative share of 37.3%.
• The Letters of Credit (LCs) issued by banks realized the second largest increase among
the memoranda accounts items in 2005; increasing by QR 1,925 million, or 31.1%,
reaching QR 8,118 million, versus an increase by QR 1,695 million, or 37.7%, in
2004. The increase in the value of the LCs came as a logical corollary to the vast
growth in imports of goods associated with the currently witnessed high growth rates
of Qatar's economy.
• The rise in "unutilized extended credits" by QR 1,626 million or 18.1%, reaching about
QR 10,611 million, representing 16.1% of the total memoranda accounts.
• Despite the decline in deferred contracts and other derivatives in 2005 by QR 919
million, or 4.4%; they still ranked second (after the letters of guarantee) among the five
components of memoranda accounts, with a relative share of 30%, or QR 19,826
million.

Twenty Ninth Annual Report 73
(*) The data here includes the Qatar Industrial Development Bank.
Banks’ Performance Indicators*
QCB measures and assesses the soundness of banks’ performance, using a set of
internationally well known indicators that measure capital adequacy, assets quality,
profitability, uses of funds and liquidity. QCB aims at enhancing financial stability and
limiting the likelihood of failure in the banking system by measuring banks’
performance. The following contains a brief analysis of the developments in the reported
indicators.
1. Capital Adequacy Standards
By the implementation of these standards, local banks' ability to maintain sufficient
capital, in both forms core and supplementary, could be monitored and their ability to
face and absorb any financial shock or loss that might arise in the future.
The follow up of capital adequacy ratios in 2005 indicates the following:
• The ratio of core capital (capital + reserves) to total assets showed a slight decline
from 11.7% at the end of 2004, to 11.2% at the end of 2005. Nonetheless, despite this
decline in the ratio, it is still well above the minimum set by QCB at 6%.
• The ratio of core capital to total assets and contingent liabilities weighted by their
risks showed a decrease from 22.1% at the end of 2004, to 21.7% at the end of 2005.
This decline is largely attributable to the banks' expansion of activities, whether at the
level of their assets or off-balance-sheet activities, and the growth of these activities at
faster rates than the increases that took place in the core capital of the banks.
• The ratio of regulatory capital (core + supplementary) to risk-weighted assets and
contingent liabilities reached 24.8% end-2005, vis-à-vis 24.9 % end-2004 (The
minimum ratio is set at 10%).
• On the other hand, the ratio of non-performing loans to capital that provides an
indicator of the capacity of banks’ capital to withstand non-performing loans related
losses, such ratio showed some improvement in 2005. It decreased from 3.6% at the end
of 2004 to 3.3% at the end of 2005. This improvement was due to two factors. The first
was the decrease in non-performing loans of local banks, and the second was the
increase in banks’ capital and reserves.
2. Assets Quality Standards
This group of standards measures the extent of protection against risks driven from
impairment assets. The developments in these standards reflected an improvement in the
quality of assets in 2005. The ratio of non-performing loans to total loans decreased from

Qatar Central Bank74
Table No (2-23)
Relative Distribution of Banks' Credit by Sectors
Public Sector
Government
Government Institutions
Semi Government Institutions
Private Sector
Consumtion Loans
General Trade
Services
Land, Real Estate and Construction
Other Sectors
Items
(%)
2005
27.7
18.4
2.6
6.6
72.3
36.7
12.1
4.4
14.2
4.9
2004
38.2
28.7
4.9
4.7
61.8
29.2
12.7
4.9
11.8
3.2
2003
46.0
37.7
4.9
3.4
54.0
26.5
12.8
4.3
7.7
2.7
2002
46.8
38.7
5.4
2.7
53.2
25.2
13.1
3.9
7.3
3.7
2001
48.6
44.4
3.5
0.7
51.4
26.1
11.9
3.1
6.9
3.3
6.3% at the end of 2004, to 4.3% at the end of 2005. However, the ratios of loans’
provisions to total loans and total provisions to total assets decreased from 87.6% and
3.9%, respectively, end-2004 to 84.3% and 2.4%, respectively, at the end of 2005. Such
decreases were due to writing off a proportion of bad loans during 2005.
Sectoral Distribution of Loans (Credit Concentration)
The analysis of the sectoral distribution of loans provides information on the
distribution of credit facilities extended to economic sectors and measures the
vulnerability of the banking system to risks arising from the concentration of credit
facilities in specific economic sectors or activities.
Table No. (2-23) indicates that local banks continued to concentrate most (81.4%) of
their credit facilities in four main sectors; the Government (18.4%), comsumption loans
(36.7%), real-estate and construction (14.2%) and general trade (12.1%). The table also
shows that the ratios of credit facilities extended to comsumption and real-estate and
construction to total domestic credit facilities moved up from 29.2% and 11.8%, respectively,
by the end of 2004, to 36.7% and 14.2%, respectively, by the end of 2005. Such a trend was
accompanied by the economic boom in Qatar during the last few years. However, QCB has
adopted several prudential measures to protect the banking system against any economic
downturn that may impact the soundness of the banking system. For example, banks were
required to use the salaries of the borrowers as collateral for their comsumption loans. In
addition, QCB requires all traditional banks to apply ceilings (or maximum limits) on bank's
total mortgage financing to all customers not to exceed 150% of the bank's shareholders' equity,
or 15%, of the bank's total customers’ deposits; whichever is smaller, and the average of 200%
of shareholders' equity, or 20% of total customers' deposits for Islamic banks.

Twenty Ninth Annual Report 75
3. Profitability Standards
This set of standards reflects banks’ efficiency and aims at enhancing their financial
positions and distribution of dividends to their shareholders.
The developments in these standards reflected the highest banks’ profitability during
2005, which came as a result of the prosperous Qatari economy during the last five
years. The ratios of net profit to average shareholders’ equity, and to average assets,
recorded a noticeable increase to 28.5% and 4.3%, respectively, end-2005, vis-à-vis
20.8% and 2.8%, respectively, end-2004. Likewise, the ratio of other income to total
income and total assets increased to 39.0 % and 3.1%, respectively, in 2005, vis-à-vis
30.6% and 1.8%, respectively, in 2004. The indicators which demonstrated banks’
ability to reduce their expenses during 2005, i.e., the ratio of other expenses (rather than
interests paid) to total income decreased from 30.5% end-2004, to 22.4% end-2005. And
the ratio of total salaries and wages to total expenses decreased from 38.0 % in 2004, to
35.2% in 2005.
4. Liquidity Standards
These standards measure the banks' ability to fulfill their obligations, particularly
towards their depositors through holding an appropriate portion of their assets in liquid
form.
The developments of liquidity indicators shown in Table (2-24) reflected an
improvement in banks’ liquidity in 2005. The ratio of cash assets to total assets moved
up from 3.7% end-2004 to 4.1% end-2005. Similarly, the ratio of liquid assets to liquid
liabilities rose from 54.8% end-2004 to 55.4% end-2005. In addition, banks have
maintained the ratios of total loans to total depostits and to total assets at 81.7% and
53.5%, respectively, in 2005.
5. Uses of Funds Standards
This set of standards encompasses several ratios that measure the capability of banks
to use their financial resources in generating income. The developments of these ratios
showed that banks continued to expand credit facilities to the private sector. The ratio of
credit facilities extended to the private sector to total credit facilities increased from
60.3% in 2004 to 69.9% in 2005, and represented 92.1% of the private sector deposits in
2005 compared with 80.2% in 2004.
On the other hand, the ratio of total assets denominated in foreign currencies to total
liabilities denominated in foreign currencies continued to decrease, reaching 153.1% at
the end of 2005, versus 159.3% at the end of 2004. The decline of this ratio in the last
two years came as a result of banks' shift in policy towards expanding their activities in

Qatar Central Bank76
domestic markets, where yields on domestic activities are higher than yields abroad,
given the same degree of risk.
6. General Ratios
These general ratios measure the major items in the banks’ balance sheets and their
growth rates. These ratios revealed that the witnessed high growth rate of the Qatari
economy in 2005 affected the major items of the banks’ balance sheet. Deposits and
credit facilities grew by 40.5% and 40.9%, respectively, in 2005, versus 14.8% and
13.0%, respectively, in 2004.

Twenty Ninth Annual Report 77
Table No (2-24)
Indicators of Banks’ Performance
1. Capital Adequacy
Regulatory Tier 1 capital / total assets
Regulatory Tier 1 capital / Risk weighted assets
Regulatory capital / Risk weighted assets
Non-performing loans / capital
2. Standards of Assets Quality
Non-performing loans / total loans
Loans Provision / Non-performing loans
Loans Provision / Total Loans
Total Provision / Total Assets
3. Profitability Standards
Net Profit / Average Shareholders' Equity
Net Profit / Average Total Assets
Net Interest / Average Total Assets
Net Interest / Total Income
Other Income / Average Total Assets
Other Income / Total Income
Other Expenses / Total Income
Wages and Salaries / Other Expenses
4. Liquidity Standards
Cash Balances with QCB/ Total Assets
Liquid Assets / Total Assets
Liquid Assets / Liquid Liabilities
Financial Assets' Portfolio / Total Assets
Total Loans / Customers' Deposits
Total Loans / Total Assets
5. Uses Standards
Loans to Private Sector / Private Sector Deposits
Loans to Private Sector / Total Loans
Domestic Credit/ (Total Deposits+ Shareholders' Equity)
Total Assets/Total Liabilities (in Foreign Currencies)
6. General Ratios
Growth Rate of Total Assets
Growth Rate of Total Customers' Deposits
Growth Rate of Total Credit Facilities
Growth Rate of Financial Assets Portfolio
Items
(%)
2005
11.2
21.7
24.8
3.3
4.3
84.3
3.6
2.4
28.5
4.3
3.0
37.2
3.1
39.0
22.4
35.8
4.0
41.5
55.4
12.9
81.7
53.5
92.1
69.9
64.5
153.1
41.6
40.5
40.9
19.3
2004
11.7
22.1
24.9
3.6
6.3
87.6
5.5
3.9
20.8
2.8
2.7
48.0
1.8
30.6
30.5
38.0
3.7
41.6
54.8
15.3
81.4
53.8
80.2
60.3
65.3
159.3
20.9
14.8
13.0
21.5
2003
10.0
22.2
25.3
6.8
8.1
85.4
6.9
5.2
20.8
2.5
3.0
50.4
1.7
28.9
38.5
31.0
3.2
38.5
50.9
15.3
82.7
57.5
76.2
53.5
70.0
168.3
21.5
15.7
20.9
16.0
2002
10.7
24.4
25.1
17.4
11.1
70.9
7.9
5.9
18.1
2.1
3.3
53.1
1.2
20.0
39.1
30.6
3.4
39.0
51.1
16.0
79.1
57.8
70.7
52.9
67.7
150.6
9.3
7.6
2.0
11.7
2001
11.7
26.9
27.7
21.6
10.7
61.9
6.6
5.3
15.8
1.9
2.0
25.6
1.8
22.9
28.5
30.6
3.0
34.0
44.2
15.6
83.5
61.9
77.4
53.4
69.1
138.6
14.1
17.0
21.9
15.8

Twenty Ninth Annual Report 79
5ChapterFiveThe Financial Sector
Qatar Industrial Development Bank
Qatar Industrial Development Bank (QIDB) is classified by QCB as a specialized
credit institution, specialized in providing finance and other assistance towards the
development of small and medium-size industrial projects in Qatar, whether through
providing loans, participating in the initial capital of these projects, or providing them
with the needed technical assistance. QIDB balance sheets for the past five years
revealed that it had achieved and played an active role in the development activities in
these years. QIDB total assets increased by QR 82.4 million, or 22.8%, during 2005,
reaching QR 444.3 million at the end of 2005.
This increase was allocated on both sides (assets & liabilities) as follows:
1. Assets :
Credit facilities extended by QIDB to industrial-sector projects increased during
2005 by QR 27.3 million, or 37.9%, reaching QR 99.4 million end-2005. Credit facilities
also increased in terms of their relative share of QIDB total assets from 19.9% end-2004
to 22.4% end-2005.
Financial investments (bonds and shares) increased by QR 41.4 million, or 24.3%,
reaching QR 211.7 million at the end of 2005, and representing about 47.6% of total
assets. Following the sharp increase in the domestic financial market (DSM) Index
during 2005, QIDB re-evaluated its financial investment portfolio and resulted in making
it occupy the largest relative share of the increase witnessed in 2005.
Table No (2-25)
Qatar Industrial Development Bank Balance Sheet
Financial Investments Portfolio
Balances due from Banks and FIs
Credit Facilities
Other Assets
Total Assets = Total Liabilities
Due to Banks and Financial Institutions
Customers' Deposits
Provisions
Other Liabilities
Shareholders' Equity
2004 2005ItemsChange 2005-04
170.3
91.7
72.1
27.8
361.9
16.3
-
10.7
3.6
331.3
211.7
80.7
99.4
52.5
444.3
50.9
-
13.3
13.5
366.7
41.4
-11.0
27.3
24.7
82.4
34.6
-
2.6
9.9
35.4
24.3
-12.0
37.9
88.8
22.8
212.3
-
24.3
275.0
10.7
Million QR
Value %2003
141.2
139.1
57.4
25.8
363.5
18.8
0.2
5.8
29.5
309.2
2002
116.6
114.2
38.6
20.6
290.0
14.3
0.3
4.2
9.3
261.9
2001
79.5
122.4
30.1
8.8
240.8
2.4
0.3
1.9
12.3
223.9

Qatar Central Bank80
2. Liabilities
QIDB continued to rely on the long-term source of funds (represented by its
shareholders equity), to finance its activities. Thus, shareholders' equity, which
amounted to QR 366.7 million at the end of 2005, comprised 82.5% of total QIDB
liabilities in the balance sheet, recording an increase of QR 35.4 million, or 10.7%, that
owed to an increase in reserves (of which approximately 69.3% represents revaluation of
fair value reserves as a result of revaluing its financial portfolio assets according to their
market value in the stock market).
Exchange Companies
The aggregated balance sheet of exchange companies demonstrated a noticeable
expansion of the companies' activities during 2005. Their aggregated balance sheet
increased by QR 134.8 million, or 26.6%, during 2005 versus a higher increase of QR
149.7 million, or 42%, during 2004.
Table No (2-26)
Qatar Industrial Development Bank Shareholders' Equity
Paid Capital
Legal Reserves
Other Reserves
Retained Profits
Total Shareholders' Equity
Shareholders' Equity / Total Liabilities
2004 2005ItemsChange 2005-04
200
10.5
89.7
31.1
331.3
91.5%
200
10.5
125.1
31.1
366.7
82.5%
0.0
0.0
35.4
0.0
35.4
-
0.0
0.0
39.5
0.0
10.7
-
Million QR
Value %2003
200
9.1
74.8
25.3
309.2
85.1%
2002
200
6.8
39
16.1
261.9
90.3%
2001
200
4.8
11
8.1
223.9
93.0%
Table No (2-27)
The Aggregated Balance Sheet of Exchange Companies
Cash
Due From Banks
Balances with money exchangers & branches
Financial investments
Fixed assets
Other assets
Total Assets = Total Liabilities Reserves and Capital
Due to banks
Branches & Exchangers accounts
Other liabilities
2004 2005ItemsChange 2005-04
68.1
78
6.2
324.5
19.7
9.5
506.0404.2
63.7
16.9
21.2
74.8
278.7
16
250.4
12.3
8.6
640.8479.8
89.2
46.9
24.9
6.7
200.7
9.8
-74.1
-7.4
-0.9
134.875.6
25.5
30.0
3.7
9.8
257.3
158.1
-22.8
-37.6
-9.5
26.618.7
40.0
177.5
17.5
Million QR
Value %2003
43.1
77.4
9.2
213.0
5.3
8.3
356.3262.0
55.0
17.5
21.7
2002
41.8
70.7
9.2
98.6
5.9
11.5
237.7140.0
60.0
16.7
21.0
2001
36.5
84.9
1.8
53.5
5.7
7.6
19097.4
60.5
13.5
18.6
Twenty Ninth Annual Report 81
The developments in the aggregated exchange companies' balance sheet as of the
end of 2005 could be summed up as follows:
1. Assets
Most of the recorded increase on the asset side during 2005 resulted from
balances held with banks, which increased by QR 200.7 million, or 257.3%, reaching
QR 278.7 million end-2005, comprising 43.5% of total assets, vis-à-vis 15.4% end-2004.
This reflects the high level of liquidity which these companies have had in 2005.
Financial investments recorded a noticeable decrease by QR 74.1 million, or
22.8%, reaching QR 250.4 million at the end of 2005, versus an increase by QR 111.5
million, or 52.3%, during 2004. The largest portion of the decrease in financial
investments during 2005 stemmed from selling part of the owned local securities on the
secondary market and realizing a noticeable capital gain. This caused the income
generated by financial investments, in the profit and loss statements, to rise considerably
by 148.0% in 2005.
Liabilities
The shareholders' equity is still the principal source of funds in financing exchange
companies activities. This item represented 74.9% of total liabilities or QR 479.8 million
end-2005, vis-à-vis 79.9% or QR 404.2 million end-2004; recording an increase by QR
75.6 million, or 18.7%, the rising shareholders' equity came as a result of the following
interactions:
• The companies augmenting their capital by QR 14.7 million, or 21.5%,
• Increasing retained profits by QR 47.9 million, or 158.6%, most of which was due
to income generated from selling financial securities, and
• Decreasing re-evaluation reserves by QR 49.9 million, or 25.6%, that was mainly
caused by selling part of their financial securities on the secondary market. Table
No (2-28) presents the major components of the shareholders' equity during the
last two years.

Qatar Central Bank82
Table No (2-28)
Shareholders' Equity of Exchange Companies
Capital
Legal Reserves
Revaluation Reserves (Fair Value)
Other Reserves
Retained Profits
Others
Total Shareholders' Equity
2004 2005ItemsChange 2005-04
68.3
81.7
194.9
6.3
30.2
22.8
404.2
83.0
91.5
145.0
6.9
78.1
75.3
479.8
14.7
9.8
-49.9
0.6
47.9
52.5
75.8
21.5
12.0
-25.6
9.5
158.6
230.3
18.8
Million QR
Value %
Finance Companies
The Finance Company expanded its activities in 2005. The Company's balance sheet
reached QR 768.3 million in total assets at the end of 2005, vis-à-vis QR 538.5 million at
the end of 2004. That is an increase of QR 229.8 million, or 42.7%, versus a decrease of
QR 25.4 million, or 4.5%, in 2004.
The most important developments in the Finance Company's Balance Sheet could be
briefly described as follows:
1. Assets
• The company's basic Islamic financing activities increased by QR 229.0 million, or
54.1%, reaching QR 652 million at the end of 2005, versus a decrease of QR 70.5
Table No (2-29)
The Balance Sheet of the Finance Company
Assets:
Cash and Balances with Banks
Debtors
Financial Investments
Other Assets
Total Assets = Total Liabilities
Liabilities:
Shareholders' Equity
Borrowing from Financial Institutions
Other Liabilities
2004 2005ItemsChange 2005-04
83.7
423
0.8
31
538.5
174
291.9
72.6
37.9
652
13.6
64.8
768.3
214.7
471.6
82
- 45.8
229.0
12.8
33.8
229.8
40.7
179.7
9.4
-54.7
54.1
1600.0
109.0
42.7
23.4
61.6
12.9
Million QR
Value %2003
24.6
493.5
5.5
40.3
563.9
141.2
369.2
53.5
2002
33.9
451
0
14.9
499.8
111.4
276.4
112
2001
12.1
193.2
15.3
14.4
235
101.2
115
18.8

Twenty Ninth Annual Report 83
million, or 14.3%, in 2004. These activities represented 84.9% of the company's
total assets at the end of 2005, versus 74.5% at the end of 2004.
• Cash and balances held with banks decreased by QR 45.8 million, or 54.7%,
reaching QR 37.9 million at the end of 2005 and comprising 4.9% of total assets.
• Financial investments recorded a remarkable increase from QR 0.8 million
end-2004 to QR 13.6 million end-2005.
2. Liabilities
The Finance Company generally relies on two principal sources of funds in
financing its activities:
• Borrowing from financial institutions, which comprised 61.4% of its total
liabilities, increased by QR 179.7 million, or 61.6%, by the end of 2005.
• Shareholders' equity is the second source of funds. The Company augmented this
item by an amount of QR 40.7 million, or 23.4%, reaching QR 214.7 million by
the end of 2005. However, the ratio of shareholders' equity to total liabilities
decreased from 32.3 % end-2004 to 27.9% end-2005.
Investment Companies
The aggregated balance sheet of Investment Companies increased markedly during
2005 by QR 251.9 million, or 276.5%, reaching QR 343.0 million at the end of 2005.
The most important developments in the Investment Companies' aggregated balance
sheet are as follows:
Table No (2-30)
The Balance Sheet of the Investment Companies
Cash and Balances with Banks
Debtors
Financial Investments
Other Assets
Total Assets = Total Liabilities
Shareholders' Equity
Short-Term Borrowing
Other Liabilities
2004 2005ItemsChange 2005-04
32.9
3.4
49.8
5
91.1
88.3
0.4
2.4
117.5
6.2
193.5
25.8
343
336.9
2.7
3.4
84.6
2.8
143.7
20.8
251.9
248.6
2.3
1.0
257.1
82.4
288.6
416.0
276.5
281.5
575.0
41.7
Million QR
Value %2003
33.8
1.5
31.6
12.8
79.7
77.4
0.5
1.8
2002
43.8
5.6
11.6
10.5
71.5
65
3.8
2.7
2001
30.3
3.9
16.8
18.1
69.1
61.8
1.2
6.1

Qatar Central Bank84
1. Assets
• On the asset side, cash-in-vault and balances due from banks increased during
2005 by QR 84.6 million, or 257.1%, reaching QR 117.5 million at the end of
2005, constituting a ratio of 34.3% to total assets. This ratio reflected the high
level of liquidity available to these Investment Companies.
• The Investment Companies expanded their activities in the area of financial
investments during 2005 by QR 143.7 million, or 288.6%. The increase accounted
for 57.0% of total increase on the asset side. Financial investment items totaled
QR 193.5 million, representing about 56.4% of total assets at the end of 2005.
2. Liabilities
Investment Companies rely on their shareholders' equity as their main source of
funds to finance their activities, and represents about 98.2% of total liabilities. These
companies gave support to this item by increasing it noticeably in 2005 by QR 248.6
million, or 281.5%, reaching QR 336.9 million at the end of 2005.
Insurance Companies
The insurance sector is comprised of ten companies currently operating in the State
of Qatar, (five of which are nationally-owned companies and the remaining five are
branches of foreign companies). They all engage in providing all types of insurance
services to individuals and businesses, namely:
• Fire insurance,
• Freight Insurance (land, air and by sea),
• Automobile insurance,
• Insurance against various types of risk.
Nationally owned insurance companies' activity grew fast during the last few years,
influenced by the economic boom in Qatar and the increasing number of population and
their increasing needs for insurance services, whether life insurance, or property
insurance of all types. This reflected positively on the aggregatted balance sheet of these
companies which grew by QR 3,286.2 million, or 84.5% in 2005, reaching a total of QR
7,176.3 million by the end of 2005.
In the following paragraphs, the most important developments on the assets as well
as the liabilities side are explored, as indicated by Table No. (2-31).

Twenty Ninth Annual Report 85
1. Assets
Total assets of the five nationally-owned insurance companies reached QR 7,176.3
million end-2005, vis-à-vis QR 3,890.1 million end-2004, marking a noticeable increase
of QR 3,286.2 million or 84.5%. The developments in the assets side could be summed
up as follows:
• Cash assets, represented by cash and balances held with banks, recorded an
increase by QR 415.6 million, or 84.9 %, reaching QR 905.2 million at the end of
2005. As a result, the ratio of cash assets to total assets reached 12.6% end-2005.
• Insurance companies expanded their financial investments' activities in 2005,
recording an increase of QR 2,450.8 million, or 100.9%. However, most of this
percentage increase (66.5%) resulted from revaluating the portfolio of financial
investments at their "fair value". The revaluation added value amounted to QR
1,630.3 million at the end of 2005.
• The insurance companies expanded their insurance activities during 2005, for
instance, re-insurance contracts increased by QR 206.6 million, or 50.1%, and
other insurance activities rose by QR 73.4 million, or 29.1%.
Table No (2-31)
Aggregated Balance Sheet of National Insurance Companies
Assets
Cash and Balances with Banks
Financial Investments
Reinsurance Contracts
Insurance and other Receivables
Real-Estate Investments
Other Assets
Total Assets = Total Liabilities
Liabilities
Borrowing from Banks
Insurance Contracts
Provisions, Insurance and Other Payables
Shareholders' Equity
Other Liabilities
ItemsChange 2005-04
415.6
2,450.8
206.6
73.4
91.5
48.3
3,286.2
-11.6
280.1
77.7
2,741.3
198.7
84.9
100.9
50.1
29.1
48.7
40.0
84.5
-31.4
41.9
23.9
98.9
224.8
Million QR
Value %2004
489.6
2,427.9
412
252.2
187.8
120.6
3,890.1
37
669.2
325.1
2,770.4
88.4
2005
905.2
4,878.7
618.6
325.6
279.3
168.9
7,176.3
25.4
949.3
402.8
5,511.7
287.1

Qatar Central Bank86
2. Liabilities
• Insurance companies rely on their shareholders' equity as the main source of funds
to finance their activities. Shareholders' equity increased by QR 2,741.3 million,
or 98.9% during 2005; reaching QR 5,511.7 million and comprising 76.8% of
total liabilities at the end of 2005.
• Insurance contracts and other insurance liabilities increased during 2005 by QR
357.8 million, or 38.0%, reaching QR 1,352.1 million and comprising about
18.8% of total liabilities at the end of 2005. Table No (2-32) presents the major
components of the shareholders' equity during the last two years.
Table No (2-32)
Shareholders' Equity of National Insurance Companies
Capital
Legal Reserves
Revaluation Reserves
Other Reserves
Retained Profits
Total Shareholders' Equity
ItemsChange 2005-04
167.5
610.4
0.0
1,630.3
333.2
2,741.4
39.1
436.0
0.0
110.7
80.2
98.9
Million QR
Value %2004
428.9
140.0
312.5
1,473.3
415.6
2,770.3
2005
596.4
750.4
312.5
3,103.6
748.8
5,511.7

Twenty Ninth Annual Report 87
Doha Securities Market (DSM)
The events of 2005 were exceptional for the Doha Securities Market (DSM). The
year witnessed the granting of share ownership and trading rights to foreigners. The
permission was subject to a 25% ceiling of the value of these shares traded in any one of
these companies. The year also witnessed the listing of two new companies, namely
Qatar Gas Transport Ltd.(Nakilat), with a capital of QR 2,800 million; and Dlala
Brokerage and Investment Holding Company, with a capital of QR 200 million. The
latter started in March 2005 weekly publishing market indicators, including PE and the
ROE ratios.
The most important development of the DSM in 2005 was a wave of rising stock
prices of all listed companies during the first quarter, which was a hedge move to capture
a considerable relative share of the market before the demand from foreign nationals
materializes on the 9th of April. This period was characterized by sharp increases hitting
the limit up allowed (which is 10% of the previous day closing price) every day. In an
attempt to contain the wide fluctuations in stock prices; the DSM Administration had to
reset the limits to 5%. However, the market index jumped by 71.5%, (reaching 11,138
points by the end of the first quarter) between the beginning of the year and the end of
March 2005.
After a period of declining prices (due to heavy selling to reap profits in April and
May); share prices started rising again in June, August and the first half of September.
This rise, however, did not cover all shares. The only shares that experienced continuous
rises (or jumps) were those companies announcing their seasonal profit results; or those
announcing raising their capital through selling shares to existing shareholders at
lower-than-market prices. Prices of other companies' shares have declined, either due to
seasonal announcements made of limited profitability or due to the fact that their PE
ratios have reached unjustifiable levels. As a result of the developments that took place
in the second and third quarters of 2005, the market index rose less sharply than the rise
witnessed in the first quarter, reaching its peak on the 22nd of September, when it hit the
12,753 points, that is an increase by 14.5% from the level reached at the end of March,
or 100% increase over the levels reached at the beginning of the year.
The fourth quarter witnessed both declining share prices and a declining market
index, which seemed as a necessary corrective move, just before the approaching season
Qatar Central Bank88
of profit distribution. But other additional factors started to pressure the prices in a
downward direction, starting with the huge subscription to the (September 20th) IPO of
the UAE Dana Gas, the subscription to capital increase of the Commercial Bank of
Qatar; the announcements about forthcoming IPO subscriptions of two large size banks
(one billion USD for the first and half a billion for the second); a third subscription was
offered by Barwa Real Estate with a QR 2.0 billion capital; the fourth and last capital
subscription was offered by the Gulf Cement Company (GCEM.AD, GCEM.KW) with a
capital of QR 800 million. Thus, it appears that this period experienced a net flow of
liquidity out of DSM into other fields of investment such as real-estate projects like the
Pearl-Qatar Real-Estate Project, the Lucille City, or for investment in the markets of the
neighboring countries, some of which have witnessed a strong wave of increase. At the
same time, Qatari Riyal short-term interest rates recorded a continuous increase passing
over the 4% level by the end of the year. As a result, the DSM market index fell during
the fourth quarter by 13.3%, reaching 11053 points, still higher than its level at the
beginning of the year by 70.21%.
The volume traded on the DSM increased by 345.3% in 2005, reaching QR 102.8
billion vis-à-vis QR 23.1 billion in 2004. Whereas the number of shares traded rose by
238.3%, reaching 1033.1 million shares, vis-à-vis 305.4 million shares in 2004. Services
sector ranked first in terms of the value of shares traded, occupying a relative share of
43.32% of the total value of traded shares; followed by the banking sector which
accounted for 27.66% ; then by the industrial sector by 26.57%, and finally by the
insurance sector by 2.45%.
Similarly, the service sector came first in terms of the number of shares traded on
the DSM, accounting for 67.41% of the total; followed by the industrial sector (22.29%);
the banking sector (9.17%); and the insurance sector (1.13%).
The market value of shares listed on the DSM increased by 115.5% end-2005,
reaching QR 317.2 billion vis-à-vis QR 147.2 billion end-2004. The market value
reached its peak in September 2005 when it slightly passed QR 370 billion. The rise in
the market value came as aresult of listing two new companies, namely Qatar Gas
Transport Company (Nakilat) and Dlala Brokerage, rising value of shares, and the
increases in the capital of sixteen listed companies during the year.

Twenty Ninth Annual Report 89
On the other hand, the aggregate value of profits earned by the companies listed in
2005 came approximately to QR 11.4 billion, increasing by 44.6% over the profit levels
realized in 2004 which amounted to QR 7.83 billion, with only one company realized a
loss in 2005, vis-à-vis three companies in 2004. The aggregate level of banking sector
profits came close to QR 4.2 billion, accounting for 36.7% of total corporate profits, of
which QR 1.5 billion were earned by QNB. The industrial sector came second (after the
banking sector) in terms of profits earned in 2005, earning about QR 3.7 billion, or
32.4% of the total, most of which (QR 3.2 billion) were made by one company (Qatar
Industrial Manufacturing); the service sector came in the third place in terms of profits,
earning about QR 2.9 billion, or 25.4% of the total, most important of which was QTEL,
which earned about QR 1.1 billion. Finally, insurance companies realized QR 635.4
million, or 5.5% of the total, most important among them was the profit earned by Qatar
Insurance, which amounted to QR 285 million in 2005.

Qatar Central Bank90
Table No (2-33)
Closing Prices of Shares of Listed Companies on DSM
SectorClosing Prices in QR
89.3
206.9
235.9
219.8
199.7
223.1
260
200
54.1
300
260
225
39.3
27.8
24.5
61.1
28.5
52
12.5
73
84.7
133
113.9
40
229.8
55.7
32.9
66.2
21
23.5
5
10
6,493.60
28.8
11.0
122.9
64.6
88.8
41.3
62.6
-4.2
21.4
3.8
-4.7
15.7
165.4
7.6
15.5
145.5
162.1
-39.2
542.4
-4.1
26.4
108.7
-6.0
215.5
4.4
39.0
93.9
-26.1
37.1
80.4
-
-
70.2
2004
RelativeChange
%Companies
Al-Ahli Bank of Qatar
Commercial Bank of Qatar
Qatar International Islamic Bank
Qatar Islamic Bank
Qatar National Bank
Doha Islamic Bank
Qatar Insurance
Al Khaleej Insurance
Doha Insurance
Qatar General Insurance & Reinsurance
Qatar Insurance
Qatar National Cement
Qatar Industrial Manufacturing
Qatar German Medical
Qatar Flour Mills
Qatar Industries
United Development
Al-Ahli Hospital
Salam International Investment
Qatar Cinema and Film Distribution
Qatar Real Estate Investment
Qatar National Navigation and Transport
Qatar Shipping
Qatar Fuel
Qatar Telecom
Qatar Electricity and Water
National Leasing
Qatar Technical Inspection
Qatar Meat and Livestock (Al-Mawashi)
Gulf Warehousing
Qatar Gas Transport Company (Nakilat)
Dlala Brokerage and Investment Holding Co.
General Market Index (1997=100)
115.0
229.70
525.80
361.90
377.10
315.20
422.70
191.50
65.70
311.50
247.80
260.30
104.30
29.90
28.30
150.00
74.70
31.30
80.30
70.00
107.10
277.60
107.10
126.20
239.90
77.40
63.80
48.90
28.80
42.40
48.70
121.10
11,053.06
2005
Banks
Insurance
Industry
Services

Twenty Ninth Annual Report 91
Table No (2-34)
Trading on the Doha Securities Market
Banking
Value Traded (QR million)
Volume Traded (Thousands of Shares)
Insurance
Value Traded (QR million)
Volume Traded (Thousands of Shares)
Services
Value Traded (QR million)
Volume Traded (Thousands of Shares)
Industrial
Value Traded (QR million)
Volume Traded (Thousands of Shares)
Total
Value Traded (QR million)
Volume Traded (Thousands of Shares)
Sectors
9,257.8
54,883.5
920.8
8,451.6
8,027.6
143,484.8
4,888.3
98,566.8
23,094.6
305,386.7
207.3
72.5
173.2
38.4
455.0
385.4
485.9
133.6
345.3
238.3
2004 Change %2005
28,541.3
94,686.9
2,516.0
11,695.2
44,552.2
696,435.5
27,323.1
230,263.5
102,842.7
1,033,081.1

Twenty Ninth Annual Report 93Twenty Ninth Annual Report 93
6ChapterSixForeign Trade and the Balance of Payments
Qatar's commodity foreign trade with the rest of the world revealed a considerable
growth in 2005 as it grew by QR 40.5 billion, or 45.1%, above the previous year level,
reaching QR 130.4 billion in 2005.
An attention drawing phenomenon is the vast acceleration in the rates of growth in
Qatar's foreign trade, which is considered as one of the fruits reaped by the wise policy
followed by the Government of Qatar, whether through encouraging the establishment of
mega projects which are capable of generating a huge export capacity, or especially
stimulating investments in the field of oil and gas, the fruits of which are beginning to
ripen.
Despite the relatively low growth rate in Qatar's foreign trade in 2002 (no more than
2.7%), it has accelerated strongly, reaching 21.6% in 2003, and 35.1% in 2004, and
45.1% in 2005.
These developments have reflected positively on the degree of openness of the State
of Qatar to the rest of the world, measured by the percentage of foreign trade to GDP,
which rose strongly in 2005 reaching 84.4% by year's end, vis-à-vis 77.8% in the
previous three years.
The following paragraphs provide a detailed discussion of the developments
witnessed by Qatar's imports of goods, the balance of payments, and the exchange rate of
the Qatari Riyal.
Classification of Imports (CIF) by Major Economic Groups
1. The Gulf Cooperation Council Countries (GCC):
Available data of Qatar's foreign trade reveals that 2005 witnessed an increase of
imports (CIF) from GCC-countries by QR 1,112 million, or 27.7%, from QR 4,013
million in 2004 to QR 5,125 million in 2005. Furthermore, the physical volume of these
imports (tonnage) also went up by 41.1% (up from 4.12 million tons in 2004 to 5.81
million tons in 2005).
However, the Trade Balance with GCC countries reflected a surplus of QR 941
million in 2005 after being in deficit of QR 38 million in 2004. However, in spite of the
increase in imports from GCC countries in 2005, their relative share (14% in 2005) still
came in third, after imports from the European Union countries and the Non-Arab Asian
countries. The decline in the relative share of imports from GCC countries is explicable
by the faster increases in the overall level of imports in general, and from these two

Qatar Central Bank94
groups of countries in particular, during the last few years of fast and accelerating
growth experienced by the economy of Qatar.
2. Other Arab Countries:
Imports from Non-Gulf Arab countries represented a relative share of 1.6% of total
imports in 2005. Imports (CIF) from this group of countries rose from QR 373 million in
2004 to QR 583 million in 2005. However, the "Trade Balance" reflected a surplus with
this group of countries, the Non-Gulf Arab Countries, equal to QR 213 million in 2005.
3. European Union Countries:
In terms of imports, the European Union (EU-countries) are easily considered the
major trading partner of the State of Qatar in 2005. The relative share of Qatar's imports
(CIF) from the EU-countries came first among all groups of countries. The value of
Qatar's imports from this group of countries in 2005 reached QR 12,294 million, up by
QR 2,268 million, or 22.6%, from the previous year's level of QR 10,026 million. On
one hand, most of the increase in the value of
Qatari imports from EU-countries in 2005 took
place due to the cross-currency appreciation of the
Euro currency (€) against the US dollar ($), hence
against the QR, by the cumulative sum of
month-to-month changes (shown in Table 2-35)
equal to -11.9% in 2005. On the other hand, the rise
in the volume (tonnage) of Qatar's imports from
this group of countries was 28.8%, vis-à-vis 22.6%
increase in value, indicating a lower cost per unit
(kilogram) of imports by 4.8% from last year's
level seems to confirm this conclusion.
Furthermore, the "Trade Balance" with the
EU-countries reflected a deficit of QR 9,118
million in 2005.
4. Other European Countries:
In terms of their relative share of total Qatar's imports in 2005, imports from Other
European countries which reached QR 665 million, ranked sixth, representing 2.0% of
total imports. The Trade Balance with "Other European countries" reflected a deficit of
QR 402 Million in 2005.
China 5.2%
South Korea 4.5%
Saudi Arabia 5.7%
UAE 6.4%
France 4.2%
Italy 6.5%
UK 5.7%
Germany 9.2%
Japan 11.6%
USA 11.6%
Others 29.4%
Figure No (2-9) :
Classification of Imports
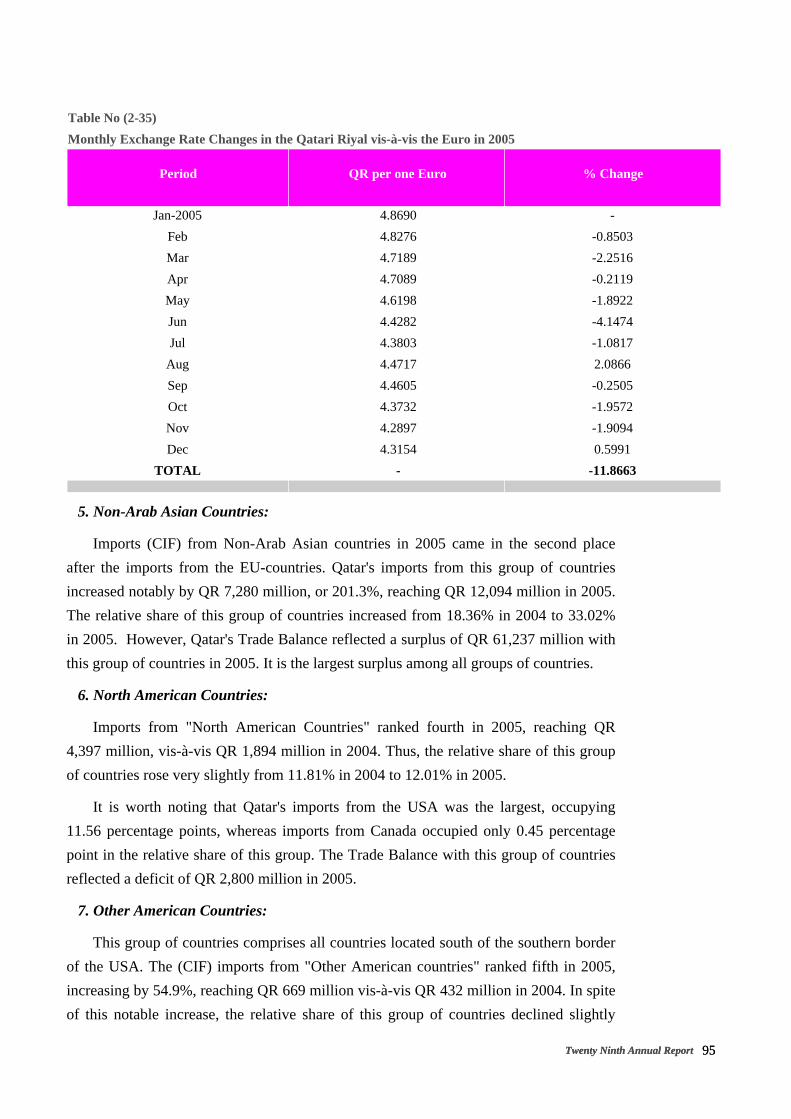
Twenty Ninth Annual Report 95Twenty Ninth Annual Report 95
5. Non-Arab Asian Countries:
Imports (CIF) from Non-Arab Asian countries in 2005 came in the second place
after the imports from the EU-countries. Qatar's imports from this group of countries
increased notably by QR 7,280 million, or 201.3%, reaching QR 12,094 million in 2005.
The relative share of this group of countries increased from 18.36% in 2004 to 33.02%
in 2005. However, Qatar's Trade Balance reflected a surplus of QR 61,237 million with
this group of countries in 2005. It is the largest surplus among all groups of countries.
6. North American Countries:
Imports from "North American Countries" ranked fourth in 2005, reaching QR
4,397 million, vis-à-vis QR 1,894 million in 2004. Thus, the relative share of this group
of countries rose very slightly from 11.81% in 2004 to 12.01% in 2005.
It is worth noting that Qatar's imports from the USA was the largest, occupying
11.56 percentage points, whereas imports from Canada occupied only 0.45 percentage
point in the relative share of this group. The Trade Balance with this group of countries
reflected a deficit of QR 2,800 million in 2005.
7. Other American Countries:
This group of countries comprises all countries located south of the southern border
of the USA. The (CIF) imports from "Other American countries" ranked fifth in 2005,
increasing by 54.9%, reaching QR 669 million vis-à-vis QR 432 million in 2004. In spite
of this notable increase, the relative share of this group of countries declined slightly
Table No (2-35)
Monthly Exchange Rate Changes in the Qatari Riyal vis-à-vis the Euro in 2005
Period
4.8690
4.8276
4.7189
4.7089
4.6198
4.4282
4.3803
4.4717
4.4605
4.3732
4.2897
4.3154
-
QR per one Euro % Change
-
-0.8503
-2.2516
-0.2119
-1.8922
-4.1474
-1.0817
2.0866
-0.2505
-1.9572
-1.9094
0.5991
-11.8663
Jan-2005
Feb
Mar
Apr
May
Jun
Jul
Aug
Sep
Oct
Nov
Dec
TOTAL

Qatar Central Bank96
reaching 2.03% in 2005 vis-à-vis 2.19% in 2004. The Trade Balance with this group of
countries reflected a deficit of QR 569 million in 2005.
8. Pacific Ocean Countries:
Imports (CIF) from this group of countries, which includes Australia and New
Zealand, came in the eighth place. The value of these imports amounted to QR 494
million in 2005, vis-à-vis QR 266 million in 2004; i.e. an increase of QR 228 million, or
85.7%, in 2005. Thus, this increase led to a slight incline in the relative share of this
group of countries from 1.22% to 1.35%, but did not change the rank of the group.
Qatar's Trade Balance with this group of countries reflected a surplus of QR 484 million
in 2005.
9. African (Non-Arab) Countries:
Qatar's imports from the African (Non-Arab) countries in 2005 ranked ninth. The
value of (CIF) imports from this group of countries reached QR 130 million in 2005,
vis-à-vis QR 58 million in 2004; i.e. increasing by 124.1%. However, in spite of this
notable proportional increase in imports, the Trade Balance with this group of countries
reflected a surplus of QR 803 million in 2005.
10. Unclassified Countries:
Qatar's imports (CIF) from the group of the "Unclassified countries" ranked tenth
and last, reaching QR 10 million in 2005. However, the Trade Balance with this group of
countries reflected a surplus of QR 9,992 million in 2005.

Twenty Ninth Annual Report 97Twenty Ninth Annual Report 97
Table No (2-36)
Geographical Distribution of Imports
Arab CountriesU. A. E.Saudi ArabiaBahrainJordanLebanonKuwaitSyriaEgyptOmanOthers
Asian CountriesJapanIndiaSouth KoreaChinaHong KongTaiwanMalaysiaIranIndonesiaPakistanThailandSingaporeTurkeyPhilippinesOthers
European CountriesU. K.GermanyItalyFranceHollandSwitzerlandBelgiumSwedenSpainDenmarkAustriaIrelandGreeceNorwayRomaniaOthers
American CountriesU. S. A.BrazilCanadaArgentinaMexicoOthers
Pacific Oceanic CountriesAustraliaNew Zealand
African CountriesNot SpecifiedTotal
Country 2002
2,590.11,039.4917.6122.572.236.2105.1120.356.991.928.0
4,173.01,552.6440.3528.2467.3133.7113.4215.268.5156.3104.5127.0122.290.727.625.5
5,422.21,123.71,032.31,333.0614.2338.2189.2170.784.0184.565.758.060.320.920.213.0114.3
2,281.11,922.9144.6115.735.543.718.7234.0216.417.648.30.7
14,749.4
2003
2,983.71,187.51,060.0235.054.448.874.892.8105.6103.621.2
5,120.91,866.4560.9883.1604.954.5108.8215.365.6160.1116.4151.7155.2106.628.942.5
6,681.71,430.41,719.71,326.4592.1339.4225.0192.9127.8220.472.475.374.315.031.327.2212.1
2,655.52,170.9164.8119.647.748.5104.0317.1293.923.267.30.1
17,826.3
2004
4,386.91,381.32,079.0289.253.685.7103.0122.073.2161.238.7
4,012.81,141.4513.7408.9668.339.387.2142.549.8157.995.2136.5403.4117.021.130.6
10,545.71,119.31,148.9740.3
5,846.1275.6391.3216.8105.0180.847.585.475.29.6
31.618.0254.3
2,580.62,102.0208.748.935.620.4165.0265.8250.315.564.40.0
21,856.2
2005
5,708.42,355.92,093.1224.086.5151.0171.1144.1171.8281.229.7
12,093.74,263.01,411.71,657.81,892.3
50.1208.2434.9189.9381.6162.8522.6410.1253.9114.9139.9
13,032.12,096.33,361.92,364.71,547.3671.4510.0437.1173.7417.3221.5217.2146.639.638.651.3737.6
5,139.64,232.4431.9164.2100.3102.3108.5493.5450.942.6143.99.8
36,621.0
2001
1,868.0711.0727.280.155.334.256.279.030.870.923.3
3,663.01,298.0316.6598.7389.465.6113.4183.989.8132.7116.3118.196.868.239.336.2
5,478.81,094.61,248.71,333.8606.3315.8200.3133.980.0146.962.251.262.127.118.36.2
91.42,216.01,876.7128.483.637.364.425.6284.6266.618.046.1121.8
13,678.3
Million QR

Qatar Central Bank98
Table No (2-37)
Geographical Distribution of Exports
Arab CountriesU. A. E.Saudi ArabiaBahrainJordanLebanonKuwaitSyriaEgyptOmanYemenOthers
Asian CountriesJapanIndiaSouth KoreaChinaTaiwanMalaysiaIranIndonesiaPakistanThailandSingaporeTurkeyPhilippinesOthers
European CountriesU. K.GermanyItalyFranceHollandBelgiumSpainGreeceOthers
American CountriesU. S. A.CanadaChilePeruOthers
Pacific Oceanic CountriesAustraliaNew Zealand
African CountriesNot SpecifiedTotal
Country 2002
3,200.11,353.9575.969.439.036.266.313.2953.026.727.441.8
31,847.418,628.1
364.86,320.6421.499.415.586.842.554.5
1,365.83,696.7
20.1461.5269.7660.53.00.9
373.50.0
186.19.4
80.45.12.1
1,014.61,009.6
1.12.01.30.6
363.4198.2165.2232.4
1,888.539,206.9
2003
2,162.71,124.6599.896.618.610.759.497.484.526.17.3
21.740,250.622,412.5
535.59,018.5937.9316.716.528.510.757.1
1,451.84,628.2
19.4577.1240.2940.4101.21.7
34.725.6160.216.8546.712.740.8787.9764.71.52.32.1
17.3383.5143.2240.3312.1
3,184.148,021.3
2004
3,611.11,974.0706.2110.582.752.7183.163.162.228.642.857.2
54,171.128,312.83,655.010,676.8
751.3921.852.0217.586.7422.8
1,153.36,167.1
19.7782.5951.8
1,878.6199.40.3
73.719.033.97.5
1,257.866.5220.5986.5854.6124.40.86.10.6
828.7579.1249.6
5,686.30.0
67,162.3
2005
5,250.23,822.4631.3166.1113.211.160.976.4139.242.416.4170.8
71,965.637,502.33,203.414,770.91,369.12,381.6
98.8142.116.0752.9
1,893.87,657.9
96.51,092.2988.1
1,942.43.7
15.055.7165.3566.456.5892.216.5171.1
1,230.51,133.4
0.36.8
13.876.2922.2482.6439.6922.6
10,000.192,233.6
2001
1,391.0702.5416.536.843.919.945.927.438.817.727.241.6
34,655.320,174.8
559.77,803.51,190.4
84.3149.414.471.543.4936.0
2,677.917.5698.4234.1300.817.70.60.0
29.639.59.4
203.90.00.1
1,437.91,378.9
25.57.53.1
22.9787.7623.1164.6364.931.0
38,968.6
Million QR

Twenty Ninth Annual Report 99Twenty Ninth Annual Report 99
The QR Exchange Rate
Since 1975, the Qatari Riyal (QR) had been officially pegged against the unit of
SDRs, allowing the QR exchange rate to fluctuate within 7.25% on both sides. But since
1980, and despite the official peg that prevailed at the time, the QR exchange rate was
pegged "de facto" against the US dollar, at QR 3.64 per one US dollar. This "de facto"
peg continued to prevail until the middle of 2001, when the Amiri Decree issued into
Law adopted the "de facto" market exchange rate as the official exchange rate (i.e. 3.64
Riyals per each US Dollar). Since then, the QR peg against the US dollar has been
officially established.
In 2005, dealings in foreign exchange against the QR have shown different picture
from the one that had been prevailing for the preceding three years, except for the US
dollar. Available data presented by Tables (2-38) and (2-39) indicate obvious
improvements in the QR exchange rates against the major foreign currencies (other than
the US dollar) whether taken as end-of-period or as period averages (except for the Euro
period average), contradicting the depreciation trend recorded for the past three years
prior to 2005.
By focusing on the end-of-period exchange rate movements, it could be observed
from Table No (2-38) that the QR has made an estimated 15.5% progress against the
Euro by the end of 2005; in contrast with continuous depreciation in the three years prior
to 2005: 7.3% in 2004, 16.9% in 2003, and 16.0% in 2002. Similarly, the QR exchange
rate against the Japanese Yen (100) showed an improvement by 13.3% compared with
three years of consecutive depreciation: 2.8% in 2004, 10.7% in 2003, and 9.0% in 2002.
The same pattern prevailed against the Sterling Pound, where the improvement in the
QR exchange rate was 12.2% in 2005, after three years of continuous depreciation: 7.6%
in 2004, 9.7% in 2003, and 10.0% in 2002. The situation was not different for the QR
Table No (2-38)
The Exchange Rate of the QR Against Major Foreign Currencies
Euro
Sterling
Yen(100)
Swiss Franc
SDR
Currencies 2002
3.4265
3.8171
5.4647
5.8670
2.9029
3.0359
2.3354
2.6247
4.9490
2003
4.1084
4.5960
5.9478
6.4974
3.1397
3.3987
2.7023
2.9426
5.4090
2004
4.5197
4.9580
6.6678
7.0303
3.3644
3.4960
2.9272
3.2167
5.6530
2005
4.5267
4.2941
6.6263
6.2677
3.3025
3.0855
2.9233
2.7695
5.2030
Average
End-of-Period
Average
End-of-Period
Average
End-of-Period
Average
End-of-Period
Year-end
(QR)
Period
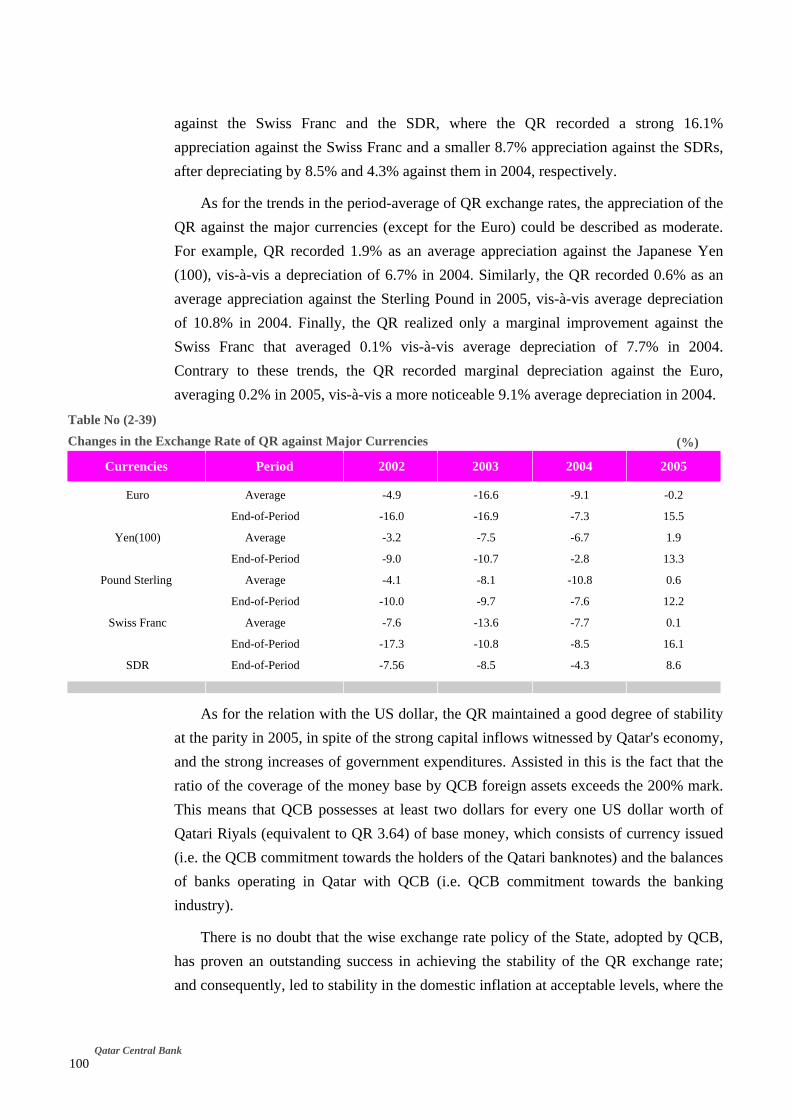
Qatar Central Bank100
against the Swiss Franc and the SDR, where the QR recorded a strong 16.1%
appreciation against the Swiss Franc and a smaller 8.7% appreciation against the SDRs,
after depreciating by 8.5% and 4.3% against them in 2004, respectively.
As for the trends in the period-average of QR exchange rates, the appreciation of the
QR against the major currencies (except for the Euro) could be described as moderate.
For example, QR recorded 1.9% as an average appreciation against the Japanese Yen
(100), vis-à-vis a depreciation of 6.7% in 2004. Similarly, the QR recorded 0.6% as an
average appreciation against the Sterling Pound in 2005, vis-à-vis average depreciation
of 10.8% in 2004. Finally, the QR realized only a marginal improvement against the
Swiss Franc that averaged 0.1% vis-à-vis average depreciation of 7.7% in 2004.
Contrary to these trends, the QR recorded marginal depreciation against the Euro,
averaging 0.2% in 2005, vis-à-vis a more noticeable 9.1% average depreciation in 2004.
As for the relation with the US dollar, the QR maintained a good degree of stability
at the parity in 2005, in spite of the strong capital inflows witnessed by Qatar's economy,
and the strong increases of government expenditures. Assisted in this is the fact that the
ratio of the coverage of the money base by QCB foreign assets exceeds the 200% mark.
This means that QCB possesses at least two dollars for every one US dollar worth of
Qatari Riyals (equivalent to QR 3.64) of base money, which consists of currency issued
(i.e. the QCB commitment towards the holders of the Qatari banknotes) and the balances
of banks operating in Qatar with QCB (i.e. QCB commitment towards the banking
industry).
There is no doubt that the wise exchange rate policy of the State, adopted by QCB,
has proven an outstanding success in achieving the stability of the QR exchange rate;
and consequently, led to stability in the domestic inflation at acceptable levels, where the
Table No (2-39)
Changes in the Exchange Rate of QR against Major Currencies
Euro
Yen(100)
Pound Sterling
Swiss Franc
SDR
Currencies 2002
-4.9
-16.0
-3.2
-9.0
-4.1
-10.0
-7.6
-17.3
-7.56
2003
-16.6
-16.9
-7.5
-10.7
-8.1
-9.7
-13.6
-10.8
-8.5
2004
-9.1
-7.3
-6.7
-2.8
-10.8
-7.6
-7.7
-8.5
-4.3
2005
-0.2
15.5
1.9
13.3
0.6
12.2
0.1
16.1
8.6
Average
End-of-Period
Average
End-of-Period
Average
End-of-Period
Average
End-of-Period
End-of-Period
(%)
Period

Twenty Ninth Annual Report101
Twenty Ninth Annual Report101
rate of inflation of tradable goods (viewed as an indicator of imported inflation) reached
0.8% in 2002, 0.7% in 2003, and 5.1% in 2004 despite the rise of oil prices witnessed by
the international oil markets during these years. That is, imported inflation in Qatar
during the period of depreciating QR exchange rate against major currencies was very
low, started to rise only during 2004, whence it recorded a lower rate (5.1%) than the
rate recorded in 2005 (5.8%). This indicates a higher likelihood that the imported
inflation that prevailed in this period (2002-2005) was attributable to the rising costs of
production in the countries where Qatar's imports originate and the rising costs of
shipping and transport (as a direct result of rising fuel prices) more than being
attributable to the depreciation of the QR exchange rate.
The Balance of Payments
The "Overall Balance" of Payments for the State of Qatar realized a surplus of QR
16,122 million in 2005, vis-à-vis QR 14,294 million in 2004; that is a growth of 12.8%.
The similar increase realized in the Current Account (CA), which amounted to QR
11,506 million in 2005, was the outcome of the Trade Balance rise by QR 12,460
million, from QR 48,321 million in 2004 to QR 60,781 million in 2005. The details of
the BOP accounts presented by Table No (2-40) reveal that the sizeable Current Account
(CA) surplus, valued at QR 38,994 million in 2005, was mainly responsible for having
this "overall balance surplus".
The following paragraphs elaborate in more detail on the developments of the
Balance of Payments major items in 2005.
Table No (2-40)
Balance of Payments for the State of Qatar (2001-2005)
Current Account
Trade Balance
Services
Income
Transfers
Capital & Financial Account
Capital Account
Financial Account
Overall Surplus or Deficit
2005Items
38,994
60,781
-3,362
-9,045
-9,380
-14,765
-2,742
-12,023
16,122
Million QR
2004
27,488
48,321
-4,468
-8,160
-8,205
-4,861
-2,004
-2,857
14,294
2003
20,943
32,846
-4,380
-1,516
-6,007
-2,754
-1,160
-1,594
15,399
2002
13,919
26,673
-3,966
-3,266
-5,522
-6,233
-1,357
-4,876
6,511
2001
15,133
27,247
-3,743
-2,562
-5,829
-3,839
0
-3,839
9,555

Qatar Central Bank102
1. Current Account (CA)
After a one-year pause in 2002, the march of the Current Account (CA) surplus
resumed its upward trend in 2003 and continued
throughout the last three years. The CA surplus
rose from QR 27,488 million in 2004 to QR
38,994 million in 2005, i.e. an increase by QR
11,506 million, or 41.9%. The details underlying
the changes occurring in 2005 are as follows:
A. Trade Balance (Goods Account):
The surplus of the Trade Balance reached
QR 60,781million in 2005, vis-à-vis QR 48,421
million in 2004. Thus, revealing a rise of QR
12,460 million, or 25.5% from its previous level.
The increase in the Trade Balance surplus was
the result of interactions between varying increases in exports and imports in 2005. On
the one hand, exports rose from QR 68,012 million in 2004 to reach QR 93,773 million
in 2005; increasing by QR 25,761 million, or 37.9%. On the other hand, imports rose
from QR 19,691 million in 2004 to reach QR 32,992 million in 2005; increasing by QR
13,301 million, or 67.5%. Table No (2-41) presents more details.
Exports (FOB)
Qatar's oil exports continued to occupy the first and most important place among the
components of total exports. The oil exports (FOB) amounted to QR 54,203 million in
value, and represented a relative share equal to 57.8% of total exports in 2005. The
increase in oil exports amounted to QR 23,157 million, or 74.6%, from their level
reached in 2004. Whereas, Qatar's exports of Natural Gas relative share stood at 29.4%
Table No (2-41)
Trade Balance (Goods Account)
Exports
Oil
Natural Gas
Others
Re-exports
Imports
Trade Balance
2005Items
93,773
54,203
27,535
10,495
1,540
-32,992
60,781
Million QR
2004
68,012
31,046
23,497
12,619
850
-19,691
48,321
2003
48,711
24,449
15,447
8,125
690
-15,865
32,846
2002
39,960
20,488
12,756
5,963
753
-13,287
26,673
2001
39,571
20,422
14,921
3,625
603
-12,324
27,247
0
20
40
60
80
100
2001 2002 2003 2004 2005
Billion QR
Exports
Imports
Surplus
Figure No (2-10) :
Qatar’s Trade Balace

Twenty Ninth Annual Report103
Twenty Ninth Annual Report103
of total exports in 2005, reaching QR 27,535 million, realizing an increase of QR 4,038
million, or 17.2% over its 2004 level. It is worth noting that Non-Oil exports ("Others"
in Table 2-41) experienced a slight decrease in 2005, which amounted to QR 2,124
million, or 16.8% vis-à-vis its 2004 level.
Imports (FOB)
Total imports (FOB) jumped from QR 19,691 million in 2004 to reach QR 32,992
million in 2005, that is an increase by QR 13,301 million, or 67.4%. This record level
and increase in imports came by because of the large investment undertakings in all
sectors of Qatar's economy in 2005. Hence, higher imports of all types of merchandise to
fulfill these projects.
B. The Services Account:
The size of the deficit in the Services Account came out smaller in 2005 than its size
in 2004. The deficit shrank to QR 3,362 million in 2005, vis-à-vis QR 4,468 million in
2004, i.e. a decrease by QR 1,106 million, or 24.8%. This decline was possible as the
increases in travel, transportation and other services items on the (credit) side rose faster
than the same items on the (debit) side in 2005.
C. The Income Account
The gap of the Income Account reflected a widening by QR 885 million in 2005 in
comparison with 2004. The deficit (gap) reached QR 9,045 million in 2005, vis-à-vis QR
8,160 million in 2004. This widening came by as a result of the interaction between the
increase in the (debit) income in 2005 by QR 1,391 million, or 10.9% from its level in
the pervious year; on the one hand, and the humble increase in the (credit) income by a
mere QR 0.506 million, or 10.9%, from its level reached in 2004, on the other band.
Table No (2-42)
The Services Account of Qatar's Balance of Payments
Services (Credit)
Travel
Transportation
Other Services
Services (Debit)
Travel
Transportation
Other Services
Services Account Balance
2005Items
11,723
2,768
6,271
2,684
-15,085
-6,403
-6,324
-2,358
-3,362
Million QR
2004
6,110
1,812
4,112
186
-10,578
-2,515
-1,969
-6,094
-4,468
2003
4,141
1,342
2,285
514
-8,521
-1,713
-1,606
-5,202
-4,380
2002
2,572
1,037
1,129
406
-6,538
-1,538
-1,329
-3,671
-3,966
2001
2,495
991
1,357
147
-6,238
-1,331
-1,231
-3,676
-3,743

Qatar Central Bank104
D. Current Transfers
The deficit in the Current Transfers Account increased in 2005, pushing the level of
the deficit up to reach QR 9,380 million. The increased deficit is attributed mainly to the
increase of foreign workers' remittances to their home countries by QR 3,025 million, or
38.2%, from the level reached in 2004.
2. The Capital and Financial Account:
The Capital and Financial Account reflected a deficit of QR 14,765 million in 2005,
vis-à-vis QR 4,861 million in 2004. The deficit is attributable mainly to banking system
increases of portfolio investments abroad by approximately QR 7,428 million during
2005, above the levels reached end-2004.
Table No (2-43)
The Income Account of Qatar's Balance of Payments 2001-2005
Income (Credit)
Income (Debit)
Income Account Balance
2005Items
5,139
-14,184
-9,045
Million QR
2004
4,633
-12,793
-8,160
2003
4,927
-6,443
-1,516
2002
2,582
-5,848
-3,266
2001
3,231
-5,793
-2,562
Table No (2-44)
Current Transfers Account of Qatar's Balance of Payments (2001-2005)
Workers Remittances
Other Transfers (net)
Current Transfers Balance
2005Items
-10,945
1,565
-9,380
Million QR
2004
-7,920
-285
-8,205
2003
-5,802
-205
-6,007
2002
-5,398
-124
-5,522
2001
-5,485
-344
-5,829
Table No (2-45)
Capital and Financial Account
Capital Account
Financial Account (Net)
Capital & Financial Account Balance
2005Items
-2,742
-12,023
-14,765
Million QR
2004
-2,004
-2,857
-4,861
2003
-1,160
-1,594
-2,754
2002
-1,357
-4,876
-6,233
2001
-
-3,839
-3,839
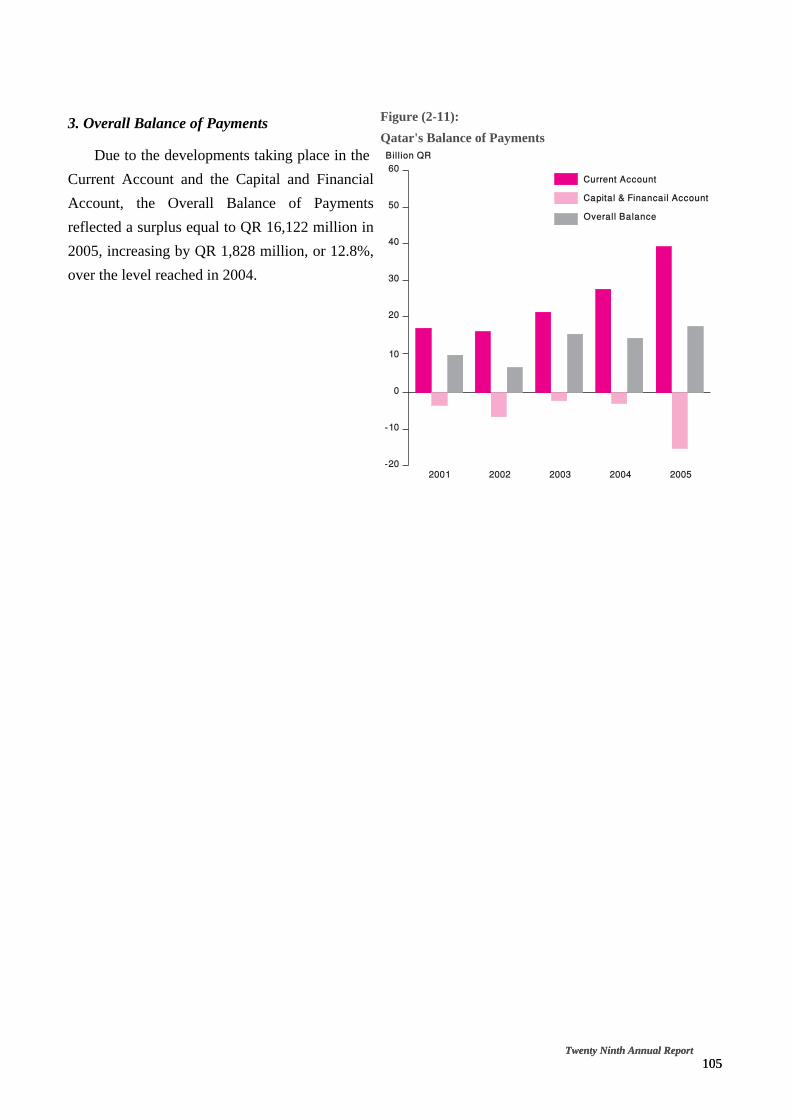
Twenty Ninth Annual Report105
Twenty Ninth Annual Report105
3. Overall Balance of Payments
Due to the developments taking place in the
Current Account and the Capital and Financial
Account, the Overall Balance of Payments
reflected a surplus equal to QR 16,122 million in
2005, increasing by QR 1,828 million, or 12.8%,
over the level reached in 2004.
-20
-10
0
10
20
30
40
50
60
2001 2002 2003 2004 2005
Billion QR
Current Account
Capital & Financail Account
Overall Balance
Figure (2-11):
Qatar's Balance of Payments

Qatar Central Bank106
Table No (2-46)
The Balance of Payments
Current Account
Goods
Exports (F.O.B.)
Crude Petroleum
Natural Gas
Others
Re-Export
Imports (F.O.B)
Services
Services (Credit)
Travel
Transportation
Others
Services (Debit)
Travel
Transportation
Others
Income
Income (Credit)
Income (Debit)
Transfers
Workers' Remittances
Others (Net)
Capital & Financial Account
Capital Account
Financial Account (Net)
Net Errors & Omissions
Overall Balance
Change in Reserves (Increase - )
2005Items
Million QR
2004
38,994.0
60,781.0
93,773.0
54,203.0
27,535.0
10,495.0
1,540.0
-32,992.0
-3,362.0
11,723.0
2,768.0
6,271.0
2,684.0
-15,085.0
-6,403.0
-6,324.0
-2,358.0
-9,045.0
5,139.0
-14,184.0
-9,380.0
-10,945.0
1,565.0
-14,765.0
-2,472.0
-12,023.0
-8,107.0
16,122.0
-16,122.0
2003
27,488.0
48,321.0
68,012.0
31,046.0
23,497.0
12,619.0
850.0
-19,691.0
-4,468.0
6,110.0
1,812.0
4,112.0
186.0
-10,578.0
-2,515.0
-1,969.0
-6,904.0
-8,160.0
4,633.0
-12,793.0
-8,205.0
-7,920.0
-285.0
-4,861.0
-2,004.0
-2,857.0
-8,333.0
14,294.0
-14,294.0
2002
20,943.0
32,846.0
48,711.0
24,449.0
15,447.0
8,125.0
690.0
-15,865.0
-4,380.0
4,141.0
1,342.0
2,285.0
514.0
-8,521.0
-1,713.0
-1,606.0
-5,202.0
-1,516.0
4,927.0
-6,443.0
-6,007.0
-5,802.0
-205.0
-2,754.0
-1,160.0
-1,954.0
-2,790.0
15,399.0
-15,399.0
13,919.0
26,673.0
39,960.0
20,488.0
12,756.0
5,963.0
753.0
-13,287.0
-3,966.0
2,572.0
1,037.0
1,129.0
406.0
-6,538.0
-1,538.0
-1,329.0
-3,671.0
-3,266.0
2,582.0
-5,848.0
-5,522.0
-5,398.0
-124.0
-6,233.0
-1,357.0
-4,876.0
-1,175.0
6,511.0
-6,511.0