Embed Size (px)
Citation preview
The “Truth” Behind the
Air Movers
Centrifugals Vs.
Axials
By: Chuck Dewald III Chuck Dewald Jr.
Jerry Blaylock
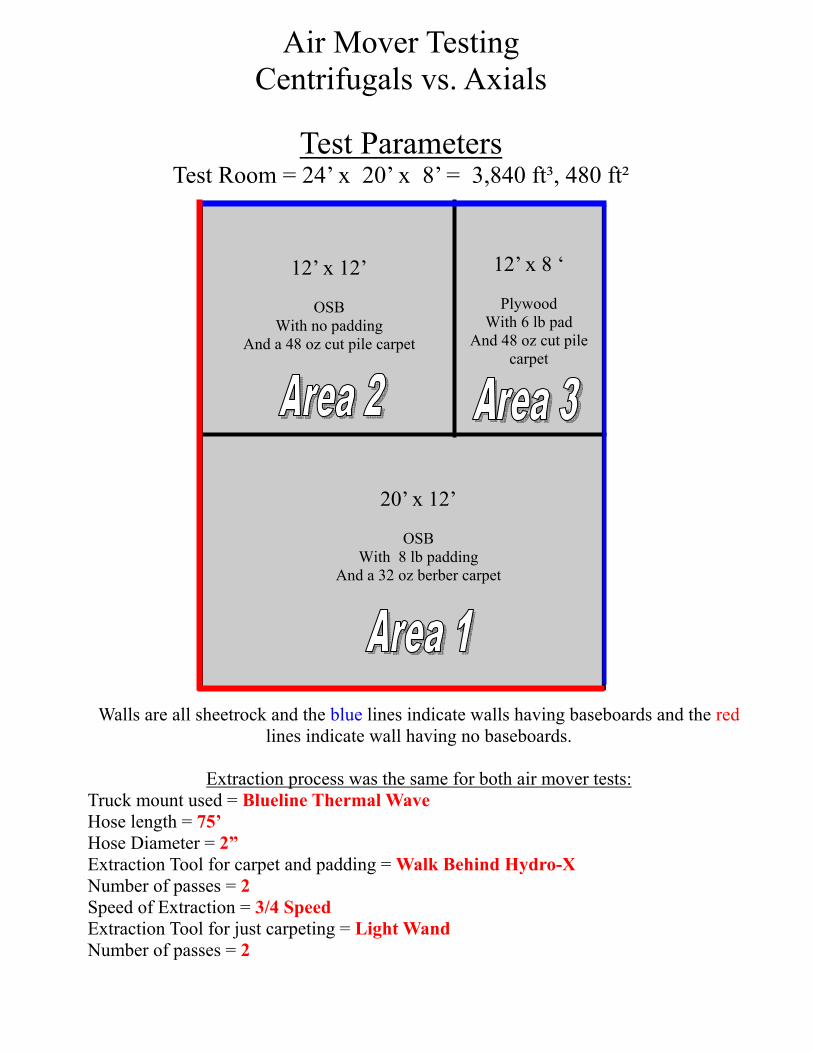
Air Mover Testing Centrifugals vs. Axials
Test Parameters
Test Room = 24’ x 20’ x 8’ = 3,840 ft³, 480 ft²
12’ x 8 ‘
Plywood With 6 lb pad
And 48 oz cut pile carpet
12’ x 12’
OSB With no padding
And a 48 oz cut pile carpet
20’ x 12’
OSB With 8 lb padding
And a 32 oz berber carpet
Walls are all sheetrock and the blue lines indicate walls having baseboards and the red lines indicate wall having no baseboards.
Extraction process was the same for both air mover tests:
Truck mount used = Blueline Thermal Wave Hose length = 75’ Hose Diameter = 2” Extraction Tool for carpet and padding = Walk Behind Hydro-X Number of passes = 2 Speed of Extraction = 3/4 Speed Extraction Tool for just carpeting = Light Wand Number of passes = 2
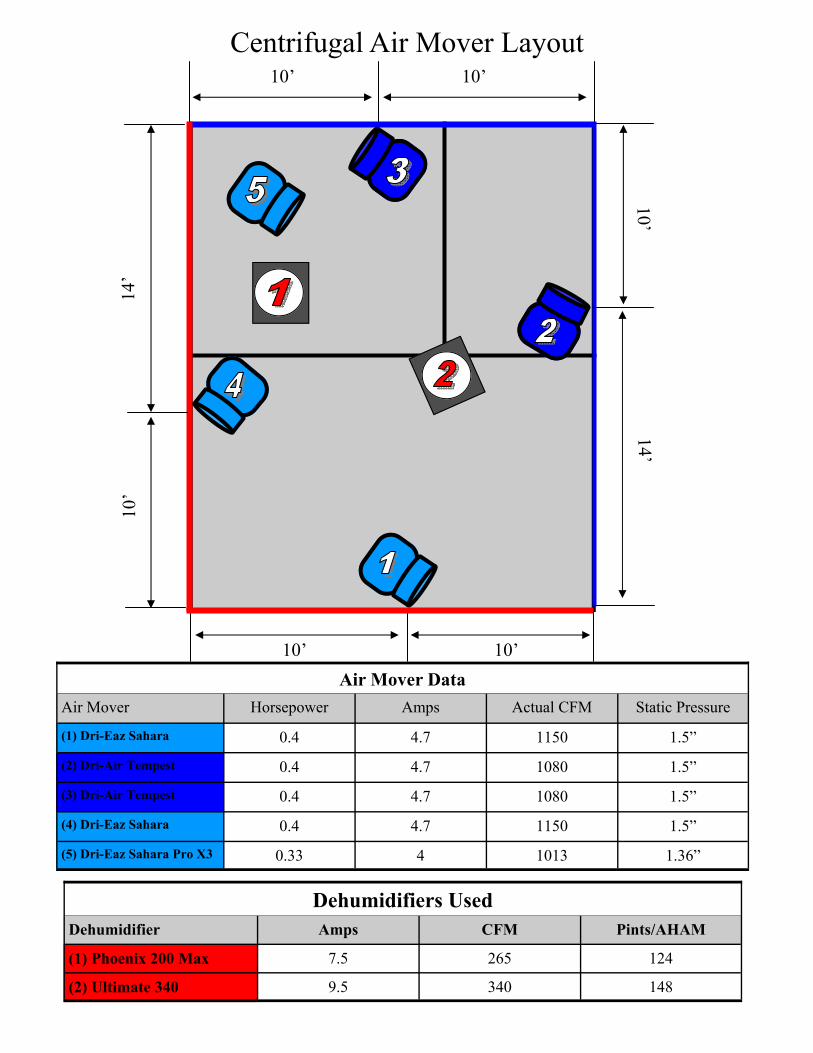
Centrifugal Air Mover Layout
10’ 10’
14’ 10’
10’
14’
10’ 10’
Air Mover Horsepower Amps Actual CFM Static Pressure
(1) Dri-Eaz Sahara 0.4 4.7 1150 1.5”
(2) Dri-Air Tempest 0.4 4.7 1080 1.5”
(3) Dri-Air Tempest 0.4 4.7 1080 1.5”
(4) Dri-Eaz Sahara 0.4 4.7 1150 1.5”
Air Mover Data
(5) Dri-Eaz Sahara Pro X3 0.33 4 1013 1.36”
Dehumidifiers Used Dehumidifier Amps CFM Pints/AHAM
(1) Phoenix 200 Max 7.5 265 124
(2) Ultimate 340 9.5 340 148
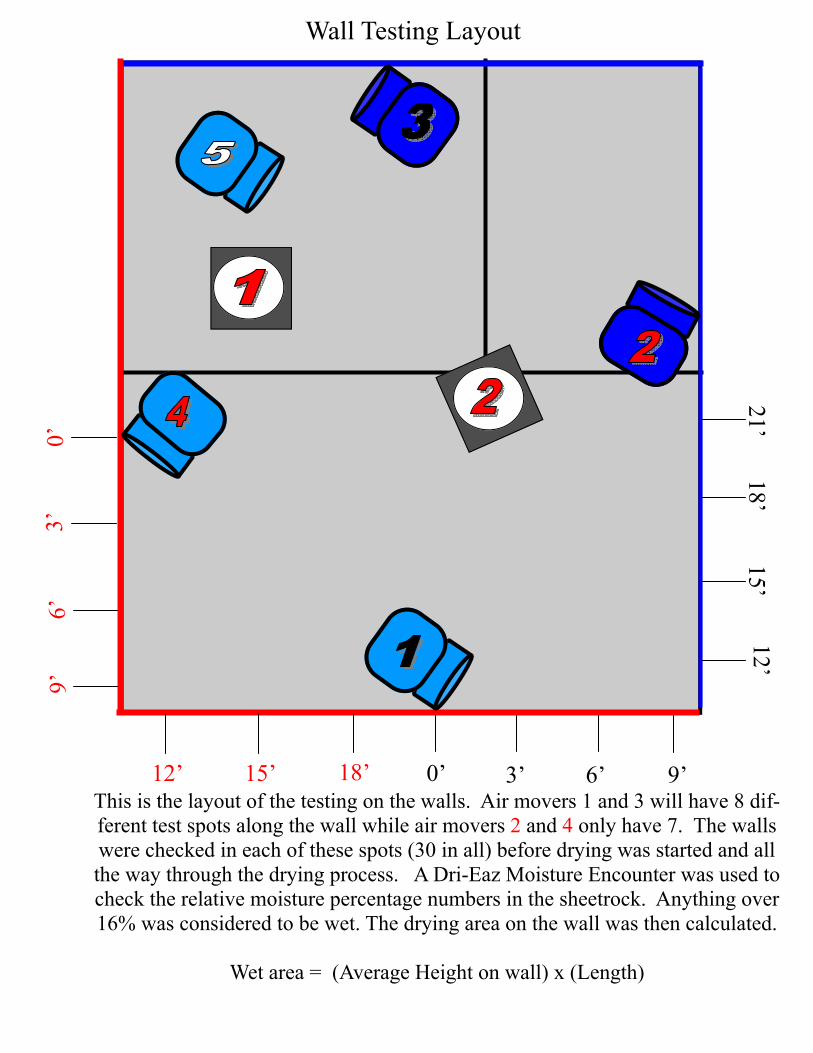
Wall Testing Layout
0’ 3’ 6’ 9’
12’ 15’
18’ 21’
18’ 15’ 12’
0’
3’
6’
9’
This is the layout of the testing on the walls. Air movers 1 and 3 will have 8 dif-ferent test spots along the wall while air movers 2 and 4 only have 7. The walls were checked in each of these spots (30 in all) before drying was started and all the way through the drying process. A Dri-Eaz Moisture Encounter was used to check the relative moisture percentage numbers in the sheetrock. Anything over 16% was considered to be wet. The drying area on the wall was then calculated.
Wet area = (Average Height on wall) x (Length)
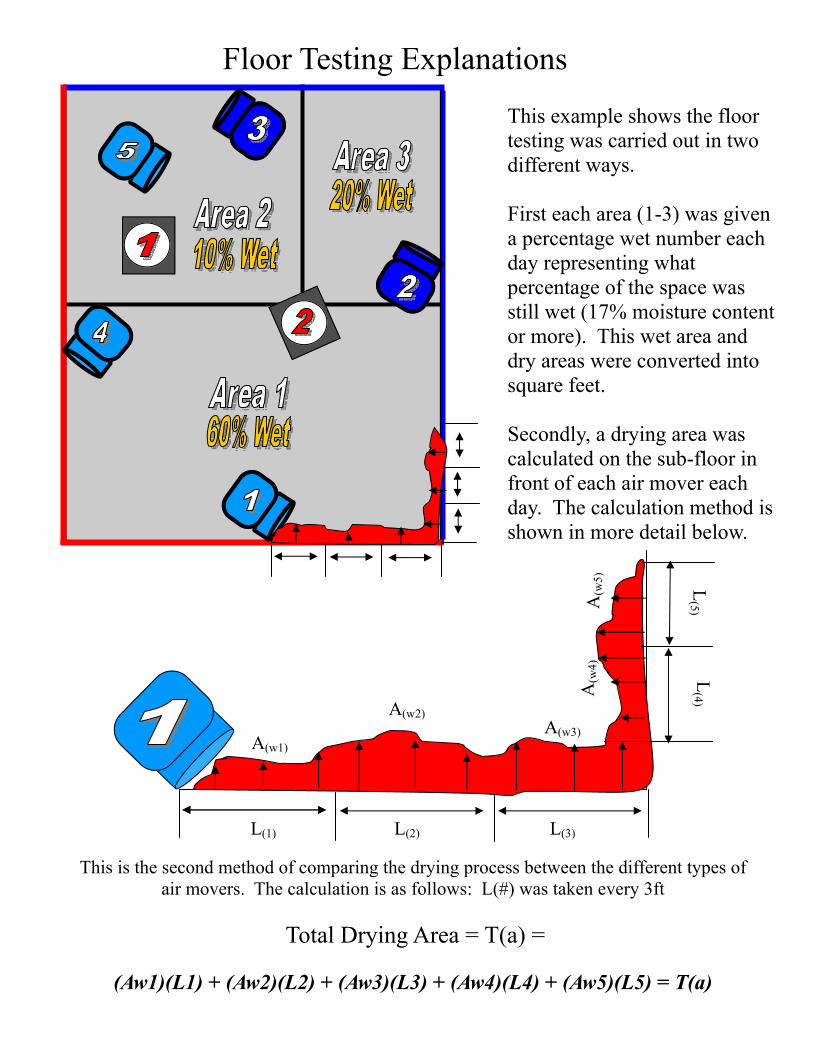
Floor Testing Explanations
This example shows the floor testing was carried out in two different ways. First each area (1-3) was given a percentage wet number each day representing what percentage of the space was still wet (17% moisture content or more). This wet area and dry areas were converted into square feet. Secondly, a drying area was calculated on the sub-floor in front of each air mover each day. The calculation method is shown in more detail below.
A(w1)
A(w2) A(w3)
A(w
4)
A(w
5)
L(1) L(2) L(3)
L(4)
L(5)
This is the second method of comparing the drying process between the different types of air movers. The calculation is as follows: L(#) was taken every 3ft
Total Drying Area = T(a) =
(Aw1)(L1) + (Aw2)(L2) + (Aw3)(L3) + (Aw4)(L4) + (Aw5)(L5) = T(a)
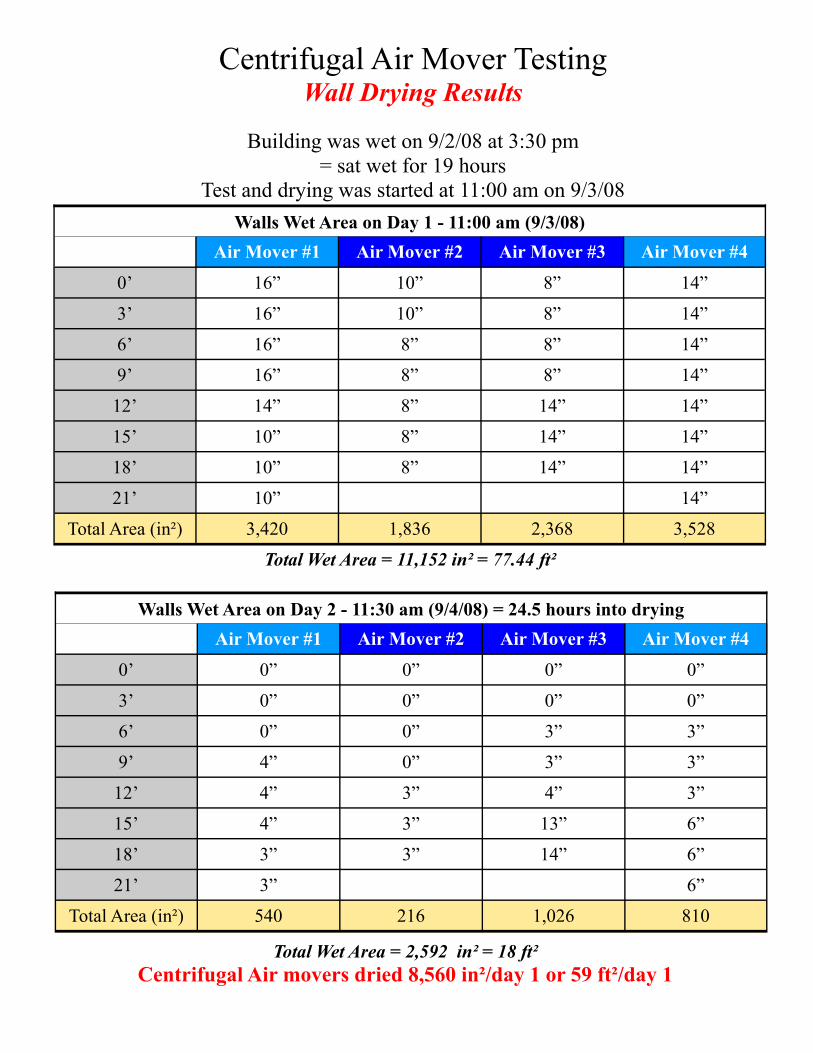
Centrifugal Air Mover Testing
Wall Drying Results
Building was wet on 9/2/08 at 3:30 pm = sat wet for 19 hours
Test and drying was started at 11:00 am on 9/3/08 Walls Wet Area on Day 1 - 11:00 am (9/3/08)
Air Mover #1 Air Mover #2 Air Mover #3 Air Mover #4
0’ 16” 10” 8” 14”
3’ 16” 10” 8” 14”
6’ 16” 8” 8” 14”
9’ 16” 8” 8” 14”
12’ 14” 8” 14” 14”
15’ 10” 8” 14” 14”
18’ 10” 8” 14” 14”
21’ 10” 14”
Total Area (in²) 3,420 1,836 2,368 3,528
Walls Wet Area on Day 2 - 11:30 am (9/4/08) = 24.5 hours into drying Air Mover #1 Air Mover #2 Air Mover #3 Air Mover #4
0’ 0” 0” 0” 0”
3’ 0” 0” 0” 0”
6’ 0” 0” 3” 3”
9’ 4” 0” 3” 3”
12’ 4” 3” 4” 3”
15’ 4” 3” 13” 6”
18’ 3” 3” 14” 6”
21’ 3” 6”
Total Area (in²) 540 216 1,026 810
Total Wet Area = 11,152 in² = 77.44 ft²
Total Wet Area = 2,592 in² = 18 ft² Centrifugal Air movers dried 8,560 in²/day 1 or 59 ft²/day 1
Centrifugal Air Mover Testing
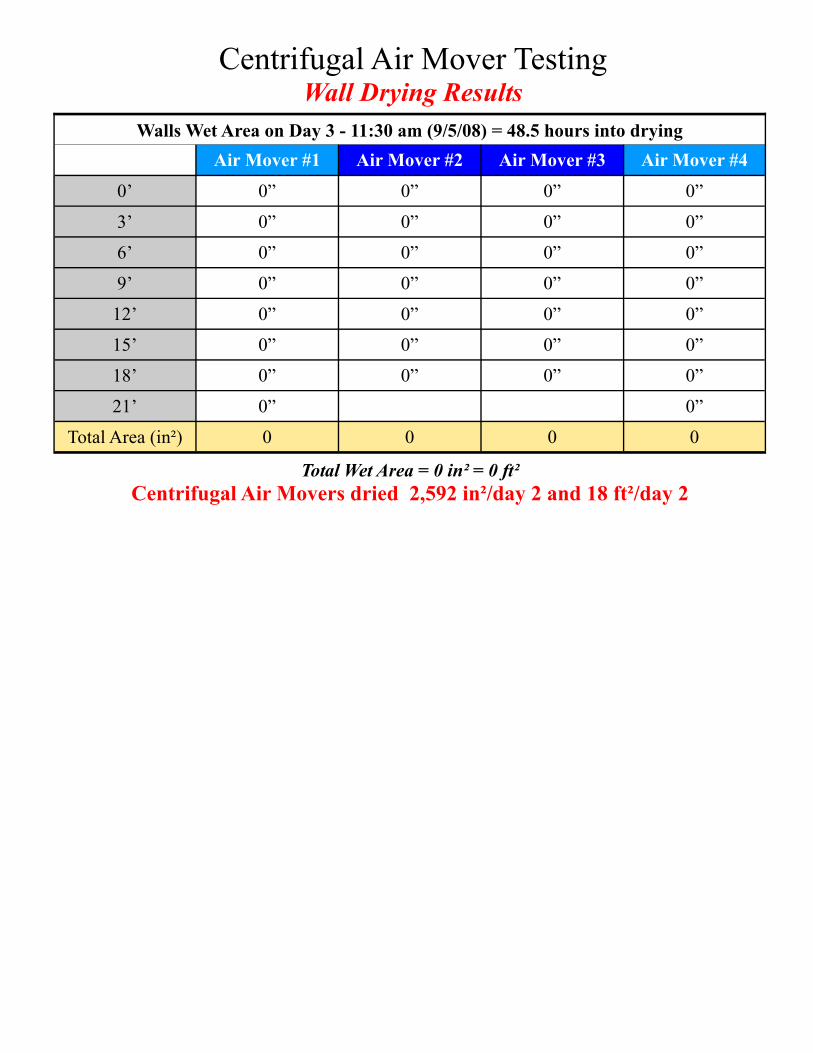
Wall Drying Results Walls Wet Area on Day 3 - 11:30 am (9/5/08) = 48.5 hours into drying
Air Mover #1 Air Mover #2 Air Mover #3 Air Mover #4
0’ 0” 0” 0” 0”
3’ 0” 0” 0” 0”
6’ 0” 0” 0” 0”
9’ 0” 0” 0” 0”
12’ 0” 0” 0” 0”
15’ 0” 0” 0” 0”
18’ 0” 0” 0” 0”
21’ 0” 0”
Total Area (in²) 0 0 0 0
Total Wet Area = 0 in² = 0 ft² Centrifugal Air Movers dried 2,592 in²/day 2 and 18 ft²/day 2
Centrifugal Air Mover Testing
Floor Drying Results = Method #1
9/3/08 - 11:00 am = Start
Wet = 100% Dry = 0% Wet = 480 ft² Dry = 0 ft²
9/4/08 - 11:30 am = 24.5 Hours
Wet = 61% Dry = 39% Wet = 293 ft² Dry = 187 ft²
9/5/08 - 11:30 am = 48.5 Hours
Wet = 50% Dry = 50% Wet = 242 ft² Dry = 238 ft²
9/6/08 - 11:00 am = 72 hours
Wet = 25% Dry = 75% Wet = 120 ft² Dry = 360 ft²
Centrifugal Air Mover Testing
Floor Drying Results = Method #1
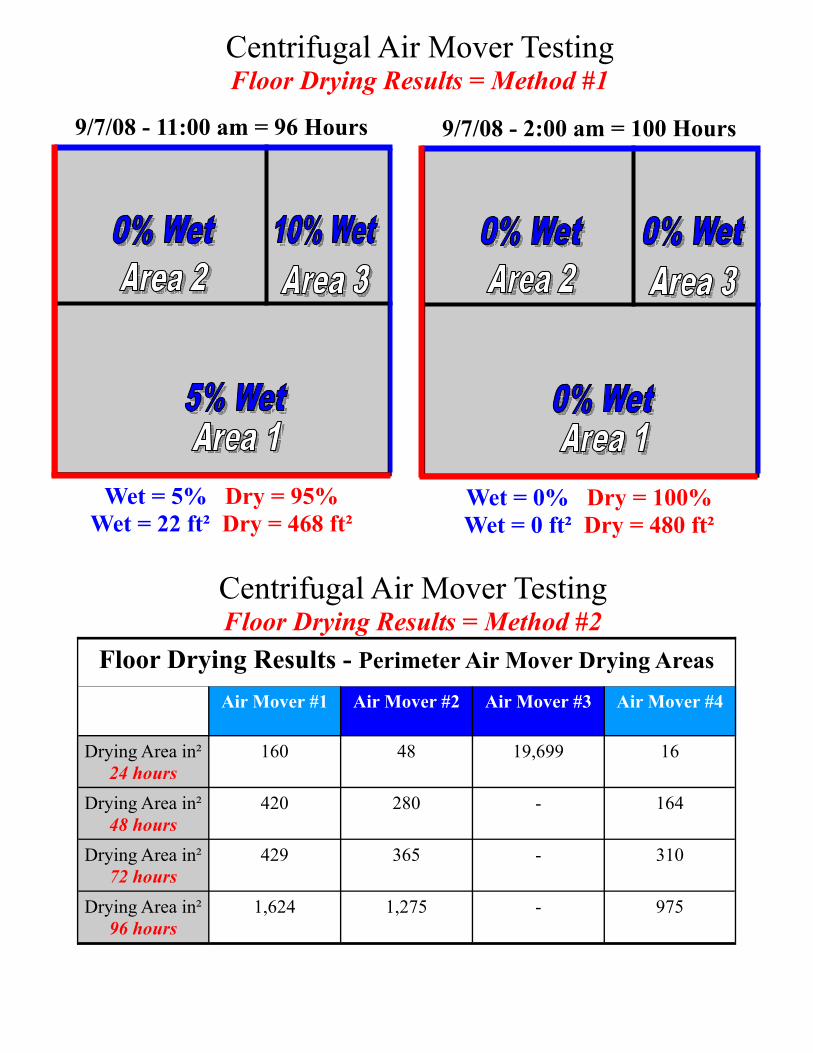
9/7/08 - 11:00 am = 96 Hours
Wet = 5% Dry = 95% Wet = 22 ft² Dry = 468 ft²
9/7/08 - 2:00 am = 100 Hours
Wet = 0% Dry = 100% Wet = 0 ft² Dry = 480 ft²
Centrifugal Air Mover Testing
Floor Drying Results = Method #2
Air Mover #1 Air Mover #2 Air Mover #3 Air Mover #4
Drying Area in² 24 hours
160 48 19,699 16
Drying Area in² 48 hours
420 280 - 164
Drying Area in² 72 hours
429 365 - 310
Drying Area in² 96 hours
1,624 1,275 - 975
Floor Drying Results - Perimeter Air Mover Drying Areas
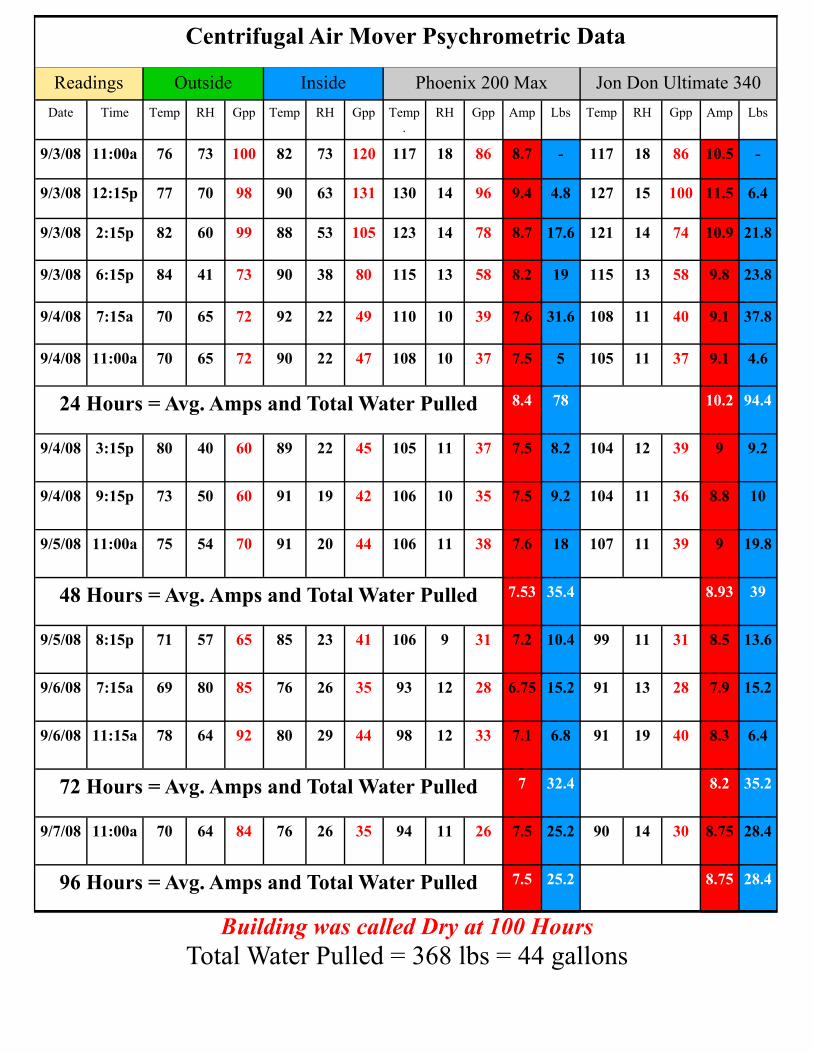
Centrifugal Air Mover Psychrometric Data
Readings Outside Inside Phoenix 200 Max Jon Don Ultimate 340 Date Time Temp RH Gpp Temp RH Gpp Temp
. RH Gpp Amp Lbs
Temp RH Gpp Amp Lbs
9/3/08 11:00a 76 73 100 82 73 120 117 18 86 8.7 - 117 18 86 10.5 -
9/3/08 12:15p 77 70 98 90 63 131 130 14 96 9.4 4.8 127 15 100 11.5 6.4
9/3/08 2:15p 82 60 99 88 53 105 123 14 78 8.7 17.6 121 14 74 10.9 21.8
9/3/08 6:15p 84 41 73 90 38 80 115 13 58 8.2 19 115 13 58 9.8 23.8
9/4/08 7:15a 70 65 72 92 22 49 110 10 39 7.6 31.6 108 11 40 9.1 37.8
9/4/08 11:00a 70 65 72 90 22 47 108 10 37 7.5 5 105 11 37 9.1 4.6
24 Hours = Avg. Amps and Total Water Pulled 8.4 78 10.2 94.4
9/4/08 3:15p 80 40 60 89 22 45 105 11 37 7.5 8.2 104 12 39 9 9.2
9/4/08 9:15p 73 50 60 91 19 42 106 10 35 7.5 9.2 104 11 36 8.8 10
9/5/08 11:00a 75 54 70 91 20 44 106 11 38 7.6 18 107 11 39 9 19.8
48 Hours = Avg. Amps and Total Water Pulled 7.53 35.4 8.93 39
9/5/08 8:15p 71 57 65 85 23 41 106 9 31 7.2 10.4 99 11 31 8.5 13.6
9/6/08 7:15a 69 80 85 76 26 35 93 12 28 6.75 15.2 91 13 28 7.9 15.2
9/6/08 11:15a 78 64 92 80 29 44 98 12 33 7.1 6.8 91 19 40 8.3 6.4
72 Hours = Avg. Amps and Total Water Pulled 7 32.4 8.2 35.2
9/7/08 11:00a 70 64 84 76 26 35 94 11 26 7.5 25.2 90 14 30 8.75 28.4
96 Hours = Avg. Amps and Total Water Pulled 7.5 25.2 8.75 28.4
Building was called Dry at 100 Hours Total Water Pulled = 368 lbs = 44 gallons
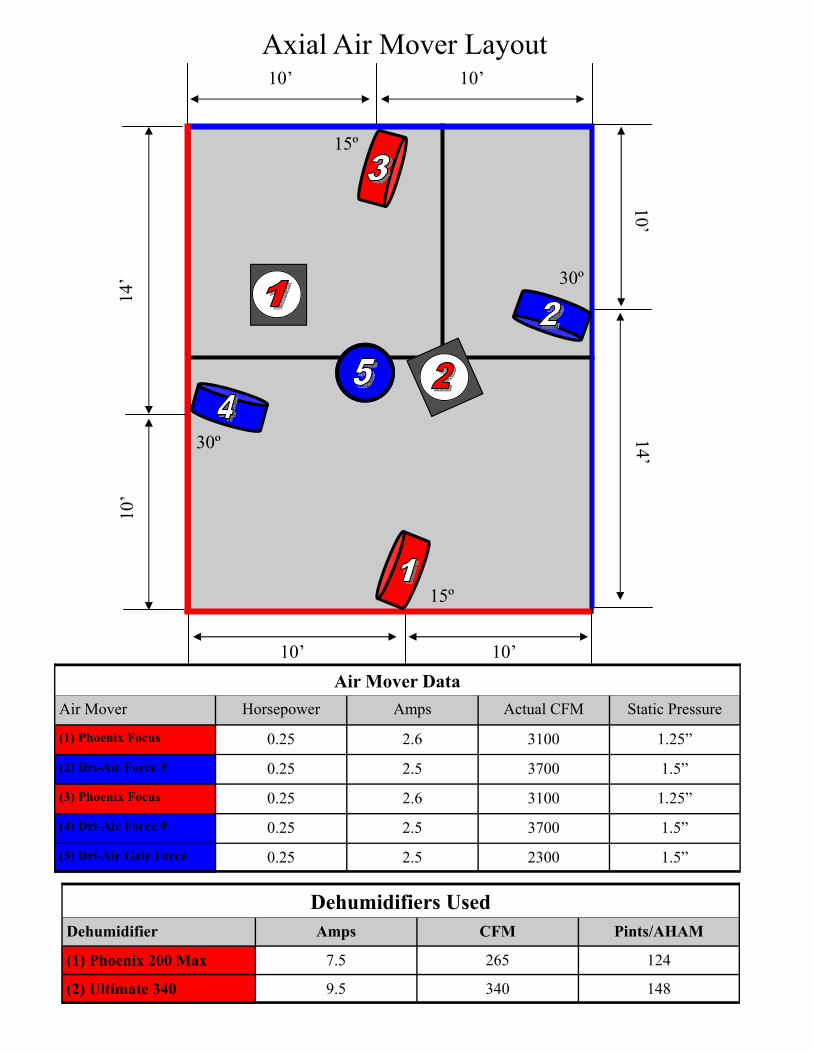
Axial Air Mover Layout
10’ 10’
14’ 10’
10’
14’
10’ 10’
Air Mover Horsepower Amps Actual CFM Static Pressure
(1) Phoenix Focus 0.25 2.6 3100 1.25”
(2) Dri-Air Force 9 0.25 2.5 3700 1.5”
(3) Phoenix Focus 0.25 2.6 3100 1.25”
(4) Dri-Air Force 9 0.25 2.5 3700 1.5”
Air Mover Data
(5) Dri-Air Gale Force 0.25 2.5 2300 1.5”
Dehumidifiers Used Dehumidifier Amps CFM Pints/AHAM
(1) Phoenix 200 Max 7.5 265 124
(2) Ultimate 340 9.5 340 148
30º
15º
15º
30º
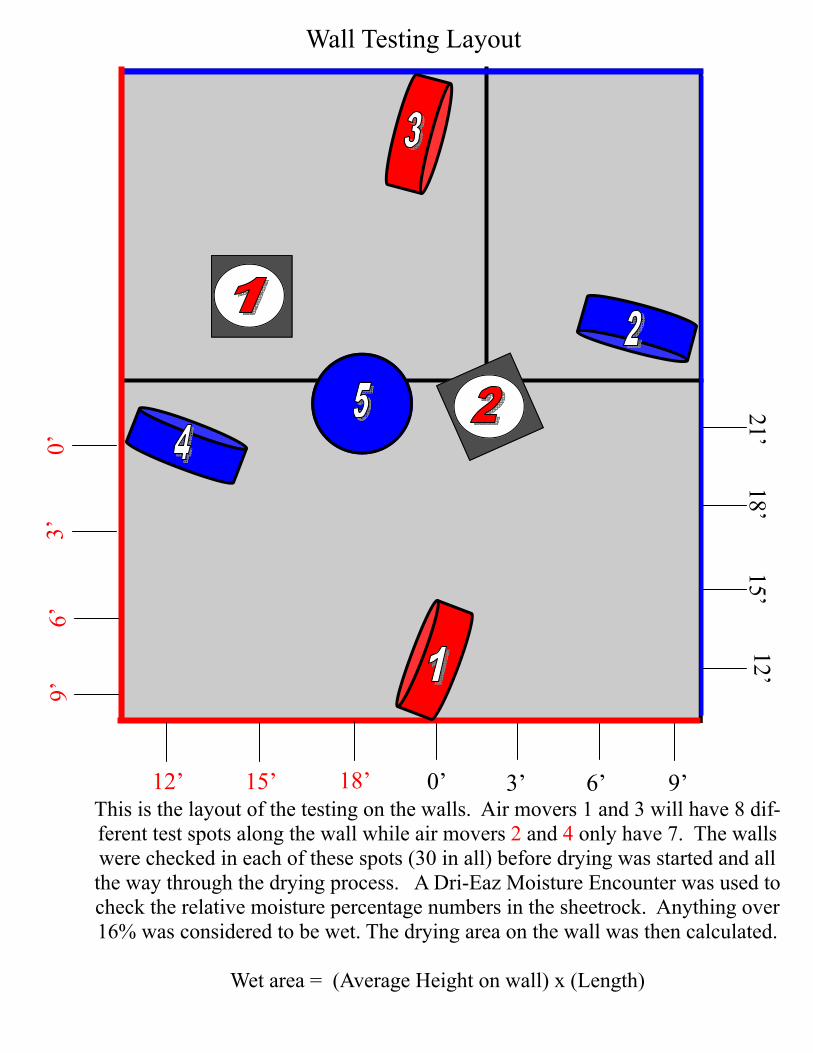
Wall Testing Layout
0’ 3’ 6’ 9’
12’ 15’
18’ 21’
18’ 15’ 12’
0’
3’
6’
9’
This is the layout of the testing on the walls. Air movers 1 and 3 will have 8 dif-ferent test spots along the wall while air movers 2 and 4 only have 7. The walls were checked in each of these spots (30 in all) before drying was started and all the way through the drying process. A Dri-Eaz Moisture Encounter was used to check the relative moisture percentage numbers in the sheetrock. Anything over 16% was considered to be wet. The drying area on the wall was then calculated.
Wet area = (Average Height on wall) x (Length)
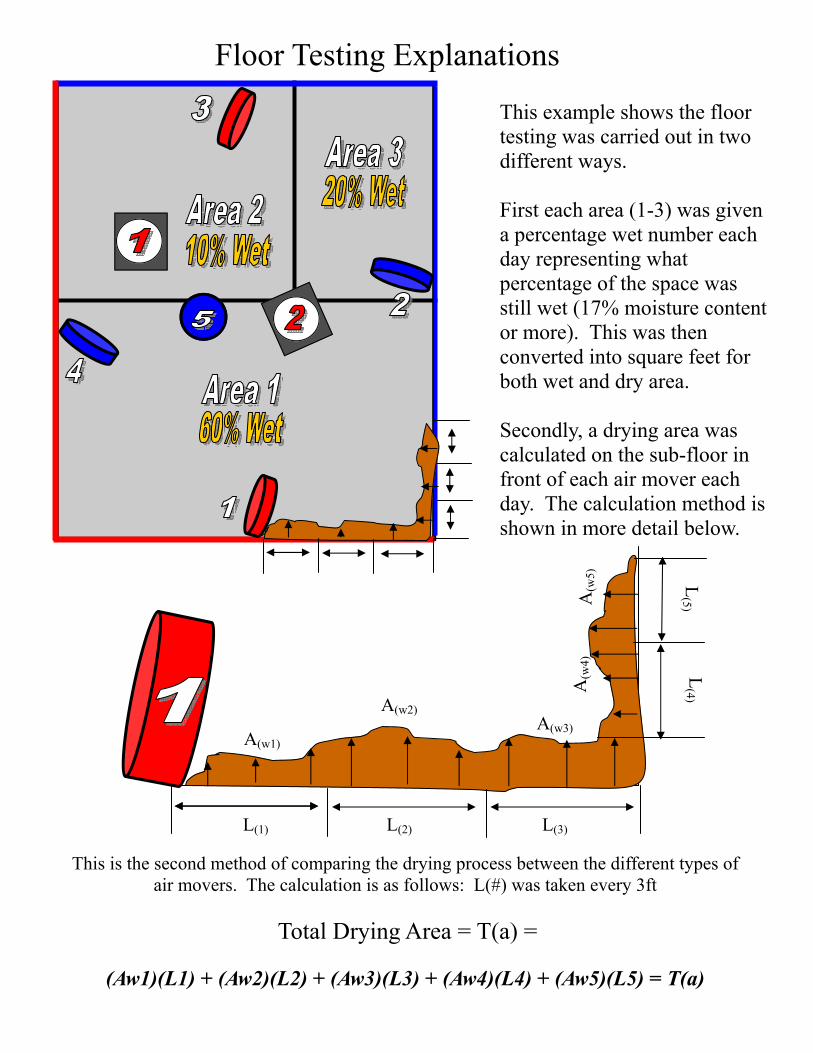
Floor Testing Explanations
This example shows the floor testing was carried out in two different ways. First each area (1-3) was given a percentage wet number each day representing what percentage of the space was still wet (17% moisture content or more). This was then converted into square feet for both wet and dry area. Secondly, a drying area was calculated on the sub-floor in front of each air mover each day. The calculation method is shown in more detail below.
A(w1)
A(w2) A(w3)
A(w
4)
A(w
5)
L(1) L(2) L(3)
L(4)
L(5)
This is the second method of comparing the drying process between the different types of air movers. The calculation is as follows: L(#) was taken every 3ft
Total Drying Area = T(a) =
(Aw1)(L1) + (Aw2)(L2) + (Aw3)(L3) + (Aw4)(L4) + (Aw5)(L5) = T(a)
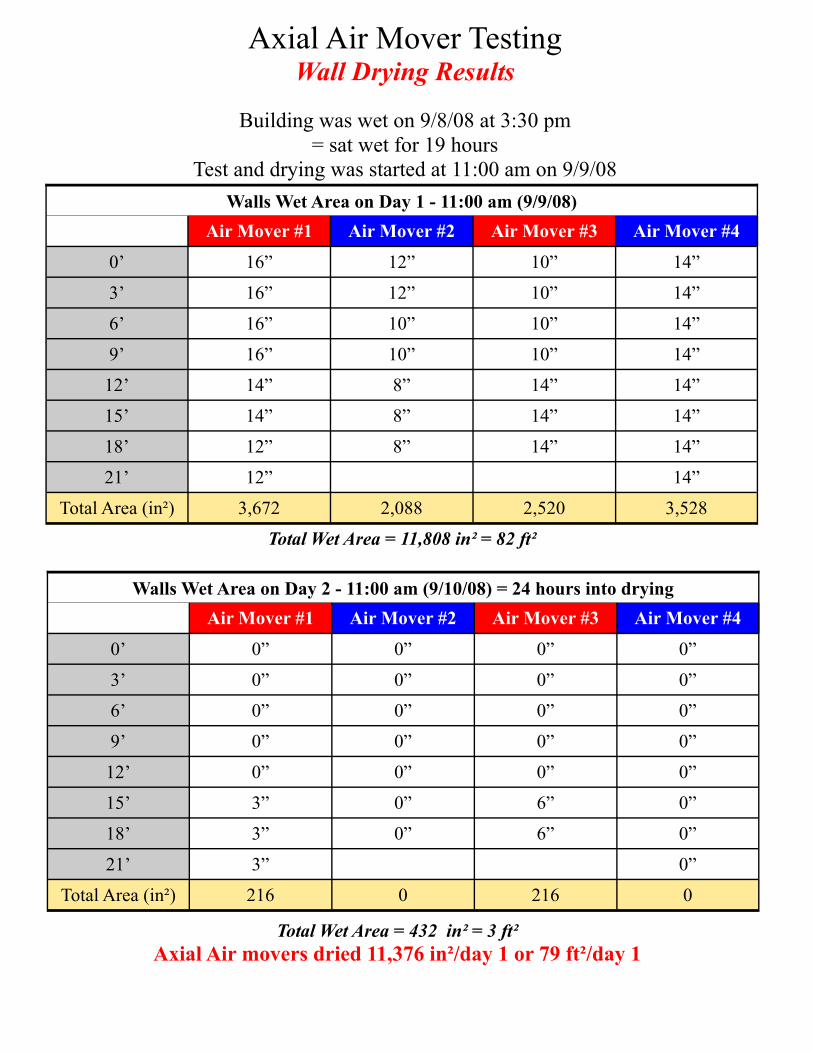
Axial Air Mover Testing
Wall Drying Results
Building was wet on 9/8/08 at 3:30 pm = sat wet for 19 hours
Test and drying was started at 11:00 am on 9/9/08 Walls Wet Area on Day 1 - 11:00 am (9/9/08)
Air Mover #1 Air Mover #2 Air Mover #3 Air Mover #4
0’ 16” 12” 10” 14”
3’ 16” 12” 10” 14”
6’ 16” 10” 10” 14”
9’ 16” 10” 10” 14”
12’ 14” 8” 14” 14”
15’ 14” 8” 14” 14”
18’ 12” 8” 14” 14”
21’ 12” 14”
Total Area (in²) 3,672 2,088 2,520 3,528
Walls Wet Area on Day 2 - 11:00 am (9/10/08) = 24 hours into drying Air Mover #1 Air Mover #2 Air Mover #3 Air Mover #4
0’ 0” 0” 0” 0”
3’ 0” 0” 0” 0”
6’ 0” 0” 0” 0”
9’ 0” 0” 0” 0”
12’ 0” 0” 0” 0”
15’ 3” 0” 6” 0”
18’ 3” 0” 6” 0”
21’ 3” 0”
Total Area (in²) 216 0 216 0
Total Wet Area = 11,808 in² = 82 ft²
Total Wet Area = 432 in² = 3 ft² Axial Air movers dried 11,376 in²/day 1 or 79 ft²/day 1
Axial Air Mover Testing
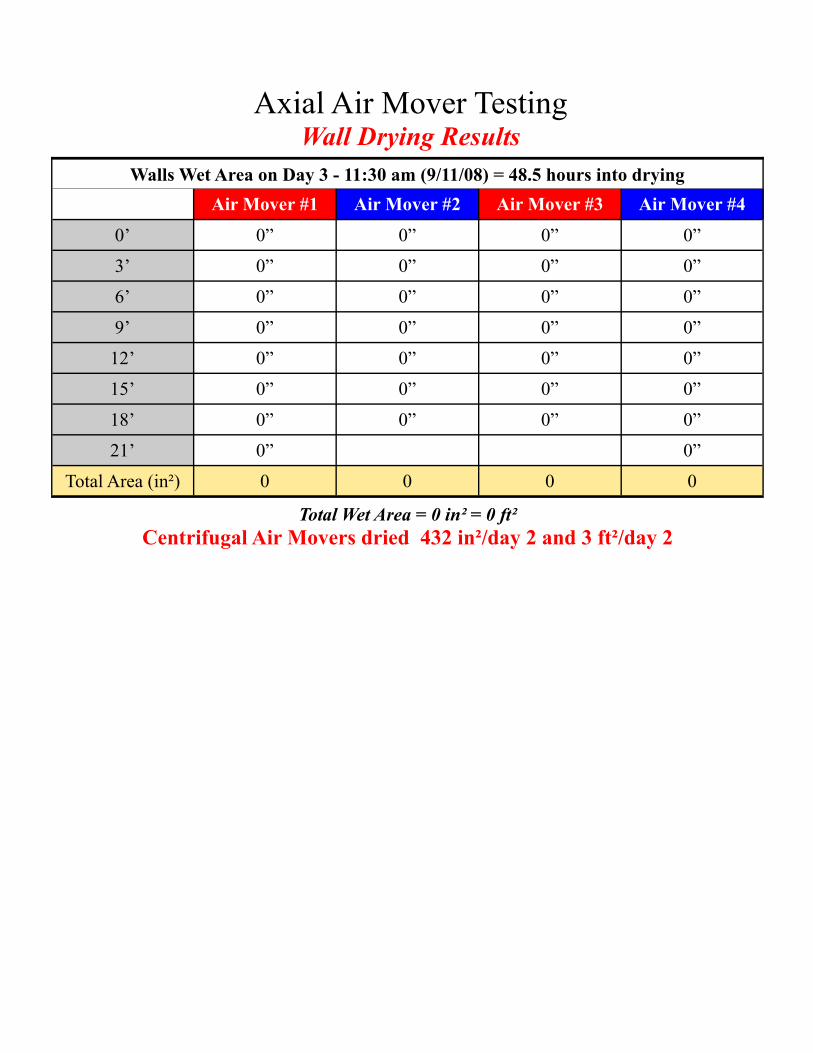
Wall Drying Results Walls Wet Area on Day 3 - 11:30 am (9/11/08) = 48.5 hours into drying
Air Mover #1 Air Mover #2 Air Mover #3 Air Mover #4
0’ 0” 0” 0” 0”
3’ 0” 0” 0” 0”
6’ 0” 0” 0” 0”
9’ 0” 0” 0” 0”
12’ 0” 0” 0” 0”
15’ 0” 0” 0” 0”
18’ 0” 0” 0” 0”
21’ 0” 0”
Total Area (in²) 0 0 0 0
Total Wet Area = 0 in² = 0 ft² Centrifugal Air Movers dried 432 in²/day 2 and 3 ft²/day 2
Axial Air Mover Testing
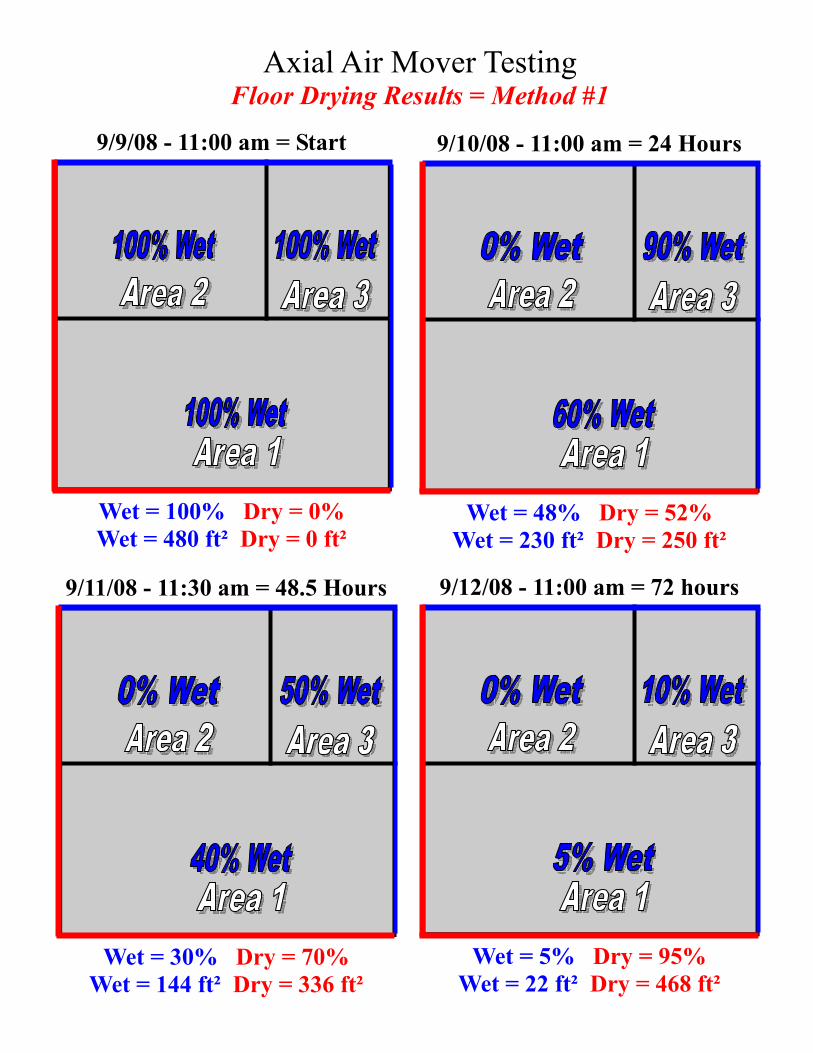
Floor Drying Results = Method #1
9/9/08 - 11:00 am = Start
Wet = 100% Dry = 0% Wet = 480 ft² Dry = 0 ft²
9/10/08 - 11:00 am = 24 Hours
Wet = 48% Dry = 52% Wet = 230 ft² Dry = 250 ft²
9/11/08 - 11:30 am = 48.5 Hours
Wet = 30% Dry = 70% Wet = 144 ft² Dry = 336 ft²
9/12/08 - 11:00 am = 72 hours
Wet = 5% Dry = 95% Wet = 22 ft² Dry = 468 ft²
Axial Air Mover Testing
Floor Drying Results = Method #1
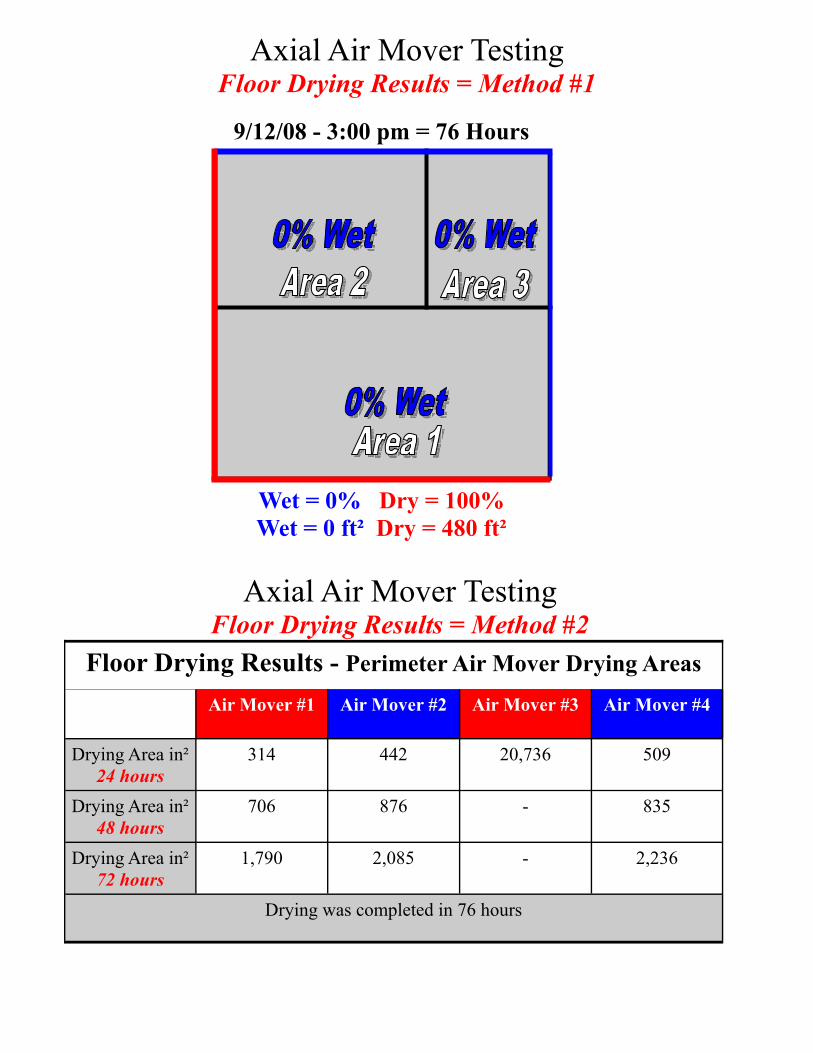
9/12/08 - 3:00 pm = 76 Hours
Wet = 0% Dry = 100% Wet = 0 ft² Dry = 480 ft²
Axial Air Mover Testing
Floor Drying Results = Method #2 Floor Drying Results - Perimeter Air Mover Drying Areas
Air Mover #1 Air Mover #2 Air Mover #3 Air Mover #4
Drying Area in² 24 hours
314 442 20,736 509
Drying Area in² 48 hours
706 876 - 835
Drying Area in² 72 hours
1,790 2,085 - 2,236
Drying was completed in 76 hours
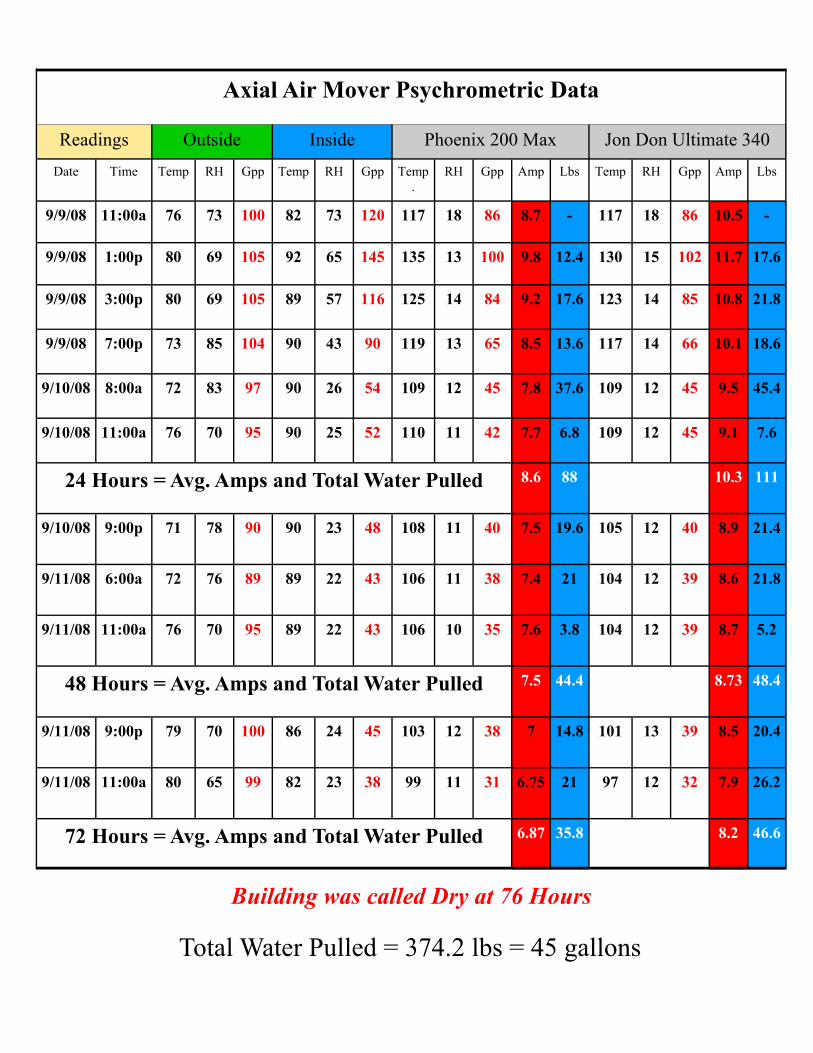
Axial Air Mover Psychrometric Data
Readings Outside Inside Phoenix 200 Max Jon Don Ultimate 340 Date Time Temp RH Gpp Temp RH Gpp Temp
. RH Gpp Amp Lbs
Temp RH Gpp Amp Lbs
9/9/08 11:00a 76 73 100 82 73 120 117 18 86 8.7 - 117 18 86 10.5 -
9/9/08 1:00p 80 69 105 92 65 145 135 13 100 9.8 12.4 130 15 102 11.7 17.6
9/9/08 3:00p 80 69 105 89 57 116 125 14 84 9.2 17.6 123 14 85 10.8 21.8
9/9/08 7:00p 73 85 104 90 43 90 119 13 65 8.5 13.6 117 14 66 10.1 18.6
9/10/08 8:00a 72 83 97 90 26 54 109 12 45 7.8 37.6 109 12 45 9.5 45.4
9/10/08 11:00a 76 70 95 90 25 52 110 11 42 7.7 6.8 109 12 45 9.1 7.6
24 Hours = Avg. Amps and Total Water Pulled 8.6 88 10.3 111
9/10/08 9:00p 71 78 90 90 23 48 108 11 40 7.5 19.6 105 12 40 8.9 21.4
9/11/08 6:00a 72 76 89 89 22 43 106 11 38 7.4 21 104 12 39 8.6 21.8
9/11/08 11:00a 76 70 95 89 22 43 106 10 35 7.6 3.8 104 12 39 8.7 5.2
48 Hours = Avg. Amps and Total Water Pulled 7.5 44.4 8.73 48.4
9/11/08 9:00p 79 70 100 86 24 45 103 12 38 7 14.8 101 13 39 8.5 20.4
9/11/08 11:00a 80 65 99 82 23 38 99 11 31 6.75 21 97 12 32 7.9 26.2
72 Hours = Avg. Amps and Total Water Pulled 6.87 35.8 8.2 46.6
Building was called Dry at 76 Hours
Total Water Pulled = 374.2 lbs = 45 gallons
Conclusions From the Data
Recently, there has been some debate among the leaders in our industry over the air movers being used by the restoration professionals. Which is better for our primary air mover? Which helps us best carry out our objective which is to dry out any structure as fast as possible? Axials or Centrifugals. When you look at the data you will clearly see that it is not really a contest at all. It has never been a contest, but for some reason we have some industry leaders ignoring the overall data and narrow mindedly focusing on one piece of information. This test was carried out to set the record straight on the true performance of both the centrifugal and axial air movers. They both have their place in this industry and this paper was put together to let everyone know what their places are. How can each type of air mover be used to the best of its ability? This is what we are going to look at. Both types of air movers were used as the primary air mover to dry out our labora-tory structure. This means that one time our structure was dried out with only centrifugal air movers and the other time it was dried out with only axial air movers. In both categories , we used the best quality air movers our industry has to offer. We are going to be evaluating each type of air mover in several different methods, but mind you all these methods come back to one common goal which is finding the primary air mover that will help the restorer dry the structure as fast as possible. We made every effort to make sure that both tests were carried out identically with the exception of the type of air movers being used. In both tests we used 450 gallons of water. This was determined by running the hose for an hour and a half a looking at the rate of water leaving the hose which is 5 gallons/min. The extraction process was exactly the same for both tests. We used a Blueline Thermal Wave extractor with 75 feet of 2” extraction hose. The areas with carpet and padding were extracted with two passes by the walk behind Hydro-X on 3/4 speed. The area with carpet only was extracted with two passes by the light wand. This, of course, was the same for both tests. The air movers were laid out within the room exactly the same. The spacing can be observed on pages 2 and 10 within the data sheets. Also the dehumidification was exactly the same for both tests. We will note that the amount of dehumidification was more than needed for this space. We were completely aware of this. We were also wanting to test or compare the new Ultimate 340 against the Phoenix 200 Max and the best way to do so is within the same chamber and same environment. But it is important to note that both tests had this extra dehumidification available. In this line of testing, we looked at five different ways of comparing these air movers: (1) Wall Drying - water that wicked up the walls from the ground (2) Floor Drying - the area dried out directly in front of each air mover. (3) Floor Drying - the flooring was divided into 3 sections and each was observed daily. (4) Water Pulled by dehumidifiers (5) Overall drying time of the structure.
Wall Drying Conclusions
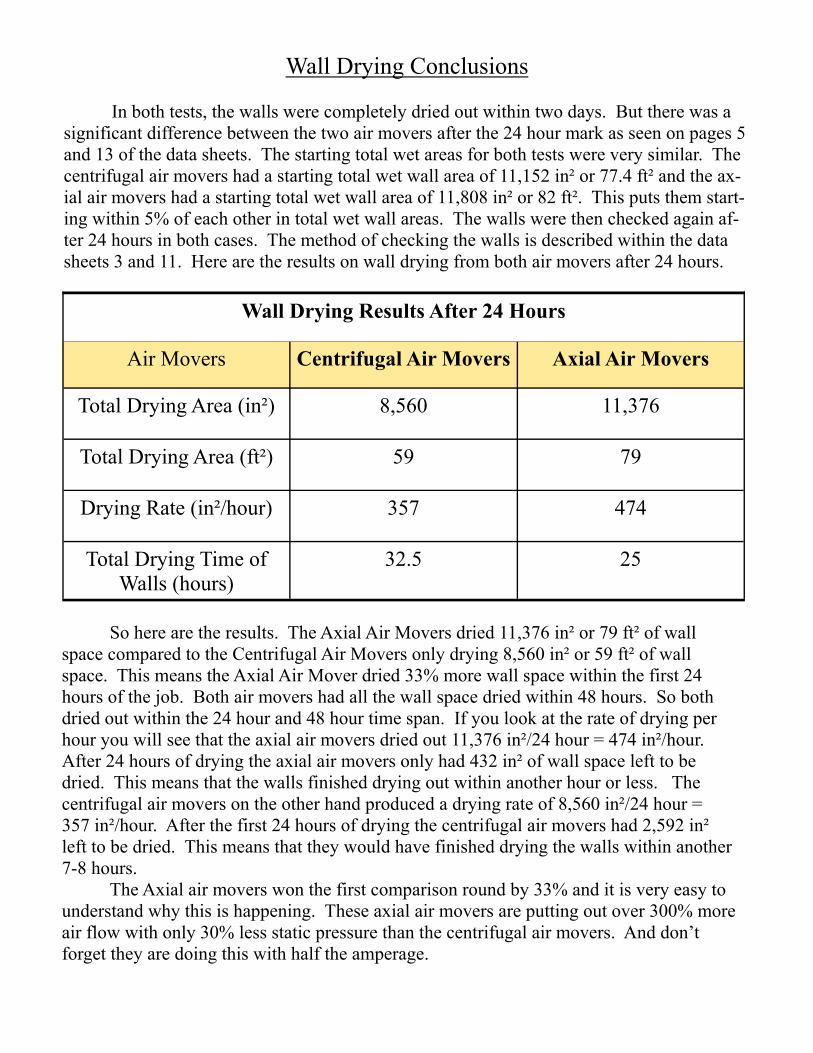
In both tests, the walls were completely dried out within two days. But there was a significant difference between the two air movers after the 24 hour mark as seen on pages 5 and 13 of the data sheets. The starting total wet areas for both tests were very similar. The centrifugal air movers had a starting total wet wall area of 11,152 in² or 77.4 ft² and the ax-ial air movers had a starting total wet wall area of 11,808 in² or 82 ft². This puts them start-ing within 5% of each other in total wet wall areas. The walls were then checked again af-ter 24 hours in both cases. The method of checking the walls is described within the data sheets 3 and 11. Here are the results on wall drying from both air movers after 24 hours.
Air Movers Centrifugal Air Movers Axial Air Movers
Total Drying Area (in²) 8,560 11,376
Wall Drying Results After 24 Hours
Total Drying Area (ft²) 59 79
Drying Rate (in²/hour) 357 474
Total Drying Time of Walls (hours)
32.5 25
So here are the results. The Axial Air Movers dried 11,376 in² or 79 ft² of wall space compared to the Centrifugal Air Movers only drying 8,560 in² or 59 ft² of wall space. This means the Axial Air Mover dried 33% more wall space within the first 24 hours of the job. Both air movers had all the wall space dried within 48 hours. So both dried out within the 24 hour and 48 hour time span. If you look at the rate of drying per hour you will see that the axial air movers dried out 11,376 in²/24 hour = 474 in²/hour. After 24 hours of drying the axial air movers only had 432 in² of wall space left to be dried. This means that the walls finished drying out within another hour or less. The centrifugal air movers on the other hand produced a drying rate of 8,560 in²/24 hour = 357 in²/hour. After the first 24 hours of drying the centrifugal air movers had 2,592 in² left to be dried. This means that they would have finished drying the walls within another 7-8 hours. The Axial air movers won the first comparison round by 33% and it is very easy to understand why this is happening. These axial air movers are putting out over 300% more air flow with only 30% less static pressure than the centrifugal air movers. And don’t forget they are doing this with half the amperage.
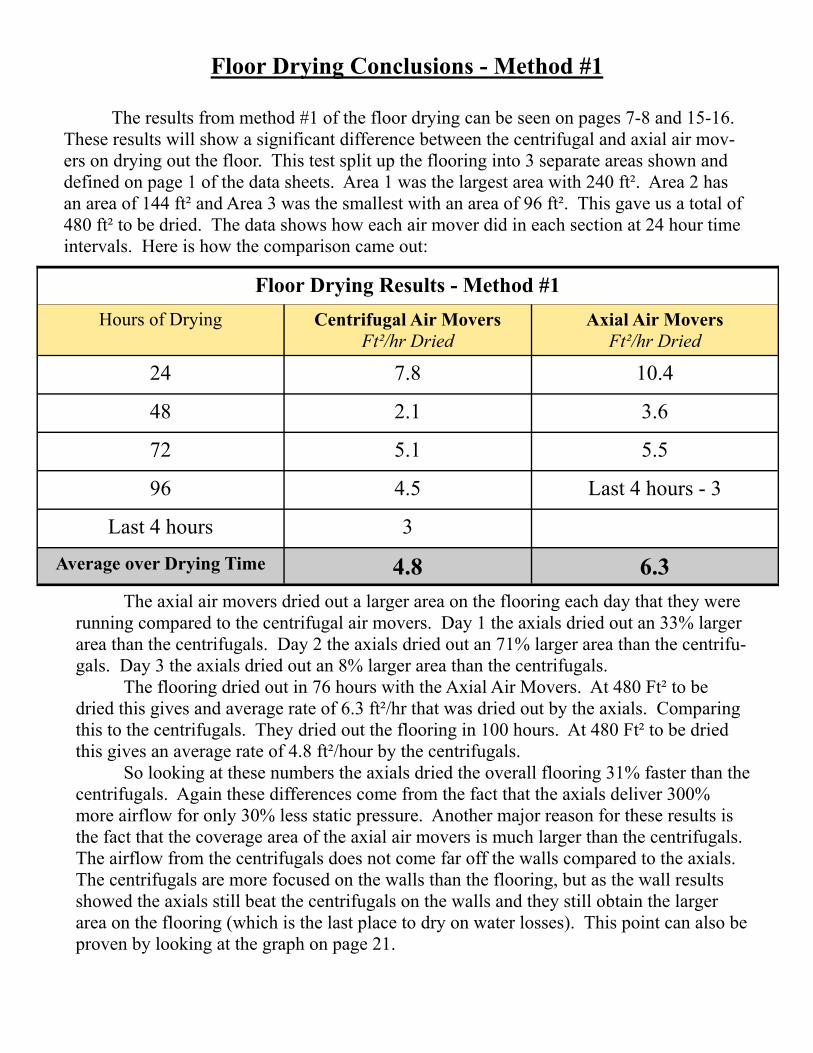
Floor Drying Conclusions - Method #1
The results from method #1 of the floor drying can be seen on pages 7-8 and 15-16. These results will show a significant difference between the centrifugal and axial air mov-ers on drying out the floor. This test split up the flooring into 3 separate areas shown and defined on page 1 of the data sheets. Area 1 was the largest area with 240 ft². Area 2 has an area of 144 ft² and Area 3 was the smallest with an area of 96 ft². This gave us a total of 480 ft² to be dried. The data shows how each air mover did in each section at 24 hour time intervals. Here is how the comparison came out:
Hours of Drying Centrifugal Air Movers Ft²/hr Dried
Axial Air Movers Ft²/hr Dried
24 7.8 10.4
48 2.1 3.6
72 5.1 5.5
Floor Drying Results - Method #1
96 4.5 Last 4 hours - 3
Last 4 hours 3
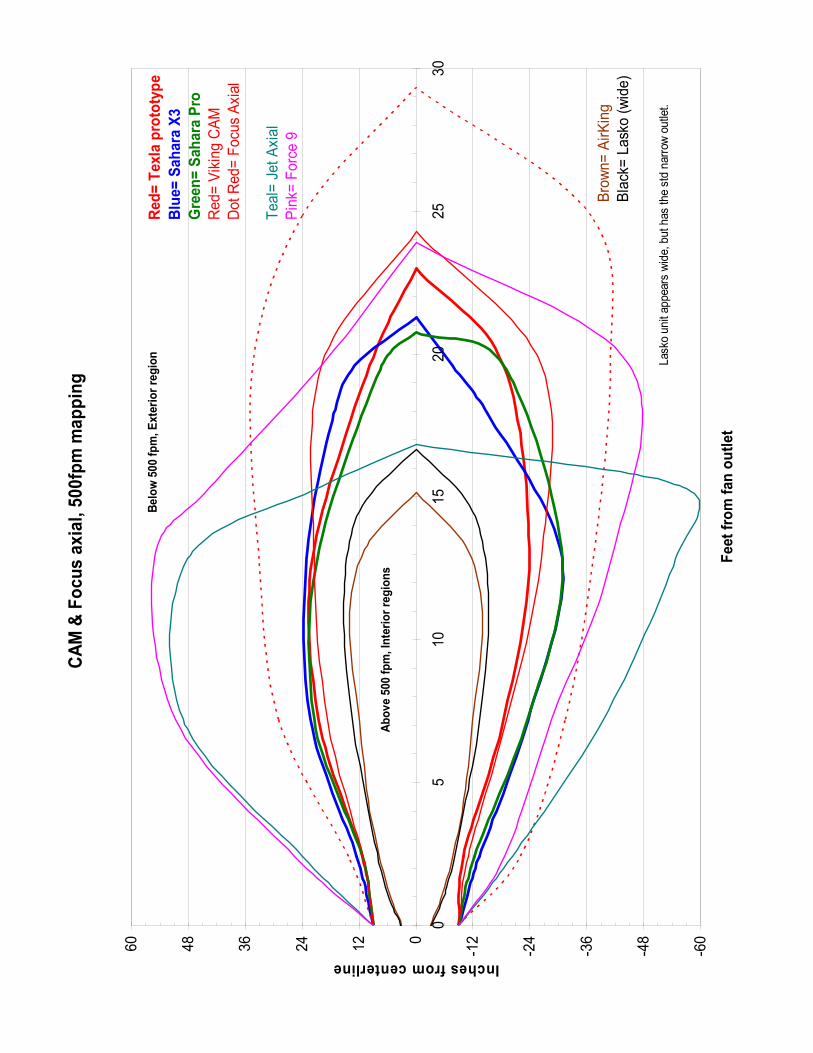
Average over Drying Time 4.8 6.3 The axial air movers dried out a larger area on the flooring each day that they were running compared to the centrifugal air movers. Day 1 the axials dried out an 33% larger area than the centrifugals. Day 2 the axials dried out an 71% larger area than the centrifu-gals. Day 3 the axials dried out an 8% larger area than the centrifugals. The flooring dried out in 76 hours with the Axial Air Movers. At 480 Ft² to be dried this gives and average rate of 6.3 ft²/hr that was dried out by the axials. Comparing this to the centrifugals. They dried out the flooring in 100 hours. At 480 Ft² to be dried this gives an average rate of 4.8 ft²/hour by the centrifugals. So looking at these numbers the axials dried the overall flooring 31% faster than the centrifugals. Again these differences come from the fact that the axials deliver 300% more airflow for only 30% less static pressure. Another major reason for these results is the fact that the coverage area of the axial air movers is much larger than the centrifugals. The airflow from the centrifugals does not come far off the walls compared to the axials. The centrifugals are more focused on the walls than the flooring, but as the wall results showed the axials still beat the centrifugals on the walls and they still obtain the larger area on the flooring (which is the last place to dry on water losses). This point can also be proven by looking at the graph on page 21.
CA
M &
Foc
us a
xial
, 500
fpm
map
ping
-60
-48
-36
-24
-1201224364860
05
1015
2025
30
Feet
from
fan
outle
t
Inches from centerline
Red
= Te
xla
prot
otyp
eB
lue=
Sah
ara
X3G
reen
= S
ahar
a P
roR
ed=
Viki
ng C
AMD
ot R
ed=
Focu
s Ax
ial
Teal
= Je
t Axi
alPi
nk=
Forc
e 9
Abo
ve 5
00 fp
m, I
nter
ior r
egio
ns
Bel
ow 5
00 fp
m, E
xter
ior r
egio
n
Brow
n= A
irKin
gBl
ack=
Las
ko (w
ide)
Lask
o un
it ap
pear
s w
ide,
but
has
the
std
narro
w o
utle
t.
Observations From Chart On Page 21
Sahara XT Total Area of 500 FPM Right side (0’- 21.3’) Left side (0’- 21.3’) Right Side (0’- 16”) Left Side (0’- 16’)
9,282 in² 4,877 in² 4,405 in² 4,122 in² 3,777 in²
64 ft² 33.9 ft² 30.6 ft² 28.6 ft² 26.2 ft²
Right Side Right Side
Motor
Left Side
Sahara X3
Area of At Least 500 fpm of velocity
Left Side
Determination of Area Under the Curves
5’ 10’ 15’ 20’
Inch
es fr
om c
ente
r
Center Of Fam
a
b
c
b a
c b
b
b b
b
b b
a
a
c
a
Calculations (A = Area) Areas 1,4,6, and 9 = (A) = (a)(b)
Areas 2,5,8, and 11 = (A) = ½(a)(b) Areas 3, 7, 10, and 12 = (A) = ∫a= ∞
a=0 (a)(∆b)
Areas (1+2+3+4+5+6+7+8+9+10+11+12) = Total Area Under Cuve
Observations From Chart On Page 21—Cont’d
The same calculations for the areas under the curve of at least 500 fpm were carried out for the Phoenix Focus and the DriAir Force 9. These were the only three air movers calculated because they were the only air movers used in the test that fall on the chart on page 21. It is important to note that the specs on the DriAir Tempest and the old DriEaz Sahara air movers are within 10% of the Sa-hara X3. So we would expect the area within 500 Fpm to be very similar. Here are the numbers from all three air movers.
Force 9 - DriAir Total Area of 500 FPM Right side (0’- 21.3’) Left side (0’- 21.3’) Right Side (0’- 16”) Left Side (0’- 16’)
19,000 in² 9,100 in² 9,900 in² 5,780 in² 8,140 in²
132 ft² 63.2 ft² 68.9 ft² 40.1 ft² 56.5 ft²
Focus - Phoenix Total Area of 500 FPM Right side (0’- 21.3’) Left side (0’- 21.3’) Right Side (0’- 16”) Left Side (0’- 16’)
19,564 in² 10,765 in² 8,799 in² 5,700 in² 4,878 in²
135.8 ft² 74.8 ft² 61.1 ft² 39.6 ft² 33.9 ft²
Sahara XT - DriEaz Total Area of 500 FPM Right side (0’- 21.3’) Left side (0’- 21.3’) Right Side (0’- 16”) Left Side (0’- 16’)
9,282 in² 4,877 in² 4,405 in² 4,122 in² 3,777 in²
64 ft² 33.9 ft² 30.6 ft² 28.6 ft² 26.2 ft²
The chart on page 21 was carried out by Therma-Stor Products. I simply calculated the area for each air mover where at least 500 fpm was achieved. Looking at these numbers explains a lot when you look at the drying results we got in the 480 ft² test house. It is important to establish which set of numbers are important on a typical water loss. For instance, the total area numbers are not as important for looking at what is going to happen on drying the floor than the indi-vidual left and right side numbers. The reason being is that the middle line is go-ing to be the wall and everything up the wall is useless for drying the flooring but is helpful in drying out the walls. More specifically, since air movers are placed every 12-16 linear feet, a very important comparison is looking at what the air movers did from 0’ to 16” and thus the highlighted boxes.
Observations From Chart On Page 21—Cont’d
It is also interesting that the air movers did not produce even areas over 500 fpm from the center line. The Phoenix Focus and Dri-Eaz Sahara had a bigger area on the right side of the center line and the Dri-Air Force 9 had a much larger area on the left side of the center line. Instructors today teach to place centrifugal air movers at the walls with the motor or right side of the air mover facing the wall. This means that the only number we can look at for the centrifugal air movers is the left side values. On the other hand, the axials can be placed in any direction which means we can take advantage of the side with better velocity numbers. Looking within the 12-16 linear feet spacing pushed by the IICRC the following comparisons can be made between the air movers. The air movers were all placed in the clockwise position meaning we need to look at the left side numbers. - The Phoenix Focus had an area with 500 fpm 30% larger than the Sahara X3. - The Dri-Air Force 9 had an area with 500 fpm 116% larger than the Sahara X3 - The Dri-Air Force 9 had an area with 500 fpm 67% larger than the Phoenix Focus.
Floor Drying Results - Method #2
Method #2 of the floor drying results focused on the perimeter drying areas caused by the air movers. This would be the drying area directly in front of the air movers along the walls. In both tests Air mover #3 had a very large floor drying area due to the fact that there was no padding under the carpeting. Both types of air movers had similar drying areas in the first day. They were with in 5% of each other. Another reason we will not be focusing on the floor drying area of air mover #3 is because air mover #5 was helping dry Area 2 as well. Because of this we are only going to be comparing Air Movers #1, #2, and #4.
Centrifugal Air Movers Axial Air Movers
Total Drying Area 6,066 9,793 Drying Rate (in²/hr) 60.6 129
Floor Drying Results - Method #2
This comparison shows that the axial air movers dried the flooring at a rate 112% faster than the centrifugal air movers. The total drying area of the axial air movers was 61% larger than that of the centrifugal air movers. The rest of the areas in both cases were dried out with the center air mover being moved around plus the Ultimate 340 de-humidifier’s exhaust air blow straight down at the flooring. This dry air being directed at the floor dried a fairly large area in both tests.
Difference In Water Pulled
You will notice a significant difference in the rate of water pulled by the same dehumidifiers. The only variable that changed were the type of air movers being used on the job.
The dehumidifiers pulled water at a rate 34% higher when the axial air movers were running compared to the same dehumidifiers when the centrifugals air movers were running. This makes perfect sense seeing that the axials cover a much larger area and produce up to 3 times the volume of air flow than the centrifugals. This is yet another aspect of the axial air movers that helps them to produce overall faster drying times than the centrifugal air movers. It is also important to notice that even though the rate of water pulled was 34% higher with the axial air movers, the total amount of water pulled by the dehumidifiers in both cases were within 1.5% of each other. This confirms that the structure was wet the same in both tests producing even testing conditions.
Air Movers Used Centrifugals Axials Lbs of Water Pulled
1rst 24 hours 172.4 199
Lbs of Water Pulled 2nd 24 Hours
74.4 92.8
Water Pulled by the Dehumidifiers
Lbs of Water Pulled 3rd 24 Hours
67.6 82.4
Total Lbs of Water Pulled 368 374.2
Total Gallons Pulled 44 45
Hours DH’s Ran (until building was dry)
100 76
Rate (lbs/hr) 3.68 4.93
Difference in Water Pulled Cont’d
The page before shows that the dehumidifiers in both cases pulled within 1.5% of each other in terms of the total water pulled over the duration of the drying time. In order to really confirm that the buildings were introduced with similar amounts of water we need to factor in the amount of water pulled from the outside in both cases. This leaves that amount of water that came from the structure alone. This will give us a better comparison. In order to accomplish this we look at the dehumidification addendum calculation that ac-counts for the amount of water taken in to a structure from the outside. This calculation was developed in concert by Therma-Stor and Chuck Dewald III. The exact calculation can be found on page 51 in the American Drying Institute Handbook. The information needed to do the calculation is the size of the drying chamber, the average grains/lb outside during the test, the average grains/lb inside during the test, and the average infiltration rate of any building. These variables have been factored in to produce these numbers. The rate of water coming from outside during the centrifugal air mover testing was 0.655 lbs/hr and the rate during the axial air mover testing was 1.04 lbs/hr. Us-ing this information and the time that the dehumidifiers ran we get that during the centrifu-gal air mover test 65.5 lbs of water came into the structure from the outside. During the ax-ial air mover test we got 79 lbs of water coming into the structure from the outside. If we subtract these numbers from the amount pulled by the dehumidifiers we will get a rough ideas of the actual amount of water pulled by the dehumidifiers in both cases from the ma-terials in the building. The dehumidifiers pulled 295.2 lbs of water coming from the struc-ture during the axial air mover test and the dehumidifiers pulled 302.5 lbs of water from the structure during the centrifugal air mover test. Again this confirms that the structure was wet to within 2.5% of each other during both test in terms of the amount of water put in the initially. And since we know that both structures sat wet for the same duration. These tests were a very good comparison of what these air movers actually do. Even though the struc-ture was wet to within 2.5% of each other the axial air movers dried the structure 34% faster than the centrifugal air movers.
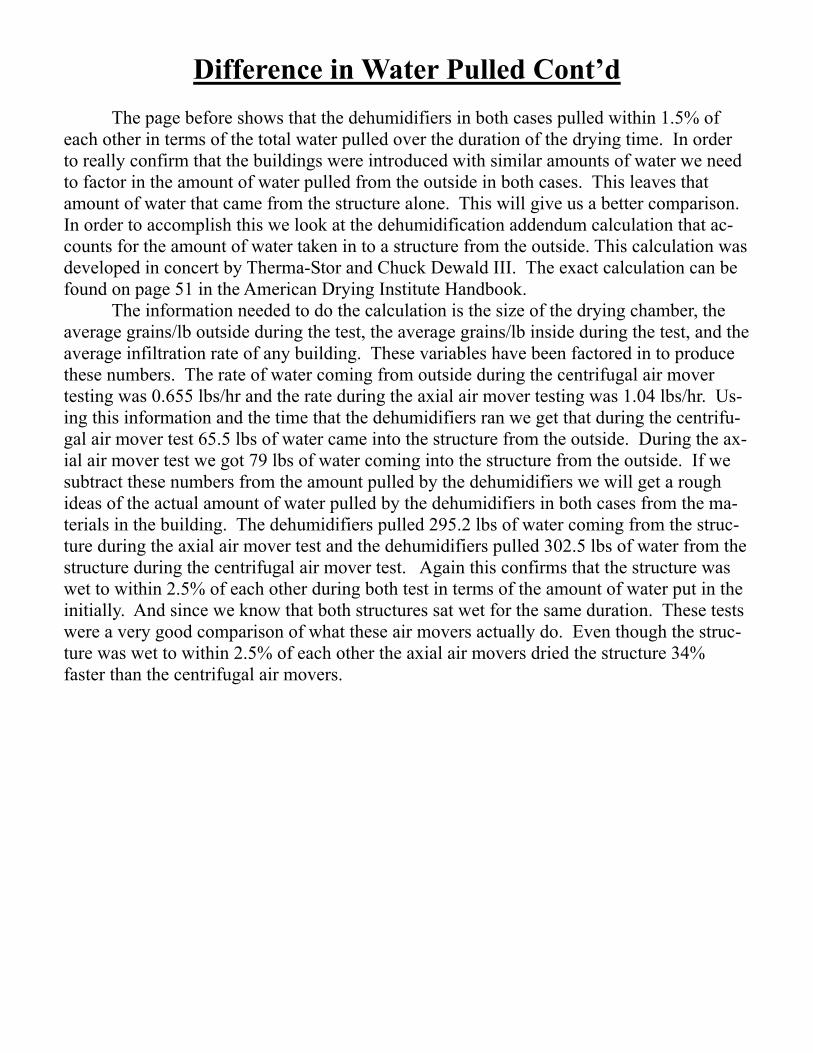
Shot of Test #1 Showing Both dehumidifiers and Air movers #2, 3, and 5
Shot of Test #1 Showing Both dehumidifiers and Air movers #3, 4, and 5
Air Mover #1 Drying Area at 24 Hours
Air Mover #4 Drying Area at 24 Hours
Air Mover #2 Drying Area at 24 Hours
Air Mover #4 Drying Area shown with
tape at 48 & 72 hours
Air Mover #2 Drying Area shown with
tape at 48 & 72 hours
Picture is showing that the area on right side of blue tape is dry
and to the left of blue tape is wet.
48 hours
72 hours
48 hours
72 hours
Drying Test #1
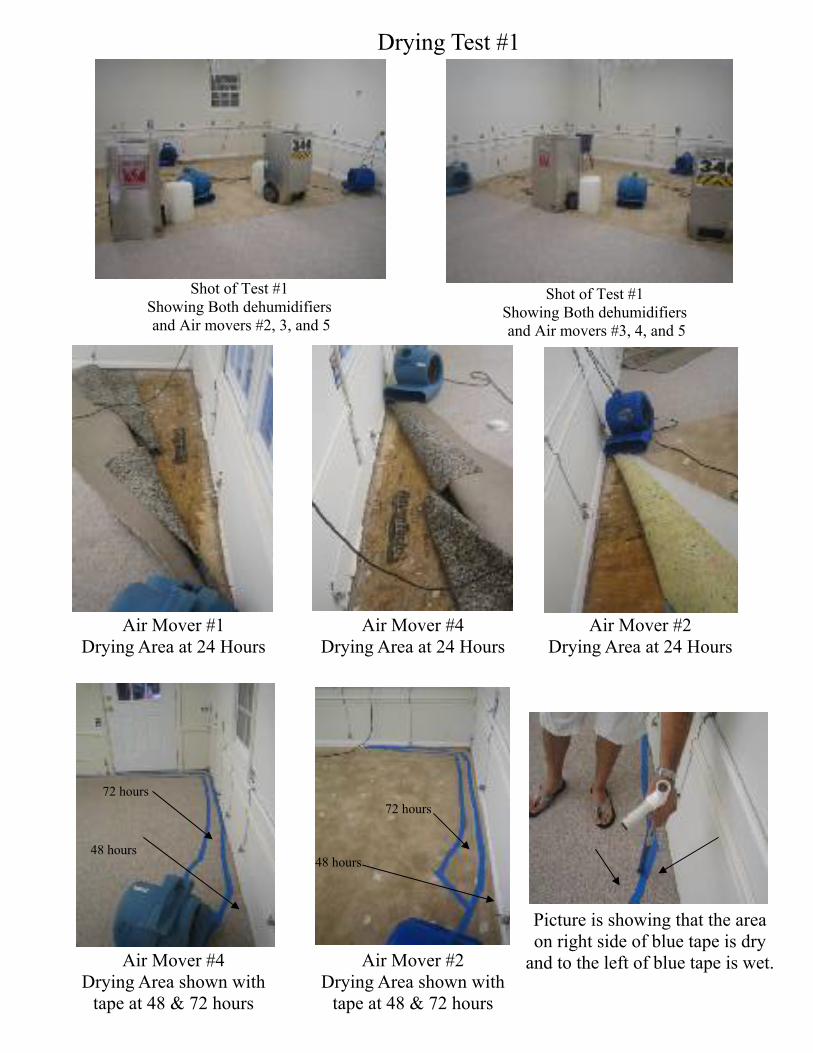
Air Mover #4 Drying Area at 24 Hours
Air Mover #3 Drying Area at 24 Hours
Air Mover #2 Drying Area at 24 Hours
Air Mover #1 Drying Area at 24 Hours
And 48 hours
24 hours
48 hours
Air Mover #4 Drying Area at 24 Hours
And 48 hours
24 hours
48 hours
Air Mover #2 Drying Area at 24 Hours
And 48 hours
Drying Test #2