Embed Size (px)
Citation preview

THE TRUTH ABOUT HOMEOWNERS – WHY THEY’RE NOT SELLING
Presented byCarmen Hirciag
Senior Research Analyst
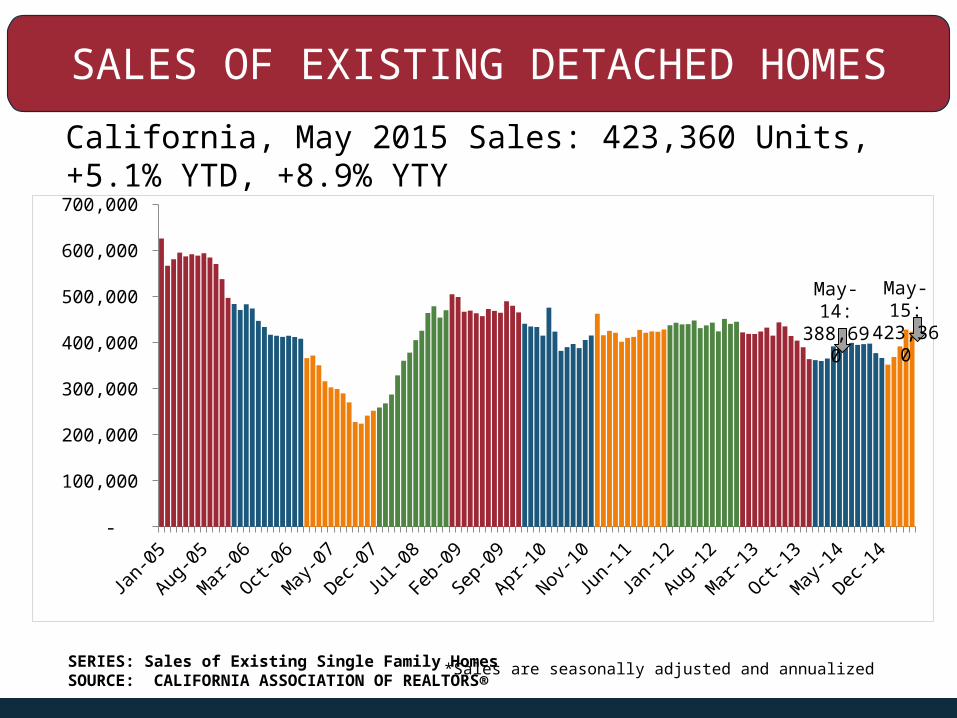
SALES OF EXISTING DETACHED HOMES
California, May 2015 Sales: 423,360 Units, +5.1% YTD, +8.9% YTY
Jan-
05
Jul-0
5
Jan-
06
Jul-0
6
Jan-
07
Jul-0
7
Jan-
08
Jul-0
8
Jan-
09
Jul-0
9
Jan-
10
Jul-1
0
Jan-
11
Jul-1
1
Jan-
12
Jul-1
2
Jan-
13
Jul-1
3
Jan-
14
Jul-1
4
Jan-
15 -
100,000
200,000
300,000
400,000
500,000
600,000
700,000
*Sales are seasonally adjusted and annualized SERIES: Sales of Existing Single Family HomesSOURCE: CALIFORNIA ASSOCIATION OF REALTORS®
May-15:
423,360
May-14:
388,690
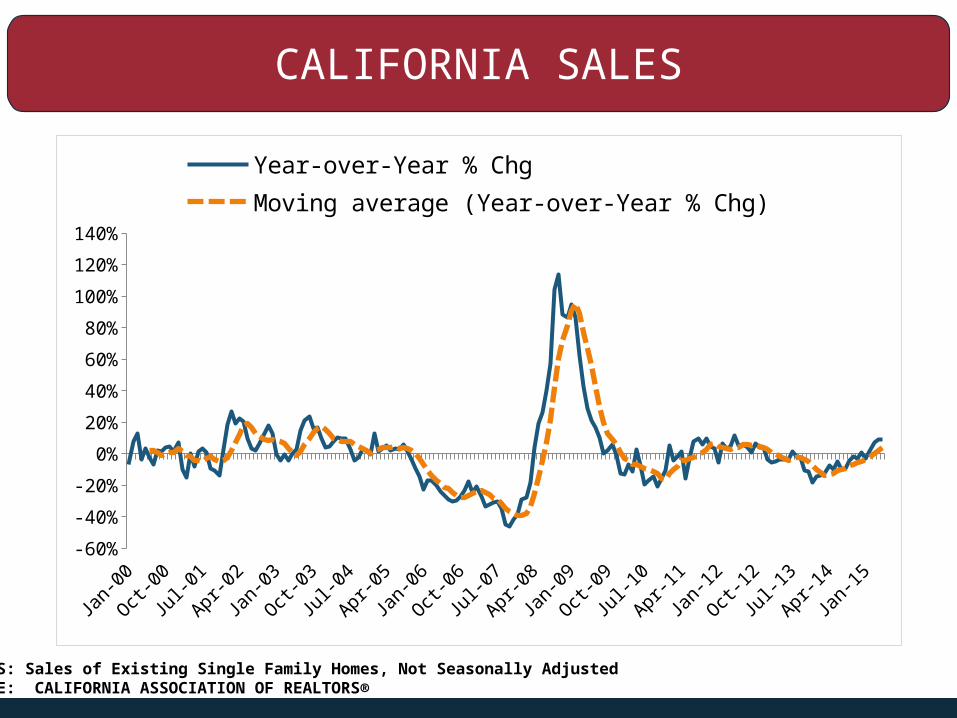
CALIFORNIA SALES
SERIES: Sales of Existing Single Family Homes, Not Seasonally AdjustedSOURCE: CALIFORNIA ASSOCIATION OF REALTORS®
Jan-
00
Sep-
00
May
-01
Jan-
02
Sep-
02
May
-03
Jan-
04
Sep-
04
May
-05
Jan-
06
Sep-
06
May
-07
Jan-
08
Sep-
08
May
-09
Jan-
10
Sep-
10
May
-11
Jan-
12
Sep-
12
May
-13
Jan-
14
Sep-
14
May
-15
-60%
-40%
-20%
0%
20%
40%
60%
80%
100%
120%
140%
Year-over-Year % ChgMoving average (Year-over-Year % Chg)
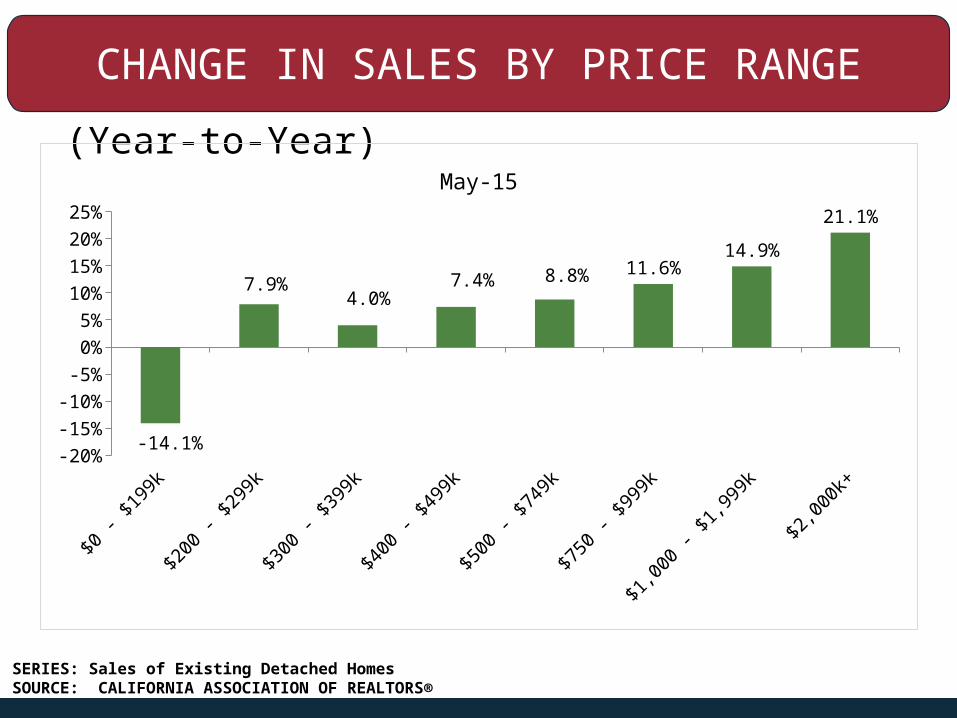
CHANGE IN SALES BY PRICE RANGE
(Year-to-Year)
$0 -
$199
k
$200
- $2
99k
$300
- $3
99k
$400
- $4
99k
$500
- $7
49k
$750
- $9
99k
$1,0
00 -
$1,9
99k
$2,0
00k+
-20%
-15%
-10%
-5%
0%
5%
10%
15%
20%
25%
-14.1%
7.9%4.0%
7.4% 8.8% 11.6%14.9%
21.1%
May-15
SERIES: Sales of Existing Detached HomesSOURCE: CALIFORNIA ASSOCIATION OF REALTORS®

SALES BY REGION(EXISTING SFH)
SERIES: Sales, Not Seasonally AdjustedSOURCE: CALIFORNIA ASSOCIATION OF REALTORS®
Jan-
13
Mar
-13
May
-13
Jul-1
3
Sep-
13
Nov-1
3
Jan-
14
Mar
-14
May
-14
Jul-1
4
Sep-
14
Nov-1
4
Jan-
15
Mar
-15
May
-15
-25%
-20%
-15%
-10%
-5%
0%
5%
10%
15%
20%
Bay Area Central Valley So CA
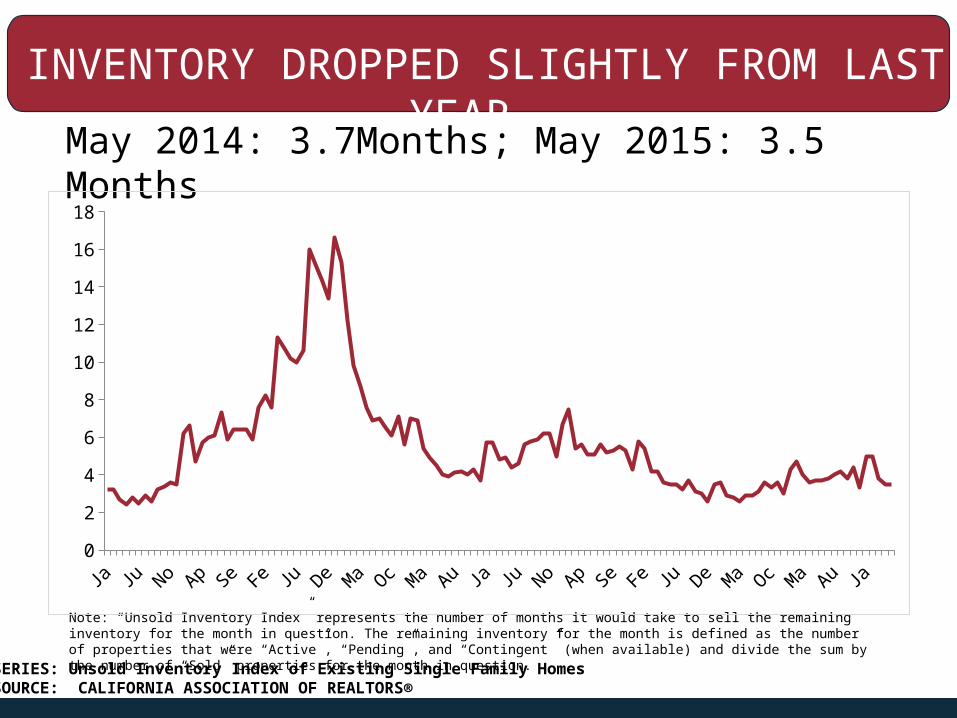
INVENTORY DROPPED SLIGHTLY FROM LAST YEAR
May 2014: 3.7Months; May 2015: 3.5 Months
Note: “Unsold Inventory Index” represents the number of months it would take to sell the remaining inventory for the month in question. The remaining inventory for the month is defined as the number of properties that were “Active”, “Pending”, and “Contingent” (when available) and divide the sum by the number of “Sold” properties for the month in question.
0
2
4
6
8
10
12
14
16
18
SERIES: Unsold Inventory Index of Existing Single Family HomesSOURCE: CALIFORNIA ASSOCIATION OF REALTORS®
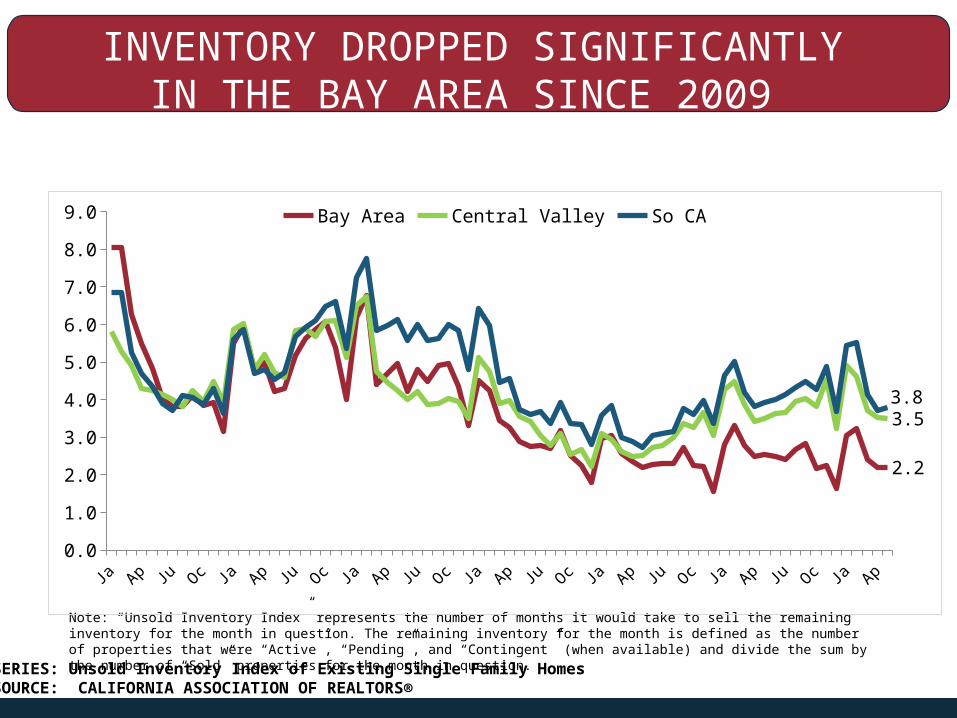
INVENTORY DROPPED SIGNIFICANTLY IN THE BAY AREA SINCE 2009
BUT REMAINED TIGHT
Note: “Unsold Inventory Index” represents the number of months it would take to sell the remaining inventory for the month in question. The remaining inventory for the month is defined as the number of properties that were “Active”, “Pending”, and “Contingent” (when available) and divide the sum by the number of “Sold” properties for the month in question.
Jan-09 Jul-09 Jan-10 Jul-10 Jan-11 Jul-11 Jan-12 Jul-12 Jan-13 Jul-13 Jan-14 Jul-14 Jan-150.0
1.0
2.0
3.0
4.0
5.0
6.0
7.0
8.0
9.0
2.2
3.53.8
Bay Area Central Valley So CA
SERIES: Unsold Inventory Index of Existing Single Family HomesSOURCE: CALIFORNIA ASSOCIATION OF REALTORS®

2015 HOMEOWNER SURVEYAbout the Home
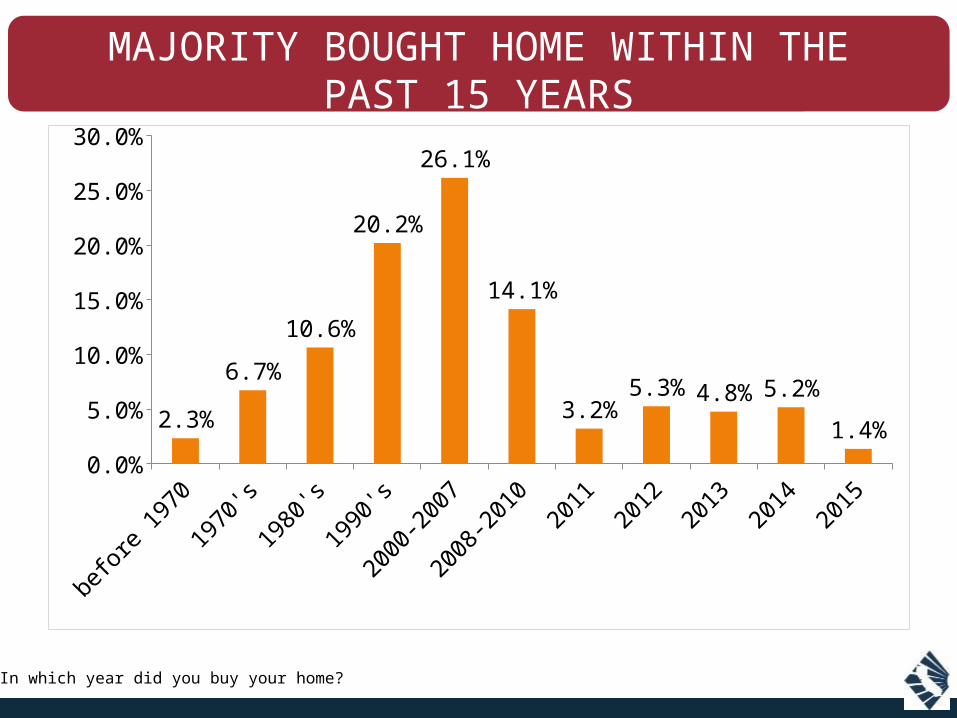
MAJORITY BOUGHT HOME WITHIN THE PAST 15 YEARS
be-fore 1970
1970's
1980's
1990's
2000-
2007
2008-
2010
2011 2012 2013 2014 20150.0%
5.0%
10.0%
15.0%
20.0%
25.0%
30.0%
2.3%
6.7%
10.6%
20.2%
26.1%
14.1%
3.2%5.3% 4.8% 5.2%
1.4%
Q. In which year did you buy your home?
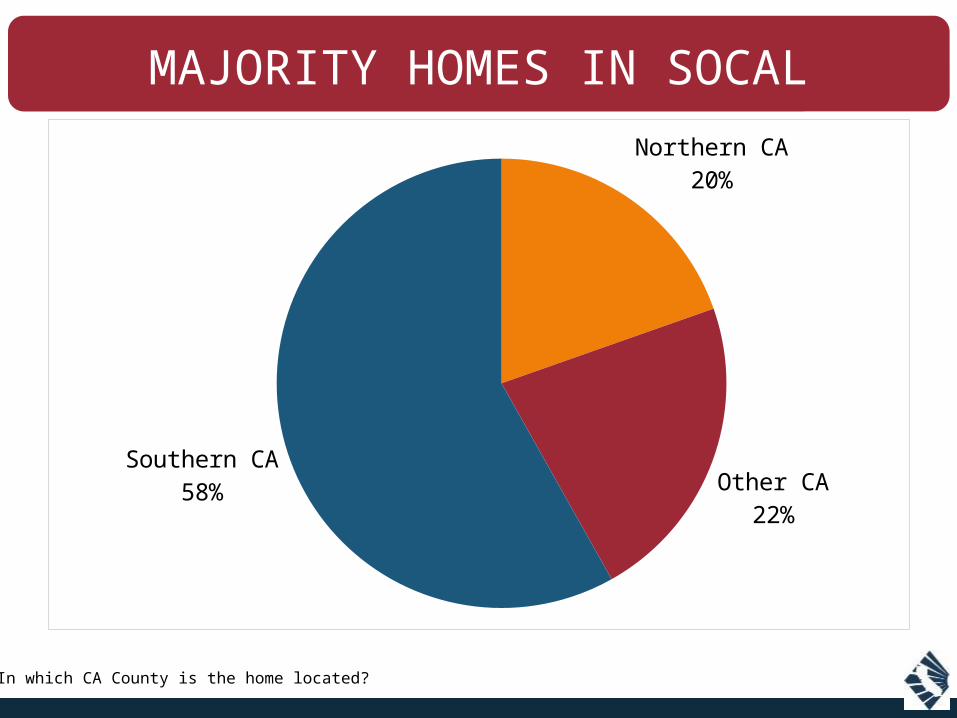
MAJORITY HOMES IN SOCAL
Q. In which CA County is the home located?
Northern CA 20%
Other CA 22%
Southern CA 58%
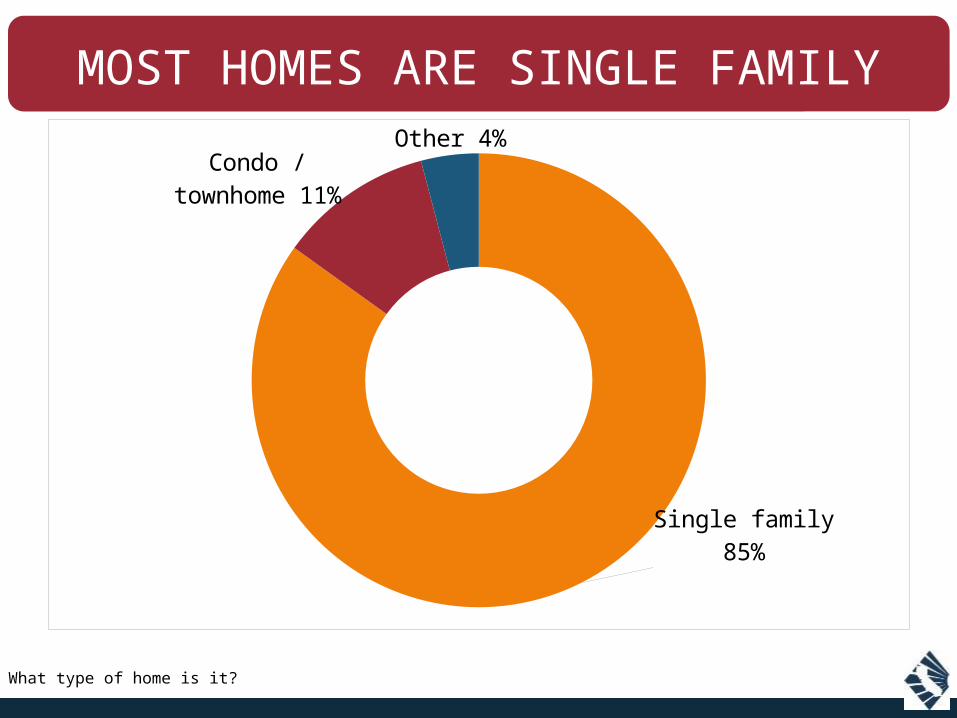
MOST HOMES ARE SINGLE FAMILY
Q. What type of home is it?
Single family 85%
Condo / townhome
11%
Other 4%
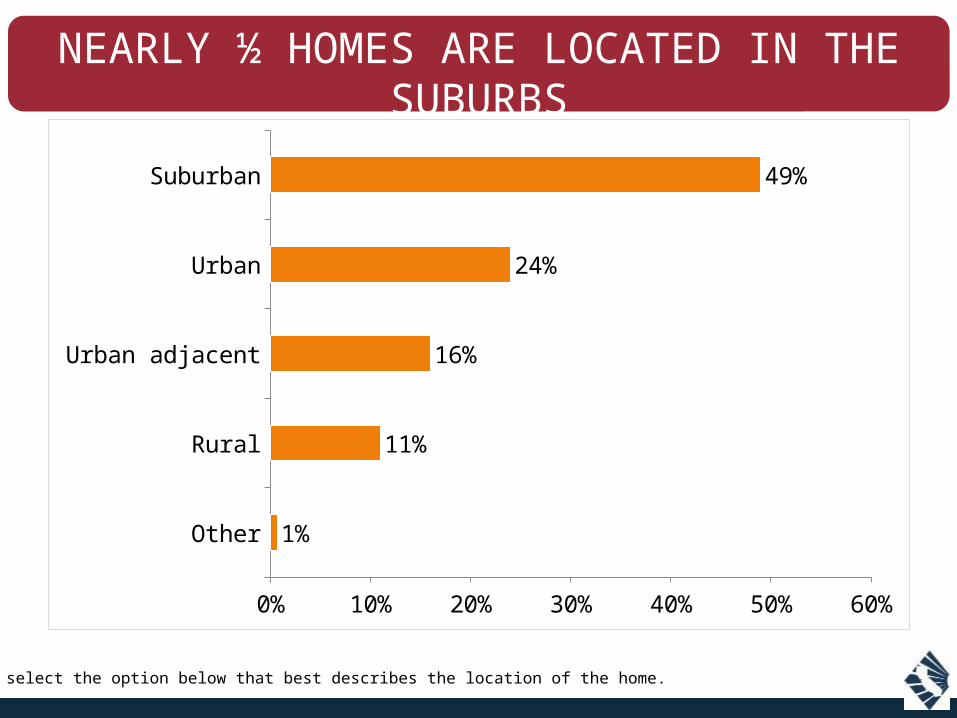
NEARLY ½ HOMES ARE LOCATED IN THE SUBURBS
Q. Please select the option below that best describes the location of the home.
Other
Rural
Urban adjacent
Urban
Suburban
0% 10% 20% 30% 40% 50% 60%
1%
11%
16%
24%
49%
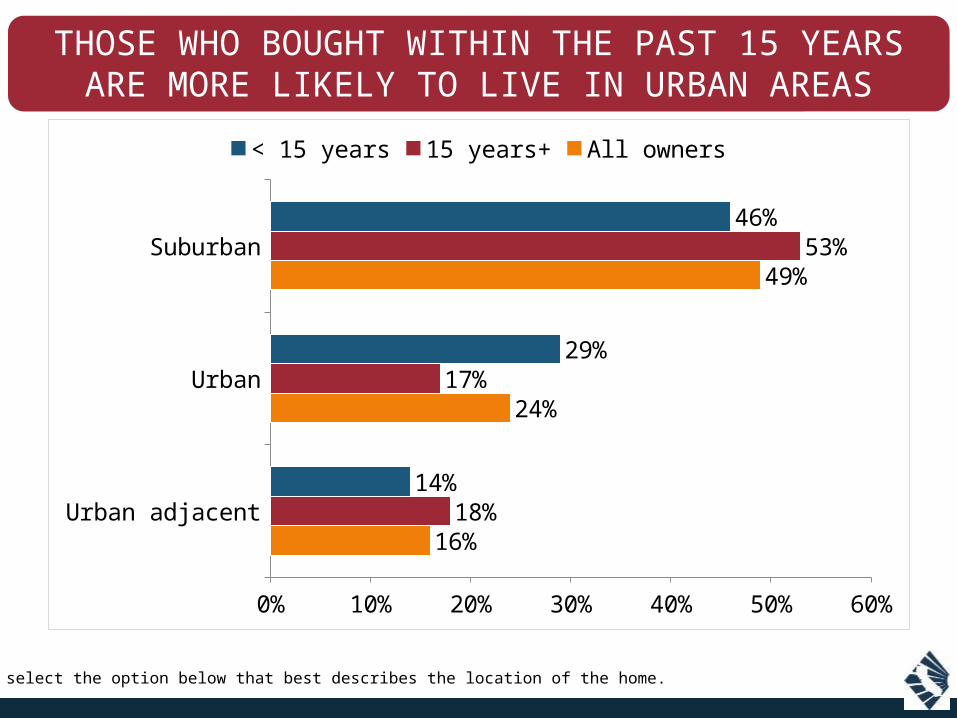
THOSE WHO BOUGHT WITHIN THE PAST 15 YEARS ARE MORE LIKELY TO LIVE IN URBAN AREAS
Q. Please select the option below that best describes the location of the home.
Urban adjacent
Urban
Suburban
0% 10% 20% 30% 40% 50% 60%
16%
24%
49%
18%
17%
53%
14%
29%
46%
< 15 years 15 years+ All owners
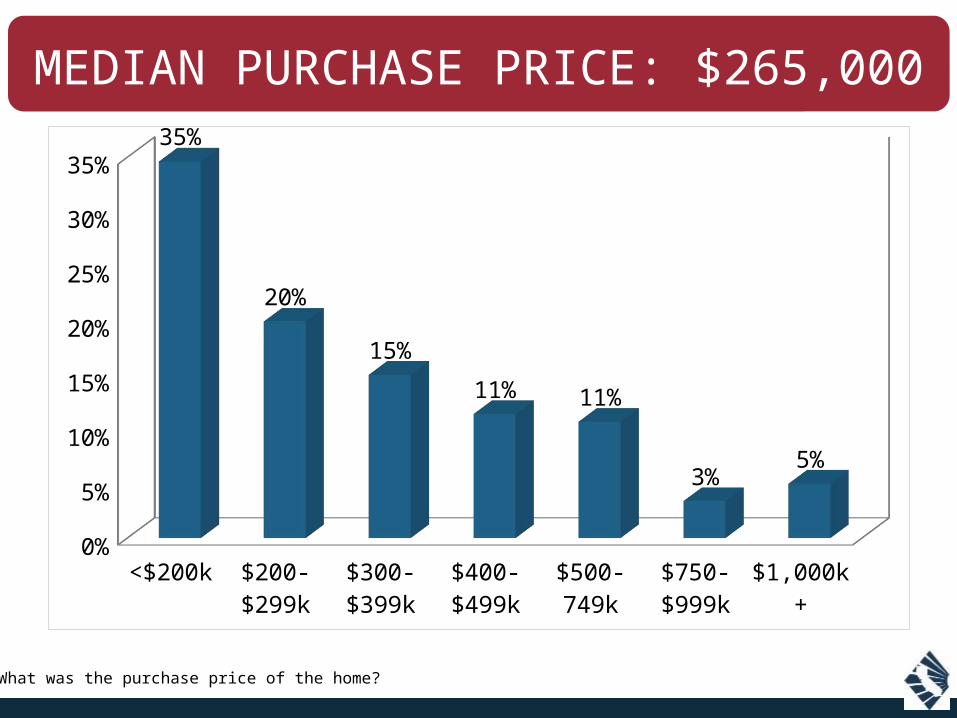
MEDIAN PURCHASE PRICE: $265,000
Q. What was the purchase price of the home?
<$200k $200-$299k
$300-$399k
$400-$499k
$500-749k
$750-$999k
$1,000k+
0%
5%
10%
15%
20%
25%
30%
35%35%
20%
15%
11% 11%
3%5%
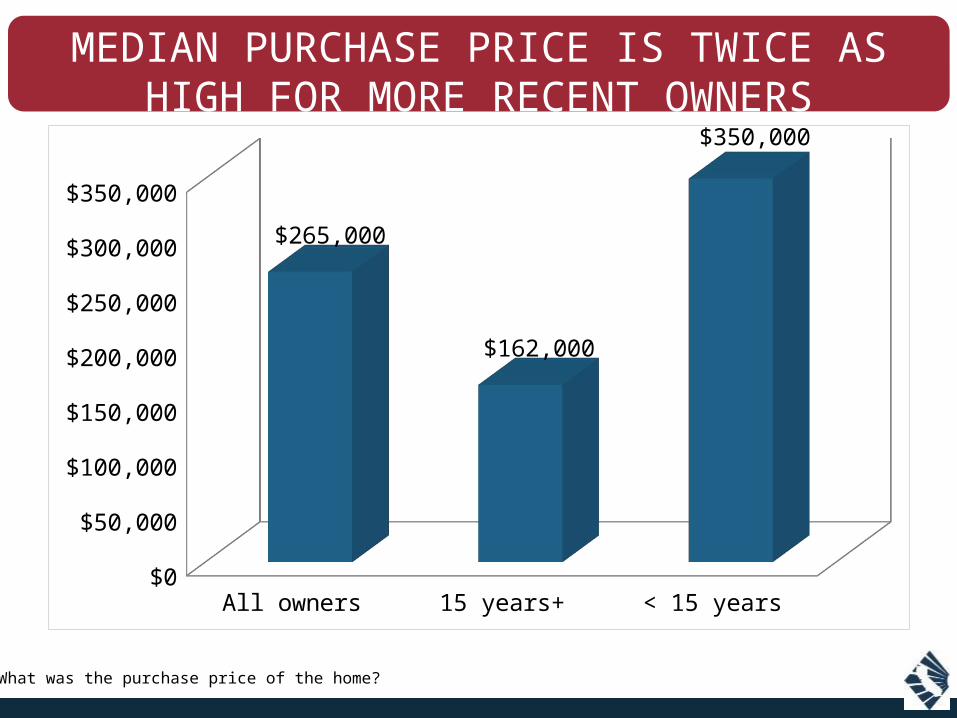
MEDIAN PURCHASE PRICE IS TWICE AS HIGH FOR MORE RECENT OWNERS
Q. What was the purchase price of the home?
All owners 15 years+ < 15 years$0
$50,000
$100,000
$150,000
$200,000
$250,000
$300,000
$350,000
$265,000
$162,000
$350,000

MEDIAN HOME VALUE SLIGHTLY HIGHER FOR THOSE WHO’VE OWNED LONGER
Q. What is the current value of your home?
All owners 15 years+ < 15 years$0
$50,000
$100,000
$150,000
$200,000
$250,000
$300,000
$350,000
$400,000
$450,000$425,000
$450,000
$400,000
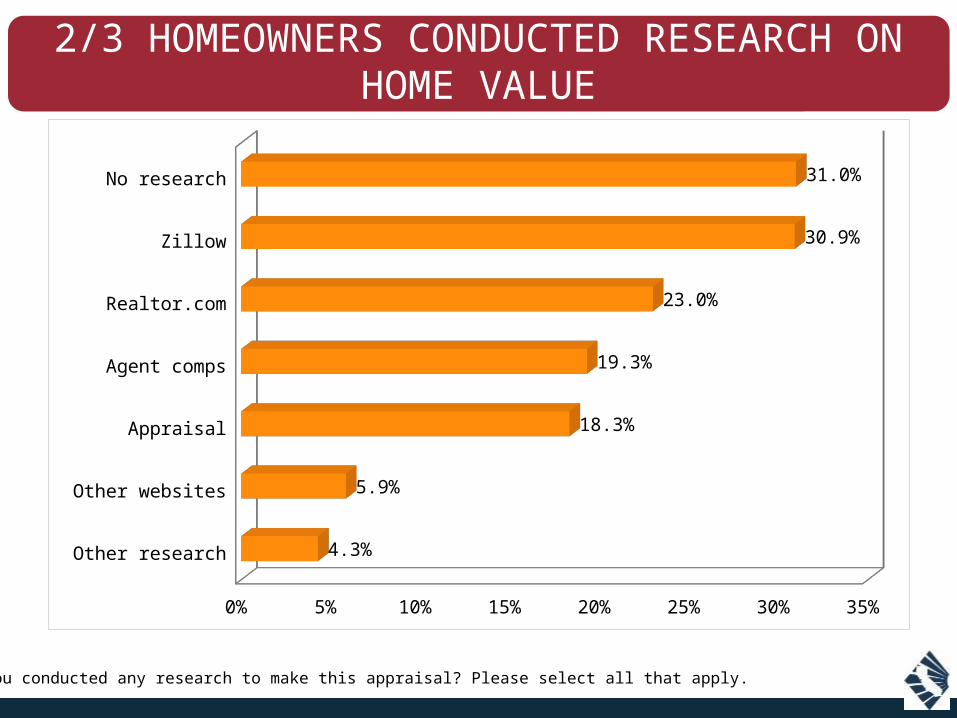
2/3 HOMEOWNERS CONDUCTED RESEARCH ON HOME VALUE
Q. Have you conducted any research to make this appraisal? Please select all that apply.
Other research
Other websites
Appraisal
Agent comps
Realtor.com
Zillow
No research
0% 5% 10% 15% 20% 25% 30% 35%
4.3%
5.9%
18.3%
19.3%
23.0%
30.9%
31.0%
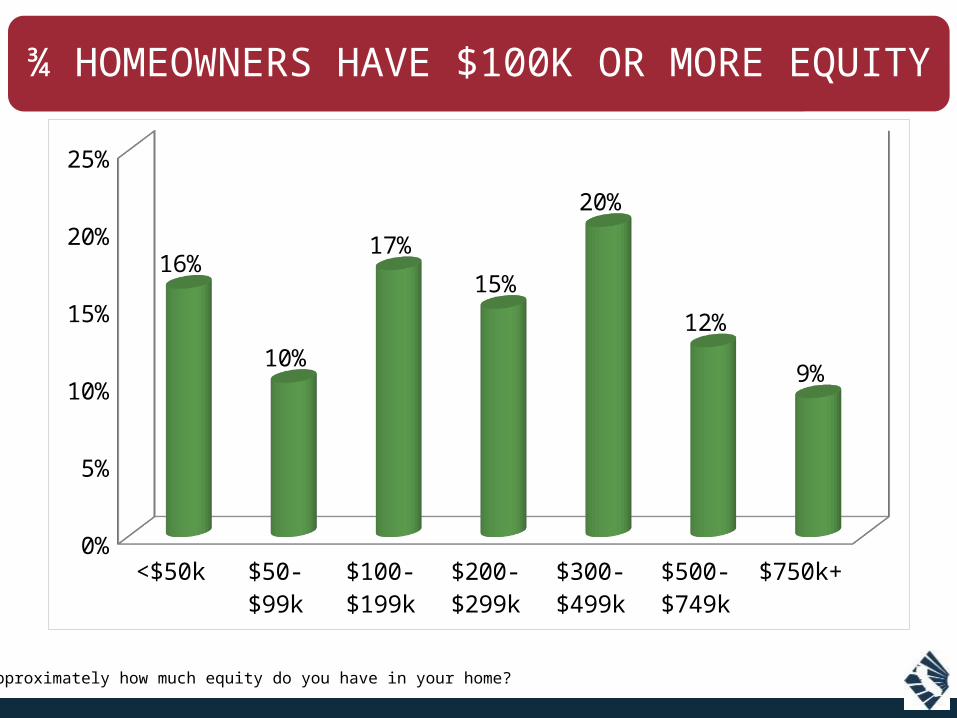
¾ HOMEOWNERS HAVE $100K OR MORE EQUITY
Q. Approximately how much equity do you have in your home?
<$50k $50-$99k
$100-$199k
$200-$299k
$300-$499k
$500-$749k
$750k+0%
5%
10%
15%
20%
25%
16%
10%
17%
15%
20%
12%
9%
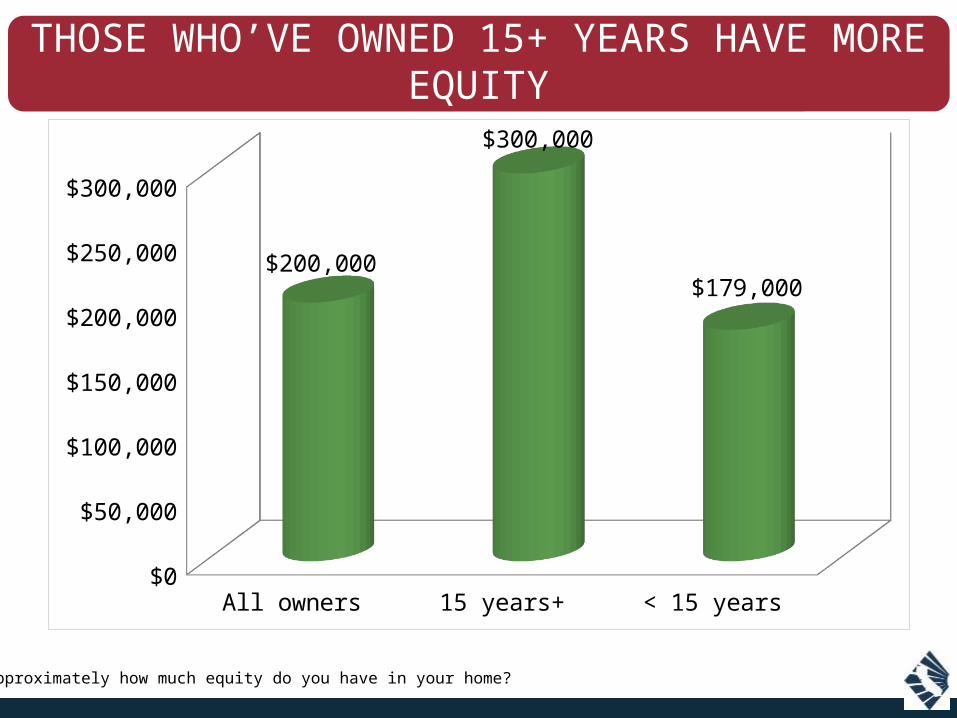
THOSE WHO’VE OWNED 15+ YEARS HAVE MORE EQUITY
Q. Approximately how much equity do you have in your home?
All owners 15 years+ < 15 years$0
$50,000
$100,000
$150,000
$200,000
$250,000
$300,000
$200,000
$300,000
$179,000
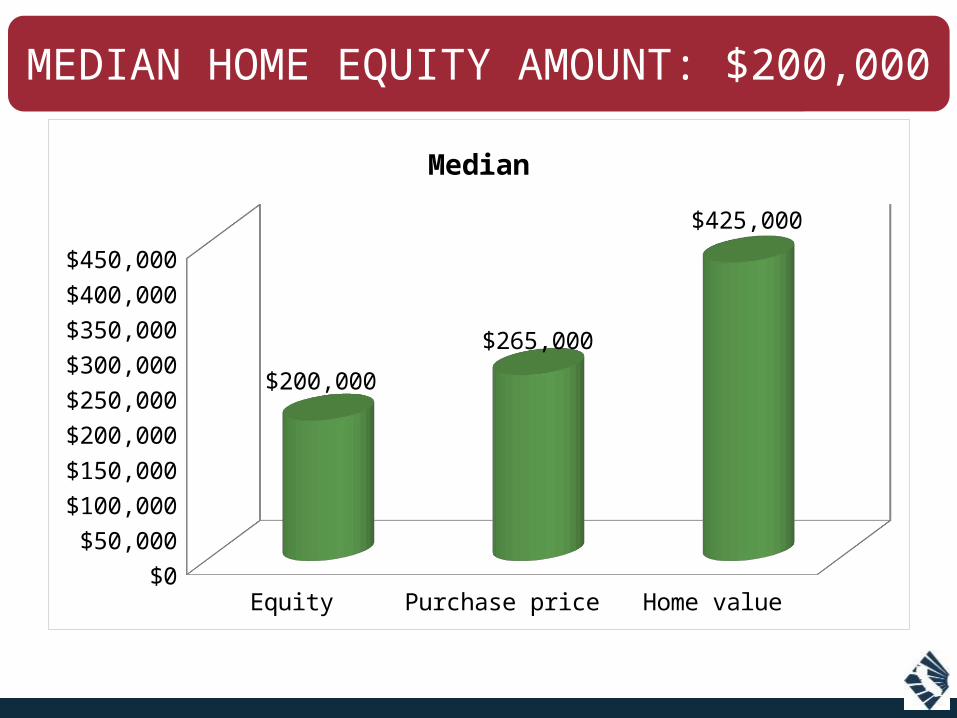
MEDIAN HOME EQUITY AMOUNT: $200,000
Equity Purchase price Home value$0
$50,000
$100,000
$150,000
$200,000
$250,000
$300,000
$350,000
$400,000
$450,000
$200,000
$265,000
$425,000
Median
FINANCING21
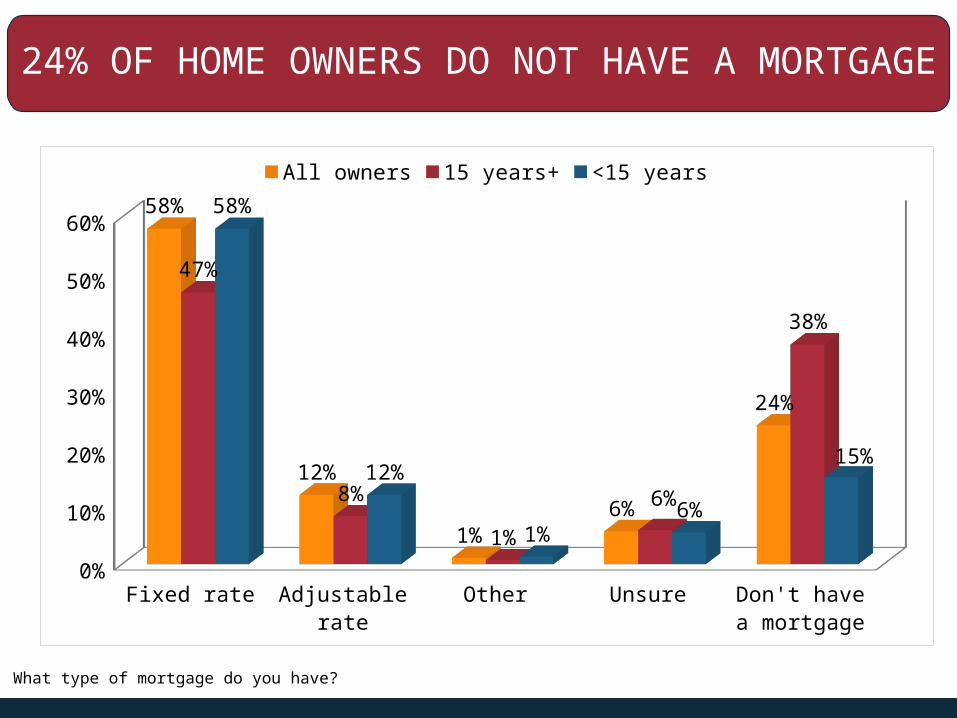
24% OF HOME OWNERS DO NOT HAVE A MORTGAGE
Q. What type of mortgage do you have?
Fixed rate Adjustable rate
Other Unsure Don't have a mortgage
0%
10%
20%
30%
40%
50%
60%58%
12%
1%6%
24%
47%
8%
1%
6%
38%
58%
12%
1%6%
15%
All owners 15 years+ <15 years
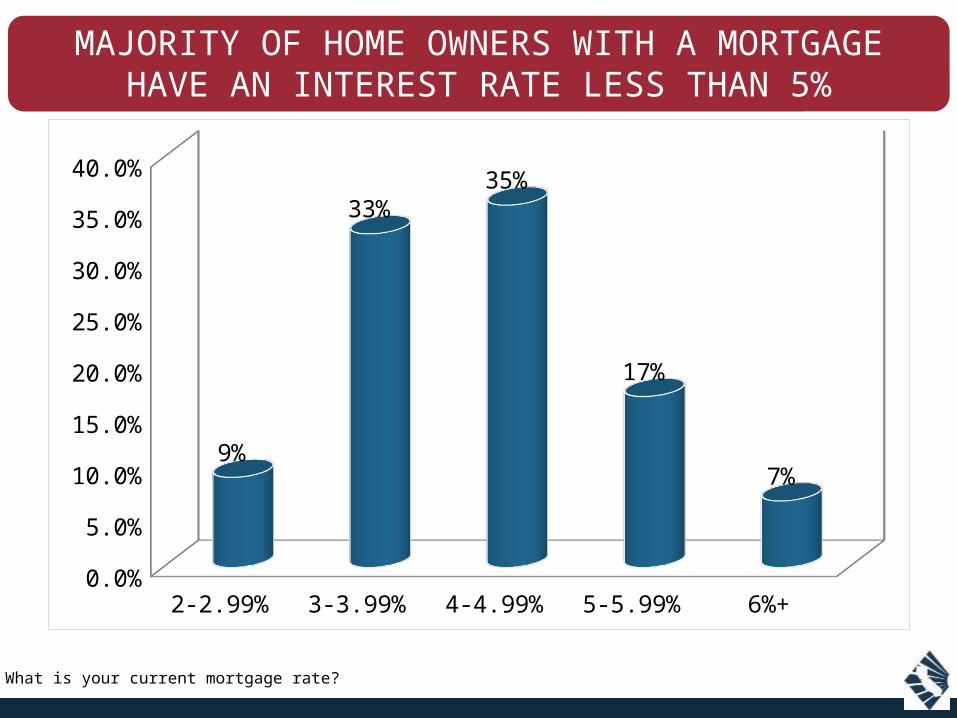
MAJORITY OF HOME OWNERS WITH A MORTGAGE HAVE AN INTEREST RATE LESS THAN 5%
2-2.99% 3-3.99% 4-4.99% 5-5.99% 6%+0.0%
5.0%
10.0%
15.0%
20.0%
25.0%
30.0%
35.0%
40.0%
9%
33%35%
17%
7%
Q. What is your current mortgage rate?
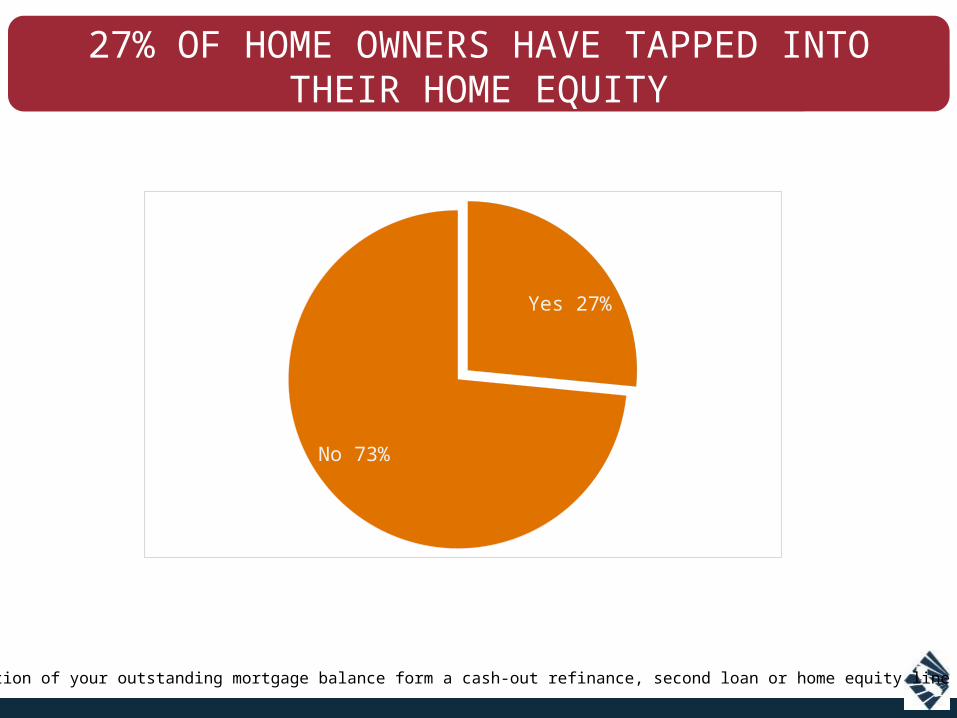
27% OF HOME OWNERS HAVE TAPPED INTO THEIR HOME EQUITY
Q. Is any portion of your outstanding mortgage balance form a cash-out refinance, second loan or home equity line of credit?
Yes 27%
No 73%

27% OF HOME OWNERS HAVE TAPPED INTO THEIR HOME EQUITY
Q. Is any portion of your outstanding mortgage balance form a cash-out refinance, second loan or home equity line of credit?
All owners
15 years+
<15 years
0% 5% 10% 15% 20% 25% 30% 35%
27%
32%
24%

WILL OWNERS SELL THEIR HOMES?
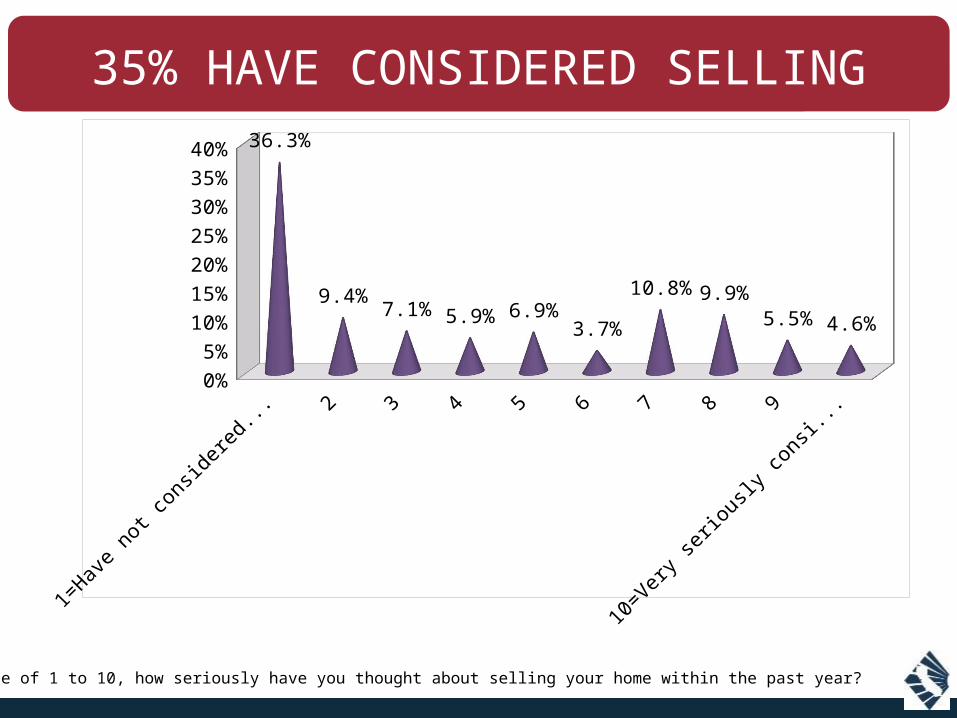
35% HAVE CONSIDERED SELLING
Q. On a scale of 1 to 10, how seriously have you thought about selling your home within the past year?
0%
5%
10%
15%
20%
25%
30%
35%
40% 36.3%
9.4%7.1% 5.9% 6.9%
3.7%
10.8% 9.9%5.5% 4.6%
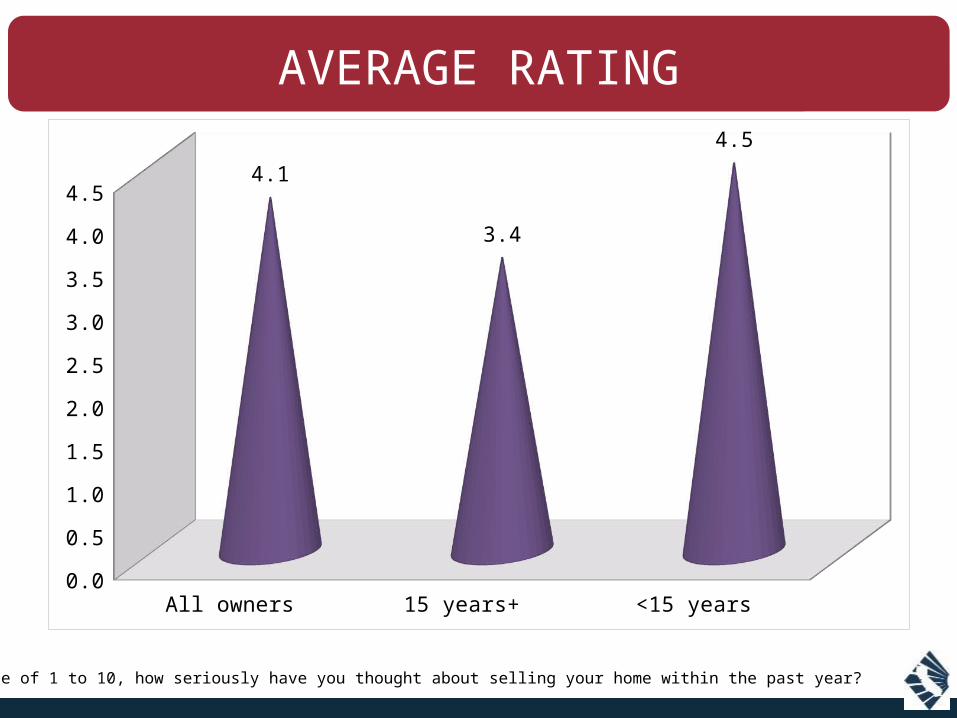
AVERAGE RATING
Q. On a scale of 1 to 10, how seriously have you thought about selling your home within the past year?
All owners 15 years+ <15 years0.0
0.5
1.0
1.5
2.0
2.5
3.0
3.5
4.0
4.54.1
3.4
4.5
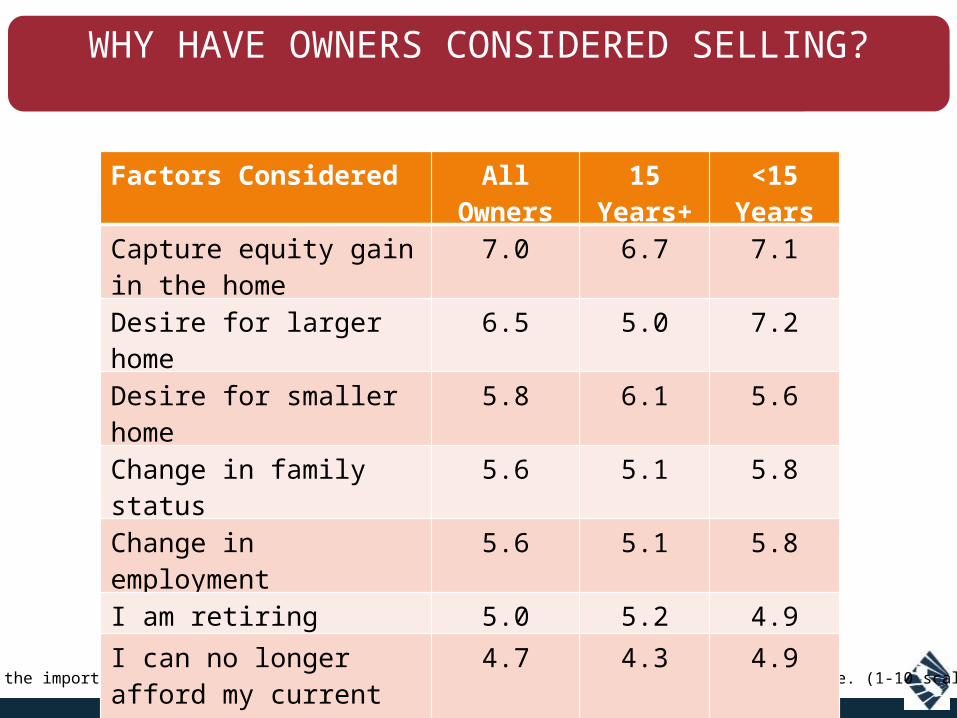
WHY HAVE OWNERS CONSIDERED SELLING?
Q. Please rate the importance of each of the following in your consideration to possibly sell your home. (1-10 scale)
Factors Considered All Owners
15 Years+
<15 Years
Capture equity gain in the home
7.0 6.7 7.1
Desire for larger home 6.5 5.0 7.2
Desire for smaller home
5.8 6.1 5.6
Change in family status
5.6 5.1 5.8
Change in employment
5.6 5.1 5.8
I am retiring 5.0 5.2 4.9
I can no longer afford my current home
4.7 4.3 4.9
Children left home 4.7 4.7 4.7
Children moved back in
4.2 3.6 4.4
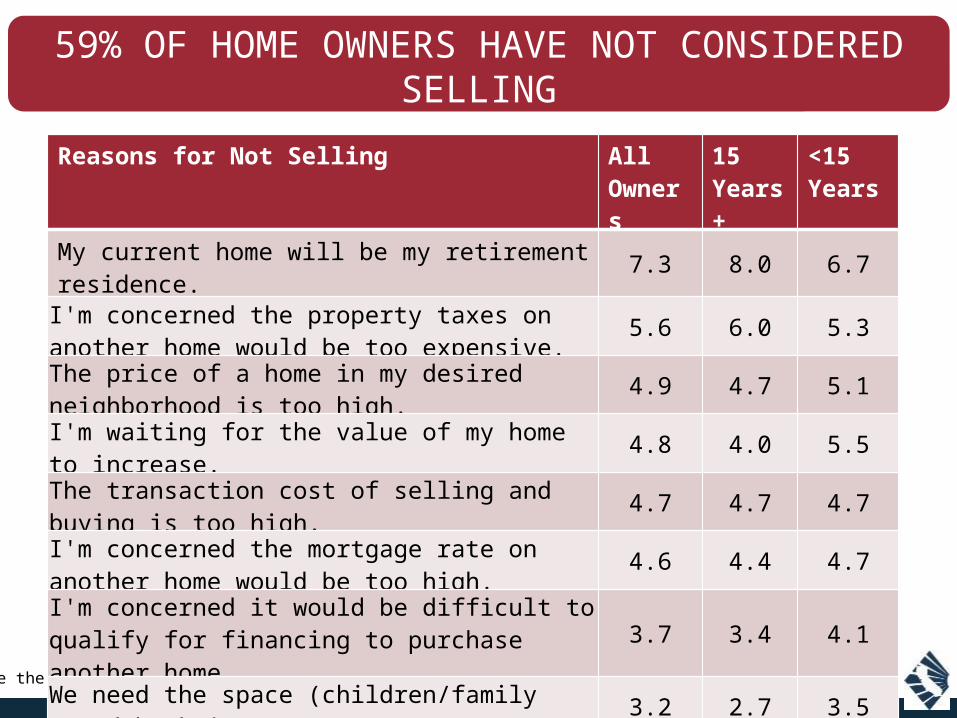
59% OF HOME OWNERS HAVE NOT CONSIDERED SELLING
Q. Please rate the importance of each of the following in your decision to not sell your home. (1-10 scale)
Reasons for Not Selling All Owners
15 Years+
<15 Years
My current home will be my retirement residence. 7.3 8.0 6.7
I'm concerned the property taxes on another home would be too expensive.
5.6 6.0 5.3
The price of a home in my desired neighborhood is too high.
4.9 4.7 5.1
I'm waiting for the value of my home to increase.
4.8 4.0 5.5
The transaction cost of selling and buying is too high.
4.7 4.7 4.7
I'm concerned the mortgage rate on another home would be too high.
4.6 4.4 4.7
I'm concerned it would be difficult to qualify for financing to purchase another home.
3.7 3.4 4.1
We need the space (children/family moved back in).
3.2 2.7 3.5
I have not been able to find another house to buy because listings are scarce.
3.0 2.7 3.3
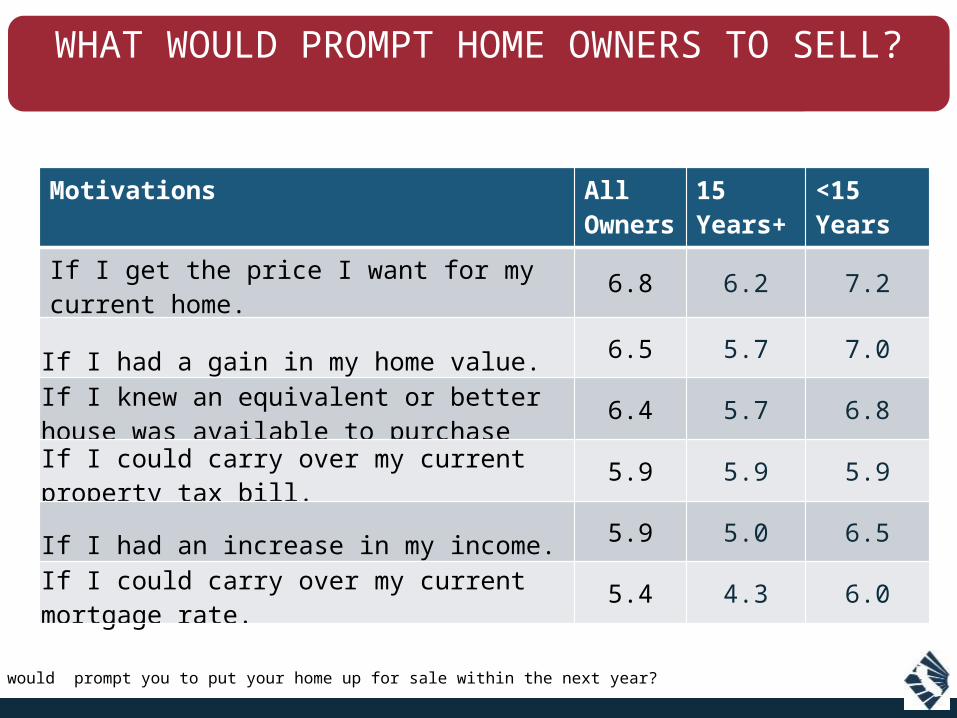
WHAT WOULD PROMPT HOME OWNERS TO SELL?
Q. What would prompt you to put your home up for sale within the next year?
Motivations All Owners
15 Years+
<15 Years
If I get the price I want for my current home. 6.8 6.2 7.2
If I had a gain in my home value.6.5 5.7 7.0
If I knew an equivalent or better house was available to purchase
6.4 5.7 6.8
If I could carry over my current property tax bill.
5.9 5.9 5.9
If I had an increase in my income.5.9 5.0 6.5
If I could carry over my current mortgage rate.
5.4 4.3 6.0
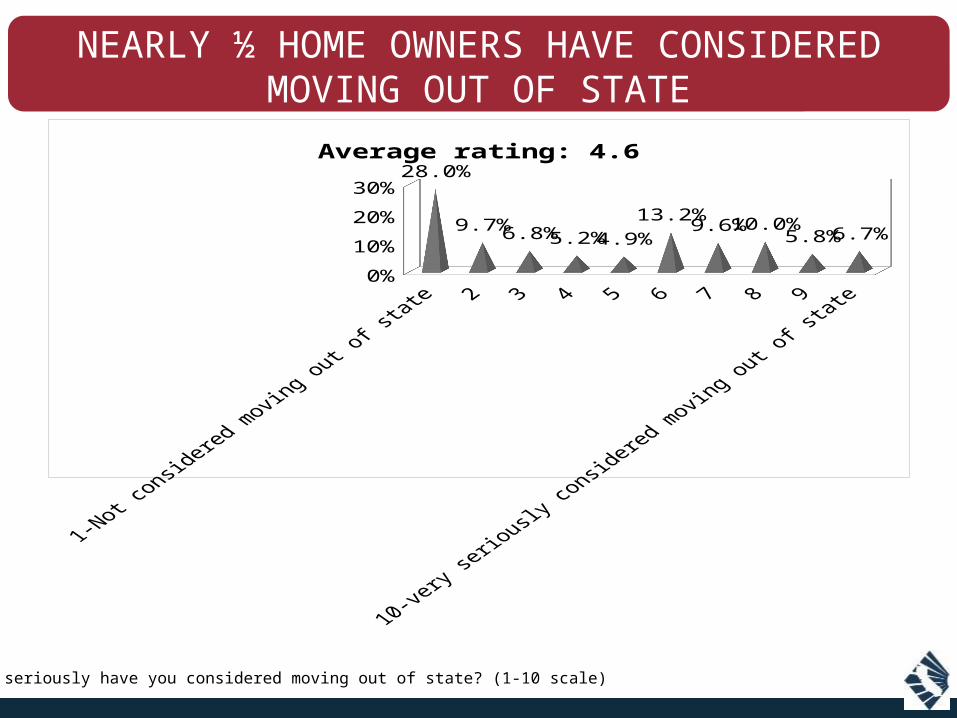
NEARLY ½ HOME OWNERS HAVE CONSIDERED MOVING OUT OF STATE
Q. How seriously have you considered moving out of state? (1-10 scale)
0%
10%
20%
30%28.0%
9.7%6.8%5.2%4.9%
13.2%9.6%10.0%
5.8%6.7%
Average rating: 4.6
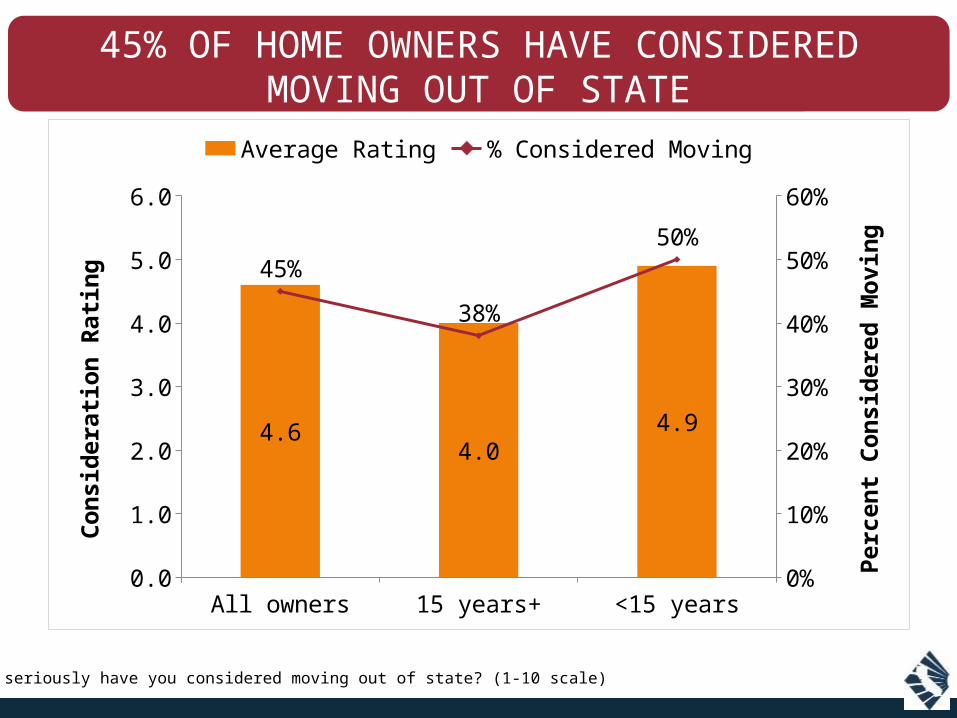
45% OF HOME OWNERS HAVE CONSIDERED MOVING OUT OF STATE
Q. How seriously have you considered moving out of state? (1-10 scale)
All owners 15 years+ <15 years0.0
1.0
2.0
3.0
4.0
5.0
6.0
0%
10%
20%
30%
40%
50%
60%
4.64.0
4.9
45%
38%
50%
Average Rating % Considered Moving
Con
sid
era
tion
Rati
ng
Perc
en
t C
on
sid
ere
d M
ovin
g
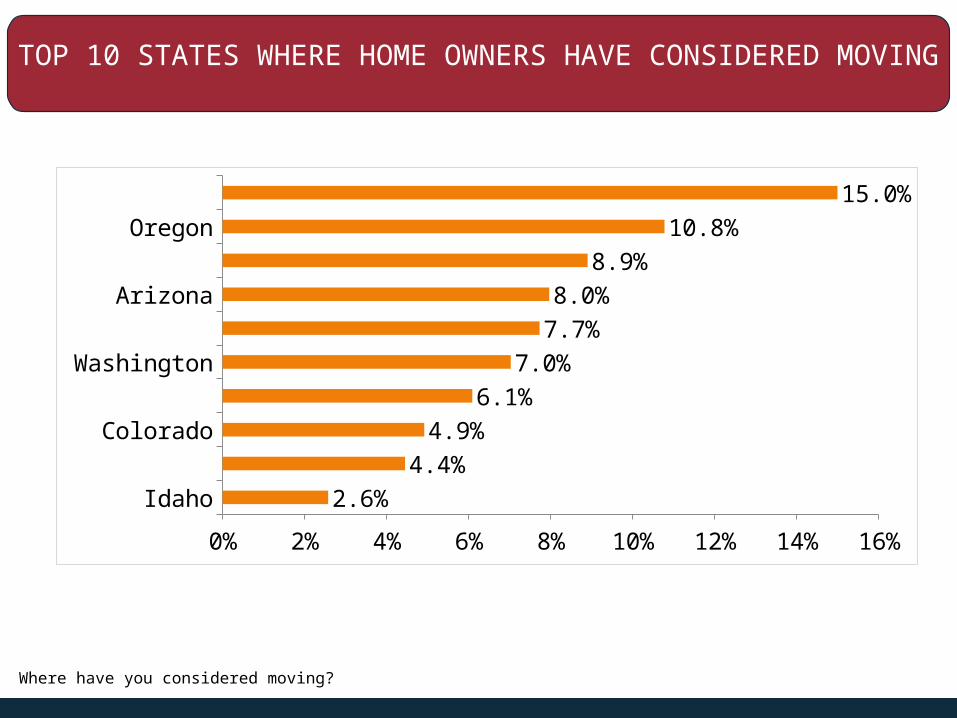
TOP 10 STATES WHERE HOME OWNERS HAVE CONSIDERED MOVING
IdahoHawaii
ColoradoFlorida
WashingtonNevadaArizona
New YorkOregon
Texas
0% 2% 4% 6% 8% 10% 12% 14% 16%
2.6%4.4%
4.9%6.1%
7.0%7.7%8.0%
8.9%10.8%
15.0%
Q. Where have you considered moving?

DEMOGRAPHICS
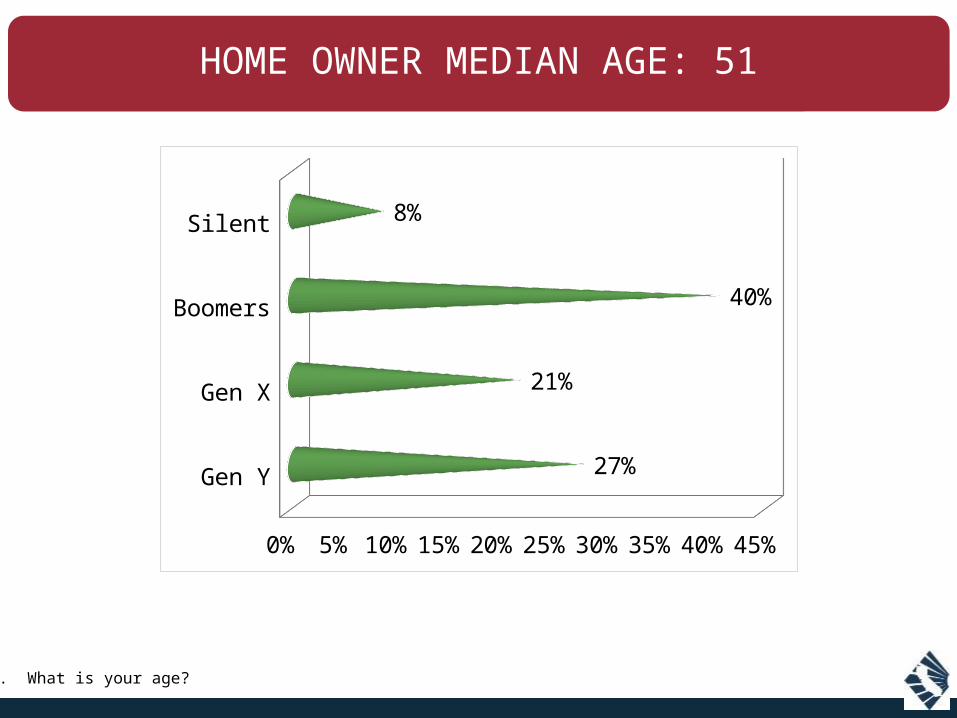
HOME OWNER MEDIAN AGE: 51
Q. What is your age?
Gen Y
Gen X
Boomers
Silent
0% 10% 20% 30% 40% 50%
27%
21%
40%
8%
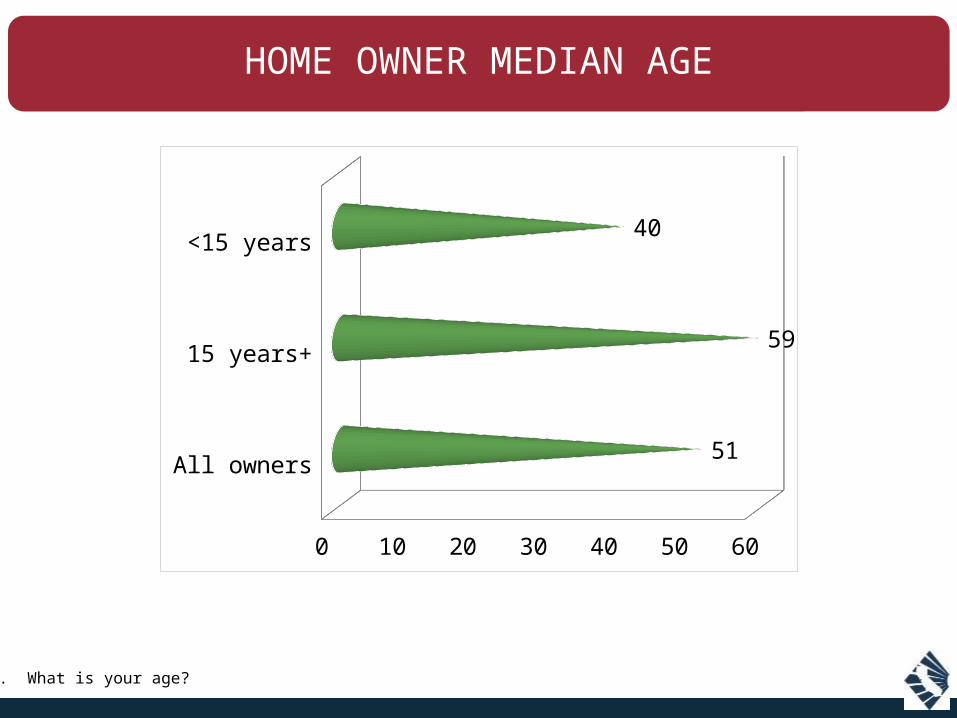
HOME OWNER MEDIAN AGE
Q. What is your age?
All owners
15 years+
<15 years
0 10 20 30 40 50 60
51
59
40
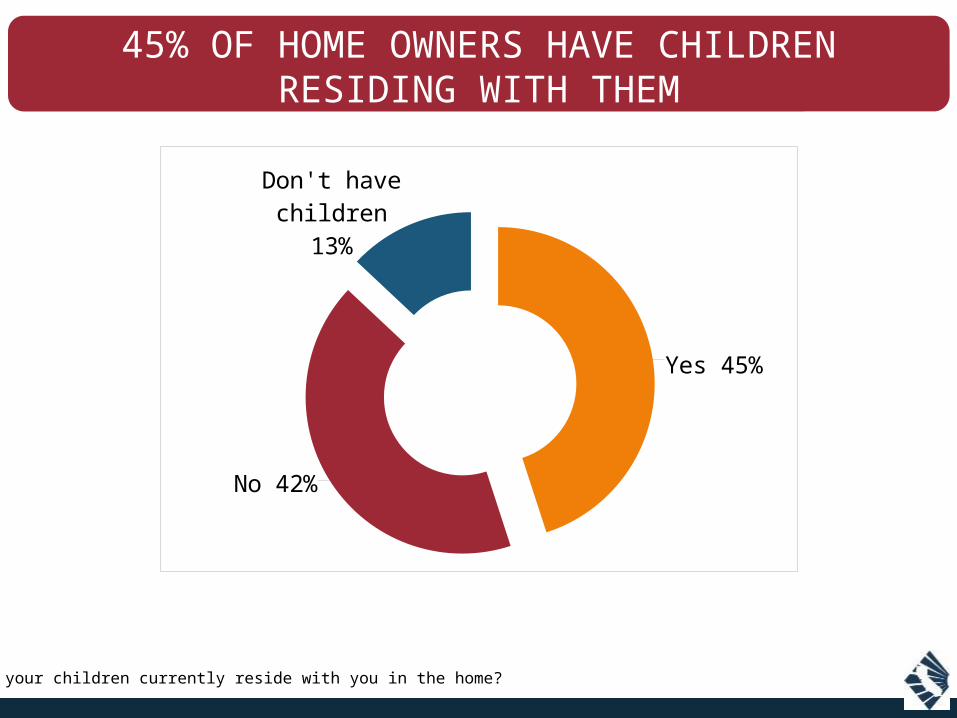
45% OF HOME OWNERS HAVE CHILDREN RESIDING WITH THEM
Q. Do your children currently reside with you in the home?
Yes 45%
No 42%
Don't have children
13%
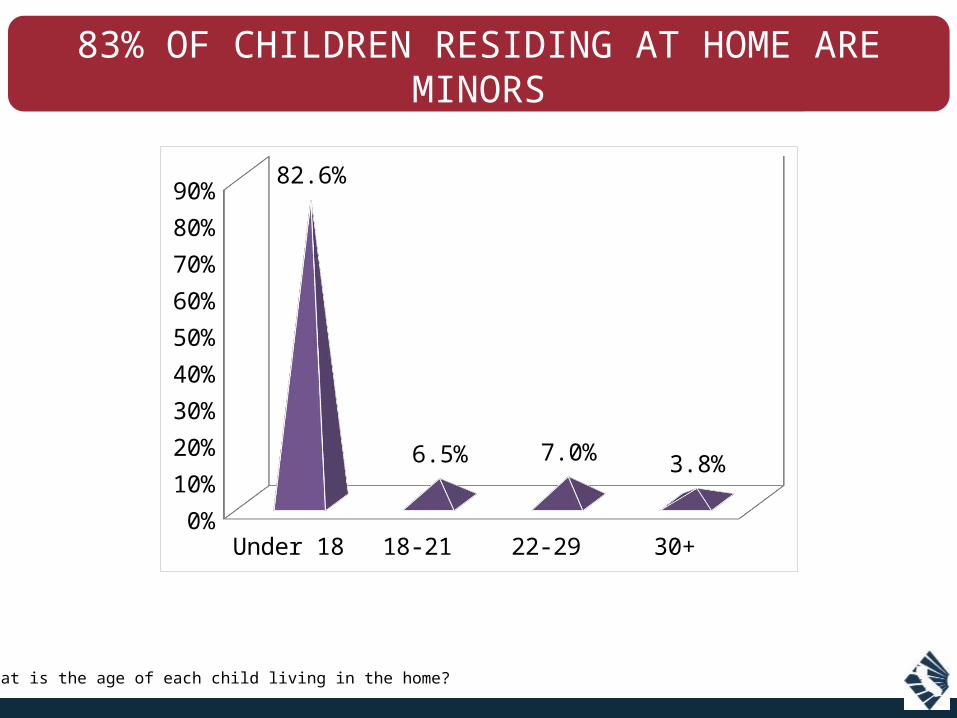
83% OF CHILDREN RESIDING AT HOME ARE MINORS
Q. What is the age of each child living in the home?
Under 18 18-21 22-29 30+0%
10%
20%
30%
40%
50%
60%
70%
80%
90% 82.6%
6.5% 7.0% 3.8%
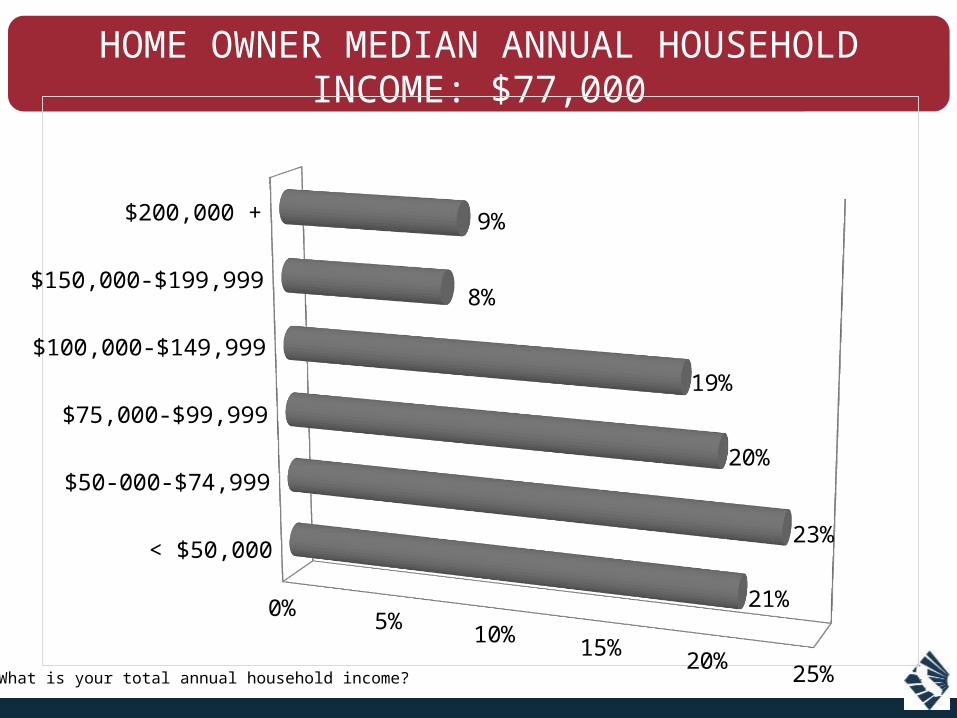
HOME OWNER MEDIAN ANNUAL HOUSEHOLD INCOME: $77,000
Q. What is your total annual household income?
< $50,000
$50-000-$74,999
$75,000-$99,999
$100,000-$149,999
$150,000-$199,999
$200,000 +
0% 5% 10% 15% 20% 25%
21%
23%
20%
19%
8%
9%
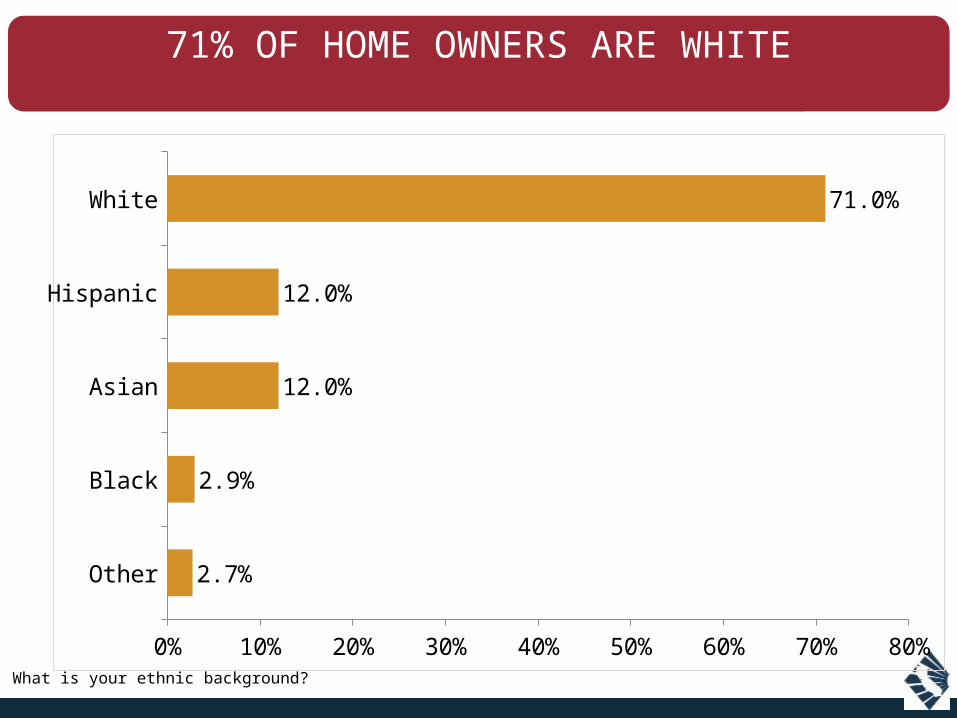
71% OF HOME OWNERS ARE WHITE
Q. What is your ethnic background?
Other
Black
Asian
Hispanic
White
0% 10% 20% 30% 40% 50% 60% 70% 80%
2.7%
2.9%
12.0%
12.0%
71.0%

THANK [email protected]

California Housing Market Outlook
Thursday, July 30, 20152:00 PM – 2:30 PM
To register: WWW.
CAR.ORG/MARKETDATA/VIDEOS
JOIN US FOR OUR NEXT WEBINAR…

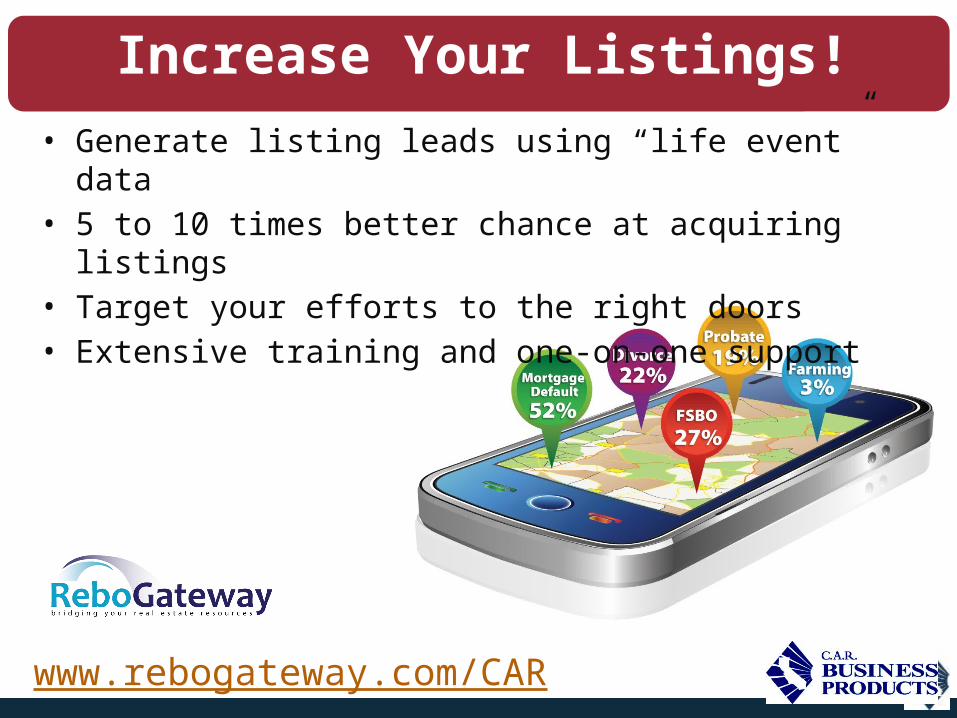
www.rebogateway.com/CAR
Increase Your Listings!• Generate listing leads using “life event” data• 5 to 10 times better chance at acquiring listings• Target your efforts to the right doors• Extensive training and one-on-one support