Embed Size (px)
Citation preview
53
Australian Meteorological and Oceanographic Journal 61 (2011) 53–63
The tropical circulation in the Australian and Asian region -
May to October 2010
(Manuscript received February 2011)
Hakeem Shaik and Joel LisonbeeNorthern Territory Regional Office, Bureau of Meteorology, Darwin, Australia
A summary of the broadscale tropical circulation from 70º E to 180º, for the six months May to October 2010, is presented. During this period the El Niño/La Niña-Southern Oscillation (ENSO) state shifted gradually from neutral condi-tions to La Niña conditions by July 2010. The Southern Oscillation Index (SOI) remained mostly above +10 during the season and reached a peak value of +25 in September. The mean SOI for the season was +15.8. Above average convec-tion persisted throughout the season south of the equator between 90°E and 140°E and the South Pacific Convergence Zone (SPCZ). Mostly weak mean sea-level pressure (MSLP) anomalies persisted in the Darwin Regional Specialised Meteorological Centre (RSMC) analysis area except over parts of Australia, where it remained higher than normal. Easterlies in the tropical western Pa-cific remained stronger than normal. Sea Surface Temperatures in the tropical western Pacific gradually shifted from a warm to cooler pattern during the sea-son and in the tropical Indian Ocean were warmer than their long-term mean. Weak active convective phases of the Madden-Julian Oscillation (MJO) were observed in the the beginning of each month during the season with a periodic-ity of 30 to 35 days. However, it was difficult to analyse the eastward propaga-tion of the MJO signal mainly due to the developing La Niña conditions. A total of sixteen tropical cyclones (including eight typhoons/severe cyclones) were analysed during the period, less than the mean of 30 for the Darwin RSMC analysis area.
Introduction
This summary reviews the broad-scale tropical circulation in the Australian and Asian region during the period May-October 2010. The area covered is the Darwin Regional Specialised Meteorological Centre (RSMC) analysis domain, which covers 70º E to 180º, 40º N to 40º S. Previous seasons have been described in earlier summaries of this series by Shaik (2010, 2009a, 2009b) and Shaik and Cleland (2008a, 2008b). The first section of this summary uses mostly six-month average charts to describe the broadscale seasonal circulation and anomalies. Intraseasonal and tropical circulation features are presented in the second section. The third section briefly describes the occurrence of tropical cyclones (TCs) in the six-month period. Data sources used in this study are detailed in the appendix.
Broadscale seasonal features
The El Niño-Southern Oscillation (ENSO) signal during the season indicated a shift from an El Niño state to La Niña-like conditions by July 2010. Weak to moderate El Niño conditions prevailed during the previous November 2009 – April 2010 season (Shaik 2010). By May 2010, the El Niño conditions in the Eastern Pacific had begun to transition from El Niño to neutral conditions. The change continued throughout the ensuing months and clear La Niña conditions were established by August 2010. In the recent past, mostly neutral ENSO conditions persisted during the period May 2008 to May 2009 (Shaik 2009b and 2009a). La Niña conditions were developed from a neutral state during the May to October 2007 season and persisted until April 2008 (Shaik and Cleland 2008a, 2008b).
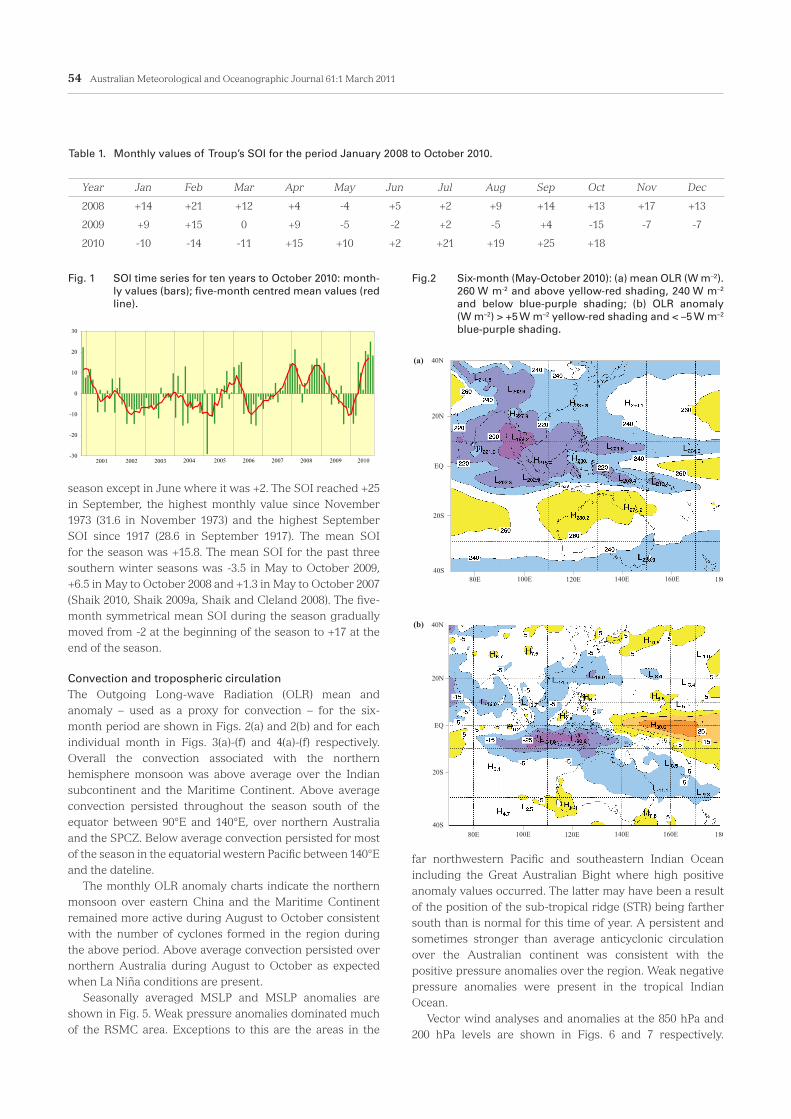
Southern OscillationFigure 1 shows the ten-year behaviour of Troup’s SOI from November 2000 and its symmetrical five-month running mean. Monthly values of the SOI from January 2008 are given in Table 1. The monthly SOI remained above +10 during the
Corresponding author address: Dr Shaik Hakeem, Bureau of Meteorology, GPO Box 40050, Casuarina, NT 0811, [email protected]
54 Australian Meteorological and Oceanographic Journal 61:1 March 2011
season except in June where it was +2. The SOI reached +25 in September, the highest monthly value since November 1973 (31.6 in November 1973) and the highest September SOI since 1917 (28.6 in September 1917). The mean SOI for the season was +15.8. The mean SOI for the past three southern winter seasons was -3.5 in May to October 2009, +6.5 in May to October 2008 and +1.3 in May to October 2007 (Shaik 2010, Shaik 2009a, Shaik and Cleland 2008). The five-month symmetrical mean SOI during the season gradually moved from -2 at the beginning of the season to +17 at the end of the season.
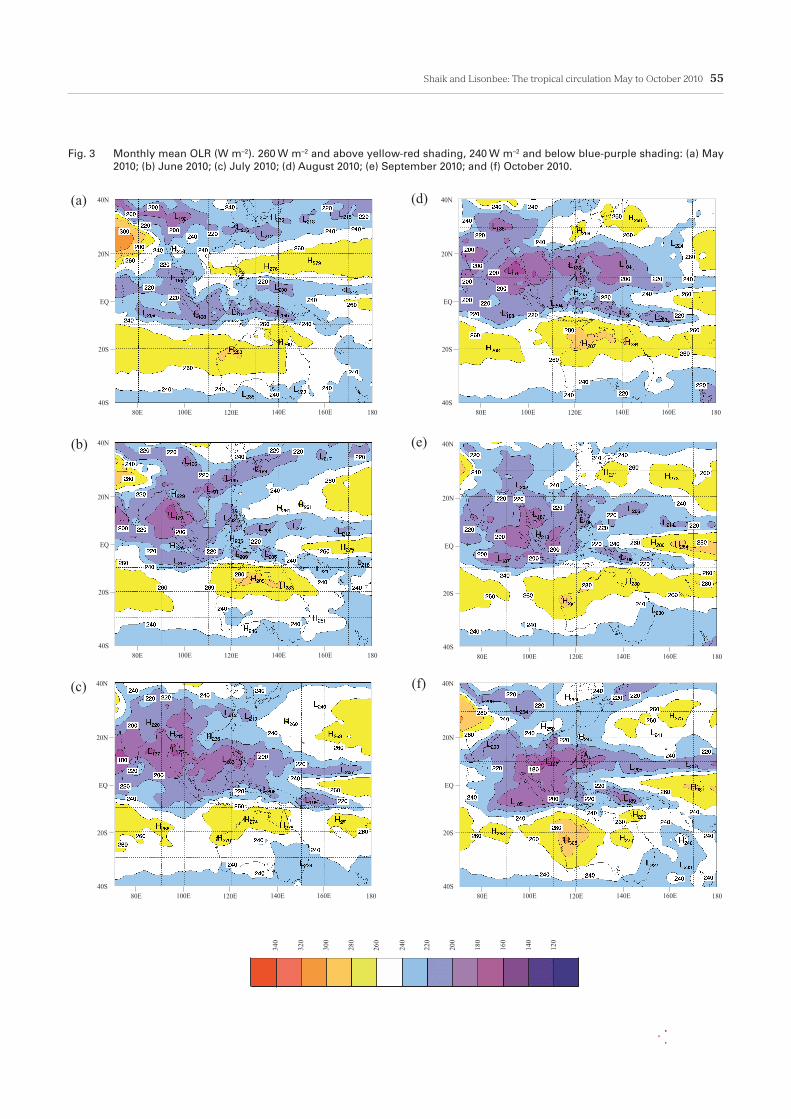
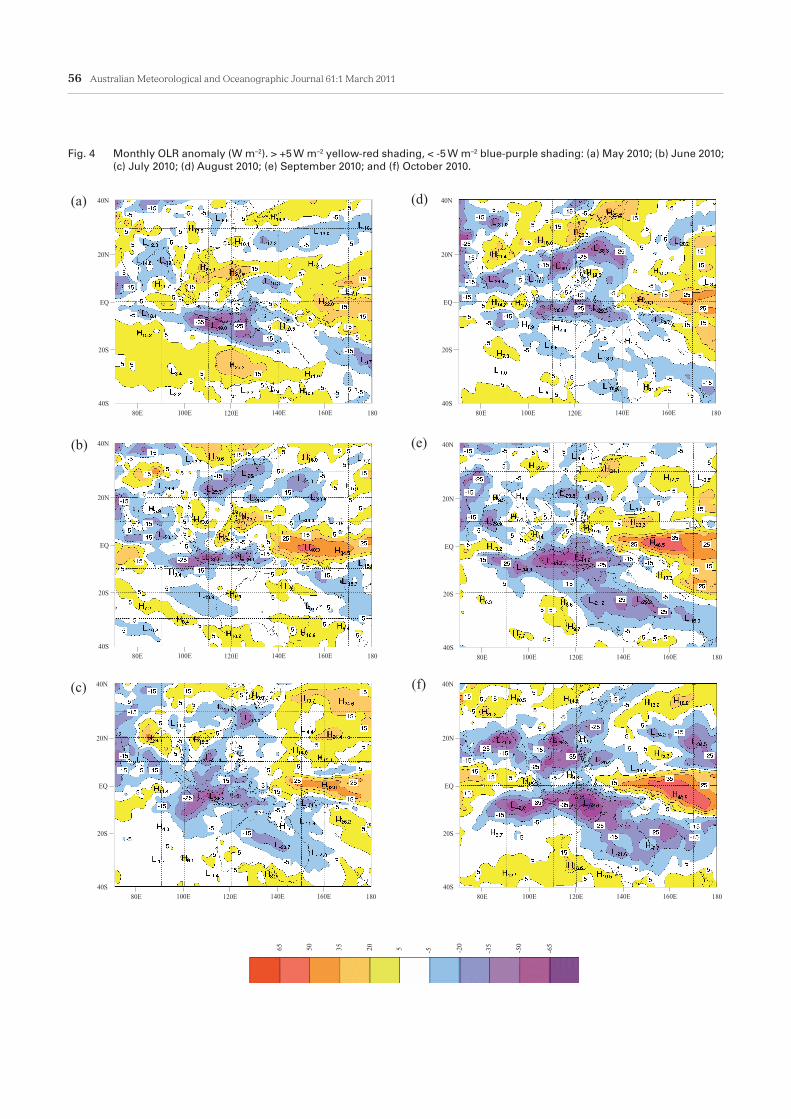
Convection and tropospheric circulationThe Outgoing Long-wave Radiation (OLR) mean and anomaly – used as a proxy for convection – for the six-month period are shown in Figs. 2(a) and 2(b) and for each individual month in Figs. 3(a)-(f) and 4(a)-(f) respectively. Overall the convection associated with the northern hemisphere monsoon was above average over the Indian subcontinent and the Maritime Continent. Above average convection persisted throughout the season south of the equator between 90°E and 140°E, over northern Australia and the SPCZ. Below average convection persisted for most of the season in the equatorial western Pacific between 140°E and the dateline. The monthly OLR anomaly charts indicate the northern monsoon over eastern China and the Maritime Continent remained more active during August to October consistent with the number of cyclones formed in the region during the above period. Above average convection persisted over northern Australia during August to October as expected when La Niña conditions are present. Seasonally averaged MSLP and MSLP anomalies are shown in Fig. 5. Weak pressure anomalies dominated much of the RSMC area. Exceptions to this are the areas in the
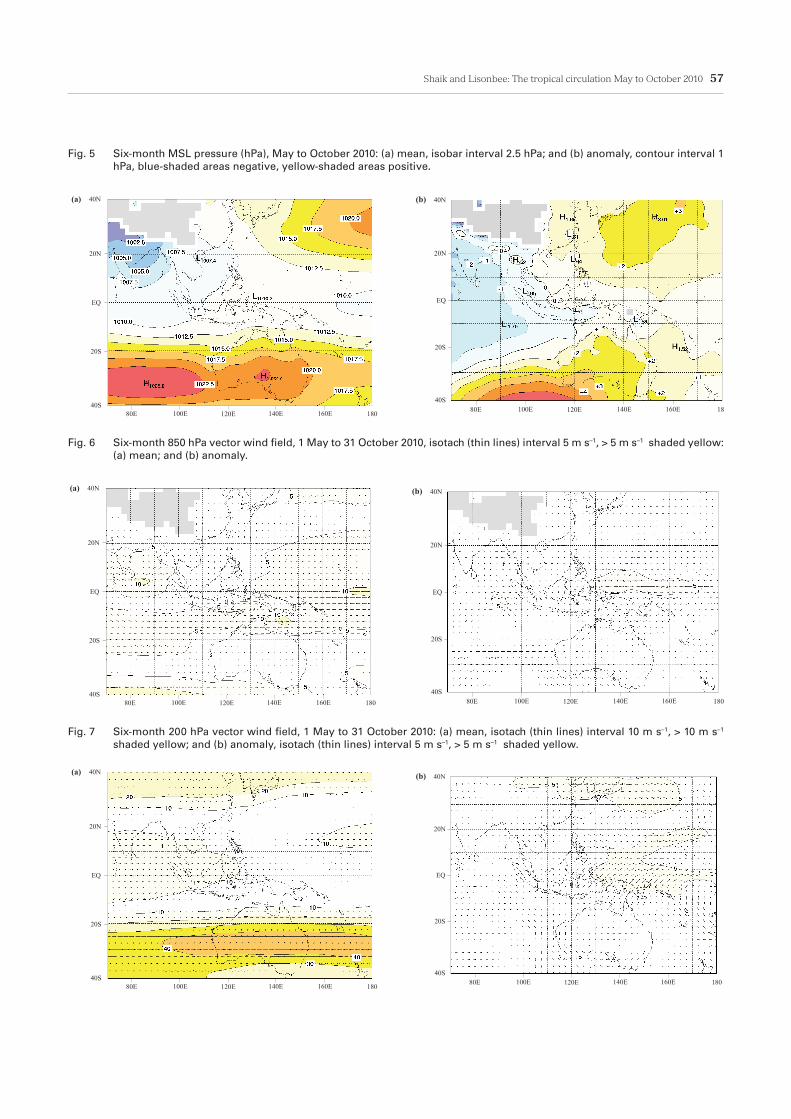
far northwestern Pacific and southeastern Indian Ocean including the Great Australian Bight where high positive anomaly values occurred. The latter may have been a result of the position of the sub-tropical ridge (STR) being farther south than is normal for this time of year. A persistent and sometimes stronger than average anticyclonic circulation over the Australian continent was consistent with the positive pressure anomalies over the region. Weak negative pressure anomalies were present in the tropical Indian Ocean. Vector wind analyses and anomalies at the 850 hPa and 200 hPa levels are shown in Figs. 6 and 7 respectively.
Table 1. Monthly values of Troup’s SOI for the period January 2008 to October 2010.
Year Jan Feb Mar Apr May Jun Jul Aug Sep Oct Nov Dec
2008 +14 +21 +12 +4 -4 +5 +2 +9 +14 +13 +17 +13
2009 +9 +15 0 +9 -5 -2 +2 -5 +4 -15 -7 -7
2010 -10 -14 -11 +15 +10 +2 +21 +19 +25 +18
Fig. 1 SOI time series for ten years to October 2010: month-ly values (bars); five-month centred mean values (red line).
SOI CALCULATIONS: December 2010 1. Darwin Mean MSL Pressure, December 2010: 1008.9 hPa
Pressure Anomaly (1933-1992 mean): -1.2 hPa
2. Tahiti Mean MSL Pressure, November 2010: 1017.3 hPa
Pressure Anomaly (1933-1992 mean): + 2.9 hPa
3. Troup's Southern Oscillation Index: + 16 (previously + 18)
5-Month Mean (centred upon September) +17 (previously +15)
4. Darwin Mean 0900 MSL Pressure, September 2010: 1015.8 hPa
-30
-20
-10
0
10
20
30
20062001 2002 2003 2004 2005 2007 2008 2009 2010
Fig. 1
Fig.2 Six-month (May-October 2010): (a) mean OLR (W m–2). 260 W m-2 and above yellow-red shading, 240 W m–2 and below blue-purple shading; (b) OLR anomaly (W m–2) > +5 W m–2 yellow-red shading and < –5 W m–2
blue-purple shading.
40N
20N
EQ
20S
40S80E 100E 120E 140E 160E 180
40N
20N
EQ
20S
40S80E 100E 120E 140E 160E 180
(a)
(b)
Fig. 2
Shaik and Lisonbee: The tropical circulation May to October 2010 55
Fig. 3 Monthly mean OLR (W m–2). 260 W m–2 and above yellow-red shading, 240 W m–2 and below blue-purple shading: (a) May 2010; (b) June 2010; (c) July 2010; (d) August 2010; (e) September 2010; and (f) October 2010.
40N
20N
EQ
20S
40S80E 100E 120E 140E 160E 180
40N
20N
EQ
20S
40S80E 100E 120E 140E 160E 180
40N
20N
EQ
20S
40S80E 100E 120E 140E 160E 180
40N
20N
EQ
20S
40S80E 100E 120E 140E 160E 180
40N
20N
EQ
20S
40S80E 100E 120E 140E 160E 180
40N
20N
EQ
20S
40S80E 100E 120E 140E 160E 180
(a)
(b)
(c)
(d)
(e)
(f)
340
320
300
280
240
260
220
200
180
120
140
160
Fig. 3
56 Australian Meteorological and Oceanographic Journal 61:1 March 2011
Fig. 4 Monthly OLR anomaly (W m–2). > +5 W m–2 yellow-red shading, < -5 W m–2 blue-purple shading: (a) May 2010; (b) June 2010; (c) July 2010; (d) August 2010; (e) September 2010; and (f) October 2010.
40N
20N
EQ
20S
40S80E 100E 120E 140E 160E 180
40N
20N
EQ
20S
40S80E 100E 120E 140E 160E 180
40N
20N
EQ
20S
40S80E 100E 120E 140E 160E 180
40N
20N
EQ
20S
40S80E 100E 120E 140E 160E 180
40N
20N
EQ
20S
40S80E 100E 120E 140E 160E 180
40N
20N
EQ
20S
40S80E 100E 120E 140E 160E 180
(a)
(b)
(c)
(d)
(e)
(f)
65 50 35 20 5 -5 -20
-35
-50
-65
Fig. 4
Shaik and Lisonbee: The tropical circulation May to October 2010 57
Fig. 6 Six-month 850 hPa vector wind field, 1 May to 31 October 2010, isotach (thin lines) interval 5 m s–1, > 5 m s–1 shaded yellow: (a) mean; and (b) anomaly.
Fig. 5 Six-month MSL pressure (hPa), May to October 2010: (a) mean, isobar interval 2.5 hPa; and (b) anomaly, contour interval 1 hPa, blue-shaded areas negative, yellow-shaded areas positive.
40N
20N
EQ
20S
40S80E 100E 120E 140E 160E 180
40N
20N
EQ
20S
40S80E 100E 120E 140E 160E 180
(a)
(b)
Fig. 6
40N
20N
EQ
20S
40S80E 100E 120E 140E 160E 180
40N
20N
EQ
20S
40S80E 100E 120E 140E 160E 180
(a)
(b)
Fig. 6
40N
20N
EQ
20S
40S80E 100E 120E 140E 160E 180
40N
20N
EQ
20S
40S80E 100E 120E 140E 160E 180
(a)
(b)
Fig. 5
40N
20N
EQ
20S
40S80E 100E 120E 140E 160E 180
40N
20N
EQ
20S
40S80E 100E 120E 140E 160E 180
(a)
(b)
Fig. 5
Fig. 7 Six-month 200 hPa vector wind field, 1 May to 31 October 2010: (a) mean, isotach (thin lines) interval 10 m s–1, > 10 m s–1 shaded yellow; and (b) anomaly, isotach (thin lines) interval 5 m s–1, > 5 m s–1 shaded yellow.
40N
20N
EQ
20S
40S80E 100E 120E 140E 160E 180
40N
20N
EQ
20S
40S80E 100E 120E 140E 160E 180
(a)
(b)
40N
20N
EQ
20S
40S80E 100E 120E 140E 160E 180
40N
20N
EQ
20S
40S80E 100E 120E 140E 160E 180
(a)
(b)
58 Australian Meteorological and Oceanographic Journal 61:1 March 2011
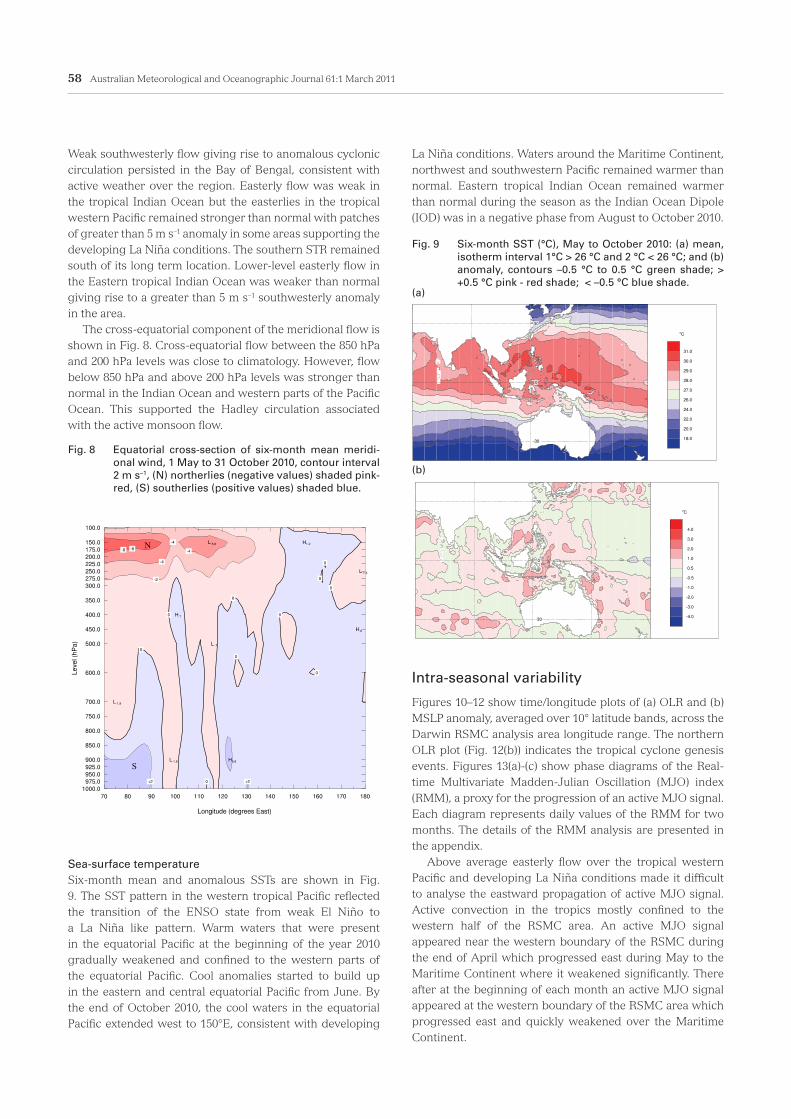
Weak southwesterly flow giving rise to anomalous cyclonic circulation persisted in the Bay of Bengal, consistent with active weather over the region. Easterly flow was weak in the tropical Indian Ocean but the easterlies in the tropical western Pacific remained stronger than normal with patches of greater than 5 m s–1 anomaly in some areas supporting the developing La Niña conditions. The southern STR remained south of its long term location. Lower-level easterly flow in the Eastern tropical Indian Ocean was weaker than normal giving rise to a greater than 5 m s–1 southwesterly anomaly in the area. The cross-equatorial component of the meridional flow is shown in Fig. 8. Cross-equatorial flow between the 850 hPa and 200 hPa levels was close to climatology. However, flow below 850 hPa and above 200 hPa levels was stronger than normal in the Indian Ocean and western parts of the Pacific Ocean. This supported the Hadley circulation associated with the active monsoon flow.
Sea-surface temperatureSix-month mean and anomalous SSTs are shown in Fig. 9. The SST pattern in the western tropical Pacific reflected the transition of the ENSO state from weak El Niño to a La Niña like pattern. Warm waters that were present in the equatorial Pacific at the beginning of the year 2010 gradually weakened and confined to the western parts of the equatorial Pacific. Cool anomalies started to build up in the eastern and central equatorial Pacific from June. By the end of October 2010, the cool waters in the equatorial Pacific extended west to 150°E, consistent with developing
La Niña conditions. Waters around the Maritime Continent, northwest and southwestern Pacific remained warmer than normal. Eastern tropical Indian Ocean remained warmer than normal during the season as the Indian Ocean Dipole (IOD) was in a negative phase from August to October 2010.
Intra-seasonal variability
Figures 10–12 show time/longitude plots of (a) OLR and (b) MSLP anomaly, averaged over 10° latitude bands, across the Darwin RSMC analysis area longitude range. The northern OLR plot (Fig. 12(b)) indicates the tropical cyclone genesis events. Figures 13(a)-(c) show phase diagrams of the Real-time Multivariate Madden-Julian Oscillation (MJO) index (RMM), a proxy for the progression of an active MJO signal. Each diagram represents daily values of the RMM for two months. The details of the RMM analysis are presented in the appendix. Above average easterly flow over the tropical western Pacific and developing La Niña conditions made it difficult to analyse the eastward propagation of active MJO signal. Active convection in the tropics mostly confined to the western half of the RSMC area. An active MJO signal appeared near the western boundary of the RSMC during the end of April which progressed east during May to the Maritime Continent where it weakened significantly. There after at the beginning of each month an active MJO signal appeared at the western boundary of the RSMC area which progressed east and quickly weakened over the Maritime Continent.
Fig. 9 Six-month SST (°C), May to October 2010: (a) mean, isotherm interval 1°C > 26 °C and 2 °C < 26 °C; and (b) anomaly, contours –0.5 °C to 0.5 °C green shade; > +0.5 °C pink - red shade; < –0.5 °C blue shade.
Fig. 8 Equatorial cross-section of six-month mean meridi-onal wind, 1 May to 31 October 2010, contour interval 2 m s–1, (N) northerlies (negative values) shaded pink-red, (S) southerlies (positive values) shaded blue.
Fig. 9
Fig. 9
N
S
(a)
(b)

Shaik and Lisonbee: The tropical circulation May to October 2010 59
Fig. 11 Time-longitude sections, latitude band 5°N–5°S (equatorial series), 1 May to 31 October 2010 of five-day backward running mean: (a) OLR (W m–2); and (b) MSLP (hPa). Units are same as in Fig. 10.
Fig.10 Time-longitude sections, latitude band 5°S–15°S (southern series), 1 May to 31 October 2010 of five-day backward running mean: (a) OLR (W m–2); and (b) MSLP (hPa) anomaly.
3.0
2.5
2.0
1.5
1.0
0.5
-0.5
-1.0
-1.5
-2.0
-2.5
-3.0
65 85 105 125 145 165 185 65 85 105 125 145 165 185
01 JUL
01 SEP
01 AUG
01 MAY
01 JUN
01 OCT
(a) (b)
340
320
300
280
260
240
220
200
180
160
140
120
Degrees east longitude Degrees east longitudeFig. 11
3.0
2.5
2.0
1.5
1.0
0.5
-0.5
-1.0
-1.5
-2.0
-2.5
-3.0
65 85 105 125 145 165 185 65 85 105 125 145 165 185
01 JUL
01 SEP
01 AUG
01 MAY
01 JUN
01 OCT
(a) (b)
340
320
300
280
260
240
220
200
180
160
140
120
Degrees east longitude Degrees east longitudeFig. 10

60 Australian Meteorological and Oceanographic Journal 61:1 March 2011
3.0
2.5
2.0
1.5
1.0
0.5
-0.5
-1.0
-1.5
-2.0
-2.5
-3.0
65 85 105 125 145 165 185 65 85 105 125 145 165 185
01 JUL
01 SEP
01 AUG
01 MAY
01 JUN
01 OCT
340
320
300
280
260
240
220
200
180
160
140
120
Degrees east longitude Degrees east longitude
(a) (b)
X
O
XO
O
OO OO OO
OO
X
O O
Fig. 12
Fig. 12 Time-longitude sections, latitude band 5°N–15°N (northern series), 1 May to 31 October 2010 of five-day backward running mean: (a) OLR; ‘X’ denote time and longitude of TC genesis events and ‘0’ denotes genesis events outside of the latitude band; and (b) MSLP anomaly. Units are same as in Fig. 10.
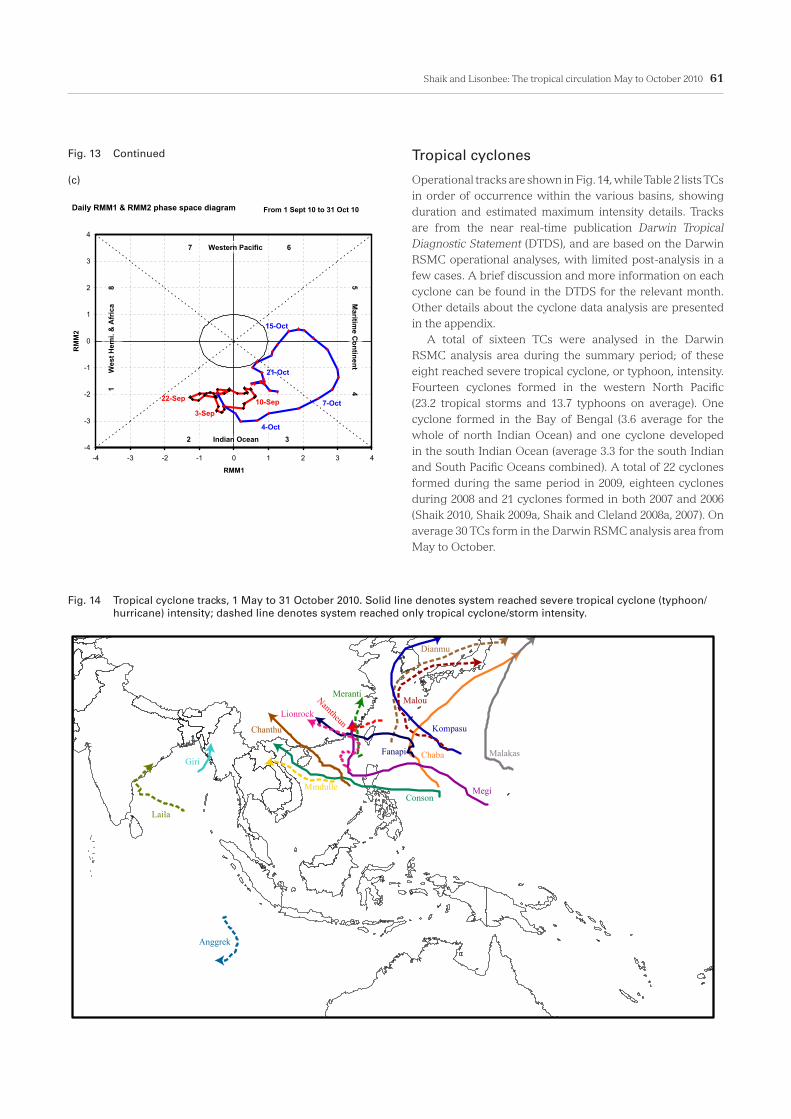
Fig. 13 Daily RMM1 and RMM2 phase space diagrams: (a) from 1 May 2010 to 30 June 2010; (b) from 1 July 2010 to 31 August 2010; and (c) from 1 September 2010 to 31 October 2010.
Daily RMM1 & RMM2 phase space diagram
-4
-3
-2
-1
0
1
2
3
4
-4 -3 -2 -1 0 1 2 3 4
RMM1
RM
M2
26-Aug
5 Maritim
e Continent 4
1
W
est H
emi.
& A
fric
a
8
From 1 July 10 to 31 Aug 10
11-Jul
2 Indian Ocean 3
7 Western Pacific 6
16-Jul25-Jul
14-Aug 22-Aug
Fig. 13 b
Daily RMM1 & RMM2 phase space diagram
-4
-3
-2
-1
0
1
2
3
4
-4 -3 -2 -1 0 1 2 3 4
RMM1
RM
M2
2 Indian Ocean 3
7 Western Pacific 6
5 Maritim
e Continent 41
Wes
t Hem
i. &
Afr
ica
8
From 1 May 10 to 30 Jun 10
6-May
1-May
27-May
3-Jun
23-May
12-May
21-Jun
18-Jun
Fig. 13 a
(a) (b)
Shaik and Lisonbee: The tropical circulation May to October 2010 61
Tropical cyclones
Operational tracks are shown in Fig. 14, while Table 2 lists TCs in order of occurrence within the various basins, showing duration and estimated maximum intensity details. Tracks are from the near real-time publication Darwin Tropical Diagnostic Statement (DTDS), and are based on the Darwin RSMC operational analyses, with limited post-analysis in a few cases. A brief discussion and more information on each cyclone can be found in the DTDS for the relevant month. Other details about the cyclone data analysis are presented in the appendix. A total of sixteen TCs were analysed in the Darwin RSMC analysis area during the summary period; of these eight reached severe tropical cyclone, or typhoon, intensity. Fourteen cyclones formed in the western North Pacific (23.2 tropical storms and 13.7 typhoons on average). One cyclone formed in the Bay of Bengal (3.6 average for the whole of north Indian Ocean) and one cyclone developed in the south Indian Ocean (average 3.3 for the south Indian and South Pacific Oceans combined). A total of 22 cyclones formed during the same period in 2009, eighteen cyclones during 2008 and 21 cyclones formed in both 2007 and 2006 (Shaik 2010, Shaik 2009a, Shaik and Cleland 2008a, 2007). On average 30 TCs form in the Darwin RSMC analysis area from May to October.
Daily RMM1 & RMM2 phase space diagram
-4
-3
-2
-1
0
1
2
3
4
-4 -3 -2 -1 0 1 2 3 4
RMM1
RM
M2
5 Maritim
e Continent 41
Wes
t Hem
i. &
Afr
ica
8
From 1 Sept 10 to 31 Oct 10
2 Indian Ocean 3
7 Western Pacific 6
10-Sep3-Sep
15-Oct
22-Sep
4-Oct
7-Oct
21-Oct
Fig 13 c
Fig. 13 Continued
(c)
Fig. 14 Tropical cyclone tracks, 1 May to 31 October 2010. Solid line denotes system reached severe tropical cyclone (typhoon/ hurricane) intensity; dashed line denotes system reached only tropical cyclone/storm intensity.
Anggrek
GiriChaba
Megi
Malakas
Malou
Fanapi
Meranti
Kompasu
Namtheun
MindulleConson
Chanthu
Laila
Dianmu
Lionrock
Fig. 14

62 Australian Meteorological and Oceanographic Journal 61:1 March 2011
Acknowledgments
Thanks are due to Dr. Philip Reid, CAWCR and ACE CRC, Hobart, for generating SST maps and Dr. Andrew Watkins of the National Climate Centre, Bureau of Meteorology, for generating OLR 6-monthly and monthly maps using data collected from the NOAA-16 satellite through the Climate Prediction Center, Maryland, USA.
Appendix
• Data Sources used in this summary include: Construction of MSLP and upper-wind seasonal charts, and MSLP time-longitude plots are based on the data from the Bureau of Meteorology’s Global Assimilation and Prediction system (GASP – Bourke et al. 1990, Bureau of Meteorology 1998); anomalies were derived from the NCEP2 climatology. Data for cross-equatorial flow
diagrams were obtained from the Bureau of Meteorology’s Tropical region eXtended Limited Area Prediction System (Puri et al 1998, Bureau of Meteorology 2005).
• The RMM index, a seasonal-independent real-time multi-variate index for monitoring the MJO was described by Wheeler and Hendon (2004). A pair of empirical orthogonal functions (EOFs) was developed using near equatorial averaged 850 hPa and 200 hPa zonal winds and satellite derived OLR. Projection of the daily-observed data onto these EOFs yields a principal component series (RMM1 and RMM2). Once the annual and interannual variability is filtered out from the series, the series reflects the intraseasonal variability covering mostly the MJO scale. The MJO signal is considered to be weak or inactive when the RMM value remains between minus one and one. The OLR data is derived from the NOAA polar-orbiting satellites and the winds are from NCEP/NCAR reanalyses data. See details at http://www.bom.gov.au/climate/mjo .
• OLR six-monthly and monthly map figures and timelongitude plots for the period May-October 2010 are derived from data generated by NOAA, Climate Prediction Center, W/NP52, Room 605, WWBG, 5200 Auth Road, Camp Springs, Maryland, 20746-4304 USA. OLR anomalies are derived using a 1979-95 climatology data-set.
• The SST analysis was derived from the operational global analysis of the National Meteorological and Oceanographic Centre, Bureau of Meteorology, Melbourne. It includes blended in situ and satellite data, 1°C resolution. The 1°x1° global SST climatology from NCEP (Reynolds and Smith 1995) was used to calculate anomalies.
• Darwin Tropical Diagnostic Statement (DTDS) (web site:http://www.bom.gov.au/climate/search/tropical-diagnostic-statement.shtml), May to October 2010 (issued monthly), and the Weekly Tropical Climate Note, (web site: http://www.bom.gov.au/ climate/tropnote/tropnote.shtml) for the period 3 May 2010 to 1 November 2010 were used for reference.
Tropical cyclonesTropical cyclones are defined as having maximum ten-minute mean winds greater than 17 m s–1, or being named systems. Operational tracks shown in Fig. 15 are from the near real-time publication Darwin Tropical Diagnostic Statement, and are based on RSMC operational analyses, with limited post-analysis in a few cases. The mean wind speed data was obtained from the Bureau of Meteorology’s TC module database, which derives data from the cyclone advisories issued by the responsible agencies. The minimum pressures were estimated using the relationship of Atkinson and Holliday (1977) adopted by the Australian TC module team. Climatological numbers are from Cooper and Falvey (2009) for the northwest Pacific and southern hemisphere and Mandal (1991) for the Bay of Bengal. A brief discussion and further details of each cyclone can be found in the DTDS for the relevant month.
Table 2. Tropical cyclones within the Darwin RSMC area May–October 2010 CS = Cyclonic Storm, TS = tropical storm, Ty = typhoon
Name Dates1 Mean wind2
ms-1 (knots)Estimated minimum
MSLP (hPa)
Bay of Bengal /North Indian Ocean
Laila (CS) 18- 21 May 28 (55) 986
South Indian Ocean
Anggrek (CS) 30 Oct – 4 Nov 26 (50) 986
South Pacific Nil
Northwest Pacific/South China Sea
Conson (Ty) 12 – 17 Jul 36 (70) 970
Chanthu (Ty) 19 – 23 Jul 36 (70) 965
Dianmu (TS)3 8 – 12 Aug 28 (55) 980
Mindulle (TS) 23 – 24 Aug 23 (45) 990
Lionrock (TS) 28 Aug – 2 Sept 26 (50) 985
Kompasu (Ty)4 29 Aug – 2 Sept 41 (80) 960
Namtheun (TS) 30 – 31 Aug 21 (40) 994
Malou (TS) 3 – 8 Sept 26 (50) 985
Meranti (TS) 9 – 10 Sept 23 (45) 990
Fanapi (Ty) 15 -20 Sept 49 (95) 935
Malakas (Ty)5 21 – 25 Sept 39 (75) 955
Megi (Ty) 13 – 23 Oct 62 (120) 885
Giri (Ty) 21 – 22 Oct 52 (100) 930
Chaba (Ty) 24 – 30 Oct 46 (90) 935
1 Dates (UTC) at TC intensity in Darwin RSMC area2 Maximum 10-min. mean wind (while in RSMC area) 3 Dianmu moved north out of the RSMC area while weakening.4 Kompasu moved north out of the RSMC boundary while weakening. 5 Malakas moved north of the RSMC area while intensifying.

Shaik and Lisonbee: The tropical circulation May to October 2010 63
ReferencesAtkinson, G.D. and Holliday, C.R. 1977. Tropical cyclone minimum sea
level pressure/maximum sustained wind relationship for the western north Pacific. Mon. Weath. Rev., 105, 421-7.
Bourke, W., Seaman, R., Embery, G., McAvaney, B., Naughton, M., Hart, T. and Rikus, L. 1990. The BMRC global assimilation and prediction system. ECMWF Seminar Series: Ten years of medium-range weather forecasting. 4-8 September 1989, 221-52.
Bureau of Meteorology 1998. Upgrade of the Global Analysis and Predic-tion (GASP) system. Analysis and Prediction Operations Bulletin No 45. Bur. Met, Australia, 16pp.
Bureau of Meteorology 2005. Operational implementation of Tropical region Extended Limited Area Prediction System -TXLAPS_PT375n. Analysis and Prediction Operations Bulletin No 59. Bur. Met., Australia. A full web version available at: http://www.bom.gov.au/nmoc/bulle-tins/nmc_bulletin.shtml.
Cooper, G.A. and Falvey, R.J. 2009. 2008 Annual Tropical Cyclone Report, US Naval Maritime Forecast Center / Joint Typhoon Warning Center, Pearl Harbor, Hawaii, USA. (A full web version is available at: http://metocph.nmci.navy.mil/jtwc/atcr/2008atcr/2008atcr.pdf).
Mandal, G.S. 1991. Tropical cyclones and their forecasting and warning systems in the Indian Ocean. Technical Document WMO/TD – No. 430 (Report No. TCP-28), WMO, Geneva, 430pp.
Puri, K., Dietachmayer, G., Mills, G.A., Davidson, N.E., Bowen, R.A. and Logan, L.W. 1998. The new BMRC Limited Area Prediction System, LAPS. Aust. Met. Mag., 47, 203 - 23.
Reynolds, R.W. and Smith, T.M. 1995. A high resolution global sea surface temperature climatology. Jnl climate, 8, 1571-83.
Shaik, A.H. 2010. The tropical circulation in the Australian/Asian region – November 2009 to April 2010. Aust. Met. Oceanogr. J., 60, 227-38.
Shaik, A.H. 2009a. The tropical circulation in the Australian/Asian region – May to October 2008. Aust. Met. Mag., 58, 49 - 62.
Shaik, H. 2009b. The tropical circulation in the Australian/Asian region – November 2008 to April 2009. Aust. Met. Mag., 58, 187 - 98.
Shaik, A.H. and Cleland, S.J. 2008a. The tropical circulation in the Austra-lian/Asian region – May to October 2007. Aust. Met. Mag., 57, 143 - 54.
Shaik, A.H. and Cleland, S.J. 2008b. The tropical circulation in the Aus-tralian/Asian region – November 2007 to April 2008. Aust. Met. Mag., 57, 367-78.
Shaik, A.H. and Cleland, S.J. 2007. The tropical circulation in the Austra-lian/Asian region – May to October 2006. Aust. Met. Mag., 56, 41 - 53.
Wheeler. M.C. and Hendon, H.H. 2004. An All-Season Real-Time Multi-variate MJO Index: Development of an Index for Monitoring and Pre-diction. Mon. Weath. Rev., 132, 1917-32.

64 Australian Meteorological and Oceanographic Journal 61:1 March 2011


![General circulation of the tropical lower stratosphere - The general circulation of the tropical lower...equatorial latitudes' [Wexler, 1951]. Berson's upper air studies over Africa](https://img.pdfslide.us/doc/110x75/5e6aa248d33ce351342ba0f2/general-circulation-of-the-tropical-lower-stratosphere-the-general-circulation.jpg)